benefits of long-term data for adaptation planning
TRANSCRIPT

Date: January 22, 2020Presented to: MN Climate Change Adaptation ConferencePresenter: Lucinda Johnson
Or: What can long-term data tell us that we wouldn’t otherwise know?
Benefits of long-term data for adaptation planning
Climate Stress
Con
ditio
n
Stress
Con
ditio
n
Quantile Regression
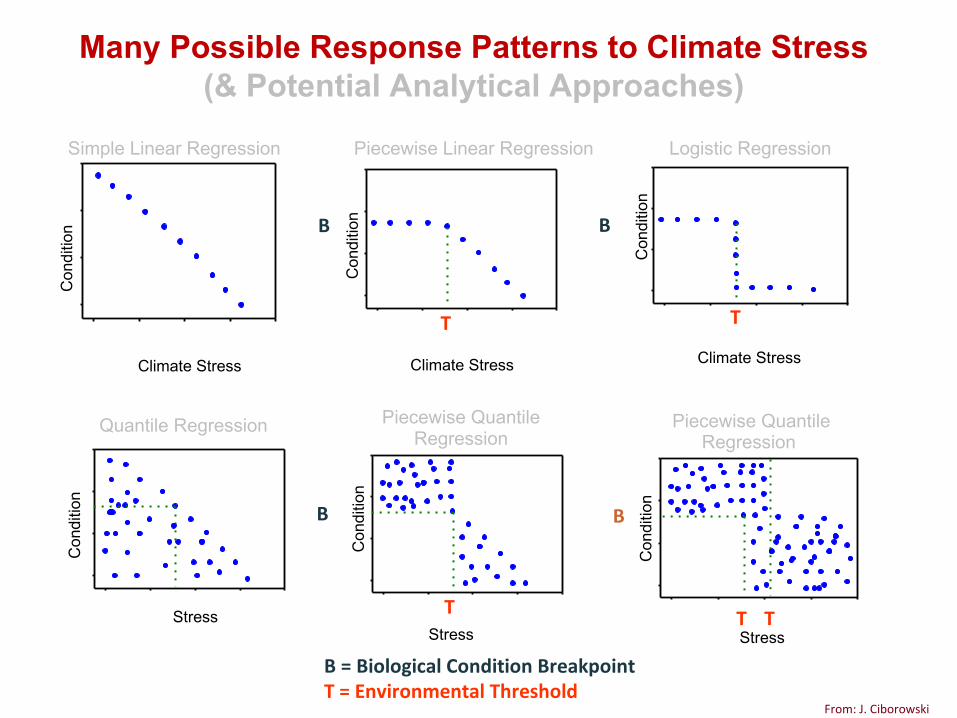
Many Possible Response Patterns to Climate Stress(& Potential Analytical Approaches)
Climate StressC
ondi
tion
T
B
Climate Stress
Con
ditio
n
T
B
Stress
Con
ditio
n
Piecewise QuantileRegression
T
B
StressC
ondi
tion
Piecewise Quantile Regression
T T
B
B = Biological Condition BreakpointT = Environmental Threshold
From: J. Ciborowski
Logistic RegressionSimple Linear Regression Piecewise Linear Regression

Lessons Learned
• 2007: Millions of data records (over 4000 lakes in the database), but overall, little overlap among data sets, e.g., only 27 lakes with both long term fish and water chemistry data. Heinz Stefan (UMN)
• 2013: “Long-term, consistent data sets are sorely needed to detect robust trends.” Lucinda Johnson (NRRI) Talk 3/27/13 to DNR Fisheries Managers

Linear & Nonlinear Trends… historic and future
- Climate - Climate Change Responses: examples
Ø Ice OutØ Water TemperatureØ Water ChemistryØ Fish Species traitsØ Fish Species Distributions
4NRRI • Innovative Research • Minnesota Value • Global Relevance • www.nrri.umn.edu

Northern MN is warming more and faster
than southern MN

Summer Temperatures: Lake Superior
From: Austin and Colman, 2006.
Water temperatures are rising faster than air
temperatures due to reduced ice cover.

Trend = 1.4 days / decadeSince 1950’s (n = 71)
Staples, et al. in prep.
Ice Out 1948 -2008
http://minnesota.publicradio.org/display/web/2013/01/25/regional/minnesota-cold-winter-photos#3
Ice out dates are earlier and
the rate of ice loss is
accelerating.

Historic Climate Regime Contrasts(summer mean water quality)
Variable n “Cold” “Hot” pEC25 (μs/cm)
39 310.8 307.9 n.s.
Thermocline depth (m)
66 5.6 m 4.8 m <0.001
Secchi depth (m)
524 2.63 2.57 0.005
Trophic State Index
537 50.34 51.3 <0.001
Chlorophyll (ug/L)
32 29.6 28.4 n.s.
Phosphorus (mg/L)
39 0.10 0.16 n.s.
(“Hot” = > 2 S.D. mean annual temp; “Cold” = < 2 S.D. mean annual temp)
Blumenfeld et al., unpublished data.
Some water quality variables are more
responsive than others to changing temperature
regimes.

Range ShiftFish Species Occurrence
1940 – 2005
K. Schneider, 2010
Some fish are more robust & adaptive than others
to changing temperature regimes.

Models
ØPredictive Models:Ø Lake temperatureØ Stream temperatureØ Brook Trout presence / absenceØ Cold water fish habitat
ØCan be used for hind casting as well as forecasting
ØCo-located data are powerful
101/28/20

Temperature: 427 sites 1996 - 2009
Brook Trout: 371 sites 1997 – 1999, 2008 - 2011
Co-located fish + temperature
n = 79within 1km distance and no tributary between sites.
From: Johnson, et al. 2013

Lessons Learned
• 2007: Millions of data records (over 4000 lakes in the database), but overall, little overlap among data sets, e.g., only 27 lakes with both long term fish and water chemistry data. Heinz Stefan (UMN)
• 2013: “Long-term, consistent data sets are sorely needed to detect robust trends.” Lucinda Johnson (NRRI)
• 2019: “Over 450 Minnesota lakes now have fish and water quality data; many of these also have plant surveys as well.” Jacquelyn Bacigalupi, (DNR)
Talk 3/27/13 to DNR Fisheries Managers

Despite Minnesota Being a Data-Rich State, Data Gaps in Aquatic Response
Studies Still Persist:
1. Groundwater maps throughout state2. Full coverage of detailed soil maps3. Detailed surficial geology maps4. Depth to bedrock5. Bedrock fracture patterns6. Hydrologic models of groundwater flow
131/28/20

Thank YouSpeaker Name(s)TitleContact Information
14
NRRI Duluth(218) 788-26945013 Miller Trunk Hwy, Duluth, MN 55811
NRRI Coleraine(218) 667-4201One Gayley Avenue, Coleraine, MN 55722
[email protected] // www.nrri.umn.edu