benchmarking the efficiency of coarse resolution satellite images for area estimation. j. gallego,...
TRANSCRIPT

Benchmarking the efficiency of coarse resolution satellite images for area estimation.
J. Gallego, M. El Aydam – MARS AGRI4CAST
Introduction
• Area frame sampling for crop area estimation• USDA (since the 30’s)• France: TER-UTI (since the 60’s)• Italy: AGRIT (early 80’s) • Spain: ESYRCE (early 90’s)• Etc….
• Accuracy can be improved with a geographical covariate. • Regression estimator (sampling units are the so-called
segments)• Calibration estimator (points)• Small area estimators
Introduction (2)
• Usual covariates are classified medium resolution classified images. • Resolution 10-60 m, • Swath 60-400 km. • 1-5 images per year
• But anything can be a covariate. Main conditions: • More or less exhaustive knowledge (there is always some
missing data)• Same quality in the sample and outside the sample• Good correlation with the target variable (crop area)
Regression estimator for crop area
• Several pilot and semi-operational applications in the EU
• Difficult to reach cost-efficiency thresholds• In the 90’s it worked but was not cost-efficient in the EU• Operational and cost-efficient in the USDA• Other countries????
Regression estimator for crop area. Possible images
• Landsat TM • 30m resolution (fields can be usually recognised)• Free• Technical problems at the moment• Complicated to deal with different images
• Coarse resolution (VEGETATION, MODIS)• Fields not recognizable• Time series complicated to produce• But they are anyhow produced for yield
forecastingQuickly
• Free

Coarse resolution images for crop area estimation
• A few journal papers and many reports for institutional customers
• Usually • Crop area directly estimated from (fuzzy) classification
Subjectivity margin disregarded
• Validation criterion: correlation classified area with official statistics by administrative area.
r=0.8 the method is good
Aims of the paper
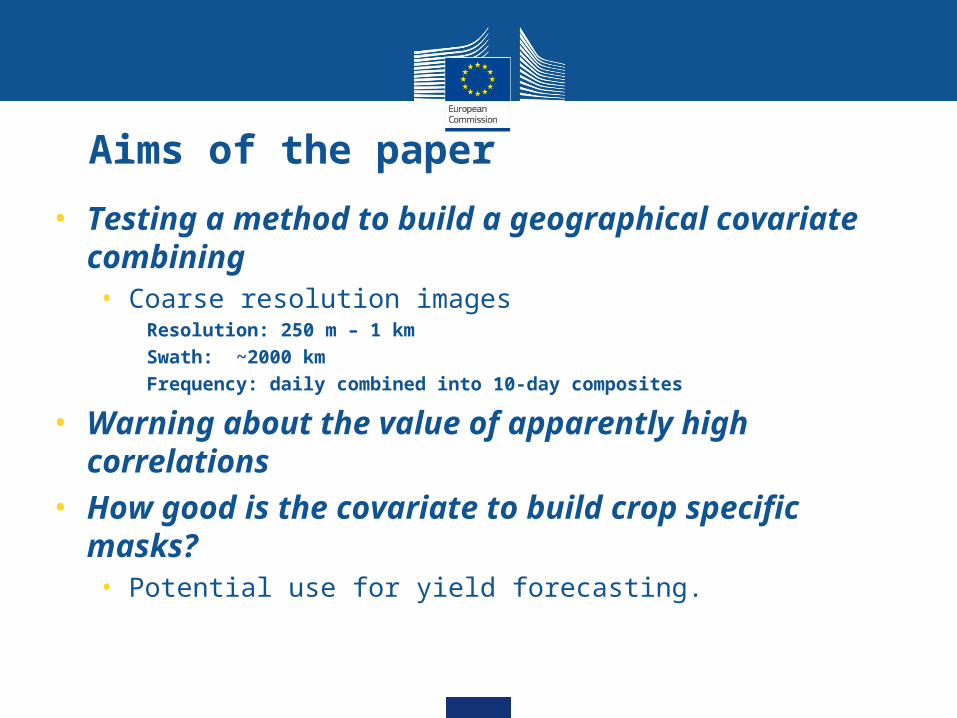
• Testing a method to build a geographical covariate combining• Coarse resolution images
Resolution: 250 m – 1 km Swath: ~2000 km Frequency: daily combined into 10-day composites
• Warning about the value of apparently high correlations
• How good is the covariate to build crop specific masks?• Potential use for yield forecasting.

Additional condition
• The method should be simple enough to be applied with basic knowledge on• Image Analysis • GIS• Statistical software

Test area and data• Andalucia: 87.000 km2. Year 2006• Subjective estimates from local experts at
commune level • ~ 780 communes• Generally biased
• ESYRCE: Area frame survey with a sample of 1800 geo-referenced segments of 49 ha
• SPOT-VEGETATION images (1 km resolution):• Vegetation index every 10 days.
• MODIS images (250 m resolution)• Vegetation index every 10 days.
• CORINE Land Cover 2000: generic land cover map
Analysis scheme
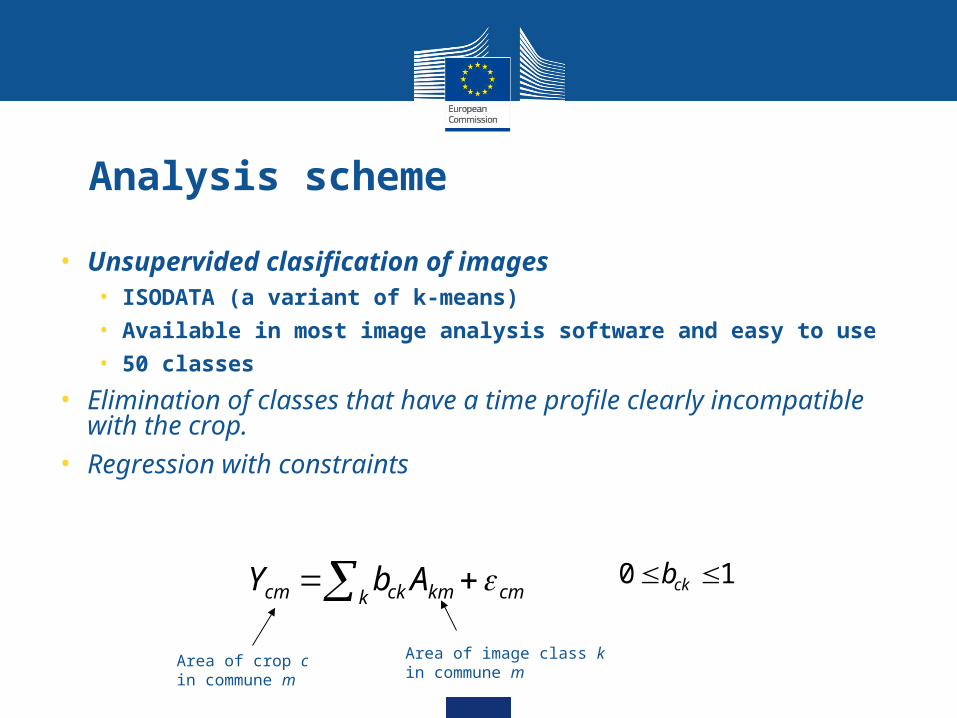
• Unsupervided clasification of images• ISODATA (a variant of k-means)• Available in most image analysis software and easy to use• 50 classes
• Elimination of classes that have a time profile clearly incompatible with the crop.
• Regression with constraints
10 ckb k cmkmckcm AbY
Area of crop c in commune m
Area of image class k in commune m

Covariate
• For crop c, a pixel in class k has a value bck
• It can be modified with the so-called Pycnophylactic constraint • The total of bck in the commune should be equal to Ycm
• b’ckm is the result of downscaling Ycm
k kmck
cmckckm Ab
Ybb

Benchmarking covariate
• CORINE Land Cover 2000• Old • Generic (no crop specific)
Non irrigated arable landIrrigated arable landRiceHeterogenous (4 classes)
• Coarse resolution (although not as much as our images) • Likely to be a poor covariate
• Anything weaker than CLC2000 has a limited interest

Estimated rate of rainfed wheat

r2 at the level of the commune
Crop CLC2000…
VGT-classification
Wheat 0.93 0.97
Barley 0.33. 0.57
Cotton 0.65 0.91
Maiz 0.50 0.47.
Sunflower 0.72 0.72
Rice 0.99 0.97
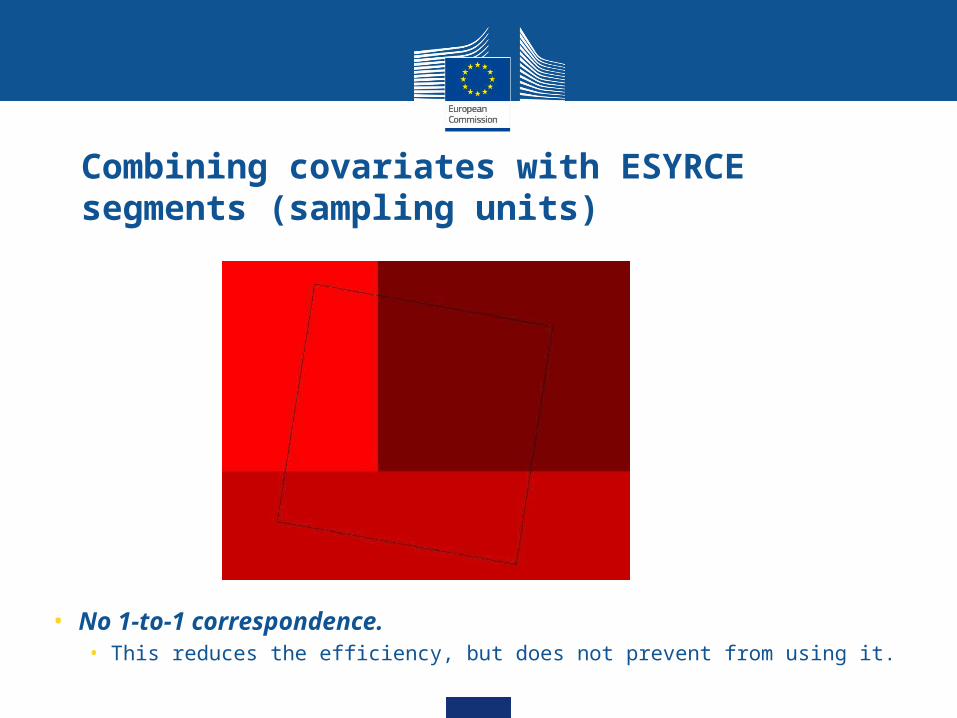
Combining covariates with ESYRCE segments (sampling units)
• No 1-to-1 correspondence. • This reduces the efficiency, but does not prevent from using it.
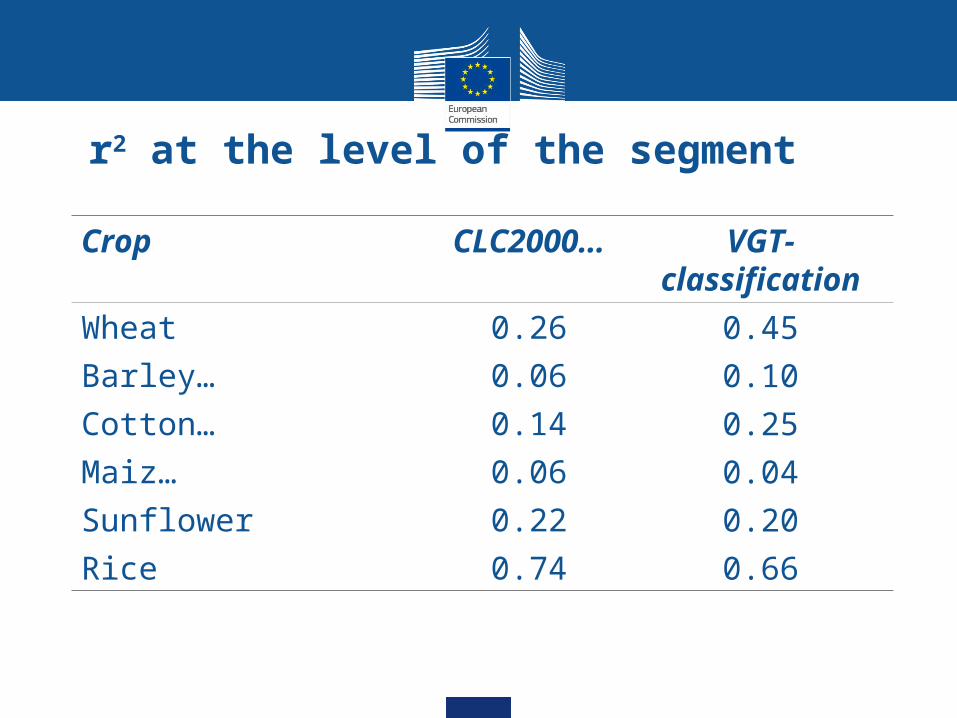
r2 at the level of the segment
Crop CLC2000…
VGT-classification
Wheat 0.26 0.45
Barley… 0.06 0.10
Cotton… 0.14 0.25
Maiz… 0.06 0.04
Sunflower 0.22 0.20
Rice 0.74 0.66

Conclusions and way forward
• Correlations on administrative units may be very misleading
• Correlations on sampling units are modest, but still worth
• MODIS images (250 m resolution): first tests show weaker r2 than VEGETATION (surprising…)
• Combining classified images with administrative data seems to give added value • Still to be quantified
• What happens if we use only the images until July, for example?