benchmarking proposal
TRANSCRIPT
Home Retail Group

Methodology Supply Chain Council SCOR and SCORmark Supply Chain Operational Reference model

Widely Used ByA small example
Science Applications International
Whirlpool Corporation Volvo United Technologies United Parcel Service United Defence Industries Unisys Corporation Unilever Toshiba Corporation TMP Worldwide, Inc. The Walt Disney Company The Home Depot, Inc. Textron Inc. Teradyne, Inc. Target Corporation Sun Microsystems, Inc. SPX Corporation Sprint Communications Sony Sonoco Products Company Snap-On Incorporated Siemens Corporation Shell Schering-Plough SAP AG
Quantum PSS World Medical, Inc. Progress Energy, Inc. PPG Industries, Inc. Pioneer Philips Pharmacia Corporation Pfizer Inc. PepsiCo, Inc. PeopleSoft, Inc. Owens Corning Oracle Corporation Northrop Grumman Nortel Networks NCR Japan, Ltd. National Semiconductor Nabisco, Inc. Millennium Chemicals Inc. Microsoft Corporation Merck & Co., Inc. Medtronic, Inc. MeadWestvaco Corporation McKesson Corporation Lucent Technologies LSI Logic Corporation
C.R. Bard, Inc. Brown-Forman Boeing Becton Dickinson Bayer AG Bausch & Lomb Banta Global Turnkey Avnet, Inc. ArvinMeritor, Inc. Arrow Electronics, Inc American Greetings Corp. American Electric Power AMD Amazon.com Air Products & Chemicals Agilent Technologies Inc. Abbott Laboratories 3M
Lockheed Martin Corporation Lockheed Martin Lennox International, Inc. KPMG Consulting, Inc. Johnson & Johnson International Paper Company Intel Corporation IBM Corp. Ryder Rockwell International 3M Honeywell International Inc. Hewlett-Packard Company Hershey Foods Corporation Genzyme Corporation General Motors Corporation GE FedEx Exxon Mobil Corporation Entergy Corporation Eastman Kodak Company Dow Chemical Cytec Industries Colgate Palmolive Co. Coca-Cola Company Cisco Systems, Inc. Canon

Assumptions

Basic Steps in Benchmarking

Benchmark strategy We use a tool called the SUPPLY CHAIN STRATEGY
MATRIX to identify priority strategic features or attributes of supply-chains
Each supply chain is indicated by a collection of ranked key attributes
Reliability Responsiveness Flexibility Cost Assets

Benchmark Strategy cont. The system allows for:
1 x “Superior” (S) feature 2 x “Advantage” (A) features 2 x “Parity” (P) features
As targets
Superior = performance in the top 10% of all supply chains studied
Advantage = performance at the midpoint between the top 10% and the median of all supply chains studied
Parity = the median of all supply chainsstudied
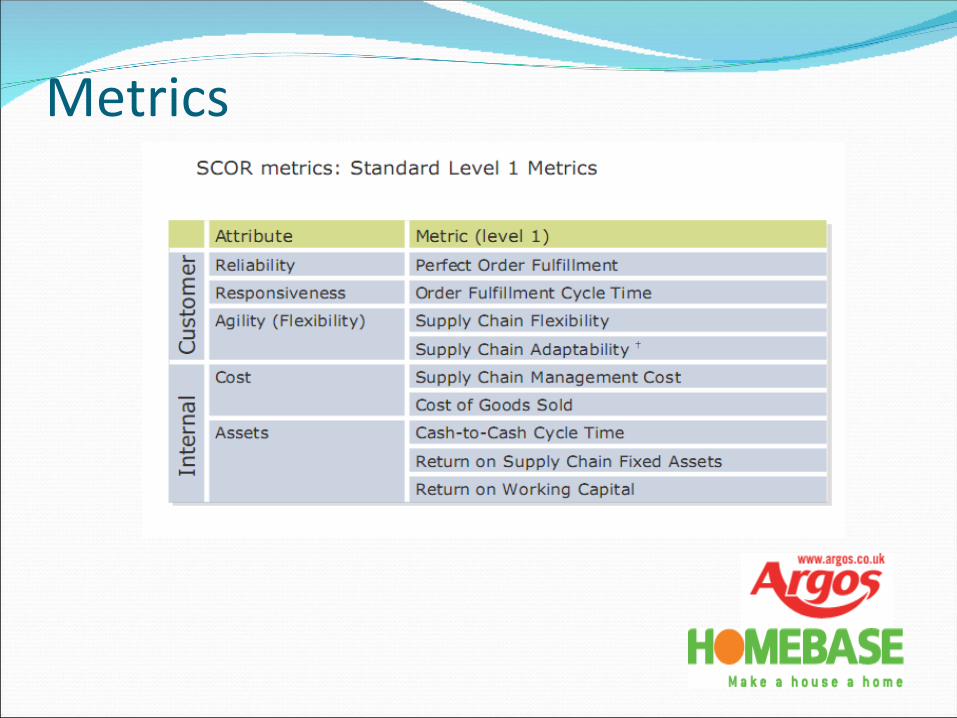
Metrics
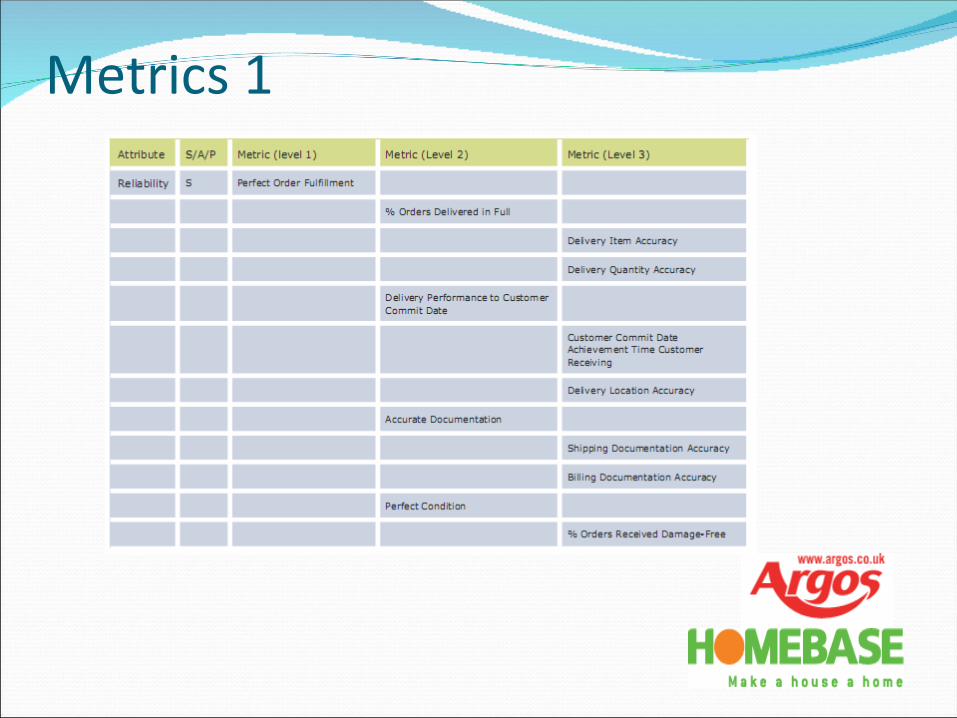
Metrics 1

Metrics 2
Sources of data Financial Data
Company annual reports, Cost Centre reports
Non Financial Data Customers
Delivery performance Total Cycle-time Performance
IT Systems Process to Process transactions Planning system parameters (Lead Times)
Suppliers 3PL providers Competitors

SCORmark
Once the SCORcard is defined, and the data for most metrics are gathered
Data is submitted electronically to the system An electronic report is returned with the results of
comparison against selected demographic groups The principle function of the Benchmark is to determine
the gap between actual performance and performance corresponding to desired strategic positioning
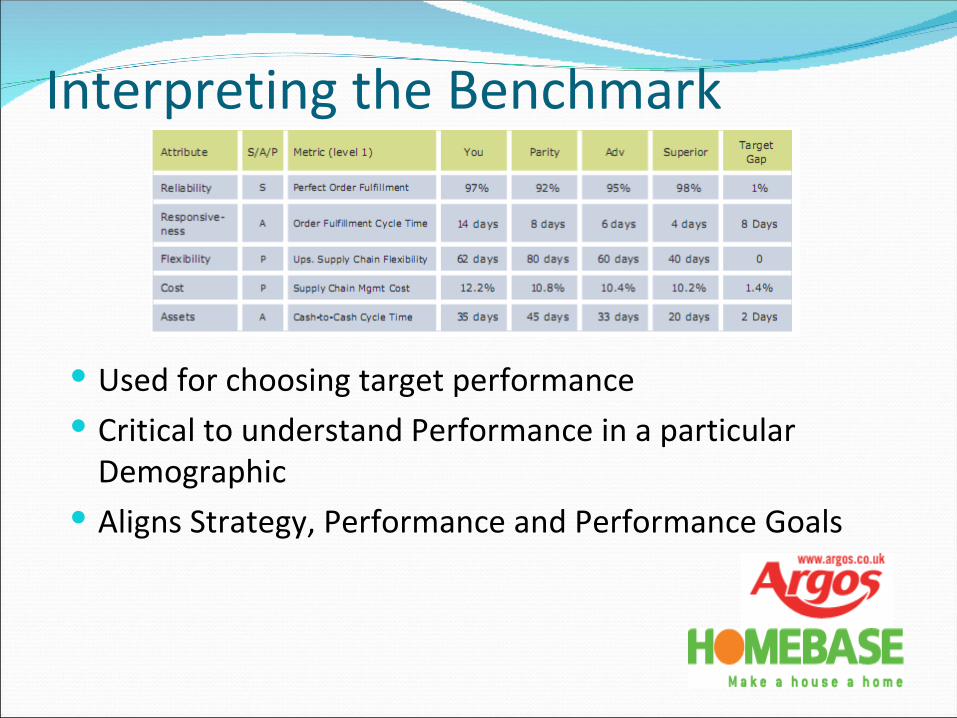
Interpreting the Benchmark
Used for choosing target performance Critical to understand Performance in a particular
Demographic Aligns Strategy, Performance and Performance Goals