benchmarking plug-load densities for k-12 … · · 2011-10-17benchmarking plug-load densities is...
TRANSCRIPT

BENCHMARKING PLUG-LOAD DENSITIES FOR K-12 SCHOOLS 1
2
Ravi S. Srinivasan1, Jaya Lakshmanan
2, Deepak Srivastav
2, Eddy Santosa
3 3
4 1M.E. Rinker, Sr. School of Building Construction, University of Florida, Gainesville FL 5
2SILPA Research, Radnor PA 6
3HMC ArchLab, HMC Architects, Ontario CA 7
8
9
10
ABSTRACT
Eighteen K-12 schools including 9 elementary, 2
middle, and 7 high schools are assessed for actual
plug-load densities. Using case study buildings,
benchmark plug-load densities for K-12 schools
under two new categories - classrooms with and
without computers were established. For the same
case study buildings, four existing approaches -
NREL, COMNET, ASHRAE 90.1-1989, and
California Title-24 are evaluated for plug-load
densities. Results show under- and over-estimation of
plug-load densities over actual densities. The
development of benchmark for K-12 schools –
classrooms with and without computers - will pave
way for instituting targets for trimming plug-load
densities in new and retrofit building projects.
INTRODUCTION
Benchmarking plug-load densities is essential to
bypass arbitrary and/or incorrect inputs used in
building energy analysis. It is necessary for building
energy standards and rating systems to implement
plug-load density benchmarks to reward design
teams in their efforts to reduce plug-load energy use.
Among others, building energy analysis is conducted
to show compliance for US Green Building Council’s
LEED™ rating system (USGBC, 2011). As more
building simulationists play a decision-making role
for the design team, they tend to lean on building
energy standards and guidelines for preliminary
inputs such as plug-load densities. LEED™
advocates ASHRAE Standard 90.1-2007 User
Manual’s (ASHRAE 90.1-UM, 2007) recommended
receptacle densities originally adopted from
ASHRAE Standard 90.1-1989 (ASHRAE 90.1,
1989). Based on this, recommended plug-load
densities for K-12 school buildings is 5.38W/m2.
This density value has been a challenge for early
design decision-making, as it does not relate to
today’s technology intensive receptacle requirements.
These are largely under-estimated values given
today’s usage patterns of computers and other
electronic equipment such as classroom computers,
projectors, smartboards, surround sound systems, etc.
This discrepancy may lead to unrealistic
determination of energy use savings. Moreover, in K-
12 schools, technological advancements in teaching
methodology present an opportunity to “right-size”
equipment through conscious decision-making.
Specialized curriculum- driven schools such as
“science schools,” etc., use far more energy to run
computing applications as compared to typical
schools offering greater prospects for optimal design.
Yet, plug-load density benchmarks for K-12 school
buildings that incorporate technological
advancements in classroom and teaching
methodology is non-existent.
For benchmarking, plug-load densities may be
calculated. Equipment nominal power data and
diversity factors are used to calculate plug-load
densities for energy analysis. Equipment nominal
power and nameplate rating considerably differs
during typical operation. Nominal power may be
determined through monitoring average power
drawn; the ratio of this average power drawn to
nameplate rating is the load factor (Wilkins et al.,
1991). However, not all equipment peaks at the same
time to the building’s peak load. For example,
portions of equipment may be in idle mode. The
probability of actual to estimated operation is its
diversity factor. Only a few building energy
standards, guidelines, and technical reports discuss
either plug-load densities explicitly or a methodology
to compute the same. Few noteworthy literatures are
listed below:
ASHRAE 90.1-1989.
California Energy Commission (CAC) Report on
office plug-load field monitoring (Moorefield et
al., 2008) National Renewable Energy
Laboratory’s (NREL) Technical Report on
methodology for modelling building energy
performance across the commercial sector
(Griffith et al., 2008).
ASHRAE Handbook – Fundamentals, Chapter
18, Nonresidential Cooling and Heating Load
Calculations (ASHRAE Handbook, 2009).
California Title 24 Standard (Title 24, 2008).
US Department of Energy’s Buildings Energy
Data Book (BEDB, 2011).
Commercial Energy Services Network
(COMNET) Guidelines (COMNET, 2011).
Advanced Energy Design Guide (AEDG) for K-
12 Schools (Pless et al., 2007).
Proceedings of Building Simulation 2011: 12th Conference of International Building Performance Simulation Association, Sydney, 14-16 November.
- 2746 -
Additional research work related to office and K-12
school building types is listed in Table 1. For the
same building project, applying plug-load densities
derived from the approaches listed above may result
in different plug-load energy use. This may pose
dilemma for early design decision-making especially
when it is crucial to “right-size” the equipment.
Issues related to under- or over-sizing is well
documented (Wilkins et al., 1991; Komor,
1997).Using case study buildings, this paper
establishes benchmark plug-load densities for K-12
schools under two new categories - classrooms with
computers and classrooms without computers.
Eighteen K-12 schools including 9 elementary, 2
middle, and 7 high schools are assessed for actual
plug-load densities. For the same case study
buildings, four existing approaches - NREL,
COMNET, ASHRAE 90.1-1989, and Title-24 are
evaluated for plug-load densities. Results show
under- and over-estimation of plug-load densities
over actual densities. The development of benchmark
for K-12 schools will pave way for instituting targets
for trimming down plug-load densities in new and
retrofit building projects.
Table 1. Additional literature on plug-loads.
Literature Data Description
Wilkins and
McGaffin,
1994
Load
Factor
Modes
Desktops, monitors, and
other office equipment.
Peak and idle modes.
Komor,P.,
1997
Plug-load
Density
Office equipment.
Kawamoto et
al., 2000
Peak Office and network
equipment.
Roth et al.,
2002
Mean
Nominal
Peak
Desktops, monitors, and
other office equipment.
Moorefield et
al., 2008
Average
Modes
Computers, monitors, and
other office equipment.
Active, idle, sleep and
standby modes.
Hosni and
Beck, 2008
Average Computers, monitors, and
other office equipment.
Penn, 2011 Approx.
Modes
Desktops and laptops.
Off, boot, moderate use,
quiescent, and sleep modes.
Wilkins and
Hosni, 2011
Load
Factor
Diversity
Factor
Desktop and laptop.
Desktop, laptop, and LCD
monitor.
ASSESSMENT OF K-12 SCHOOLS
For this study, eighteen K-12 schools in California
are assessed for evaluating plug-load densities. The
assessment is carried out in six steps (Srinivasan et
al., 2011):
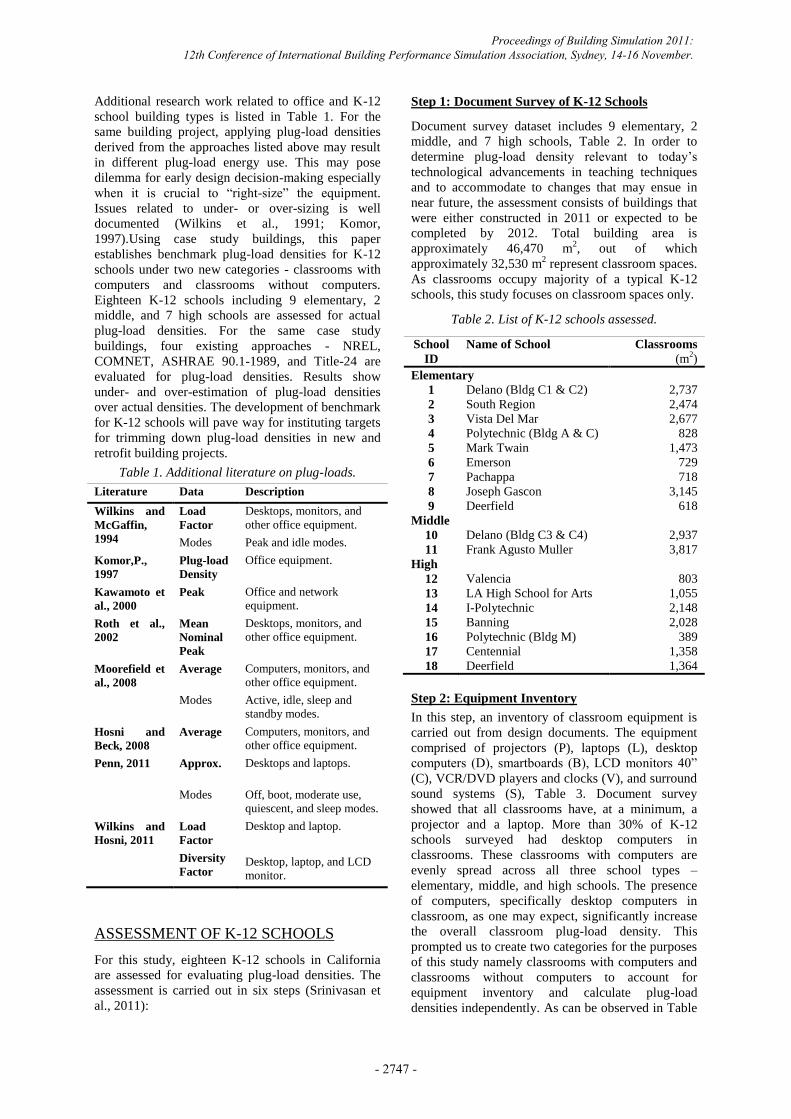
Step 1: Document Survey of K-12 Schools
Document survey dataset includes 9 elementary, 2
middle, and 7 high schools, Table 2. In order to
determine plug-load density relevant to today’s
technological advancements in teaching techniques
and to accommodate to changes that may ensue in
near future, the assessment consists of buildings that
were either constructed in 2011 or expected to be
completed by 2012. Total building area is
approximately 46,470 m2, out of which
approximately 32,530 m2 represent classroom spaces.
As classrooms occupy majority of a typical K-12
schools, this study focuses on classroom spaces only.
Table 2. List of K-12 schools assessed.
School
ID
Name of School Classrooms
(m2)
Elementary
1 Delano (Bldg C1 & C2) 2,737
2 South Region 2,474
3 Vista Del Mar 2,677
4 Polytechnic (Bldg A & C) 828
5 Mark Twain 1,473
6 Emerson 729
7 Pachappa 718
8 Joseph Gascon 3,145
9 Deerfield 618
Middle
10 Delano (Bldg C3 & C4) 2,937
11 Frank Agusto Muller 3,817
High
12 Valencia 803
13 LA High School for Arts 1,055
14 I-Polytechnic 2,148
15 Banning 2,028
16 Polytechnic (Bldg M) 389
17 Centennial 1,358
18 Deerfield 1,364
Step 2: Equipment Inventory
In this step, an inventory of classroom equipment is
carried out from design documents. The equipment
comprised of projectors (P), laptops (L), desktop
computers (D), smartboards (B), LCD monitors 40”
(C), VCR/DVD players and clocks (V), and surround
sound systems (S), Table 3. Document survey
showed that all classrooms have, at a minimum, a
projector and a laptop. More than 30% of K-12
schools surveyed had desktop computers in
classrooms. These classrooms with computers are
evenly spread across all three school types –
elementary, middle, and high schools. The presence
of computers, specifically desktop computers in
classroom, as one may expect, significantly increase
the overall classroom plug-load density. This
prompted us to create two categories for the purposes
of this study namely classrooms with computers and
classrooms without computers to account for
equipment inventory and calculate plug-load
densities independently. As can be observed in Table
Proceedings of Building Simulation 2011: 12th Conference of International Building Performance Simulation Association, Sydney, 14-16 November.
- 2747 -
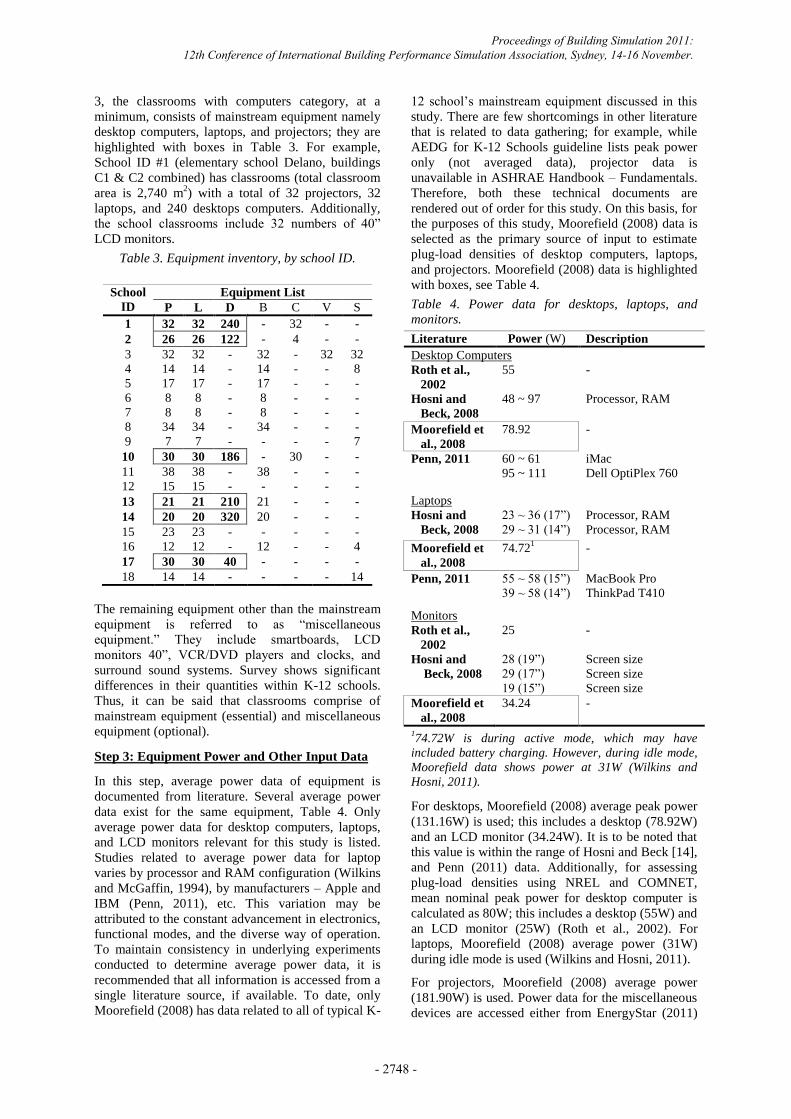
3, the classrooms with computers category, at a
minimum, consists of mainstream equipment namely
desktop computers, laptops, and projectors; they are
highlighted with boxes in Table 3. For example,
School ID #1 (elementary school Delano, buildings
C1 & C2 combined) has classrooms (total classroom
area is 2,740 m2) with a total of 32 projectors, 32
laptops, and 240 desktops computers. Additionally,
the school classrooms include 32 numbers of 40”
LCD monitors.
Table 3. Equipment inventory, by school ID.
School
ID
Equipment List
P L D B C V S
1 32 32 240 - 32 - -
2 26 26 122 - 4 - -
3 32 32 - 32 - 32 32
4 14 14 - 14 - - 8
5 17 17 - 17 - - -
6 8 8 - 8 - - -
7 8 8 - 8 - - -
8 34 34 - 34 - - -
9 7 7 - - - - 7
10 30 30 186 - 30 - -
11 38 38 - 38 - - -
12 15 15 - - - - -
13 21 21 210 21 - - -
14 20 20 320 20 - - -
15 23 23 - - - - -
16 12 12 - 12 - - 4
17 30 30 40 - - - -
18 14 14 - - - - 14
The remaining equipment other than the mainstream
equipment is referred to as “miscellaneous
equipment.” They include smartboards, LCD
monitors 40”, VCR/DVD players and clocks, and
surround sound systems. Survey shows significant
differences in their quantities within K-12 schools.
Thus, it can be said that classrooms comprise of
mainstream equipment (essential) and miscellaneous
equipment (optional).
Step 3: Equipment Power and Other Input Data
In this step, average power data of equipment is
documented from literature. Several average power
data exist for the same equipment, Table 4. Only
average power data for desktop computers, laptops,
and LCD monitors relevant for this study is listed.
Studies related to average power data for laptop
varies by processor and RAM configuration (Wilkins
and McGaffin, 1994), by manufacturers – Apple and
IBM (Penn, 2011), etc. This variation may be
attributed to the constant advancement in electronics,
functional modes, and the diverse way of operation.
To maintain consistency in underlying experiments
conducted to determine average power data, it is
recommended that all information is accessed from a
single literature source, if available. To date, only
Moorefield (2008) has data related to all of typical K-
12 school’s mainstream equipment discussed in this
study. There are few shortcomings in other literature
that is related to data gathering; for example, while
AEDG for K-12 Schools guideline lists peak power
only (not averaged data), projector data is
unavailable in ASHRAE Handbook – Fundamentals.
Therefore, both these technical documents are
rendered out of order for this study. On this basis, for
the purposes of this study, Moorefield (2008) data is
selected as the primary source of input to estimate
plug-load densities of desktop computers, laptops,
and projectors. Moorefield (2008) data is highlighted
with boxes, see Table 4.
Table 4. Power data for desktops, laptops, and
monitors.
Literature Power (W) Description
Desktop Computers
Roth et al.,
2002
55 -
Hosni and
Beck, 2008
48 ~ 97 Processor, RAM
Moorefield et
al., 2008
78.92 -
Penn, 2011 60 ~ 61
95 ~ 111
iMac
Dell OptiPlex 760
Laptops
Hosni and
Beck, 2008
23 ~ 36 (17”)
29 ~ 31 (14”)
Processor, RAM
Processor, RAM
Moorefield et
al., 2008
74.721 -
Penn, 2011 55 ~ 58 (15”)
39 ~ 58 (14”)
MacBook Pro
ThinkPad T410
Monitors
Roth et al.,
2002
25 -
Hosni and
Beck, 2008
28 (19”)
29 (17”)
19 (15”)
Screen size
Screen size
Screen size
Moorefield et
al., 2008
34.24 -
174.72W is during active mode, which may have
included battery charging. However, during idle mode,
Moorefield data shows power at 31W (Wilkins and
Hosni, 2011).
For desktops, Moorefield (2008) average peak power
(131.16W) is used; this includes a desktop (78.92W)
and an LCD monitor (34.24W). It is to be noted that
this value is within the range of Hosni and Beck [14],
and Penn (2011) data. Additionally, for assessing
plug-load densities using NREL and COMNET,
mean nominal peak power for desktop computer is
calculated as 80W; this includes a desktop (55W) and
an LCD monitor (25W) (Roth et al., 2002). For
laptops, Moorefield (2008) average power (31W)
during idle mode is used (Wilkins and Hosni, 2011).
For projectors, Moorefield (2008) average power
(181.90W) is used. Power data for the miscellaneous
devices are accessed either from EnergyStar (2011)
Proceedings of Building Simulation 2011: 12th Conference of International Building Performance Simulation Association, Sydney, 14-16 November.
- 2748 -

or Moorefield (2008). Diversity factor for K-12
schools used for this study is 0.77 (COMNET, 2011).
This value, extracted from COMNET, is based on
expert opinion. Caution need to be exercised while
using the plug-load densities derived for K-12
schools owing to the diversity factor used in this
method.
Step 4: Benchmark Evaluation
The computed plug-load density is compared with
four existing approaches:
I. NREL Report
II. COMNET Guidelines
III. ASHRAE 90.1-1989
IV. TITLE-24
The Building Energy Data Book guidelines is not
used for comparative analysis as the plug-load
densities prescribed in this guideline for K-12
schools (8.61W/m2) is within the range of ASHRAE
90.1-1989 (5.38W/m2) and TITLE-24 (10.76W/m
2).
For similar reasons, the AEDG for K-12 schools
guideline is also not included in this assessment.
Table 5 shows the relevant inputs used for each of
the approaches, denoted by “x” symbol. Power data
for mainstream equipment applicable to classrooms
such as desktop computers, laptops, and projectors
are shown with boxes.
Table 5. Power data used for assessment.
Ref Power
(W)
Plug-load Density Approach
Input
Used in
this
Paper
I II III IV
P 181.901 x - - - -
L 31.001 x - - - -
D 113.161
80.002
x
-
-
x
-
x
-
-
-
-
B 5.003 x - - - -
C 140.694 x - - - -
V 9.665 x - - - -
S 20.006 x - - - -
1 Moorefield et al., 2008.
2 Roth et al., 2002.
3 Estimated; typical smartboard (without projector)
peak ranges between 1.5W and 7W (Smarttech,
2011). 4 ViewSonic LCD monitor 46”, model:
CD4636/VS13512 (EnergyStar, 2011). 5 Includes VCR/DVD and clock (8.26W and 1.40W
respectively), Moorefield et al., 2008. 6 FrontRow 5301R Lasso Infrared Wireless
Receiver/Amplifier (EnergyStar, 2011).
Since equipment quantities are available, Method 2 is
used for NREL and COMNET approaches. Table 6
lists the inputs related to scale coefficients, assumed
power densities for independent devices, and
diversity factors used in plug-load density
calculation.
Table 6. Inputs used for assessment.
Approach Csd PDmisc
(W/m2)
d P
(W/m2)
I 2.00 1.61 1.00 Calculated
II 2.00 2.04 1.60 Calculated
III N/A N/A N/A 5.38
IV N/A N/A N/A 10.76
The plug-load densities are calculated using the
equipment inventory and inputs developed in earlier
steps. Two types of plug-load densities are calculated
for– mainstream equipment (i.e., desktop computers,
laptops, and projectors) and miscellaneous equipment
(i.e., a smartboard, an LCD monitor 46”, a
VCR/DVD and a clock, and a surround sound
system). Assuming, at a minimum, one unit of each
kind of miscellaneous equipment in every classroom,
the plug-load density for these miscellaneous
equipment will remain a constant and is merely an
“add-on” to plug-load densities of mainstream
equipment derived for both categories – classrooms
with computers and classrooms without computers.
This miscellaneous plug-load density is not only a
way to account for miscellaneous equipment used in
classrooms, but also acts as an allowance to the
mainstream equipment. The allowance is in the form
of maximum allowable plug-load density of
miscellaneous equipment in addition to mainstream
equipment. Inclusion of any additional equipment
beyond the allowance may result in plug-load
densities higher than the benchmark developed in this
study. On the contrary, non-inclusion of such
miscellaneous equipment may reduce energy use
when compared with benchmark density values, thus
rewarding the design team for their efforts.
Moreover, if the design team is able to source energy
efficient equipment, both mainstream and
miscellaneous, they may be used to show energy
savings.
The calculated plug-load density is, hereto, referred
to as “benchmark.” For classrooms with and without
computers, the calculated benchmark values are
11.41W/m2 and 3.55W/m
2 respectively. The
benchmark is a bottom-up approach that used actual
equipment data from the most recent survey and
related inputs from literature. Additional site
monitoring of equipment, specific to K-12 schools,
may not supply drastically different results to
existing research literature, however, such
monitoring may potentially improve the results
further. Plug-load densities for ASHRAE 90.1-1989
(5.38W/m2) and TITLE-24 (10.76W/m
2) are identical
for all buildings under investigation. The NREL and
COMNET approaches do not provide assumed power
density data for equipment under investigation, see
table C-24 (Griffith et al., 2008).
Proceedings of Building Simulation 2011: 12th Conference of International Building Performance Simulation Association, Sydney, 14-16 November.
- 2749 -

Figures 1 and 2 show minimum, maximum
occurrence, and average plug-load density for
benchmark and the four approaches. Black square
boxes in the illustrations represent average plug-load
densities. The weighted-average plug-load densities
are compared.
For classrooms with computers category,
• TITLE-24 plug-load density (10.76W/m2) is within
range of the benchmark (11.41W/m2).
• While NREL and COMNET densities (17.00W/m2
and 13.45W/m2 respectively) are higher than the
benchmark, ASHRAE 90.1-1989 value (5.38W/m2)
is significantly lower than the benchmark. In other
words, for K-12 schools – classrooms with
computers category, using ASHRAE 90.1-1989
density value may greatly under-estimate plug-load
energy use. On the contrary, using NREL or
COMNET densities may over-estimate plug-loads
considerably.
For classrooms without computers category,
• TITLE-24 (10.76W/m2) is significantly higher than
benchmark (3.55W/m2).
• NREL and COMNET densities (1.61W/m2), and
ASHRAE-90.1-1989 (5.38W/m2), are lower than the
benchmark.
Figure1. Plug-load densities for Classrooms with
computers.
Figure 2. Plug-load densities for Classrooms without
computers.
Step 5: Benchmarking Plug-load Densities for
Classrooms with- and without- Computers.
Benchmarking plug-load density targets is
fundamental for reducing plug-load energy use in
new and retrofit building projects. Such densities
must be derived using most recent equipment
datasets and have to accommodate for future
technology expansion in classrooms. Furthermore,
with greater emphasis on math-science-technology
curriculum in K-12 schools, we believe that all K-12
schools will transition to include computers in
classrooms in near future. Based on the study, for a
typical K-12 school, suitable plug-load densities may
be derived for classrooms with computers and
classrooms without computers, see figures 3 and 4
respectively.
For K-12 schools - classrooms with computers, the
densities are based on the ratio of total classroom
area to the total number of computers used in the
classrooms. For K-12 schools – classrooms without
computers, the densities are based on the average
area of each classroom. These densities were derived
from the benchmark. As discussed, additional site
monitoring of equipment may potentially improve
the plug-load densities developed in this paper
further.
Step 6: Analyzing Energy Use
Based on changes to plug-load densities, space
cooling and heating loads may change, and this may
affect the overall energy use of the building. This
change was studied using a case study K-12 school
building in St Lucie county in the State of Florida. St.
Lucie county is climate zone 2A per ASHRAE 90.1
where space cooling dominates space heating. This
new construction building has an area of 6,177 m2
and is scheduled to be completed in 2012. The
building uses 508 PCs and 52 numbers in each of the
following equipment – projectors, VCR, and sound
devices. The school regular operation is from August
15 to June 15.
Use or utilization schedule represents the operating
behavior of all or a collection of equipment. The use
profile is a significant component of energy analysis.
For the purposes of this analysis, the use profiles
were developed based on school operation for regular
school hours between 8 AM and 2 PM. It is
noteworthy that the benchmark used estimated
operating schedules for equipment based on inputs
from the school. However, for the school break,
weekend and holiday schedule, we have assumed
from ASHRAE 90.1-1989 that equipment operates at
5%. An energy model was developed using eQUEST
fully compliant with ASHRAE 90.1-2007 Appendix
G protocols. This model was used to compare the
four approaches with the benchmark plug-load
density. Total energy use was compared under two
categories – classrooms with and without computers.
For classrooms with computers, total energy use of
the building using ASHRAE 90.1-1989 plug-load
data stayed within 5% of the benchmark when
simulated for all 8 representative climatic zones.
Similarly, NREL and COMNET remained within
15% while Title-24 stayed within 7%. For
Proceedings of Building Simulation 2011: 12th Conference of International Building Performance Simulation Association, Sydney, 14-16 November.
- 2750 -

classrooms without computers, ASHRAE 90.1-1989,
NREL and COMNET remained within 5%, while
Title-24 exhibited higher energy use values and
remained within 15% when simulated for all 8
representative climatic zones. Overall, ASHRAE
90.1-1989 plug-load densities were within 5% of the
benchmark.
CONCLUSION
Benchmarking plug-load densities is essential to
bypass arbitrary and/or incorrect inputs used in
building energy analysis. As more building
simulationists play a decision-making role for the
design team, they tend to lean on building energy
standards and guidelines for preliminary inputs such
as plug-load densities. It is necessary for building
energy standards and rating systems to implement
plug-load density benchmarks to reward design
teams in their efforts to reduce plug-load energy use.
Using case study buildings, this paper establishes
benchmark plug-load densities for K-12 schools
under two new categories - classrooms with
computers and classrooms without computers.
Eighteen K-12 schools including 9 elementary, 2
middle, and 7 high schools are assessed for actual
plug-load densities. For the same case study
buildings, four existing approaches - NREL,
COMNET, ASHRAE 90.1-1989, and Title-24 were
evaluated for plug-load densities. Results show
under- and over-estimation of plug-load densities
over benchmark densities.
Overall, ASHRAE 90.1-1989 total energy use for
schools was within 5% of the benchmark for both
categories. Even though classroom technology has
increased significantly over the past few decades,
equipment energy efficiency has equally improved
which could have paved way for the ASHRAE 90.1-
1989 energy use to stay relevant to today’s
classrooms. Title-24 performed well for classrooms
with computers however, over-estimated for
classrooms without computers category. While
NREL and COMNET performed well for classrooms
without computers, they missed the mark for
classrooms with computers.
REFERENCES
ASHRAE 90.1-1989. 2011. ASHRAE/IESNA
Standard for Energy Efficient Design of New
Buildings Except Low-Rise Residential. Atlanta,
GA.
ASHRAE 90.1-UM. 2007. User Manual for
ASHRAE/IESNA Standard for Energy Efficient
Design of New Buildings Except Low-Rise
Residential. Atlanta, GA.
ASHRAE Handbook. 2009. ASHRAE Handbook –
Fundamentals. Atlanta, GA.
BEDB. 2011. Building’s Energy Data Book, US
Department of Energy. Washington, DC.
EnergyStar. 2011. EnergyStar Products. Accessed
online at http://energystar.gov date: Jan 15,
2011.
COMNET. 2011. Commercial Energy Services
Network. Accessed online at: http://comnet.org
date: March 21, 2011.
Griffith, B., N. Long, P. Torcellini, and R. Judkoff.
2008. “Methodology for modeling building
energy performance across the commercial
sector.” Technical report NREL/TP-550-41956,
Golden, CO.
Hosni, M.H., B.W. Jones, J.M. Sipes, and H. Xu.
1996. “Test Method for Measuring the Heat
Gain and Radiant / Convective Split from
Equipment in Buildings.” ASHRAE Final
Report for Research Project 822-RP.
Hosni, M.H., and B.T. Beck. 2008. Update to
Measurements of Office Equipment Heat Gain
Data (RP-1482). ASHRAE Research Project,
Progress Report.
Kawamota, K., J.G. Koomey, B. Nordman, R.E.
Brown, M. Ann Piettte, M. Ting, and A.K.
Meier. 2001. “Electricity used by office
equipment and network equipment in US:
Detailed report and appendices.” Lawrence
Berkeley National Laboratory.
Komor, P. 1997. Space Cooling Demands from
Office Plug-loads. ASHRAE Journal 39(12): 41-
44.
Moorefield, L., B. Frazer, and P. Bendt. 2008. Office
plug-load field monitoring report. California
Energy Commission, PIER Energy-Related
Environmental Research Program. Technical
report CEC-500-2011-010, Sacremento, CA.
Penn. 2011. Approximate Power Usage Data,
updated: Feb 15, 2011, University of
Pennsyvlania. Accessed online at
http://www.upenn.edu/computing/provider/docs/
hardware/powerusage.html date: May 5, 2011
Pless, S., P. Torcellini, and N. Long. 2007. Technical
Support Document: The Development of the
Advanced Energy Design Guide for K-12
Schools – 30% Energy Savings. NREL/TP-551-
42114, National Renewable Energy Laboratory,
Golden, CO.
Roth, K.W.; Goldstein, F.; Kleinman, J. (2002).
Energy Consumption by Office and
Telecommunications Equipment in Commercial
Buildings. Volume I: Energy Consumption
Baseline. Cambridge, MA: Arthur D. Little, Inc.
Smarttech. 2011. SMART White Board System.
Accessed online at
http://www2.smarttech.com/kbdoc/74231 date:
March 20, 2011.
Proceedings of Building Simulation 2011: 12th Conference of International Building Performance Simulation Association, Sydney, 14-16 November.
- 2751 -

Srinivasan, R.S., J. Lakshmanan, E. Santosa, and D.
Srivastav (2011). “Plug-load Densities for
Energy Analysis: K-12 Schools.” In: Energy and
Buildings Journal.
Title 24. 2008. California’s Energy Efficiency
Standards for Residential and Nonresidential
Buildings – Title 24. Sacremento, CA.
USGBC. 2011. US Green Building Council.
Accessed online at http://usgbc.org date: March
21, 2011.
Wilkins, C.K., R. Kosonen, T. Laine. 1991. “An
analysis of office equipment load factor.” In:
ASHRAE Journal 33(9): 38-44.
Wilkins, C.K., and N. McGaffin. 1994. “Measuring
computer equipment loads in office building.”
In: ASHRAE Journal 36(8): 21-24.
Wilkins, C.K., and M.H. Hosni. 2000. “Heat gain
from office equipment.” In: ASHRAE Journal
42(6): 31-39.
Wilkins, C.K., and M.H. Hosni. 2011. Plug Load
Design Factors. In: ASHRAE Journal, May
2011.
Figure 3. Recommended plug-load density for K-12 schools – classrooms with computers.
Figure 4. Recommended plug-load density for K-12 schools – classrooms without computers.
Proceedings of Building Simulation 2011: 12th Conference of International Building Performance Simulation Association, Sydney, 14-16 November.
- 2752 -