benchmarking for knowledge exchange - … | p a g e about ip pragmatics limited ip pragmatics () is...
TRANSCRIPT

BENCHMARKING FOR
KNOWLEDGE EXCHANGE
Key areas in development of a set of
benchmarking indicators and a benchmarking
tool for higher education knowledge exchange
A small scale expert study by IP Pragmatics Ltd
Authors: Elaine Eggington and Rupert Osborn
September 2016
Commissioned by the Higher Education Funding Council for England

2 | P a g e

3 | P a g e
About IP Pragmatics Limited IP Pragmatics (www.ip-pragmatics.com) is a specialist consultancy that provides a range of intellectual property management and commercialisation services to assist universities, government research institutes and companies to increase their commercial revenue from their research, expertise and facilities. The company helps clients to create and realise value from their intellectual property assets through the provision of integrated intellectual property and business development services.
London | Edinburgh | Sydney +44 (0) 203 176 0580

4 | P a g e
CONTENTS
1 Executive Summary ......................................................................................................................... 5
2 Background ................................................................................................................................... 10
3 Methodology ................................................................................................................................. 12
4 Why benchmark? .......................................................................................................................... 14
4.1 Benchmarking approaches in higher education ....................................................................... 15
4.2 Who is the KE benchmarking tool for? ..................................................................................... 16
4.3 Knowledge Exchange and benchmarking ................................................................................. 18
5 Current practice in the UK ............................................................................................................ 21
5.1 HE-BCI........................................................................................................................................ 23
5.2 Other data sources .................................................................................................................... 25
6 International approaches .............................................................................................................. 28
7 Choice of benchmarking comparators .......................................................................................... 30
8 Proposals for a benchmarking framework .................................................................................... 33
8.1 General considerations ............................................................................................................. 33
8.2 Categorisation ........................................................................................................................... 34
8.3 Normalisation ............................................................................................................................ 36
8.4 Technology Transfer (spinouts and licensing) .......................................................................... 39
8.4.1 TTO processes ............................................................................................................... 39
8.4.2 Licensing ........................................................................................................................ 43
8.4.3 New enterprises (spin-offs + start-ups) ........................................................................ 44
8.4.4 Overall IP income .......................................................................................................... 46
8.5 Research contracts and strategic research partnerships .......................................................... 49
8.6 Small and medium-sized enterprises ........................................................................................ 52
8.7 Enterprise/entrepreneurship .................................................................................................... 54
8.8 Skills and employability (CPD) ................................................................................................... 58
8.9 Physical infrastructure – equipment & facilities ....................................................................... 60
8.10 Anchor or place-making role of universities ............................................................................. 62
8.11 (KE) Leadership, management and broader environment ....................................................... 64
9 Stakeholder reaction ..................................................................................................................... 68
10 Resources required ....................................................................................................................... 72
10.1 Mock-up of potential benchmarking tool ................................................................................. 75
10.2 Potential routes forward ........................................................................................................... 78
10.3 Costs .......................................................................................................................................... 81
11 Conclusions, recommendations and next steps ........................................................................... 82
Appendix 1: Selected reading list .......................................................................................................... 85
Appendix 2: International approaches ................................................................................................. 87
11.1 USA and Canada ........................................................................................................................ 87
11.2 Europe ....................................................................................................................................... 89
11.3 Australia .................................................................................................................................... 90
11.4 Ireland ....................................................................................................................................... 92
11.5 Scotland..................................................................................................................................... 94
Appendix 3: Draft benchmarking HEI clusters (from CBR/PACEC) ....................................................... 96
Appendix 4: List of abbreviations.......................................................................................................... 99

5 | P a g e
1 EXECUTIVE SUMMARY
Alongside teaching and research, knowledge exchange (KE) is now well established as a key mission
of higher education institutions (HEIs) worldwide. The Higher Education Funding Council for England
(HEFCE) provides separate funding streams for teaching, for research and for knowledge exchange.
In its 2014 Science and Innovation Strategy, the Government charged HEFCE with delivering a
robust, evidence based 'KE framework' against a suite of key knowledge exchange activities to assess
performance and identify examples of good practice. The KE framework is intended to support HEI
senior management in determining institutional strategy and priorities, as well as HEI KE professional
practitioners in their operational activities.
HEFCE has always taken a broad view of KE, and uses the term as shorthand for the multiple
interactions between HEIs and businesses, public services, charities and communities that create
societal and economic benefit. These interactions include joint research and development projects,
consultancy and training, knowledge transfer partnerships, setting up new companies and social
enterprises, and public and community engagement. KE also encompasses the
enterprise/entrepreneurship agenda for staff and students.
SCOPE OF THIS STUDY
The framework is being developed in conjunction with Universities UK, PraxisUnico and AURIL. As
part of this development, HEFCE appointed IP Pragmatics to look at tools for benchmarking within
the KE framework, and asked us to carry out a small scale expert study to test key areas in
development of a set of benchmarking indicators and a benchmarking tool for knowledge exchange
within higher education institutions (HEIs). In particular, we have tried to identify approaches that
are feasible, workable and useful to the higher education KE community. The study remit stipulated
that we should examine what could be achieved without putting additional data collection burdens
on the HEI community. We have also looked at ways to transfer ownership of benchmarking to the
HEI sector where it can be embedded in long term use.
HEFCE asked us to consider all the different forms of KE that it supports. However, it requested that
particular focus be placed on consideration of the handling of intellectual property rights within
knowledge exchange. This forms only a small part of KE activities, but has been highlighted
particularly in recent reviews such as the Dowling report, and is the focus of the current McMillan
group investigation of effective practices in university technology transfer.
In undertaking this study, we have drawn from previous HEFCE scoping work as well as learning from
existing practices in the UK and internationally. We have reviewed the literature on KE
benchmarking and analysed the existing data sources to identify a set of proposed indicators which
could be derived from this data and used for benchmarking. The emphasis has been on
benchmarking approaches which can be implemented from currently available data, but given the
limitations of this data we have also included some suggestions on how the tool might be usefully
extended if additional data became available.
We have also carried out a limited consultation on these proposed benchmarking indicators within
the UK HEI community. The project has been supported by a steering group with representatives of

6 | P a g e
AURIL, PraxisUnico and Universities UK, which has provided initial input on behalf of their members.
The consultation covered these bodies, as well as ARMA, and also HEI practitioners from a range of
different types of institution, with responsibility for KE at different seniority levels.
HEADLINE FINDINGS
There is a willingness within the community to engage with benchmarking for knowledge
exchange. Benchmarking can be a very useful device to assess current practice and to compare
performance across organisations. As part of a wider approach, benchmarking can be used to
improve performance and to identify good practice in others which could be adopted. A number of
organisations are already using the data available in this way as part of their strategic reviews of KE
performance.
Clarity over the purpose and aims of the benchmarking tool is critical. There are a number of
potential uses of benchmarking within KE: to investigate strategy, operational efficiency, process
improvement, or outcomes. The approach taken by a benchmarking tool would be different to suit
each of these outcomes, and this study has been complicated by a lack of common understanding
over what a benchmarking approach should primarily achieve. No benchmarking tool can cover all
these aims, and the HEI community will need to decide what is most important to them, what is
achievable, and what could give the highest return in enhancing existing KE performance.
There are a number of inherent difficulties in developing a benchmarking approach for KE.
Benchmarking is most effective when it can address both efficiency and quality. Many of the metrics
presently collected for KE in the UK and internationally represent the best available proxies for these
key measures, but care should be taken when using some of this data to draw specific conclusions
on comparative efficiencies between HEIs.
The success of KE activity is influenced much more by the underlying nature of the organisation than
by the efficiency and effectiveness of the KE staff and processes within the organisation. This may be
partly addressed by a combination of clustering and normalisation, which is explored further in the
recommendations below.
KE covers a wide spectrum of activities, and not all organisations would be expected to focus on or
excel across all of these. The performance goals of a particular HEI should be linked to their KE
mission, and the indicators chosen will vary depending on these goals and the type of KE being
examined. No single evaluation mechanism will be suitable for all contexts, and we recommend the
use of a selection of different indicators.
KE outputs, for example income metrics relating to technology transfer, can take many years to
come to fruition. Income being measured today is likely to have been the result of KE activities
undertaken many years previously. Some of the measures are also naturally volatile and/or easily
affected by single unusual events, for example one large successful licence will have a very big
influence on an HEIs relative performance in an intellectual property (IP) income measure.
We discovered a strong preference amongst those consulted for a tool which focuses on a small
number of key indicators which are able to give an overview of the range of KE activity in an
organisation. There can be a danger when focusing on individual targets that these activities are

7 | P a g e
prioritised over those which are not measured, and so we have concentrated on measures which
span a range of elements and which look at outcomes more than activities. We have also suggested
that the key indicators are supported by a range of more detailed measurements within the tool that
allow these different aspects to be explored.
The suggested benchmarking indicators have been constrained by the availability and quality of
the underlying data. Not all KE activities are easily amenable to measurement. Revenue is often
used as a proxy for interactions and KE, and is useful because it is easy to measure and compare; but
using KE income figures alone excludes a range of valuable additional KE activity which is not
revenue generating. The most comprehensive and useful existing data source for benchmarking
purposes is the higher education - business and community interaction survey (HE-BCI). This is also
the source of data cited by KE practitioners who are currently attempting to compare their
performance. Some limited additional sources of data are have been identified which could add
some additional data points, but the quality of this data is variable, depending on the purpose for
which it is collected. We have therefore highlighted the advantages and limitations of each
suggested indicator. The existing data do not give comprehensive insights into all aspects of KE that
may be relevant, so some types of KE are not yet well covered by the indicators suggested in this
study.
The insights that can be derived from the HE-BCI database could be exploited further by the HEI
community if the data were combined with other data in an easy to manipulate source. The nature
of the HE-BCI data points to the development of a tool which can help to guide overall strategy, and
which would provide some clues as to operational practices that may be worth further investigation.
Current methods of obtaining and interrogating the HE-BCI data can be cumbersome, particularly
when normalising by data from other sources. A tool which allows easier access to this data and
interpretation of its implications should give some interesting insights and allow wider use of this
data to support operational and strategic decision making.
The ability to measure and compare continuous improvement in KE process performance is very
limited using existing data. If the aim of the benchmarking is to drive the efficiency and
effectiveness of internal processes (rather than outcomes), then an approach which develops
process indicators aligned with performance targets may be more helpful than KE output indicators
alone. This is the approach used in many other service-based sectors. We have found some
scepticism within the KE profession about the feasibility of achieving a uniform approach to
definition of these performance targets, and it would involve an additional data collection burden
and sensitivities about sharing of the data. Some of this could be addressed by adopting an
anonymised reporting system. This type of performance indicator target approach is already being
used in some HEIs; and a small number already share the results internally and may consider
publishing them externally.
Benchmarking of external economic impact from KE is likely to also require additional data. There
is an increased focus by funders and within HEIs on understanding the impact of HEI activities
beyond internal activity measures to external outcomes. If the aim of the benchmarking is to
improve performance in these aspects, then a different approach again would be needed, with more
effort being put into monitoring the outcomes of interactions, potentially for many years after HEI
involvement has ended. As before, some of these outcomes will be intrinsically easier to measure.

8 | P a g e
RECOMMENDATIONS
This study is a starting point. For the HEI KE profession to value and use the proposed tool,
then further input from a wider audience is required. This would include the involvement in
particular of HEIs, but also of professional groups, funders, policy makers and external
stakeholders, perhaps including industry, and others.
HEIs need to take ownership of KE benchmarking. To maximise the value to the HEIs and
reduce the potential for the tool to promote unwanted behaviour, we would recommend that
the HEI KE sector drive the next stage of the process themselves, perhaps through one or more
of their professional bodies. It will be important that the approach taken is inclusive of the
whole spectrum of HEIs and of all types of KE activity. This may be best achieved through a joint
initiative, including senior HEI management levels.
The aims of the tool should be more tightly defined. This will then influence the approach that
is taken and whether or not this can be achieved using existing data.
Access to simple to use analytical tools to mine the available data sets would be valuable. The
new Heidi Plus tool may facilitate better use of the existing data, or this may come through
further development by HESA in association with Jisc via a Heidi Lab project.
A set of benchmarking indicators based on available data is proposed as a tool to aid in
strategic and operational decision making. We would suggest the following shortlist of
indicators as a starting point, subject to the caveats for each described in section 8:
Total KE income (by income type) per academic FTE
Ratio of non-commercial income to commercial income (licence income + contract
+ consultancy + CPD + facilities & equipment)
SME income as a % of total industry income
Total collaborative research + contract research income as a % of total research
income
Value of consultancy engagements per FTE
Staff start-ups surviving 3 years as a % of total companies formed surviving 3 years
Graduate start-ups surviving 3 years as a % of total companies formed surviving 3
years
CPD income as a % of total teaching income
Total facilities and equipment income
Total SME income (licence income + contract + consultancy + CPD + facilities &
equipment) per academic FTE
Number of disclosures
Value of licences granted by research income
Number of FTEs employed by active new enterprises
Total IP income as a % of total research income
The tool should be developed incrementally. This would include careful examination of the
proposed shortlist of indicators, as well as further consideration of a suitable categorisation for
KE activities. We recommend that the first stage uses a small selection of the proposed
indicators that are easy to define and collate, and using some pre-existing HEI clusters. The next
step would be to make the tool more sophisticated and provide more in-depth information. If
this proves successful, then we recommend that the approach is extended to some of the other

9 | P a g e
areas highlighted in this report, with the addition of further indicators, additional data
collection and widening of the scope to include process indicators and/or outcome
measurements.
A clustering approach is needed to contextualise the benchmarking indicators. Clustering
should be carried out in terms of underlying HEI characteristics: research intensity and discipline
mix, research/teaching balance, regional location, size, student mix, and mission and aims.
Further work is needed to define suitable clusters. In many situations, an HEI will already have
identified a small group of peer institutions for a specific type of KE activity, and these self-
selected clusters are likely to be more useful than pre-selected groupings.
Use of normalisation may also be valuable. It can account for differences in the underlying
scale of activities within an HEI. Suitable mechanisms include normalising by number of
academic staff, or by the relevant research or teaching incomes. However, normalisation can
have the effect of exaggerating the importance of outliers in the data, and is best used in
combination with careful selection of the right cluster of comparator organisations.
Further data collection may be required. Additional data would be needed to extend
benchmarking to cover all types of KE, because the existing HE-BCI and other data sources do
not give good insight into all aspects of KE that may be important to an organisation.

10 | P a g e
2 BACKGROUND
Alongside teaching and research, knowledge exchange is now well established as a key mission of
higher education institutions (HEIs) worldwide. In England, the Higher Education Funding Council for
England (HEFCE) awards a ‘third stream’ of funding for higher education (HE) knowledge exchange
(KE) – the Higher Education Innovation Fund (HEIF) – which began in 1999. This funding is distinct
from the two established HE funding streams for teaching and research. HEIF ensures that HEIs have
the capability to engage effectively with a wide range of partner organisations and businesses. It has
been successful in delivering a return on the public investment in KE of £6.30 gross additional
income generated for HEIs from every £1 invested over the period 2003-20121.
HEFCE uses the term KE as the shorthand for the multiple interactions between HEIs and businesses,
public services, charities and communities to create societal and economic benefit. These
interactions include joint research and development projects, consultancy and training, knowledge
transfer partnerships, setting up new companies and social enterprises, and public and community
engagement. KE also encompasses the enterprise/entrepreneurship agenda for staff and students.
HEFCE has always taken a broad view of KE which includes, but is not limited to traditional areas of
interaction, such as technology transfer (TT). HEIF supports an HE institutional infrastructure that
underpins a broad range of interactions relevant to teaching and research – for example, a
technology transfer office or student enterprise hub.
In the 2014 Science and Innovation Strategy2, the Government charged HEFCE with delivering a 'KE
framework'. The strategy states that ‘the performance of UK Universities in partnerships and
knowledge exchange can be further promoted through sharing of best practice and by assessment of
performance. The government has asked HEFCE to develop a robust, evidence based framework
against a suite of key knowledge exchange activities to assess performance and identify examples of
good practice’. The aims of the framework are to ensure that public money for KE is used efficiently
and effectively, and to further the continuous improvement agenda within HEIs.
The framework is being developed in conjunction with Universities UK, PraxisUnico and AURIL.
HEFCE has appointed Research Consulting to consider the availability of good/effective practice
materials in KE, and IP Pragmatics to look at tools for benchmarking. The KE framework is intended
to support HEI senior management in determining institutional strategy and priorities, as well as HEI
KE professional practitioners in their operational activities. In discussions with HEFCE and the HEI
community, it has been recognised that benchmarking can be used for different purposes, and that
the tools and indicators needed for these different purposes are unlikely to be the same. For this
work, it was left open as to which are the most important questions to be addressed by a KE
benchmarking tool, which has led to some differences in understanding amongst practitioners
consulted about the best type of approach to take.
1 Knowledge exchange performance and the impact of HEIF in the English higher education sector, Tomas
Coates Ulrichsen, HEFCE, April 2014. http://www.hefce.ac.uk/pubs/rereports/year/2014/keheifimpact/ 2 https://www.gov.uk/government/publications/our-plan-for-growth-science-and-innovation

11 | P a g e
The KE framework will address all the forms of KE that are supported under HEIF – from technology
transfer and research collaboration, to academic and student enterprise and skills, through to the
local anchor role of universities, networking and sharing physical infrastructure. However, particular
focus is being placed on the handling of intellectual property rights in KE. This is only a small part of
KE, but has been highlighted particularly in recent reviews such as the Dowling report3, and is the
focus of the current McMillan group investigation of effective practices in university technology
transfer4.
As HEFCE is the funding council for England, the KE framework will formally cover only universities
and other HEIs in England, and not Scotland, Wales or Northern Ireland. However, most of the
potential data sources considered for the benchmarking tool also collect the same data from HEIs
across the UK, and so the conclusions drawn in this report will generally be applicable for the whole
of the UK, and not just for England.
In this study on tools for benchmarking, IP Pragmatics was asked to:
Carry out a small scale expert study to test key areas in development of a set of
benchmarking indicators/benchmarking tool for Higher Education Knowledge Exchange
Identify approaches that are feasible, workable and useful to the HE community (from Vice
Chancellors to KE staff)
Examine what could be achieved without putting any additional data collection burden on
the HEI community
Identify ways to transfer ownership of any development to the HE sector where it can be
embedded in use long-term
This report summarises the findings from this study.
3 https://www.gov.uk/government/publications/business-university-research-collaborations-dowling-review-
final-report 4 http://blog.hefce.ac.uk/2015/12/15/doing-better-knowledge-exchange/

12 | P a g e
3 METHODOLOGY
For this project, we have collected the detailed information required to deliver the work through a
combination of:
Gathering and understanding HEFCE’s work to date
Desk research to identify other approaches (including international), data sources and
potential benchmarking formats
In-depth interviews with representative stakeholders across the HE sector to test and refine
the benchmarking concepts
We have undertaken a consultation exercise with a limited number of HE representative bodies and
individual HEIs. The aims of this consultation were:
Understanding whether they already use benchmarking for their KE activities and if so how
they do this
Seeking their feedback on the proposed approach and structure for the benchmarking tool
Understanding how they may use the tool and what its requirements will need to be in order
to be of most strategic nd operational use
The project has been supported by a steering group with representatives of AURIL, PraxisUnico and
Universities UK, who have provided initial input on behalf of their members. The consultation
covered these bodies, as well as the Association of Research Managers and Administrators (ARMA),
and also HEI practitioners from a range of different types of HEI with responsibility for KE at different
seniority levels. The interim findings from the report were also reviewed in a panel discussion at a
Benchmarking
options

13 | P a g e
joint PraxisUnico, ARMA and AURIL forum for Research and Enterprise Directors, attended by
approximately 50 senior KE staff from HEIs across the country.
There is an extensive body of literature and many previous studies which have considered
benchmarking approaches for technology transfer offices and for KE more widely. We have drawn
on the teachings from these previous studies, as well as from established practices in other
countries. The bibliography in Appendix 1 lists some of the most useful and influential reports in this
area, but is not intended to be a comprehensive literature review.
Our work has also built on initial internal investigations carried out within HEFCE, which provided
some valuable initial insights into the type of approach that might be suitable. This work led to some
suggestions which have guided this project; in particular, the benchmarking tool should:
• Not impose any additional data collection burden on HEIs
• Allow different approaches for different types of KE
• Allow comparison with pre-defined clusters of HEIs which are relevant for that type of KE, as
well as with user-selected groups
• Allow trend analysis over time, both internal (is the HEI improving its own performance over
time) and external (is the HEI improving its ranking in performance compared with its
peers)
• Stimulate further investigation and questioning of different HEI policies and practices which
may be adopted to improve efficiency and effectiveness
We have tried to take an approach which is pragmatic and simple to understand, but which is able to
convey some of the complexities of the measurement of KE, many of which are explored in more
detail in the sections to follow. The emphasis has been on benchmarking approaches which can be
implemented from currently available data, but we have also included some suggestions on how the
tool might be usefully extended if additional data became available.
NB The performance indicators outlined in this document are illustrative and designed to
demonstrate how future indicators may be structured, as well as to identify which approaches
may not be so useful. The underlying data has not always been checked for suitability and
robustness, and so any comparisons of institutions are not designed for use beyond this
illustrative purpose.

14 | P a g e
4 WHY BENCHMARK?
There has been increasing interest in recent years across many parts of the HE sector in the use of
benchmarking techniques to support strategic planning and the management of change. Various
definitions of benchmarking exist, including this one from HEFCE:
“A process through which practices are analysed to provide a standard
measurement ('benchmark') of effective performance within an organisation
(such as a university). Benchmarks are also used to compare performance with
other organisations and other sectors.”5
Effective benchmarking may have two functions – to improve current practices and to identify
alternative practices which may be better or more effective. Benchmarking can take a range of
forms. Metric benchmarking looks at indicators that can be measured to identify those areas where
there is a performance gap. Process benchmarking is a much more collaborative process in which
organisations share information to compare their processes and identify best practice. The tool that
is considered in this study will be a metric benchmarking tool, but is intended to provide useful
information that will allow individual HEIs and groups of HEIs to diagnose why they may be achieving
different levels of performance, and to facilitate more detailed process benchmarking activities.
Metric benchmarking approaches are useful to highlight the strengths and weaknesses of a
particular organisation, and also as a reputational measure.
However, if the indicators are not chosen and measured carefully, there is a danger that they can
drive inappropriate behaviour. This issue of “perverse incentives” is often cited in the context of
indicators for KE. For example, if HEIs are measured on the number of patents that they file, they
may be incentivised to file a large number of patent applications cheaply in a single territory, when a
better overall strategy to achieve effective knowledge exchange may be to focus limited resources
onto a single strong patent application across a range of territories. This is a recognised shortcoming
of benchmarking using metrics in any sector, and it will be important that the potential for this
influence on behaviour is recognised in the development of the tool. One way to effectively address
this issue is to recognise that there is no single measure of performance in any of the different
categories of KE, and to include a range of different measurements within the tool to allow these
different aspects to be explored.
Realistic benchmarking can facilitate the identification of target levels of performance which a
particular HEI can credibly aspire to achieve. Benchmarks can also be used as an objective measure
of how an organisation is performing against its plans, and so can be useful to provide monitoring
and assurances to senior management and other stakeholders. In particular, senior management
may be concerned that poor performance in KE may influence the opportunities for future external
interactions.
The success of a benchmarking exercise comes down to the ability of an organisation to use the
information to make improvements. Ultimately, if the potential users of the tool are unable to
answer the question ‘what would you do differently if you had this data?’, then it is unlikely to be
5 http://www.hefce.ac.uk/Glossary/#letterB

15 | P a g e
useful or used. However, benchmarking may also be validly used to verify that an organisation is
performing appropriately in particular areas.
4.1 BENCHMARKING APPROACHES IN HIGHER EDUCATION
Within the UK HE sector, benchmarking tools are already used in a number of different areas. The
UK Performance Indicators (UKPIs) for HE6 provide comparative information on the nature and
performance of the HE sector in the UK. They aim to measure how HEIs perform objectively and
consistently.
UKPIs seek to provide:
Reliable information on the nature and performance of the UK HE sector
The basis for comparisons between individual institutions of a similar nature, where
appropriate
Benchmarks for use in institutions’ consideration of their own performance
Evidence to inform policy developments
Information that contributes to the public accountability of the HE sector
All UKPIs are currently published by the Higher Education Statistics Agency (HESA), which produces
the measures on behalf of the four UK funding bodies for HE. The main performance indicators
relate to inclusiveness of student participation, as well as statistics on course completion and
student employment. The most relevant section of the performance indicators for the purpose of
this study was research output, which included four indicators of annual research output. However,
this section has now been withdrawn based on availability of the Research Excellence Framework
(REF) in 2015, and a consensus that the reported UKPIs were not very useful. There are ongoing
discussions about what should replace these UKPIs.
Most of the performance indicators included in the HESA UKPIs have benchmarks attached. The
benchmarks are not targets; they are average values which will change from one year to the next if
the overall value of the characteristic changes. They are provided to give information about the sort
of values that might be expected for a specific HEI’s indicator if no factors other than those allowed
for were important. The corollary of this is that where differences do exist, this may be due to the
HEI’s performance, or it may be due to some other factor which is not included in the indicator. In
the context of KE benchmarking, we do not consider average performance benchmarks to be very
helpful, as there are many underlying factors that will influence performance, and it is more helpful
to look at performance against relevant comparators than against an average. This will be discussed
further in section 7 below.
Benchmarking also feeds into current interest in improving efficiency and effectiveness across the
HE sector. The Efficiency, Effectiveness and Value for Money report7 develops a new agenda for
efficiency, effectiveness and value for money in HE. It presents evidence, analysis and
6 https://www.hesa.ac.uk/pis; http://www.hefce.ac.uk/data/ukpi 7 Efficiency, effectiveness and value for money, Prof Sir Ian Diamond for Universities UK, 2015. http://
www.universitiesuk.ac.uk/highereducation/Documents/2015/EfficiencyEffectivenessValueForMoney.pdf
16 | P a g e
recommendations arising from a review of the sector led by Professor Sir Ian Diamond and
coordinated by Universities UK in partnership with a wide range of sector organisations. The report
concludes that it is imperative that HEIs continue to evidence their success in delivering efficiency
and cost savings. The Efficiency Exchange8 is a platform provided by Universities UK and Jisc for
discovering and sharing knowledge relating to efficiency and effectiveness in HE. This resource
allows HEIs to exchange information in the form of interviews, blogposts, case studies and reports,
as well as providing access to relevant tools and resources. This type of model may inform the future
development of the KE framework.
Metrics, indicators and benchmarking are also widely used within the HE sector in the context of the
assessment of research outputs. Many years of experience in how to measure performance in this
area has led to the publication of guidelines on how to collect and use this data. The Leiden
Manifesto9 outlines 10 principles for research metrics. Although these principles were developed
with scientific publication metrics in mind, many of them are equally relevant or can be adapted for
KE metrics, and represent best practice for many types of activity measurement and assessment:
1) Quantitative evaluation should support qualitative, expert assessment.
2) Measure performance against the research missions of the institution, group or researcher.
3) Protect excellence in locally relevant research.
4) Keep data collection and analytical processes open, transparent and simple.
5) Allow those evaluated to verify data and analysis.
6) Account for variation by field in publication and citation practices.
7) Base assessment of individual researchers on a qualitative judgement of their portfolio.
8) Avoid misplaced concreteness and false precision.
9) Recognize the systemic effects of assessment and indicators.
10) Scrutinize indicators regularly and update them.
In developing potential KE benchmarking indicators, we have tried to keep these principles in mind.
4.2 WHO IS THE KE BENCHMARKING TOOL FOR?
In this study, we have considered a number of different areas where benchmarking of KE
performance might be useful:
Strategy – to allow an organisation to identify which aspects of KE are (or could be) areas of
strength. Benchmarking can be used to obtain data to support decision-making about where
to focus resources, or where additional effort could deliver greater results. Empowering the
HEIs to develop and strengthen their KE activities. What sort of institution do you want to
be?
Operations – how can an organisation improve in specific areas, who else is doing well in
that activity that we can learn from? Set effective targets for improvement, identify relevant
comparators and peers. Can we identify and spread best practice in this area?
8 http://www.efficiencyexchange.ac.uk 9 http://www.nature.com/news/bibliometrics-the-leiden-manifesto-for-research-metrics-1.17351

17 | P a g e
Process improvement – in many industries, benchmarking and performance targets are
used to drive continuous improvement in specific activities. For example, train franchise
operators are judged by the percentage of trains that arrive on time, and healthcare uses a
similar performance indicators approach. Is the organisation performing relevant tasks
effectively?
Outcomes – driving more and better outcomes of KE. If this is the aim, then indicators that
are more closely linked to the desired outcomes are needed. In the context of KE, short term
income is no longer a focus, but how do we define and measure long term public benefit?
Are we achieving the outcomes that we want?
Throughout the institutional structure, staff at different levels of the hierarchy may be interested in
the benchmarking indicators for a range of these reasons. At a senior level, Vice Chancellors are
interested in information that will relate to their areas of interest and enable decisions to be made
on policy/strategy – for them, combined indicators that give an overview of activity, or a small
number of high level indicators may be more useful. They will not be interested in the detail, but do
need to know that the operational level staff below them in Research and Enterprise Services and
the Technology Transfer Office (TTO) or Research Office find the indicators useful. The Vice
Chancellor and Pro Vice Chancellor level is vital for setting the leadership tone and overall strategy.
The outputs of the benchmarking tool may be helpful to raise awareness within senior management
of the importance and complexities of KE activities, and where the strengths of their organisations
lie. Historically, HEI KE reputation has been closely focused on technology transfer indicators such as
number of spinouts and licensing income, perhaps because this is widely reported. A high value is
placed on HEIF funding and its significance as an enabler of KE activity across the organisation.
The management level which is likely to derive the greatest benefit from a benchmarking tool based
around currently available data will be the Directors of Research and Enterprise, who are responsible
for performance levels of much of the KE within the HEI. Their interest will be mainly at the level of
overall strategy, and how to balance resources and effort, as well on defining and measuring the
types of outcome that are desired. This is increasingly focused on outcomes across the whole
spectrum of ‘impact’, not just in terms of economic outputs or income generation, but also in the
additional effects that the activities of the HEI may have. In this context for example, a successful HEI
might be one that has exploited a new drug through an exclusive licence that brings in a steady
income stream, or it might be one that has researched a new approach to patient care that they
have demonstrated will improve health outcomes, but is not based on tangible intellectual property
(IP) that can be licensed and is instead taken up through influences on policy and practice.
Meaningful benchmarking needs to address both efficiency and quality, and focusing on just income
arising from KE will not necessarily account for the quality of the overall impact.
As has been discussed, KE is not a discrete activity but takes place in many different parts of the
organisation and through a wide range of mechanisms. Depending on the organisation structure,
there may not be a single management role that has responsibility for all of this activity. Given the
pervasiveness of KE activity, it will be important to ensure that the tool is available across the
organisation where it is needed. This is further complicated in that the individual internal structures
of an HEI will rarely map directly to perceptions from external KE partners. To take a specific
example, if an industry partner expresses concern about the HEI handling of IP, then this concern
may stem from their interactions with the TTO or the Research Office or both (and perhaps others

18 | P a g e
offices as well), and so any benchmarking tool needs to consider activity across all these areas.
However, current data collection processes and comparability tend to match the internal structures
and it can be difficult to compare across offices, let alone across institutions. To address this type of
process driven performance improvement, different types of indicator may be required, but as will
be discussed later, this type of data is not currently collected centrally. In this context, it would be
very useful to be able to compare HEI performance with comparable industry (or other relevant)
performance, for example the time taken to conclude HEI-industry contracts compared with that
taken for industry-industry contracts, but there is no known source of this data.
At an operational level, managers of each area of KE (such as technology transfer, continuing
professional development, or consultancy) should be able to use the indicators to address efficiency
and effectiveness, as well as continuous improvement. Each manager will only be interested in a
subset of the indicators, but should be able to use these to identify where they are performing well
or have room for improvement, and to set realistic targets for performance based on improvement
over previous levels, as well as comparison with their peers.
Although not the primary purpose, the indicators and tool may also give assurance to government
and policy makers that the HEIs are addressing the efficiency and effectiveness agenda in the light of
scarce public funding. It may also assist HEI bodies – Universities UK, AURIL, PraxisUnico and ARMA –
to monitor overall performance in the sector and support their members in improving performance,
policy and practice, and communicating successes and challenges to Government and funders.
There is a danger that in attempting to address all these potential uses, the benchmarking tool may
fail to accomplish any of them.
4.3 KNOWLEDGE EXCHANGE AND BENCHMARKING
Knowledge exchange presents some particular challenges as an area for benchmarking. The success
of KE activity is influenced much more by the underlying nature of the organisation than by the
efficiency and effectiveness of the KE staff and processes within the organisation. In this context,
relevant characteristics include:
The location and type of the organisation
The scale of research and teaching, as measured by research and teaching income
The quality and intensity of the research, as measured by exercises such as the REF
The balance between teaching and research activities
The discipline mix and subject specialisations, including whether the HEI has a medical
school or other specialist research centre
The number of teaching/research academics in each discipline
The type of students (under- vs post-graduate, overseas student mix, etc.) at the HEI
Contextualising the indicators is therefore critical, and a clustering approach may be the most
appropriate so that an organisation is only compared with other organisations with similar
characteristics which are relevant to the type and scale of activity involved.
Normalising the indicators to reflect the underlying scale of the relevant activity is also important,
and will be discussed further in section 8.

19 | P a g e
HEFCE and the HEIs are interested in the wide scope of all KE activities, and there is benefit from the
synergies and inter-play of different types of KE. However, not all KE activities are amenable to
measurement. Although IP-related income and activity is easiest to measure, and so features heavily
in the current data collection and reporting, it represents a relatively small contribution to the
overall KE income of an HEI, and the bulk of this type of income is generated by a small number of
institutions (during the academic year 2014/15, four institutions between them delivered 65% of this
income, with 90% coming from a total of just 20 HEIs10). The availability of underlying data influences
the value of the indicators that can be derived from them. Revenue is often used as a proxy for
interactions and KE, and is useful because it is easy to measure and compare, but will miss out a
whole range of valuable activity which is not revenue generating. As such, any (metric-based)
benchmarking tool should certainly not be viewed as the only way to judge the quality of the KE
activity within an organisation.
The performance goals of a particular HEI should be linked to their KE mission, and the indicators
chosen will vary depending on these goals and the type of KE being examined. No single evaluation
mechanism will be suitable for all contexts. We have therefore suggested a range of different
indicators which may be appropriate for different situations. We would also recommend that
practitioners in each specific area of KE are consulted for advice on the suitability of each of the
indicators suggested for their area.
Certain types of KE are also inherently difficult to compare across time and across institutions
because they are based on infrequent and irregular events. For example, only relatively small
numbers of spinouts are created each year, and licensing income can be easily skewed by one large
licence deal. Outliers are common in KE due to the diversity of HEIs and their activities, and may not
be appropriate as targets; however the factors that lead to their position as an outlier may provide
useful insight for other organisations.
The data collection process for the underlying data and the analysis performed on that data need to
be transparent and open. The quality of the data will be dependent on the reasons for its collection,
and the importance of that particular data to an institution, for example whether or not it has an
influence on funding decisions. This can lead to inconsistencies within the same data set, where one
organisation has more to gain or lose if they collect the data rigorously. The HEIF funding allocation
is based on a subset of the data collected in the higher education - business and community
interaction survey (HE-BCI, see section 5.1 for more details), and these metrics may be expected to
be more carefully collected than others in the survey. Different parts of the survey data will also be
collected by different offices within the HEI, which may lead to internal inconsistencies in definitions
and assumptions used (as may also be found in many other data sets). It is also not always possible
to differentiate whether a zero return for a particular indicator indicates that no activity occurred, or
that activity did occur but the data were not collected and returned. Where there is particular
concern about the quality of the data associated with some of the suggested indicators, this has
been highlighted. Accurate, high-quality data require robust, agreed definitions and take time and
money to collate and process.
10 Source: HE-BCI Part B Table 4 2014/15.

20 | P a g e
One of the constraints specified by HEFCE in this study is that the benchmarking indicators suggested
should not involve any substantial additional data collection burden for the HEIs. This has limited us
to using existing data sets, and the work to date has been to show what can be done with that data
to see if it can provide a tool which would be useful. Depending on the use that is required for the
indicators, the currently available data may not always be fit for purpose, and we have made some
suggestions about additional indicators that might be useful if other data became available.

21 | P a g e
5 CURRENT PRACTICE IN THE UK
From our existing experience, and conversations with KE practitioners at a range of HEIs, many of
these are already undertaking some form of benchmarking of at least part of their KE activities. This
benchmarking may focus on analysis of internal data (monitoring trends against previous
performance in the same institution), or analysis of existing public data sources. The data source
cited most often is the HE-BCI survey (see below), but some also look at other data collected by
HESA. International surveys of KE activity may also be used, although the data collected in these
tends to be less extensive. The surveys carried out by AUTM in the USA, and ASTP-Proton in Europe
are the most prominent of these, and will be discussed further in section 6. Some organisations will
also collect the annual reports and look at press releases of their key competitors/comparators for
further information.
A number of HEIs reported using the HE-BCI data as part of a strategic review, for example when a
new Research & Enterprise Director joins, or following a merger of two HEIs. The information was
used to identify how the HEI compares with its peers, where it performed strongly, and areas that
could be improved. This analysis may be quite comprehensive, but is usually performed only
occasionally (perhaps every three years, and no more than annually). Each institution will look
specifically at the type of KE activity that is of specific interest to them. This type of external
benchmarking is often followed by more in-depth peer-to-peer analysis through direct contacts and
discussion, which may be facilitated by groups such as PraxisUnico, AURIL, and ARMA. This can be
useful to identify and investigate outliers, and the reasons behind these. The management level that
was most often involved with this type of activity was that with responsibility for HEIF strategies and
setting internal key performance indicators (KPIs). However, similar exercises were also reported by
those with responsibility for specific areas of KE, in which case only a subset of the HE-BCI data was
analysed.
Many HEIs will use the total figures and rankings reported in HE-BCI as the basis for this analysis,
whilst others have attempted to normalise the data using numbers of academic staff or occasionally
total research (or other) income. Each HEI also has a short list of other organisations that it wishes to
compare itself with, though this list may vary, depending on the activity being benchmarked.
Many institutions also use internal benchmarking through the development and monitoring of KPIs,
which are usually collected more frequently – monthly or quarterly. They may also be broken down
to the level of different Schools or Faculties, which is not possible with the current HE-BCI data
collected. For many organisations, some of these KPIs are based on selected HE-BCI data, particularly
income-based measures. These may be supplemented with KPIs that relate more directly to activity
measures or to service quality. One area that is of interest, but not covered in the HE-BCI data,
relates to strategic partnerships, which are increasingly important as industry moves towards fewer
deeper relationships with selected HEIs. The definition of a relevant strategic partnership will vary
significantly between different HEIs, however, and so are very difficult to compare across
institutions.
Service quality types of measure are generally not shared externally, and may not be disseminated
beyond the office in question. We are aware of at least one research-intensive university which has
been systematically collecting and reporting against three specific performance targets relating to

22 | P a g e
the time taken to move through their disclosure-analysis-protection stage-gate process. Their
performance levels against these targets have been published internally over the past two years, and
the university is currently considering making the data available externally as well.
The metrics and KPIs may be discussed at senior management level, but this is often from the point
of view of understanding why the institution ranks as it does in the listings, rather than as part of a
more strategic approach. We have found this can occur, for example when there are changes in
senior management positions at an HEI and there is a need for the TTO or Research Office to brief
the new management on where the HEI ranks with respect to its KE activities. In these circumstances
senior management may be more interested in reputation and any perceptions of poor performance
and how this may reflect on the HEI as a whole.
Interest in the area of KE benchmarking is high. One of the recommendations of the recent Dowling
review11 of business-university research collaborations was that:
“Universities that are confident of the performance of their TTO in supporting the
establishment of collaborations should publicise statistics that highlight their
efficiency and effectiveness.”
A group of five research-intensive universities recently published a white paper12 in response to the
Dowling review, in which they emphasised that business-university collaborations (as well as other
KE activity) occurs in many parts of the university apart from the TTO. In the paper, they committed
to lead by example, and develop joint benchmarks based on known information, recognising that
business engagement and collaborations are occurring beyond the activities of the TTO to seek to
generate sensible and meaningful metrics.
There has also been recent discussion on the AURIL and ARMA discussion boards around the
practices that different HEIs use for collecting and setting Enterprise and Knowledge Exchange KPIs
and targets. The outcome of this consultation was a selected set of potential annual or quarterly
KPIs, which included some which were income and commercially driven, some based on indicators of
activity levels, and others based on non-commercial and softer indicators.
Generally, we have found a high level of interest and willingness to engage further with
benchmarking activities within the (admittedly small and self-selected) group of individuals that we
have consulted. This included an acknowledgement that the existing data may not be the most
suitable to achieve meaningful improvements in KE performance, and a willingness to submit
additional information if the corresponding data is received in return. This would be particularly true
for data which is already collected internally. However, there was an acknowledgement that this
data may well not use consistent definitions and there will be a resistance to change where there is
an existing track record of internal data.
The sources of data used for existing benchmarking activities are explored in the next two sections.
11 https://www.gov.uk/government/publications/business-university-research-collaborations-dowling-review-
final-report 12 https://www.praxisunico.org.uk/sites/praxisunico.org.uk/files/5U%20Dowling%20-
%20the%20real%20issues%20and%20the%20future.pdf
23 | P a g e
5.1 HE-BCI
The main external resource cited by many of those we spoke to is the HE-BCI data. The annual HE-
BCI survey examines the exchange of knowledge between HEIs and the wider world, and informs the
strategic direction of 'knowledge exchange' activity that is undertaken by funding bodies and HEIs in
the UK13. The surveys collect financial and output data by academic year. Results are summarised in
the annual survey reports which provide information on a range of activities, from the
commercialisation of new knowledge, through the delivery of professional training, consultancy and
services, to activities intended to have direct social benefits.
The survey has been carried out since 2000, initially by HEFCE, and since 2008/09 by HESA. The data
collected have evolved over the lifetime of the survey, and the survey is the main vehicle for
measuring the volume and development of interactions between UK HEIs and provides a detailed
picture of these economic and community interactions:
Spin-off and start-up companies
Contract and collaborative research
Intellectual property
Consultancy
Continuing professional development (CPD)
Regeneration projects
Public engagement
The survey is broken into two parts with both qualitative and quantitative questions. Part A asks
about HEIs' strategy, policies and priorities. Part B collects data on the number and financial value of
business and community interactions. The most recent survey data, covering activities during
2014/15 were released in April 201614.
There are limitations to the data collected in the HE-BCI survey, and some of the categories of
information are more reliable than others. However, it is widely regarded as the best available
source of data on KE activity in the UK. A summary report of aggregate level activity at the UK level is
published freely by HEFCE. The underlying data on individual HEI performance can be accessed in a
number of different formats.
SPREADSHEETS
HESA provide access to spreadsheets containing all the data by HEI via heidi15 for HEIs who have
provided data to the survey (see below); £256.50 plus VAT is charged for non-HE users (to offset the
cost of data collection). The advantage of spreadsheets is that the users can then manipulate the
data in whichever way they choose. However, further analysis can be relatively unwieldy as the data
are spread over a number of worksheets, particularly if the information is to be combined with other
indicators from elsewhere in the HESA data sets.
13 http://www.hefce.ac.uk/kess/hebci/ 14 https://www.hesa.ac.uk/index.php?option=com_pubs&task=show_pub_detail&pubid=1718&Itemid=286 15 Full data from 2003/04 to 2007/08 are also available publicly on the HEFCE website: www.hefce.ac.uk

24 | P a g e
HEIDI, HEIDI PLUS AND HEIDI LAB
The Higher Education Information Database for Institutions (heidi) is a web-based management
information service that provides access to a rich source of quantitative data about HE, provided by
HESA16. It is available to all HEIs subscribed to HESA, Alternative Providers and to organisations
which are not-for-profit. Access to heidi is provided for non-commercial purposes only, and is usually
via the HEI finance department. The system contains all the data collected by HESA (including HE-BCI
survey data since 2008/09), which can be manipulated and cross correlated online, or downloaded
for subsequent analysis.
The heidi interface has a number of constraints on the amount of data which can be manipulated at
one time, and is not very easy to work with, and a joint HESA and Jisc Business intelligence Project
has resulted in the development of Heidi Plus, which was launched in November 201517. Heidi Plus
aims to be quicker and easier to use, and includes capabilities for graphics, maps and visualisations.
The system enables analysis of HESA’s official data on students, graduates, staff, finances, business
interactions and estates across the whole UK HE sector.
The Heidi Plus system is freely available to HEIs with a full HESA subscription and non-profit HE
sector bodies. Alongside Heidi Plus is Heidi Lab, which is a new national analytics experimentation
project aiming to refresh Heidi Plus content with insights from a wide range of alternative data
sources. The first Heidi Lab analysis cycle began on 10 November 2015.
One relevant example of a Heidi Lab project is the ongoing work on Professional Services Cost
Benchmarking18. The project will work with Universities UK to develop the area of professional
services cost benchmarking. This will build on the outcomes of the ‘Delivering efficiency through
effective benchmarking’ project, led by Universities UK. This project has developed a taxonomy of
core business processes and associated cost categories, which will allow HE providers to upload,
share and benchmark data on professional services costs utilizing the taxonomy of business
processes. This taxonomy of HE sector professional support services (as at 20 December 2014)
includes a range of job functions, including those supporting KE in Research, Innovation and
Enterprise services.
FUNDING BENCHMARKS
Funding Benchmarks19 is a private company which takes data from HESA (primarily HE-BCI) and
facilitates HEI access to comparisons, trends, rankings, etc. The original data for this service is
provided under license by HEFCE and HESA. There is some overlap between the types of analysis
offered by this company and some of the suggestions for the benchmarking tool described in this
study. Some information is also pulled in from other HESA sources, but the only limited
normalisation is by number of academic staff. The company provides an interactive portal via
16 http://www.heidi.ac.uk/ 17 https://www.hesa.ac.uk/pr/3767-press-release-223 18 https://www.business-intelligence.ac.uk/professional-services-benchmarking/ 19 http://www.fundingbenchmarks.org/

25 | P a g e
Software as a Service (SaaS), but the analysis that can be performed through this interface is limited
by the options available on the data choices.
They also offer in-depth reports for individual HEIs – both standardised and bespoke with more
flexibility. These offer specific benchmarking and analysis over the full range of KE activities covered
by the HE-BCI survey. Their expertise lies in this analysis, and there is also value in the validation
which comes from being produced by an external third party.
The Funding Benchmarks website lists the following charges for their service:
Prices £ (excluding VAT)
Single User, non-HEI 525
University License , Up to 5 Users 875
University License , Up to 10 Users 1250
Per "Full Business Interaction Report” 450
Per "Overview Business Interaction Report" 250
Combination: University License, 5 Users plus "Full Business Interaction Report"
1250
Their list of some of their subscribers includes 13 HEIs. One user reported that they subscribed
because it made comparisons and charting simple, but that they would prefer more flexibility in the
data manipulation and analysis.
5.2 OTHER DATA SOURCES
PraxisUnico have recently carried out a survey of their members20, which gives an insight into KE
practices and issues. However, the data collected do not cover all HEIs, and individual institutional
responses are not available publicly. The report of this work includes an overview of the responses
to this survey which relate to the indicators that these respondents use to judge their KE
performance, and the data that these are based on:
20 https://www.praxisunico.org.uk/resource/knowledge-exchange-commercialisation-state-profession-uk-
higher-education

26 | P a g e
Source: Research Consulting / PraxisUnico
As in our consultations, income targets are common (dark blue bars). These commonly used
research commercialisation indicators, however, are seen as unreliable predictors of an HEI’s long
term capability to support or develop a vibrant KE ecosystem. The list therefore also includes a
number of indicators that can be broadly identified as ‘input indicators’ or ‘process indicators’;
measuring an HEI’s commitment to an enterprise and innovation agenda, entrepreneurial culture
and innovation capacity. Some of these indicators are collected by the HE-BCI survey, but many are
internal indicators collected by the HEIs themselves.
Another useful source of data about KE activities in the UK is the National Survey of Academics. This
is a large survey undertaken by the Centre for Business Research in Cambridge during 2008, and
repeated in 2015 in association with the National Centre for Universities and Business (NCUB)21. This
is a valuable data set, including responses from 18,000 academics across the UK. The published
report only includes aggregate information, which is not split by Institution, so it is not useful in its
current form for institutional benchmarking. However, it may be worth exploring with NCUB
whether there is additional information which could be added into a benchmarking tool.
We have also examined the KE strategies which are submitted to HEFCE to describe their planned
use of the HEIF funding22. These are qualitative descriptions, and although there is some structure to
the submissions, there is no easily extracted data which would be useful for benchmarking. It would
require significant work on data mining to analyse these documents, but this might allow some
21 http://www.ncub.co.uk/reports/national-survey-of-academics.html 22 http://www.hefce.ac.uk/kess/heif/

27 | P a g e
interesting comparisons. The strategies are more likely to be useful to support further investigation
of comparator institutions which may be identified as interesting through the benchmarking tool.
The patent literature is a potentially interesting source of data about these specific types of KE
activity. The information collected by the HE-BCI survey could be supplemented by additional
information for example about the influence of the patent outputs through patent citation studies,
or the extent of co-inventorship between HEIs and companies. In a recent study (Research
Evaluation 24 (2015) pp. 380–391) by researchers at Imperial College London23, the authors
compiled a comprehensive database of the patents which are linked with the academics at Imperial.
However, this exercise was very time consuming, and involved access to individual academic records
in order to link these to the patent databases. There are also difficulties with inconsistencies in how
the patent databases record HEI ownership of the patent applications, so it would not be a trivial
exercise to collect this data and assign it to UK HEIs.
There are efforts in place in Australia to gather some of this data for their HEIs. The National Survey
of Research Commercialisation identifies evidence and advice for government on better
understanding the engagement and commercialisation activities of the research system. Following a
recent review of the data inputs to this survey, an agreement is now in place to access patents data
and metrics from IP Australia which will inform the next version of the survey.
Amongst the research-intensive universities, there has been a collaborative project24 supported by
selected universities in the UK, USA, Australia and New Zealand to develop indicators from the
bottom up, which would be useful to compare research performance. These Snowball Metrics are
heavily focused on research outputs, and so only cover a small section of the activities which could
lead to knowledge exchange outcomes within HEIs. In our experience, these metrics are not widely
known or used. Nevertheless, they do include a number of metrics which relate to research-oriented
knowledge exchange. The project has published a recipe book25, which defines a mutually agreed set
of methodologies to define metrics to allow cross institutional comparisons in the knowledge that
these will all use the same data definitions. However, the recipe book does not always go into
sufficient detail of what should be measured to be sure that different HEIs will report the same data
to allow like-for-like comparisons. Where appropriate, we have included some of these indicators as
candidates for the benchmarking tool; these are indicated by the snowball logo: .
It is also worth considering the influence that inclusion of impact case studies into the REF for 2014
is continuing to have on the way that HEIs monitor their activities and their ultimate effects on the
world outside academia. This shift in understanding that impact is delivered not just through
immediate revenue streams but also through wider effects on the public good means that HEIs are
now monitoring the ultimate effects and collecting more data about the outcomes of their KE
activities.
23 http://rev.oxfordjournals.org/content/24/4/380.full 24 http://www.snowballmetrics.com/ 25 http://www.snowballmetrics.com/wp-content/uploads/snowball-recipe-book_HR.pdf

28 | P a g e
6 INTERNATIONAL APPROACHES
Although we have identified many studies which have examined different methods of benchmarking
for KE activity, we have not been able to discover any countries which have a benchmarking tool that
makes this activity simple for their HEIs to achieve. However, many countries do conduct the
equivalent of the HE-BCI survey for their particular set of HEIs. These vary in terms of data
completion and accuracy, and many of them are collected on a voluntary basis, and so are not
always comprehensive or complete. The availability of these surveys offers the potential for
international benchmarking as well as comparisons within these countries. Details of the approaches
taken in selected territories (USA, Canada, Europe, Australia, Ireland and Scotland) are given in
Appendix 3.
In general, all the countries studied take a fairly narrow approach to the collection of metrics of their
KE activities. These are largely confined to information about licensing, spinouts, disclosure and
patenting activity, plus some more administrative data such as the size of the support team, level of
patent costs and the nature of the HEI. Some also cover collaborative research, contract research,
consultancy and/or CPD. This emphasis on technology transfer activities is partly historical, and KE
professionals and organisations around the world have been debating how the indicators can be
widened to reflect the current interest in the full spectrum of knowledge exchange activities.
However, it also reflects the importance that these countries place on these outcomes, as well as the
fact that these indicators are easier and more reliable to collect than those based on softer
outcomes.
Nevertheless, some countries, such as Australia and Ireland, are attempting to update and expand
their approach to encompass more KE activities and to get more in-depth information about
outcomes, continuing the lead of the HE-BCI survey. For example, Australia has recently introduced
indicators relating to engagement mechanisms similar to the HE-BCI Part A questions, and which
include a question about the five products, processes or services originating in the organisation that
have had the greatest impact on society. In Ireland, indicators include the levels of activity with Irish
small and medium-sized enterprises (SMEs), and they are taking an in-depth approach to
understanding their active spinouts and the products and services which arise from their licences (as
opposed to just the number of licences completed or the income from those licences).
International benchmarking offers a number of challenges: language, legal frameworks,
categorisation and definitions used often differ which makes it difficult to compare performance
across international boundaries. Different data is also collected in each territory, and may be
normalised against different measures, with different definitions of what is or is not included in
each. We have tried to include the metrics which are most commonly collected to allow for
international comparisons wherever possible, but recognise that these will be compromised, and
may not provide the most useful indicators.
International comparisons are only helpful if they are accompanied by an understanding of the local
academic and innovation ecosystem and funding routes, as well as the structure and shape of the
HEIs (in terms of size, research/teaching balance, subject strength, etc). The identification of
relevant peer groups can therefore become very difficult.

29 | P a g e
Income-based measures are also strongly affected by exchange rate fluctuations, which can mask
the underlying trends in activity. We have therefore tried to choose indicators for international
comparisons which do not involve direct comparisons of income levels.
HEFCE is the funding body for England only, and this report focuses on approaches that could be
introduced within England. However, most if not all of the data that will be discussed are also
available in the same format for the rest of the UK, and so the conclusions drawn would also be valid
for the whole of the UK. Scottish, Welsh and Northern Irish HEIs would therefore also make good
benchmarking comparators for the English HEIs.

30 | P a g e
7 CHOICE OF BENCHMARKING COMPARATORS
A key component of any benchmarking process is to understand which institutions represent
suitable comparators for the activity to be benchmarked. Within KE benchmarking, this is made
more difficult because the choice of comparators may vary depending on the type of activity that is
being considered.
In our consultation, we found that each HEI will usually have their own short list of who they
consider their peers to be within a particular KE activity area. This may include other HEIs which are:
Based in the same regional area, or in one with a similar local economy
Of similar size
Similar in terms of research strengths and subject matter
Of a similar type (e.g. research intensive vs teaching focused)
Aspirational targets that are seen as realistic role models
Within an international setting, the choice of comparator HEIs is much more difficult, because there
is less data available to identify suitable HEIs with a similar profile.
In constructing a benchmarking tool, we would recommend flexibility in the choice of comparators.
In some circumstances, it may be reasonable to understand where your performance ranks against
all the other UK HEIs. It can also be important when looking at improvement over time to
understand whether an absolute increase in a particular indicator for a particular HEI also represents
a relative improvement compared with other HEIs, or if they have also increased that activity still
further. In other circumstances it would be more helpful to allow individual choice of 5-15 other HEIs
as comparators, with the ability to save the selected groups for later re-use. These self-selected
groups are likely to be the most useful for understanding of relative performance and setting targets
for improvement. However, we would also suggest the construction of a range of pre-populated
groups of HEIs with similar underlying characteristics. These clusters may need to be tailored
according to the type of KE; for indicators of technology transfer an HEI may wish to compare with
other organisations with a similar research/teaching balance and discipline mix; for indicators of
student enterprise, relevant comparators will be those with similar student populations; whilst for
SME interaction, local HEIs, and those with a similar local industry mix and economy will be more
relevant. Any such clusters should not be static, but evolve as more experience is gained.
In any HEI system, the overall data on any KE indicator are highly skewed by a few big contributors
(driven by high research budgets and world class academics). This is true of any KE indicator, but
particularly so for the activities based on research, such as technology transfer and research
contracts. Previous work in 2009 by Tomas Coates-Ulrichsen of the Cambridge Centre for Science,
Technology and Innovation for HEFCE26 used a system for clustering HEIs based on research
intensity. This work divided the English HEIs into five groups: the top six research intensive HEIs;
high, medium and low research intensive institutions; and specialist arts institutions. This
classification has been used in a number of later analytical studies, and would be a good starting
26 http://www.cbr.cam.ac.uk/fileadmin/user_upload/centre-for-business-research/downloads/special-
reports/specialreport-evaluationeffectivenesshefce.pdf

31 | P a g e
point for potential clusters based on research intensity although care would be needed for indicators
such as CPD which are not directly related to underlying research. The HEIs which fall into each
cluster would need to be updated using current data (T Coates-Ulrichsen; personal communication).
It may also be necessary to include the Scottish, Welsh and Northern Irish HEIs in the classifications,
in order to allow easy benchmarking of English HEIs with other local countries. The members of each
group, as laid out in the 2009 work, are shown in Appendix 3. A similar approach is used to
categorise the HEIs in the database of REF Impact case studies. This uses clusters based on the
relative and absolute research income of the submitting Institutes, using economic peer groups
assigned by HESA on the basis of income data available in 2004/05.
There may be scope to refine these clusters using REF data to identify groups of HEIs with similar
subject and research strength profiles. Or to define clusters around the presence or absence of
specific facilities, such as having a medical school which is well known to increase the potential for
some types of KE activity significantly. However, we would recommend that the clusters are not
subdivided too far, to allow more scope to identify potential interesting comparator organisations.
Another approach might be to cluster the HEIs based on the industry sector from which they
generate most of their external revenue. There may also be a need for different clusters to be
constructed for other types of KE activity. Further work will be required to refine the optimal
membership of each cluster.
Another common way to group HEIs is through their membership of ‘mission groups’, such as the
Russell Group of high research intensity universities, the ‘Post 1992’ group of former polytechnics,
the MillionPlus group, or the University Alliance. Of these, the Russell Group is the one with the
highest profile and strongest identity; HEIs in the other groups may not even be aware of their
membership. It may be useful to create pre-populated groupings within the tool to reflect these
mission groups. However, not all HEIs fall into one of these groups and membership may be based
more on stereotypes than institutions which share relevant characteristics with respect to the
activity that is being benchmarked, so these are less likely to provide useful comparisons.
Nevertheless, some HEIs still view other members of the relevant group as their closest peers,
particularly for the Russell Group. It would therefore be useful to include these as relevant
comparator groups which are likely to share similar approaches to KE.
Regional groupings may also be useful, although these will be less relevant for many indicators, as
the underlying nature of the institution will have more influence than where it is based. Broad
regional groupings could be easily incorporated, however, and may also be useful for regional
planning, for example with the local enterprise partnerships (LEPs). Regional groupings based on LEP
boundaries may also be helpful for some categories.

32 | P a g e
CASE STUDY: USE OF COMPARATORS TO SET ASPIRATIONAL TARGETS
One potential use for the benchmarking tool would be to allow an HEI to identify comparator
organisations for a particular type of KE activity, to understand how their figures might be improved
if they could match the performance of the best member of the group.
In the example below, University X is interested in their collaborative research income. They have
constructed a cluster of other HEIs which are in the same region and/or have a similar research
profile and discipline mix to them. The table below shows the performance of each of these HEIs.
Institution
2014/15 HE-BCI survey Part B
Table 1: Research related activities Collaborative research involving
public funding: Income (£000s) Item
TOTAL COLLABORATIVE RESEARCH current year Total
2014/15 Staff full-time equivalent
All staff Academic employment
function Sum of Teaching only
+ Research only + Teaching & research
2014/15 Collaborative
research income per academic FTE
£
University A 18,471 1134 16,288
University X 21,126 1759 12,010
University B 12,340 1108 11,137
University C 18,797 2223 8,456
University D 11,096 1579 7,027
University E 7,907 2638 2,997
In overall income terms, University X receives the highest value of collaborative income in its peer
group. However, when this is normalised to take account of the number of staff in each institution,
then University A receives more income per academic than University X. If University X were to
achieve the same level of income per academic staff member, then it would reach a total
collaborative research income of £28,651,000 per year. This might then represent an aspirational or
stretch target for University X to aim for in its collaborative research funding income.

33 | P a g e
8 PROPOSALS FOR A BENCHMARKING FRAMEWORK
8.1 GENERAL CONSIDERATIONS
In section 4.2, we considered some of the potential applications of the proposed benchmarking tool,
and in section 5 we examined the potential data sources which are available to construct the
benchmarking indicators. Our brief from HEFCE specified that the tool should not add any further
data collection burden onto the HEIs. As we explored the type of indicator which could be developed
using additional data, we found, as others have before us, that the most useful and comprehensive
data set is that provided by the HE-BCI survey. However, the type of data which is collected in this
survey lends itself particularly to two types of usage for the tool: as a strategic tool to identify areas
of strength and weakness, and as an operational tool to begin to dig into the potential reasons
behind these differences. It is less useful if the aim is to achieve process improvement, and of limited
use when considering the eventual outcomes of KE.
In the sections to follow, we have started from the HE-BCI data, adding other data sources where
available, to come up with a long list of suggested indicators which could be devised to shed light on
the differences between organisations, particularly at an operational level. We have deliberately
taken an all-inclusive approach at this stage, to show what could be done with that data to examine
whether this could provide useful insights. Following limited consultation to date with practitioners
within HEIs, these suggested indicators have been refined to those listed in the sections to follow.
We recognise that the level of detail included here is too much for strategic decision-making;
however the indicators may provide some interesting information and may give insights into some
of the reasons why different organisations have different outcomes. There is also a danger that
focusing too tightly on a small number of indicators we will distort activity onto just those activities –
a balanced scorecard which institutions can choose to select from may be more helpful to allow
them to focus their efforts.
Some of the areas of KE considered will take longer for any improvement to show up in the metrics
than others. For example, small scale consultancy income may be easier to increase in the short
term than the number of spinout companies created.
By their nature, the suggested indicators could be collated and analysed by the HEIs themselves at
the moment, though some are easier to compile than others. Our research suggests that this does
occur, to a greater or lesser extent, within HEIs today. The additional value to be obtained by
compiling this information into a central benchmarking tool may therefore be limited. So we have
also included some initial thoughts on extensions to the indicators that may be helpful to shed
further light onto the process improvement and outcomes-based uses of a benchmarking tool. Some
of the data that is considered would already be collected within HEIs for internal performance
monitoring, and may add value if it were made available for external benchmarking. Some of these
suggestions may be more appropriate used as internal KPIs than external metrics, or compared on
an anonymised basis.
Another consideration is the suitability of the indicators for international as well as national
benchmarking. As described in section 6, the data which is collected in other countries is not always
directly comparable with the UK data. In particular, the necessary base information to allow suitable

34 | P a g e
normalisation or the identification of relevant comparator institutions is often not available. Some of
the data is also only available at aggregate level, rather than for individual institutions, which may be
anonymised. The level of detail which is collected by the HE-BCI survey is also not available in any
other countries. In the benchmarking indicator listings, we have identified those which might be
amenable to benchmarking internationally as well as within the UK.
The all-inclusive approach also helps to shed light on the complexity of KE activities across HEIs,
some of which are more amenable to benchmarking than others and so will have a greater number
of suggested indicators. The data levels and sources differ for each type of KE, and the quality and
robustness of the data also varies as discussed earlier. This will be discussed in greater detail in each
section below. By suggesting a wider range of potential indicators, we offer the opportunity to use
whichever might add value to decision making in any particular situation. The selection of the
particular indicators to be used will depend on the question being asked, and the area of KE which is
being considered. Different indicators will be useful to different people in different ways.
Initial work within HEFCE explored developing a set of rankings of HEIs with individual indicators
organised around main categories, which could be published and disseminated. Their conclusion,
with which we agree, is that this may not be the most effective approach. Ranking tables are a crude
device, and data that is not normalised (see section 8.3 below) is more useful to tell the story of
overall UK activity and success than to drive change in individual institutions. A better method would
be to develop a tool that enables HEIs to compare themselves in a range of ways. This may include
presenting the same data in a range of formats – for example, total performance, normalised
performance, trends over time, and market share.
8.2 CATEGORISATION
Because of the diverse nature of KE activities, some structure is needed to group these into discrete
areas of KE activity which share common performance features, and within which performance can
be normalised and contextualised in a consistent way. Within this framework, it should then be
possible to identify strong performers and elements of good practice in each category which can be
highlighted and shared.
Different HEIs have different skill sets and requirements in different areas of KE. Each HEI will have
areas where they perform more strongly at present, which are likely to be linked to their underlying
mission, activities and research/teaching base. For example, one HEI may be interested in working
with local companies on smaller projects and building a strong local innovation ecosystem, whilst
another may have specialist research skills which are best exploited in partnership with large
multinational companies. This means that one HEI would not be expected to perform strongly across
all the different categories of KE, and indeed one of the valuable uses of the tool should be to enable
an HEI to identify which are its areas of relative strength.
In 2009, HEFCE commissioned some work from CBR/PACEC27 which examined the knowledge, skills
and competencies for KE. Although the environment has changed since then, the overall schema is
27 http://www.pacec.co.uk/wp-
content/uploads/2015/09/Evolution_of_the_Infrastructure_of_the_Knowledge_Exchange_System.pdf

35 | P a g e
still a useful way to think about KE interactions across research and teaching, and to look at the
development of knowledge, skills and competencies at leadership, academic and KE professional
unit levels. This is shown in the diagram below, which is used by HEFCE to contextualise the scope of
KE and HEIF support:
Source: HEFCE/PACEC
The category of ‘Facilitating the research exploitation process’ is the one with the largest amount of
supporting data within the HE-BCI survey, and is more manageable if it is broken down into two sub-
sections – technology transfer and research contracts. The schema also does not specifically include
some recent hot topics, such as student enterprise. A simplified categorisation was suggested by
HEFCE, and has been used as a starting point by both this work and the parallel study which is being
conducted by Research Consulting into sources of effective KE practice.
(KE) Leadership, management & broader environment
Technology transfer
(spinouts & licensing)
Research contracts &
strategic partnerships
Small & Medium sized
Enterprises
Enterprise / Entrepreneur-
ship
Physical infrastructure (equipment &
facilities)
Skills & Employability
(CPD)
Anchor or place-making role of institution

36 | P a g e
Both the leadership category and the anchor role category can be thought of as spanning across the
other areas as shown, and it has proved difficult to identify suitable indicators for both of these
areas which do not overlap the other categories. The categories used still show some areas of
overlap, and more work may be needed to refine which indicators sit best within which category. It
may well be appropriate to re-use some indicators in more than one category, as they are relevant
to both.
The current framework also does not easily cover some of the wider KE mechanisms that are used by
HEIs, for example activities which have an influence on policy, on quality of life, or on environmental
sustainability. Public engagement is also only covered partially (mainly in the anchor role category).
However, all these aspects of KE are difficult to ascribe directly to individual HEI actions and are
extremely difficult to measure and benchmark. This has been discussed further in the recent paper
from HEFCE on the use of metrics in research assessment28. At this stage, we have not attempted to
include this type of activity in the benchmarking framework.
8.3 NORMALISATION
The KE activity of an individual HEI will be highly dependent on the underlying nature and scale of
the institution and the type of activities that it undertakes. To account for this variability and to
allow the metrics to identify differences that arise due to different KE efficiency and effectiveness, it
is good practice to normalise the indicators to account for scale and other appropriate factors.
However, there may also be different effective practices that link better to the scale of activity,
which is where the use of clusters of similar organisations as comparators suggested in section 7
may prove useful. For many of the indicators, we therefore suggest indicators which look at both the
absolute values and those which have been normalised. Normalisation also has the effect of
exaggerating the importance of outliers in the data. For example, if an HEI has a very small number
of academic staff, then they will appear particularly effective in indicators where they have a
reasonable performance which is then normalised by staff number. Similarly, one large licence deal
can have a disproportionate effect on an HEI’s normalised ranking for IP income. This effect will be
obvious in some of the sample indicators which are explored later in this section. A combination of
normalisation and clustering may give the most useful results.
The factor used to normalise the indicators will vary, depending on the type of activity. There is no
absolute link between any specific underlying measurements and the level of KE activity that would
be expected, so all the normalisation approaches will be approximations. Some of the most useful
approaches are discussed below, and expanded within each category of KE activity.
One common method is to normalise according to the number of academics in the HEI, which gives
an approximation of the pool of resources that may be available to undertake that activity. We have
suggested using the total number of academic full time equivalents (FTEs) as the normaliser for all
the KE categories. For some types of KE activity, it may be more appropriate to use the number of
research or teaching FTEs, or even the number of FTEs which are submitted to the REF assessment.
However, the data collected by HESA on this split are not comprehensive, and are not very reliable.
28 http://www.hefce.ac.uk/media/HEFCE,2014/Content/Pubs/Independentresearch/2015/The,Metric,Tide/
2015_metric_tide.pdf
37 | P a g e
For example, both the HESA staff record, and the HESA estates management record include data
about research vs teaching staff, but these numbers are incomplete, and often do not match. The
discipline of these academics will also have an influence on their capacity for different types of KE.
The number of academics submitted to the REF assessment would include discipline information,
but does not necessarily include all the research-active academics within an institution, and is not
updated every year, so this is also not very useful as a normaliser. For some of the person-based
indicators, the best normalisers may be the number of academics engaging in each activity, for
example to allow the consultancy income per active academic consultant to be analysed. However,
this data is not collected at present, so the approach suggested instead gives a proxy for the total
number of academics who might be eligible to engage in that activity. For certain indicators, for
example the number of student start-ups, it may be more sensible to normalise by number of
students than number of academics, and this is highlighted below where appropriate.
The other common method that we have taken for normalisation is to use the income levels of the
HEI as a proxy for the scale of activity. Here, we suggest using either the total research and teaching
income, the research income alone or the teaching income alone, depending on the type of KE
activity which is being analysed. We have used the HESA record as the basis for these income
figures, as their definitions cover all types of research income, and are therefore a better measure of
the underlying scale of activity than the HE-BCI records which exclude research funding which comes
directly from the Research Councils and HEFCE quality-related research funding. The HESA finance
return data also records income from research grants and contracts from UK industry, commerce &
public corporations which is available by HESA cost centre, and so could be used to inform
normalisation by subject split. However, this figure does not cover all the HEI-industry KE activity,
and is not available by size of partner or split between contract and collaborative research.
Certain KE activity will be dependent in part on the level of support that is available for that activity.
For example, it might be expected that the number of disclosures recorded by a technology transfer
office would be dependent on the number of TTO staff. There are no consistent definitions or
collection of data about the numbers of KE staff within HEIs, and so this type of normalisation is not
currently possible. This might also be approached by normalising according to the level of HEIF
funding received by an organisation, but this is unlikely to give useful insights because HEIF is by no
means the only source of support for KE activities, and those organisations which do not receive
HEIF funding will still be involved with KE supported through other means.
There is a large body of evidence surrounding normalisation approaches within publication citation
metrics. Here, the most robust normalisation method is based on percentiles: each paper is
weighted on the basis of the percentile to which it belongs in the citation distribution of its field (the
top 1%, 10% or 20%, for example). A single highly cited publication slightly improves the position of
an HEI in a ranking that is based on percentile indicators, but may propel the HEI from the middle to
the top of a ranking built on citation averages. Most of the KE indicators discussed do not have
sufficient data points to allow this approach to normalisation to be used, but it is something that
could be considered for later development for certain indicators as experience grows with the use of
the benchmarking tool.
In citation metrics, subject normalisation is also critical, but has not been considered in this study.
Elsevier have carried out a lot of work in this area. This is potentially quite a large confounder of the

38 | P a g e
data, as discipline has a significant impact on the potential volume and type of KE activity
undertaken. At present, however, the HE-BCI data is only collected at the HEI aggregate level, and is
not reported by subject area or School. It might be relatively simple to extend the data collection to
the HESA Cost Centres level (or REF Units of Assessment). Both will be very familiar to the HEIs from
their existing reporting activities, and most HEI internal systems will be set up to record this data.
The effort needed to report at this level may not justify the limited insights that could result. In our
consultation with the community, the availability of data by discipline was a common request,
particularly in relation to technology transfer and research partnerships. However, the further some
of the metrics are divided, the smaller the actual values become, and so subdividing to this level will
exacerbate the influence that a small change in underlying figures may have in comparative
performance. At present, we would recommend accounting for normalisation by subject by the use
of suitable clusters of HEIs for comparison, rather than by attempting to record more granular
activity data, but this could be a useful later extension.
Related to normalisation is the concept of data smoothing. For KE indicators where the absolute
figures are relatively small (for example number of spin-offs per year) it can be more appropriate to
compare the figures expressed as a rolling average over three or five years, to allow for year-to-year
variation. This type of approach is dependent on consistency of the data collected and definitions
used over that averaging timescale, so care is required when setting these up and ensuring that they
remain appropriate. We have suggested a small set of indicators which use this approach, but
further work will be required to investigate for which indicators this is most helpful.

39 | P a g e
In the sections which follow, we look at each of the KE categories in turn, and suggest some
potential indicators which can be derived from the existing data and which might be useful as a
component of a benchmarking tool. This includes examples of the outputs of selected indicators,
including one which illustrates international comparisons. We have also included some discussion
about the data behind these indicators, what they are trying to measure, normalisation approaches
and other issues which may arise. As discussed, we have deliberately been quite comprehensive in
our benchmarking indicator suggestions, and would recommend that a smaller number of indicators
is selected to be taken forward in the first instance.
Within each category, we have also included some suggestions about additional indicators which
might be possible with additional data collection. These might shed some further light particularly on
the process improvement or outcomes focused aspects of KE benchmarking.
8.4 TECHNOLOGY TRANSFER (SPINOUTS AND LICENSING)
We have subdivided the Technology Transfer category into indicators which look at different stages
of the process: TTO processes focus on the internal workings of the office, whilst licensing and new
enterprises focus on the two key KE outcomes that might arise from this type of KE activity.
For this category of KE, we would suggest that normalisation is by research income, as that can be
used as a proxy for the scale of the underlying source for the inventions that are to be
commercialised. There is a significant difference in the amount of funding needed for research in
different disciplines, however, so this measure will not always reflect the underlying potential.
Cluster-based analysis can help in these situations by choosing to compare HEIs with similar
discipline mixes. Normalisation by academic FTE may therefore also be useful.
8.4.1 TTO PROCESSES
This sub-category of indicators looks at the inputs and processes of the TTO and so measures
efficiency of the process, more than effective KE. The suggested key indicator in this category is the
number of disclosures, which is a measure of the raw material that the office has to work with. In
broad terms, the higher the number of inventions that are disclosed, the higher the number of
downstream outputs (patents, licences, spin-offs) that would be expected. It is difficult to compare
across organisations, however, as they may define disclosures differently. For example, an HEI with
an informal approach to disclosures, which may log an entry following a telephone call with an
academic, might be expected to record more disclosures than an HEI which requires a certain level
of supporting information to be collected and presented before the project is counted as a
disclosure. These two extremes would be expected to have different rates of progress through the
process of disclosure, patent filing, patent grant and licensing too. The use of disclosures as an
indicator also runs the risk of providing an incentive for HEIs to prioritise quantity over quality of
their disclosures. This would be less important for disclosures than it might be for patent
applications.
KEY INDICATORS:
Indicator Data Source
Number of disclosures HE-BCI

40 | P a g e
SAMPLE INDICATOR: NUMBER OF DISCLOSURES – EXTERNAL TRENDS OVER TIME
To give the most insight, the benchmarking tool should be able to show trends over time, as well as
snapshots of information for a particular year. This will allow the HEIs to see how they are
progressing year on year, as well as how their performance is changing relative to their peers. The
graph below illustrates this, showing data for the past five academic years for the ten HEIs which
reported the highest number of disclosures in 2014/15. Some have shown steady progress over the
last few years, whilst others have had more variable performance.
Data source: HE-BCI survey Part B 2010/11 – 2014/15
OTHER POTENTIAL INDICATORS
Indicator Data Source
Number of disclosures per academic FTE HE-BCI/HESA Number of new patent applications filed in year HE-BCI
Number of patents filed per FTE HE-BCI/HESA Number of patents filed as a percentage of number of disclosures HE-BCI Number of new patents granted in year HE-BCI
Number of patents granted per FTE HE-BCI/HESA Number of patents granted as a percentage of number of disclosures HE-BCI

41 | P a g e
Indicator Data Source
Number of patents granted as a percentage of number of patents filed HE-BCI Cumulative patent portfolio HE-BCI
Number of active patents per FTE HE-BCI/HESA Number of licences + spin-offs as a percentage of number of disclosures HE-BCI
As discussed above, the number of patents filed, patents granted and licences/spin-offs achieved as
a percentage of the number of disclosures are measures which provide insight into the processes
and procedures of other HEIs, but are not very useful as benchmarking indicators, because in this
case higher numbers are not indicative of better or worse performance. There is also a time delay
between disclosure, filing and grant, so changes in these ratios may indicate a change in policy or
performance from a number of years previously. Some of these issues are illustrated in the graph
below, from a recent report by Imperial College, which demonstrates that different HEIs, all with an
excellent reputation for technology transfer performance, nevertheless have very different ratios of
disclosure to patent filing to patent grant. This is likely to be due to a combination of different
disclosure procedures, different hurdles for first patent filings, and perhaps different definitions of
patent filings and grants (new filings only or filings in all countries).
Patents filed and granted as a proportion of invention disclosures, 2009-2012 average
(Source: HE-BCI survey; literature research; team analysis)
Source: Imperial College London, Pathways to Societal Impact, 201629
The indicator using combined number of licences and spin-offs will also be heavily skewed by the
number of (software) licences, and so may mask other underlying trends.
The numbers of patents filed and granted are also difficult as indicators. It would be possible to gain
a high score in this category by filing several patents cheaply in one country, when a better strategy
for good knowledge exchange might be to spend the same resource to file one strong patent family
in several territories. Patents granted will also vary, depending on the policy of the HEI. Some HEIs
29 https://www.imperial.ac.uk/media/imperial-college/about/leadership-and-
strategy/public/ImperialCollegePathwaystoImpact.pdf

42 | P a g e
will not progress a patent to the grant stage (where high costs are incurred) if there is no external
interest in the technology, whilst others may take a broader range of applications through to grant.
OTHER POSSIBILITIES (DATA NOT CURRENTLY COLLECTED):
Number of disclosures per member of TTO staff (staff numbers no longer collected in HE-BCI
– other measures could also be normalised this way if the data were available, but difficult
to define consistently)
Number (%) of [research-active] academics which interact with the TTO
Customer satisfaction ratings (internal and external customers)
Use of performance targets (e.g. response to an initial invention disclosure within x days,
decision on protection within y weeks, response to external contacts within x days, etc.), and
reporting of the % achievement of the target
Could extend patent indicators to include measures of patent strength/quality (e.g. patent
citation, collaborative patents). This would require tools to mine patent data and link it to
each HEI and other inventors
Number of technologies being actively marketed (how to define ‘active marketing’? –
otherwise technologies may be left on the list to improve performance in this indicator
when it is unlikely that they will find a suitable partner)
Number of projects at each Technology Readiness Level (TRL)
Amount of translational/commercialisation funding deployed
Process indicators are generally an area of interest for those managing and running the TTO; they
want to understand their efficiency and effectiveness compared with others with similar levels of
support. This requires underlying information about office structures and staff
number/qualifications which is no longer collected by the HE-BCI survey due to the difficulty of
getting consistent definitions. Similarly, there is interest in the policies and procedures adopted by
other HEIs; some of these are made public, but by no means all, and some may not have policies in
place at all.
The list above includes some process-based indicators and performance targets which may be useful
to drive improvements in efficiency. This approach is less likely to impact directly on the outcomes of
KE, but if done correctly could simplify the experience of working with an HEI which should in turn
increase the number and depth of interactions. This could also directly address some of the common
areas of concern that are raised by external organisations regarding their dealings with HEIs. As
discussed in section 5, we are aware of at least one research-intensive university which is taking this
approach and publicising the results internally.
We would suggest that performance indicators would be more suitable in the context of KE than
customer satisfaction ratings. A TTO which is performing a good job in negotiating an agreement
which benefits both sides and protects the HEI interests fairly may not necessarily please both its
internal and external customers.

43 | P a g e
8.4.2 LICENSING
The value of licences granted, normalised by research income, has been suggested as the key
indicator in this sub-section. However, the value of licensing income which can be attained is very
dependent on the subject matter of the licence. For example, a single licence for a compound which
becomes a blockbuster drug may yield many millions in royalty revenue over its lifetime. On the
other hand a software product may deliver only small licence fees, but can be licensed many times
over to different users. In terms of overall KE, revenue is not the only measure of success, and in
some cases an alternative strategy to maximise uptake and impact (particularly for software, where
open source approaches are increasingly used) may be to license widely and for free.
KEY INDICATORS:
Indicator Data Source
Value of licences granted by research income HE-BCI/HESA
The income returns from a licence will also vary over the course of the lifetime of the licence, so
figures which are collected by year will not give a good overall picture of the value of that licence.
In licensing, success is often a result of the right technology being in the right place at the right time
and finding the right partner to take it on. The influence that KE processes can have on this is
limited, and the ultimate revenue success will depend more on the partner activities than those in
the HEI.
OTHER POTENTIAL INDICATORS:
Indicator Data Source
Total number of licences granted HE-BCI Number of licenses granted per FTE HE-BCI/HESA
Total number of licences granted by research income HE-BCI/HESA Value of total licence income HE-BCI Value of total licence income by FTE HE-BCI/HESA Licence average income (non-software) HE-BCI Licence average income (software) HE-BCI % of licences generating income (non-software) HE-BCI % of licences generating income (software) HE-BCI
Insight into some of the factors discussed above may be obtained by these indicators. Again, for
many of these suggested indicators, a higher number will not necessarily demonstrate more
effective KE, but may allow different approaches to be identified and questioned.
International comparisons may be possible for this category, but the information gathered on
licensing income does not map directly to the information available in the UK.
OTHER POSSIBILITIES (DATA NOT CURRENTLY COLLECTED):
Number of products or services launched based on licensed IP
Number of non-exclusive, royalty-free licences (NERFs) granted
Number of patents granted per licence (this will depend heavily on the subject matter of the
patent)

44 | P a g e
To get closer to the potential outcomes of the licensing process, it would be useful to look at the
products and services which arise from the licence. This information is not currently collected in the
UK, but is in some other countries such as Ireland.
Another area of potential interest would be to compare the deal structures and values which are
obtained by other HEIs in their agreements with industry, as is being collected by AUTM in their
TransACT database30.
8.4.3 NEW ENTERPRISES (SPIN-OFFS + START-UPS)
New enterprises include all types of company associated with an HEI, whether or not they are
formally based on intellectual property from the HEI, and whether or not the HEI holds equity in the
company. The HE-BCI survey distinguishes between spin-offs (which are companies set-up to exploit
IP that has originated from within the HEI), start-ups (which are set up by staff or students, but are
not based on IP from the HEI) and social enterprises. There are some challenges in this category,
because measures which are closer to the outcomes of the KE (for example, company turnover or
number of FTEs) can be difficult for an HEI to collect, particularly as the company grows and
becomes less dependent on its HEI.
KEY INDICATORS:
Indicator Data Source
Number of FTEs employed by active new enterprises HE-BCI
The data on number of FTEs employed by active new enterprises may be difficult to collect
accurately, but it does give a better estimate of the impact of the companies on the economy. It
does, however, underestimate the contribution made by companies which are high growth, and
raise high investment and/or generate high turnover, but do not employ many staff, and it may be
appropriate to include a separate key indicator for one of these metrics. Another alternative for the
key indicator could be the total number of active spin-offs, perhaps normalised by research income.
This would be a simpler and more accurate measure, but runs the risk of becoming a perverse
incentive, encouraging the formation of companies over other more suitable KE mechanisms.
OTHER POTENTIAL INDICATORS:
Indicator Data Source
Total active spin-offs HE-BCI Total active spin-offs per FTE HE-BCI/HESA Total active spin-offs by research income HE-BCI/HESA Total sustainable spin-offs (>3 years old) HE-BCI Total sustainable spin-offs (>3 years old) per FTE HE-BCI/HESA Total sustainable spin-offs (>3 years old) per research income HE-BCI/HESA Average spin-off FTE over 3 years by research income HE-BCI/HESA Turnover from active spin-offs HE-BCI Average turnover per active spin-off HE-BCI Spin-off turnover per academic FTE HE-BCI/HESA Spin-off turnover by research income HE-BCI/HESA
30 http://www.autm.net/resources-surveys/research-reports-databases/transact-database/

45 | P a g e
Indicator Data Source
External investment in active spin-offs HE-BCI Average investment per active spin-off HE-BCI
Each of these indicators may also be measured for start-ups, spin-offs and social enterprises
combined. The HE-BCI survey collects information about active spin-offs, and which of these have
survived for more than three years, which is a measure of their sustainability. It can also be difficult
to determine when a spin-off ceases to be an active spin-off associated with the HEI. For example, if
a spin-off company merges with a larger existing company, then is the new entity still an HEI spin-
off? Does it make a difference in this case whether the HEI retains an equity position in the new
entity or not? Spin-off turnover and investment are also difficult to collect, and are significantly
influenced by the spin-off management, as well as the HEI.
It may be possible in this category to make some international comparisons, but this will be
constrained by the information which is collected across countries, which is quite limited. For
USA/Canada, the data are limited to number of spinouts (which may be defined differently from the
HE-BCI definitions), with some info on which of these they hold equity in, were founded by
researchers, are operational, or are located in their home state. For ASTP-Proton (European data),
the data cover number of spinouts, number of start-ups and total investment raised to date.
OTHER POSSIBILITIES (DATA NOT CURRENTLY COLLECTED):
Share capital held – annual valuation of HEI share portfolios. This information should be held
by the HEIs for their own accounting purposes
Number of successful exits; market value on exit
More comprehensive information about the nature of the new enterprises. Databases such
as Spinouts UK31 and Beauhurst32 collect some additional data, but do not cover all HEI
companies and do not have complete data sets
More information could be collected from Companies House data, but this is limited for
smaller companies and would require significant investment in data collection and
interpretation to match HEIs to specific companies. Once set up, this would be possible to
automate; the difficulty is in identifying and updating the list of companies that are
associated with each HEI.
Interpretation of success factors in this category is further complicated because not all new
enterprises have the same aims. For example, a small consultancy company, a virtual company set
up to develop a technology to the point where it can be sold or licensed, and a high growth
technology company all have very different attributes, with different indicators of success.
Technology arising in HEIs may be exploited via licensing or by spinning out, and so the technology
based companies that are formed are likely to be based on technology that would not be better
exploited by licensing, and so will have a different profile from the general population of technology
based companies. This means that they are inherently more risky ventures, as they are developing
31 http://www.spinoutsuk.co.uk 32 http://about.beauhurst.com/

46 | P a g e
disruptive technologies, or developing new markets, or exploring multiple exploitation routes, or
entering rapidly growing markets.
8.4.4 OVERALL IP INCOME
The final subcategory looks at overall IP income. This is one area where some international
comparisons can be made, although there are some caveats about whether it is possible to compare
like with like across different data collection systems.
KEY INDICATORS:
Indicator Data Source
Total IP income as a % of total research income HE-BCI/HESA

47 | P a g e
SAMPLE INDICATOR: IP INCOME NORMALISED BY RESEARCH INCOME/EXPENDITURE –
INTERNATIONAL COMPARISON
The data for this indicator illustrate some of the difficulties of making comparisons across countries.
The graph below plots the total IP income relative to research value for individual HEIs in four
countries which collect and report this data. For each country, normalising in this way compensates
for the different scales of the HEIs in the different countries. It also removes the need to use a
currency conversion, as each figure (e.g. £ income per £1,000 research or $ income per $1,000
research) is directly comparable. However, there are differences between how the income figures
are split in each country, and the total IP income figures may be interpreted in different ways in each
country. The data which are available for normalisation are also different: in the UK, the figure
reported is the level of research income, whilst in the other countries it is the level of research
expenditure, which will not be exactly equivalent. Normalising by academic FTE would be an
alternative approach, but these numbers are not published centrally by the other countries.
From the graphs, it can be seen that the overall distribution is similar in all these countries, with one
or two high performing outliers which skew the overall data, tailing off fairly rapidly to a long tail of
mid and lower performing institutions at a similar level internationally.
Data sources: HE-BCI survey Part B 2013/14, HESA finance record 2013/14,
AUTM STATT database 2013/14, NSRC survey 2014

48 | P a g e
The following chart shows the 25 top performers across all these countries, colour coded to show
where they are based.
Data sources: HE-BCI survey Part B 2013/14, HESA finance record 2013/14
AUTM STATT database 2013/14
NSRC survey 2014
OTHER POTENTIAL INDICATORS:
Indicator Data Source
Ratio of total IP income to total IP costs HE-BCI
This indicator may give a measure of the return on investment for IP spend. However, the data on IP
costs are likely to be collected in different ways by different TTOs, and so may not be consistently
defined. Lag is also an issue, as changes in spending may not affect income levels for many years.

49 | P a g e
8.5 RESEARCH CONTRACTS AND STRATEGIC RESEARCH PARTNERSHIPS
In research-active HEIs, this category of KE activity is typically the largest in terms of income
received, and so is seen of high importance. It includes activities from collaborative research (where
both parties input funds and/or resources and the outcomes are unknown), through contract
research (which is wholly funded by the external party and the programme of work is well defined),
to consultancy (which is wholly funded by the external party, and which utilises the existing skills and
knowledge of the academic, rather than developing new knowledge). The boundaries between these
activities are not always clear-cut, and the delivery mechanisms chosen for a specific piece of work
may also be influenced by the policies, processes and reward systems within the HEI. For these
reasons, some of those that we spoke to will combine two or all of the activities in their
benchmarking analysis, in order to smooth out these differences and allow easier comparison across
institutions and years. In the key indicators, we have suggested that collaborative and contract
research are analysed together, but that consultancy is treated as a separate activity. This is because
consultancy occurs across a wider range of HEIs (including those which do not have a high level of
research activity) and usually has lower costs. However, collaborative research and contract research
are separate activities with different characteristics, and so are also considered separately in the
additional indicators listed below.
For the same reasons, the normalisation approach that we suggest for collaborative and contract
research is by the level of research income, whilst for consultancy it is by the level of combined
research and teaching income, or by academic FTE.
Another suggested aggregation route is to combine activities which are wholly funded by an external
party (contract research, consultancy, use of facilities and equipment), and to treat those separately
from activities which use public co-funding (collaborative research). Some indicators which use this
approach have also been suggested below, but there is some overlap between these indicators
below, and further investigation is needed to determine which approaches are the most useful.
In this category, the data which are available are very focused on activities (i.e. the volume and value
of the interactions) rather than outcomes (i.e. what value is created for the partner by these
interactions). This latter information is much harder to obtain and analyse, but may become more
visible alongside the increased interest in the ultimate impact of HEI activities.
KEY INDICATORS:
Indicator Data Source
Total collaborative research + contract research income as a % of total research income
HE-BCI/HESA
Value of consultancy engagements per FTE HE-BCI
The numbers of these different types of engagement are also often used by HEIs as indicators of
their activity, alongside their income levels. However, the HE-BCI data only collects numbers of
engagements for contract and consultancy, but not for collaborative research projects (where it
would not be a useful comparator), and so we have suggested that income levels would be most
suitable for the key indicators.

50 | P a g e
SAMPLE INDICATOR: INCOME FROM CONSULTANCY – NORMALISED BY FTE
The graph below shows the outputs of the proposed indicator showing the value of the average
consultancy income received by the HEI for each academic FTE. The graph includes some HEIs with a
relatively small number of staff, and likely to have a high proportion of these contributing to the
consultancy income.
Data source: HE-BCI survey Part B 2014/15, HESA staff record 2014/15
OTHER POTENTIAL INDICATORS:
Indicator Data Source
Total collaborative research income HE-BCI Total collaborative research income per FTE HE-BCI/HESA
Total collaborative research income as a % of total research income HE-BCI/HESA Non-academic collaborative research contribution as a percentage of the
amount of public collaborative research funding (leverage) HE-BCI
Ratios of collaborative research income by funding source HE-BCI Value of contract research income HE-BCI Value of contract research income per FTE HE-BCI/HESA
Total contract research income as a % of total research income HE-BCI/HESA

51 | P a g e
Indicator Data Source
Ratios of contract research income by partner type HE-BCI Count of contract research income HE-BCI Count of contract research income per FTE HE-BCI/HESA Ratios of number of contract research contracts by partner type HE-BCI
Value of consultancy engagements HE-BCI Value of consultancy engagements per FTE HE-BCI
Total consultancy income as a % of total research and teaching income HE-BCI Ratios of consultancy income by partner type HE-BCI
Count of consultancy engagements HE-BCI Count of consultancy engagements per FTE HE-BCI
Ratios of number of consultancy engagements by partner type HE-BCI Value of ‘commissioned’ income (contract + consultancy + facilities and equipment)
HE-BCI
Value of ‘commissioned’ income (contract + consultancy + facilities and equipment) as a % of total research income
HE-BCI
Value of ‘commissioned’ income (contract + consultancy + facilities and equipment) per FTE
HE-BCI
Academic-corporate collaborative outputs (papers, etc.) as percentage of total outputs
Scopus, Web of Science, Google Scholar
Number of academic-corporate collaborative outputs per FTE Scopus, Web of Science, Google Scholar
OTHER POSSIBILITIES (DATA NOT CURRENTLY COLLECTED):
Research Office, Consultancy Office, etc. process-based indicators, e.g. contract turnaround
time, number of inactive contracts with no action logged for >Xdays/months, number of
slow-moving contracts which have been in negotiation for >Xdays/months, etc.
Use of performance targets (e.g. response to contract action within x days) and reporting of
the % achievement of the target
Customer satisfaction ratings (internal and external customers). These are more difficult,
because large data sets are typically required to allow comparisons, and in the context of KE,
negative responses will be reported much more frequently than positive ones
Would be very useful to be able to compare e.g. time taken for HEI-industry contracts with
that taken for industry-industry contracts, but no known source of this data
Repeat business (year-on-year improvement) vs new customers (year-on-year
improvements)
Funding application success rates for collaborative/consultancy/contract research
Industry-funded – would it be useful to split this down by subject area?
Number (%) of research-active academics which interact with the Research Office on
projects involving external (non-academic) partners (how to define/measure?) e.g. number
of registered consultants
Number of companies engaging (rather than number of agreements)? Average value per
company per year

52 | P a g e
Surplus generated (how to define and measure?)
Number of strategic partners (how to define?). Strategic partnerships are increasingly seen
as important, but hard to define and measure, as this will vary depending on the viewpoint
of the HEI. Depth of engagement (e.g. number of different instances and types of KE
engagement with a specific company) may be easier to use as a measure. HEI interest in
building strategic partnerships is likely to be driven more strongly by near-term income
streams than in increasing the KE engagement and strengthening the KE outcomes
As with the Technology Transfer cluster, we have suggested that process-based indicators and
performance targets may be useful to drive improvements in efficiency. This approach is less likely
to impact directly in the short term on the outcomes of KE, but if done correctly could simplify the
experience of working with an HEI which should in turn increase the number and depth of
interactions. This could also directly address some of the common areas of concern that are raised
by external organisations regarding their dealings with HEIs.
We would suggest that performance indicators would be more suitable in the context of KE than
customer satisfaction ratings. A Research Office which is performing a good job in negotiating an
agreement which benefits both sides and protects the HEI interests fairly may not necessarily please
both its internal and external customers. As with other areas, reputation of the HEI is a key driver,
but is very hard to measure. Repeat business would perhaps be a more useful way to demonstrate
and measure customer satisfaction.
8.6 SMALL AND MEDIUM-SIZED ENTERPRISES
Small and medium-sized enterprises have been suggested as a separate category of KE activity
because several HEIs have a specific focus on support for this type of company in their local
community, and it is also a priority for government. For some other HEIs, global multinationals may
be a more appropriate partner category. We have addressed this by devising some indicators which
seek to understand the ratio of activity between SMEs and larger companies – the desired balance
between these will depend on the aims and mission of the specific HEI.
In this category, the use of clusters based on regional company density and mix may be helpful, as
much of the SME activity for an HEI will be with local companies.
Normalisation in this category has been suggested by academic FTE to account for scale effects, as
the level of SME engagement across the different types of activity is unlikely to be heavily
dependent on the research/teaching mix of the HEI. SME income also tends to include a higher
proportion arising from facilities & equipment (27% in 2014/15, compared with a 5% contribution
from facilities & equipment to the total KE HEI income figures). FTE numbers would be less
appropriate to normalise this aspect therefore.
It is also useful to understand the relative level of activity with SMEs compared with large industry.

53 | P a g e
KEY INDICATORS:
Indicator Data Source
Total SME income (licence income + contract + consultancy + CPD + facilities & equipment) per academic FTE
HE-BCI/HESA
SME income as a % of total industry income HE-BCI
The suggested key indicators for the SME category focus on income from the complete range of
different types of activity that can be split in this way, to reflect a broad approach to engagement.
However, the suggested income cannot include collaborative research, which is not collected by
type of organisation in the HE-BCI data, and so is likely to miss an important category of relevant
income. Collaborative research tends to be one of the largest components of the range of KE
income, and so by excluding it there is a danger that the overall picture is skewed. There may also be
differences in scale of the income that arises from the other different components of the
benchmark, which might mask some subtleties in the individual parts.
SAMPLE INDICATOR: SME INCOME – GEOGRAPHIC CLUSTER COMPARISON
The graph below shows the outputs of the proposed indicator comparing the ratio of SME income to
income from other commercial businesses. This has been shown for a small group of HEIs based in a
similar geographical area, which might be expected to be interacting with a similar population of
SME companies. The graph illustrates how some of these have a much stronger focus on SMEs,
whilst others are working much more with larger companies. As the indicator is shown in percentage
terms, it removes the issue of scale of activity allowing it to focus on to relative importance of SMEs
to the organisation.
Data source: HE-BCI survey Part B 2014/15
OTHER POTENTIAL INDICATORS:
Indicator Data Source
Total SME income (licence income + contract + consultancy + facilities and equipment)
HE-BCI
Ratio of SME income between categories (licences, consultancy, contract, CPD, facilities & equipment)
HE-BCI

54 | P a g e
Indicator Data Source
Count of SME engagements (licences, contract + consultancy + facilities & equipment)
HE-BCI
Ratio of count of SME engagements to total count of commercial business engagements
HE-BCI
CPD income for SMEs HE-BCI CPD income for SMEs per FTE HE-BCI/HESA CPD income for SMEs as a % of total commercial business CPD income HE-BCI Business school Small Business Charter rating (Gold/Silver/Bronze) if applicable
smallbusinesscharter.org
Composite index of responses relating to SME activity in HE-BCI Part A (Q1 (selected), Q9 (selected))
HE-BCI
The composite index indicator is suggested as an attempt to understand the different types of
support that each HEI offers to SMEs, based on the answers to the qualitative questions in Part A of
the HE-BCI return. However, this type of indicator will be limited in its usefulness, as it is based on
the presence or absence of a type of support, and cannot give any information about the scale or
quality of that activity. As HEIs have developed their range of KE activities and support, many will
now have introduced measures which allow them to answer ‘yes’ to the questions in Part A, so this
type of indicator may not be very useful in distinguishing between different HEIs.
The Small Business Charter rating will be a helpful category for those HEIs that have eligible business
schools. However, there will be other HEIs without a business school which are not eligible, but are
still providing the type of KE that is rated by this charter.
OTHER POSSIBILITIES (DATA NOT CURRENTLY COLLECTED):
Collaborative research income cannot be usefully split by industry type in HE-BCI, so cannot
be included here, which will exclude an important category of KE activity with SMEs. Other
categories of KE interactions with SMEs are also not identified by the HE-BCI data (e.g.
student placements, sponsorships, workshops, etc.)
Knowledge Transfer Partnerships (KTPs) with SMEs (value or % of total). KTPs are seen by
the profession as a very important mechanism for SME engagement, and the data that
would allow this indicator to be calculated is collected, but is not split in this way in the
publicly published reports of activity. However, it may be too detailed to focus down to
specific schemes.
Repeat business (year-on-year improvement) vs new SME partners (year-on-year
improvements)
Extend the criteria for Small Business Charter (SBC) awards to HEIs providing these facilities
and services outside a Business School environment? Or make the SBC award available to
the central unit responsible for SME engagement if not within a business school?
8.7 ENTERPRISE/ENTREPRENEURSHIP
This category includes activities relating to enterprise and entrepreneurship both for staff and for
students. Student Enterprise is an area of increasing interest and activity in many HEIs at the

55 | P a g e
moment, and many HEIs are bringing in comprehensive support programmes for their students,
outside the normal curriculum. We have divided the potential indicators below into those that relate
to activities with staff and those with students. Traditionally, the staff enterprise activities have been
more closely measured. For example, staff start-ups will more often be set up in collaboration with
the TTO, whilst this is less common for student start-ups. The data on staff start-ups will therefore
be more robust than for graduate start-ups, but is still likely to miss activity, especially for small
consultancy-based companies.
The data collected by HE-BCI which relate most directly to enterprise and entrepreneurship
indicators focus on start-ups, which is only a small part of this type of activity. Although staff start-
ups can be viewed as an indicator of independent entrepreneurial activity, many other types of KE
will also involve and require entrepreneurial staff, but cannot easily be measured and linked to this
category. The different types of start-up which are defined by HE-BCI may also be influenced by HEI
policy in how these companies can arise. Low numbers of staff start-ups may therefore simply reflect
the approach that is usually taken to company formation, rather than a lack of staff engagement.
The indicators proposed in this section are therefore not a very good reflection of overall enterprise
activity in an organisation.
Normalisation in this category is most appropriate by the number of individuals who could engage in
the activity, i.e. by academic FTE for staff enterprise, and by student number for student enterprise.
KEY INDICATORS (STAFF):
Indicator Data Source
Staff start-ups surviving 3 years as a % of total companies formed surviving 3 years
HE-BCI

56 | P a g e
SAMPLE INDICATOR: STAFF START-UPS SURVIVING FOR 3+ YEARS
The graph below shows the outputs of the proposed indicator on staff start-ups. To avoid the effects
of HEIs which only have one or two start-ups, the data have been limited to those HEIs which have at
least 10 staff start-ups which are still active three or more years after formation.
Data source: HE-BCI survey Part B 2014/15
KEY INDICATORS (STUDENTS):
Indicator Data Source
Graduate start-ups surviving 3 years as a % of total companies formed surviving 3 years
HE-BCI
For student activity, we have suggested a key indicator above; however we do not feel that the data
are as robust for this indicator as for others. The most useful information in the currently available
data is on graduate start-ups, but this does not include a wide range of other potential outcomes of
student entrepreneurship, which might also cover student external placements and projects, app
development, consultancy, design work, creative arts, etc. These types of activity are likely to be
much more common and relevant, but not are not measured consistently and collected. The
proposed indicator is therefore a poor proxy for the wide range of potential activity that might be
happening within the HEI, but is the best available using existing data. There are also differences
between organisations in which type of students are able to benefit from the enterprise support
schemes. For some this will focus on post-graduate students, whilst others are setting up
programmes for under-graduates as well.

57 | P a g e
OTHER POTENTIAL INDICATORS (STAFF):
Indicator Data Source
Staff start-ups as a % of total companies formed HE-BCI Number of staff start-ups per academic FTE HE-BCI/HESA Number of staff start-ups surviving 3 years per academic FTE HE-BCI/HESA Employment, turnover and external investment of staff start-ups (as a % of total start-ups)
HE-BCI
Composite index of responses relating to entrepreneurship in HE-BCI Part A (Q1 (selected), Q7, Q9 (selected), Q14, Q16 (selected), Q17 (selected), Q18)
HE-BCI
As discussed in the section on SMEs, the suggested composite index may not reveal sufficient
differences between HEIs to be useful.
OTHER POTENTIAL INDICATORS (STUDENTS):
Indicator Data Source
Number of leavers self-employed or setting up own business as a % of number of leavers employed
DLHE
Graduate start-ups as a % of total companies formed HE-BCI Number of graduate start-ups per student number HE-BCI/HESA Number of graduate start-ups surviving 3 years per student number HE-BCI/HESA Employment, turnover and external investment of graduate start-ups (as a % of total start-ups)
HE-BCI
OTHER POSSIBILITIES (DATA NOT CURRENTLY COLLECTED):
Number (%) of students receiving entrepreneurship support/engaging in KE activity (outside
normal teaching activity) (how to define and measure? Could use a funnel definition, based
on numbers involved with increased intensity of interaction from engaging through
empowering to tailored support). This could also be measured by hours of enterprise time
received, rather than number of students
Number (%) of students achieving other types of entrepreneurship outcomes, which would
need to be identified and defined. Examples include: app development, consultancy, design
work, creative arts, etc.
Number of student placements/projects with external organisations per student number
Availability/uptake of student accelerator facilities (how to define and measure?)
Number (%) of academics engaged with KE
Number of academics attending internal KE training courses. This could also be measured by
hours of enterprise time received, rather than number of academics
Amount of proof of concept/seed funding raised (how to define and measure?)
% staff consultancy time
Number of visits to or from external non-academic organisations
For this category, process-based indicators such as the number of students or staff engaging with KE
activity would be most relevant, as they can then cover the wide range of activities that might be
involved. However, this information is not currently collected, and would be hard to define. A recent
study by researchers at Imperial College (see section 5.2) found that large amounts of activity by
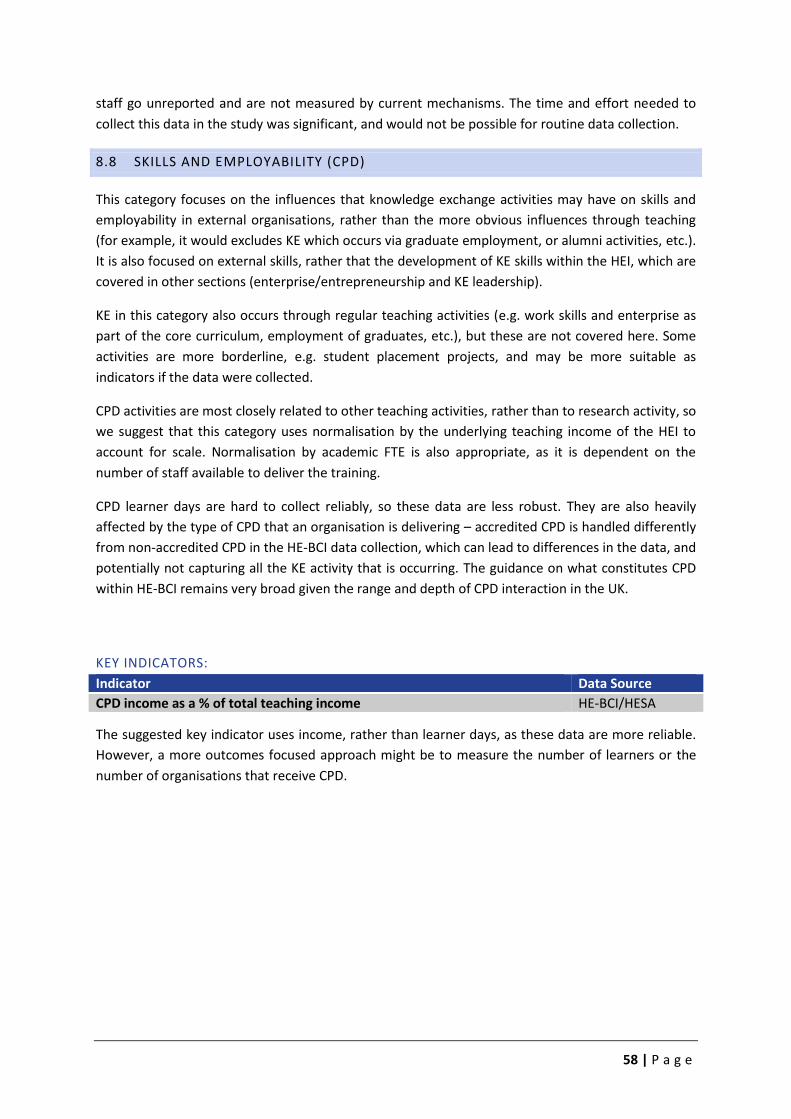
58 | P a g e
staff go unreported and are not measured by current mechanisms. The time and effort needed to
collect this data in the study was significant, and would not be possible for routine data collection.
8.8 SKILLS AND EMPLOYABILITY (CPD)
This category focuses on the influences that knowledge exchange activities may have on skills and
employability in external organisations, rather than the more obvious influences through teaching
(for example, it would excludes KE which occurs via graduate employment, or alumni activities, etc.).
It is also focused on external skills, rather that the development of KE skills within the HEI, which are
covered in other sections (enterprise/entrepreneurship and KE leadership).
KE in this category also occurs through regular teaching activities (e.g. work skills and enterprise as
part of the core curriculum, employment of graduates, etc.), but these are not covered here. Some
activities are more borderline, e.g. student placement projects, and may be more suitable as
indicators if the data were collected.
CPD activities are most closely related to other teaching activities, rather than to research activity, so
we suggest that this category uses normalisation by the underlying teaching income of the HEI to
account for scale. Normalisation by academic FTE is also appropriate, as it is dependent on the
number of staff available to deliver the training.
CPD learner days are hard to collect reliably, so these data are less robust. They are also heavily
affected by the type of CPD that an organisation is delivering – accredited CPD is handled differently
from non-accredited CPD in the HE-BCI data collection, which can lead to differences in the data, and
potentially not capturing all the KE activity that is occurring. The guidance on what constitutes CPD
within HE-BCI remains very broad given the range and depth of CPD interaction in the UK.
KEY INDICATORS:
Indicator Data Source
CPD income as a % of total teaching income HE-BCI/HESA
The suggested key indicator uses income, rather than learner days, as these data are more reliable.
However, a more outcomes focused approach might be to measure the number of learners or the
number of organisations that receive CPD.

59 | P a g e
SAMPLE INDICATOR: CPD INCOME – COMPARISON OF NORMALISATION METHODS
The table below shows the outputs of the proposed indicator comparing the level of CPD income to
the total teaching income of the HEI. For comparison, the data are also shown as total figures
without normalisation, and normalised by the number of academic FTEs. In each case, the
10 organisations which rank highest by each measure are highlighted. This illustrates that some
organisations perform well by all methods, whilst others are seen to be performing better for their
size than the underlying figures might suggest.
Institution
2014/15
CPD income (£000s)
per £100million
teaching income
2014/15
CPD income (£000s) per
1,000 academic FTEs
2014/15
TOTAL CPD REVENUE
(£000s)
The National Film and Television School 71,293
No academic FTEs/no
data 2,779
Liverpool School of Tropical Medicine 45,928 7,784 1,331
London Business School 37,355 397,105 41,696
University of London (Institutes and activities) 36,550 380,519 19,787
Conservatoire for Dance and Drama 33,482 29,556 3,990
Cranfield University 29,110 33,218 20,396
Queen Margaret University, Edinburgh 25,787 14,813 3,244
University of the Highlands and Islands 22,374 77,862 2,258
The University of Strathclyde 20,970 12,983 18,021
The Robert Gordon University 16,780 10,937 6,103
Anglia Ruskin University 11,714 18,546 16,803
Southampton Solent University 11,183 15,675 9,797
The University of Lincoln 10,850 14,153 10,332
Cardiff University 10,601 8,805 23,298
London School of Economics and Political Science 10,029 15,376 16,714
The University of Oxford 9,712 3,845 25,802
King's College London 9,226 6,162 21,790
The University of Cambridge 8,654 3,654 19,566
The University of Manchester 4,282 3,657 17,435
Data source: HE-BCI survey Part B 2014/15, HESA finance record 2014/15, HESA staff record 2014/15
OTHER POTENTIAL INDICATORS:
Indicator Data Source
Total CPD income HE-BCI CPD income per FTE HE-BCI/HESA Total CPD learner days HE-BCI CPD learner days per academic FTE HE-BCI/HESA Average CPD income per learner HE-BCI Composite index of responses relating to CPD and training activities in HE-BCI Part A (Q1 (selected), Q16 (selected), Q17 (selected), Q25, Q28)
HE-BCI
As discussed in the section on SMEs, the suggested composite index may not reveal sufficient
differences between HEIs to be useful.

60 | P a g e
OTHER POSSIBILITIES (DATA NOT CURRENTLY COLLECTED):
Repeat business (year-on-year improvement) vs new CPD client companies (year-on-year
improvements)
Number of inward secondments per academic FTE
Number of outward secondments per academic FTE
Number of student placements/projects with external organisations per student number
Ratio of accredited to non-accredited CPD (not all is collected by HE-BCI)
8.9 PHYSICAL INFRASTRUCTURE – EQUIPMENT & FACILITIES
KE relating to services arising from equipment and facilities may take many different forms,
depending on the nature of the institution, and this is a category which would be expected to vary
depending on the underlying nature of the HEI. For example, income could come from specialised
scientific instruments, from the hire of lecture theatres, or from the use of concert halls. Access to
these facilities is very often wrapped up into a wider collaborative, contract or consultancy project,
and so is not always measured as a discrete activity.
There is no one normalisation approach that is likely to be appropriate for all of these types of use,
and so the key indicator proposed is not normalised. Where normalisation is used, it is most
appropriate to use the number of academic FTEs, or the total research and teaching income to
represent the scale of the HEI and the level of facilities that they may have.
Discipline mix is very important, and it would be useful to be able to categorise this information by
discipline, or at least by Arts vs Science & Technology facilities.
KEY INDICATORS:
Indicator Data Source
Total facilities and equipment income HE-BCI

61 | P a g e
SAMPLE INDICATOR: FACILITIES & EQUIPMENT INCOME – ARTS & DESIGN CLUSTER
The table below shows the outputs of the proposed indicator on income from facilities and
equipment. Income in this category could come from a wide range of types of facility, and their value
and potential usage rates will vary considerably. For example, HEIs specialising in performance arts
may have concert facilities which are available for hire. In the chart below, we therefore focus on the
proposed cluster of arts and design HEIs.
Data source: HE-BCI survey Part B 2014/15
OTHER POTENTIAL INDICATORS:
Indicator Data Source
Total facilities and equipment income per FTE HE-BCI/HESA Facilities and equipment income as a % of total research + teaching income HE-BCI/HESA Composite index of responses relating to equipment and facilities in HE-BCI Part A (Q1 (selected), Q16 (selected), Q17 (selected), Q23 (selected))
HE-BCI

62 | P a g e
As discussed in the section on SMEs, the suggested composite index may not reveal sufficient
differences between HEIs to be useful.
Some organisations would view the use of equipment and facilities as a part of the contract research
– consultancy – facilities continuum of ‘commissioned’ rather than collaborative research and would
analyse these income sources as a whole to compensate for differences of approach between
different years and/or different HEIs (this has been included under potential indicators for Research
Contracts, but may also be relevant here).
OTHER POSSIBILITIES (DATA NOT CURRENTLY COLLECTED):
Repeat business (year-on-year improvement) vs new clients for facilities and equipment
(year-on-year improvements)
Science park and incubator activity (NB cross over with anchor and place-making section) –
how to measure, is any common data collected? e.g. incubator space, % occupancy rates,
number of tenant companies, graduation rate, turnover of tenant companies, average
incubation time, survival rates, employment figures for tenant companies, mentoring
provision
Use of facilities and equipment by discipline
The activities in science parks, incubators and similar facilities are very important to the
organisations which have these facilities, and these have the potential for collection of a range of
activity and outcomes data. Some suggestions are given above, and the UK Science Parks Association
(UKSPA) collects data on Science Park activities on an annual basis. Summary information is available
here33 alongside UKSPA Research Papers. Members can download detailed analysis and additional
resources, and this may be an additional source of useful information for the benchmarking tool.
However, not all HEI-associated incubators and science parks will be members of UKSPA, and so
coverage of this survey will not be complete.
8.10 ANCHOR OR PLACE-MAKING ROLE OF UNIVERSITIES
This category of KE activity is difficult to define as a stand-alone category, as many of the activities in
the other categories will contribute to the role that the HEI plays within its local community. This is
reflected in the cross-cutting position of the category in the KE schematic in section 8.2. The only
metrics within the HE-BCI survey that relate directly to this category are those dealing with
regeneration income, or to attendance at public events such as lectures. The regeneration data will
only apply to HEIs which are located within an area that qualifies for regeneration. The data on event
attendance are not well collected, and are subject to differences in interpretation of which events
should be counted. We therefore do not suggest any key indicators specifically for this category, but
instead this category will cover a range of the key indicators from the other categories.
KEY INDICATORS:
None.
33 http://www.ukspa.org.uk/our-sector#sthash.jgbdDHkA.dpuf

63 | P a g e
OTHER POTENTIAL INDICATORS:
Indicator Data Source
Total regeneration income HE-BCI/HESA Total regeneration income per FTE HE-BCI/HESA Regeneration income as a % of total research and teaching income HE-BCI/HESA
Total attendees at designated public events HE-BCI Total attendees at designated public events per FTE HE-BCI Ratio of attendees at public events (lectures: performance arts: exhibitions: museum education: other)
HE-BCI
Collaborative outputs (papers etc.) with collaborators within 100 km of the HEI as a % of total outputs
CWTS Leiden ranking
Number of collaborative outputs with collaborators within 100km of the HEI per FTE
CWTS Leiden ranking
Composite index of responses relating to local/regeneration activities in HE-BCI Part A (Q1 (selected), Q4 (selected), Q16 (selected), Q17 (selected), Q23, Q24, Q27, Q28)
HE-BCI
As discussed in the section on SMEs, the suggested composite index may not reveal sufficient
differences between HEIs to be useful.
OTHER POSSIBILITIES (DATA NOT CURRENTLY COLLECTED):
Board/committee participation in LEP activities
Smart specialisation – how to measure, not applicable to all regions
SME activity will often be local (but not currently categorised this way), as will social
enterprise activity
% of income (split by category) that derives from local organisations (LEP boundaries might
be suitable, but this data may be difficult to compile)
Number of companies within x miles of the HEI which have a contractual relationship with
the HEI
Science park and incubator activity (NB cross over with physical infrastructure section) –
how to measure, is any common data collected? e.g. Incubator space, % occupancy rates,
number of tenant companies, graduation rate, turnover of tenant companies, average
incubation time, survival rates, employment figures for tenant companies, mentoring
provision
Active participation in networks and hubs (how to define and measure?)
If the geographical source of the different types of KE income were available, this might be a suitable
way to measure the anchor role of the HEI, but this would require significant effort to categorise in
this way.
As discussed in the section on physical infrastructure, science park and incubator activities will be
very important to those HEIs which have these, but the data are not routinely available to allow
comprehensive benchmarking of these areas at present.

64 | P a g e
8.11 (KE) LEADERSHIP, MANAGEMENT AND BROADER ENVIRONMENT
This category aims to capture the effects that strong institutional leadership in KE has on
performance. It includes areas such as leadership and governance, organisational systems, strategy,
institutional culture, and incentives and rewards. As such, it more a qualitative than a quantitative
category, and may not be amenable to benchmarking measurements at all, but some suggestions
are made below as to how this might be approached. Further input from Universities UK and senior
KE management staff may help to identify indicators for this category. As with the Anchor category,
KE leadership spans all the KE activities and feeds into all the indicators within the other sections.
For the key indicators in this category, we have proposed the use of total KE income, normalised for
the scale of the HEI by number of academic FTEs. We acknowledge that this indicator is not a
measure of leadership, but it is the single measure that is most commonly used by senior
management to judge the overall KE performance of their HEI, and so fits most clearly into this
cross-cutting category. This indicator also reflects government interest in overall external income,
where they have set an ambition for HEIs to increase their external income earned from working
with business and others to £5 billion per annum by 2025. There are some disadvantages to this
indicator, however, because it is made up of underlying activities which have different levels of
scale, with the largest contribution coming from contract and collaborative research. It will therefore
disadvantage HEIs which specialise in other types of KE, which have a lower income potential but will
have other benefits. This indicator may therefore be best viewed in the context of clusters based on
research intensity.
We have also proposed a cross-cutting indicator here which examines the balance between
commercial and non-commercial income across a range of different KE activities. This is another
strategic indicator, which can help an HEI to understand the balance of partner type that it currently
has, and to inform discussions about the types and levels of KE interactions that the organisation
wishes to have. As was discussed in the section on SMEs, one major drawback of this type of
indicator is that current data on collaborative research income are not split in this way, and so must
be excluded from the indicator. Collaborative research is not only the biggest single contributor to
total KE income as measured in the HE-BCI survey, but is also one of the most common mechanisms
for an HEI to interact with policy-makers, charities, health services and other non-commercial
organisations. The level of income will also be dependent on the discipline of the underlying activity,
with scientific subjects tending to generate higher income than non-scientific subjects. This indicator
should therefore be viewed with some caution.
KEY INDICATORS:
Indicator Data Source
Total KE income (by income type) per academic FTE HE-BCI/HESA Ratio of non-commercial income to commercial income (licence income + contract + consultancy + CPD + facilities & equipment)
HE-BCI

65 | P a g e
SAMPLE INDICATOR: TOTAL KE INCOME – THE IMPORTANCE OF CLUSTERING
The graph below shows the output of the proposed KE income benchmark, normalised by number of
academic FTEs to account for the influence of scale. This graph shows how important it is to ensure
that comparisons are made between HEIs with comparable properties. Many of the top performing
HEIs by this measure are those with relatively small numbers of FTEs, which are achieving high
incomes in specific categories of income (as shown by the different colours in the bars).
Data source: HE-BCI survey Part B 2014/15, HESA staff record 2014/15

66 | P a g e
By comparison, if the cluster of top six research intensity universities are shown (as below), they can
be seen to have much more similar profiles, and to achieve similar levels of income per FTE;
although it can be noted that Imperial College is achieving higher levels of contract research income
per academic than the other members of this cluster, which may reflect its focus on science and
technology.
Data source: HE-BCI survey Part B 2014/15, HESA staff record 2014/15
OTHER POTENTIAL INDICATORS:
Indicator Data Source
Total KE income HE-BCI Total KE income as a % of total research and teaching income HE-BCI/HESA Composite index of responses relating to KE leadership in HE-BCI Part A (Q1 (selected), Q5, Q6, Q7, Q8 (selected), Q10 (selected), Q11, Q14, Q16 (selected), Q18, Q17 (selected), Q24, Q27)
HE-BCI

67 | P a g e
OTHER POSSIBILITIES (DATA NOT CURRENTLY COLLECTED):
Average KE staff training hours
% of KE staff holding professional qualifications (e.g. Registered Technology Transfer
Professional). However, this would ignore the value of experience, length of service, or
background in industry for example
% of KE staff involved with external KE influence (e.g. PU/AURIL/ARMA committee
membership, AURIL’s Inspirational Mentoring Scheme, etc.)
Number of academics on advisory/strategic panels of external organisations
Number (%) of academics engaged with KE
Number of academics attending internal KE training courses
Active participation in networks and hubs (how to define and measure?)
Provision of internal KE/Impact awards
Amount of internal seed/translational/impact support funding available
Number of inward secondments per academic FTE
Number of outward secondments per academic FTE
Prominence of KE activities in academic career progression criteria (how to define and
measure?)
Number (%) of academics with a specific role in KE (e.g. Dean of Enterprise, Innovation
Champions, Enterprise Champions, etc.). Very difficult to get consistent definitions
Score on the Entrepreneurial University Scorecard 34 (from the National Centre for
Entrepreneurship in Education)
Reputation is often the most important aspect of KE for senior management, and should feed into
the indicators in the leadership category. However, this is an extremely difficult area for which to
identify suitable indicators, because reputation is closely linked to the underlying HEI mission and so
cannot be measured in a consistent way across varying missions.
34 http://ncee.org.uk/publications/

68 | P a g e
9 STAKEHOLDER REACTION
Within the scope of this initial study, there has only been limited opportunity to gather stakeholder
reaction, so the response to date should be viewed as preliminary, and there will be a need to widen
this input and consultation before the introduction of any benchmarking tool. The responses that we
have received have shown a good level of awareness of the need to improve efficiency and
effectiveness across the HEI space, and a strong interest in how to apply benchmarking and key
performance indicators to knowledge exchange activities.
We have obtained feedback from a range of practitioners, from operational staff up to Vice
Chancellor level in offices dealing with technology transfer and research & enterprise. This has
highlighted to us that it is difficult to identify the management level within a typical HEI which has an
overview of all the potential types of KE activity across the whole organisation. Structures vary, but
strategy for KE activity tends to be set more by individual activity area (e.g. CPD or consultancy) or
partner type (e.g. industry or the public), rather than being coordinated overall at an institutional
level. Vice Chancellors and to some extent Pro Vice Chancellors which do have an overview of all
types of KE will also have responsibility for a wide range of other activities, which will have a larger
financial impact on the HEI, and so are less likely to get involved with the details of overall KE
strategy.
Due to the remit of the study (suggestions for benchmarking indicators should be based on data that
is already collected), the indicators proposed could already be generated and monitored by each HEI
themselves. We have found that this is already done to a lesser or greater extent, often as a specific
exercise to investigate a particular issue.
This type of existing use of benchmarking has value for occasional analysis, at the most once a year
to fit with the availability of new data. It therefore has more limited value for continuous
improvement due to this data availability. Some respondents have suggested that it can be quite
difficult to obtain and analyse the HE-BCI data, and so a tool which made it easier to investigate the
full range of data that it contains may be useful. Some respondents were surprised at the amount of
information that can be obtained from the existing data sets with some of the additional analysis
suggested in the proposed indicators. As has been discussed, the available data only addresses a
subset of the spectrum of knowledge exchange; partly this is because relevant data are not currently
collected, but also because it can be very difficult to identify suitable ways to measure the outcomes
of some of these activities.
Although the stakeholders consulted were interested in the range of information that could be
obtained from the suggested benchmarking indicators, several commented that this information fell
into the ‘nice to have’ category, rather than being essential for their decision-making and to drive
improvements. Within the consultation group, there was a general willingness to collect and share
new data if this does not add too much to the administrative burden (beyond what they are already
doing in-house for their own monitoring purposes) and if it can provide useful additional
information.
Indicators that might be able to bridge industry and academic viewpoints were felt to be helpful. For
example, a common complaint may surround the time taken to conclude an agreement between
industry and an HEI. At the moment, there is no consistent information about these timescales, to

69 | P a g e
understand what is normal and reasonable, or to identify whether delays are introduced into the
process from the HEI, from industry or both. Additional data sharing around this type of activity may
therefore help to clarify where the bottlenecks occur, and what could be done to remove these.
There was some concern about some of the softer indicators considered, and it will be very
important that clear consistent definitions are used for any new measures that are introduced. We
have tried to indicate which measures might be feasible, and which are too variable and too time-
consuming to produce for the limited value that they might return.
The most common theme in the feedback was that the comprehensive collection of potential
indicators was too detailed to be easily handled, and that it would be more effective to have a small
subset of indicators (perhaps one or two in each section) which give an overview, and which tell a
story about the scale and scope of activity. This could perhaps be coupled with the ability to delve
into the detail if required. This was however linked with a concern that the overall benchmarking
indicators chosen should not drive perverse incentives to prioritise one type of activity over another
by limiting the key indicators to some activities and excluding others. For these reasons, indicators
which are linked to outcomes rather than activity levels would seem to be more suitable and less
likely to drive unwanted behaviour, and we have suggested a short-list of potential top-level
indicators in each category in section 8 above.
This short-list of suggested key indicators has not yet been re-checked with the stakeholder
community, and we would suggest that wider consultation on this aspect would be an important
next step in the development of the tool. Several of those that we consulted have their own existing
set of internal KPIs which are set in discussion with senior management. However, although these
lists tend to be of a similar length, typically containing 5-15 indicators, the detail of the measures
chosen varies quite considerably between institutions. It may be appropriate to begin with a small
set of common and well-defined indicators, which could be added to over time as required. We have
yet to identify a consistent view as to how the proposed metrics would be used to drive
improvements, so the short-list may require further refinement.
At a strategic senior management level, the concern was less about the details of the KE activity
levels than about the support that KE can give to wider engagement and strategic partnerships,
which are not easily covered by the available data. There was also a feeling that the short-list should
include indicators which are robustly quantitative and demonstrate the level of return that is being
achieved from the public funding that the HEI sector receives.
The use of clusters and groupings to allow for more meaningful comparisons between organisations
with similar characteristics was broadly welcomed, with the strongest support for self-selected
groups to allow for different approaches in different situations, including regional comparators, size
comparators, portfolio comparators, and aspirational comparators. Some pre-defined groups will be
useful, but the fine detail of this is probably less important than allowing for self-selection.
EXTENSIONS BEYOND THE USE OF EXISTING DATA
During the project, and at the joint PraxisUnico/AURIL/ARMA conference, some of the potential
extensions of any benchmarking approach into other areas where data is not currently available
were discussed. Some of these were identified as being potentially useful and of interest to support

70 | P a g e
sharing of best practice and improvement, but may be better progressed outside the development
of a benchmarking tool. The main categories that were raised were:
Process indicators: comparison of internal KPIs to monitor and improve process efficiency
and customer satisfaction. This is akin to the approach taken by other organisations which
have a monopoly or quasi-monopoly position, but which need to be held accountable for
their performance. An example is the train franchise operators, which are measured against
pre-agreed standards such as the % of their services which arrive on time. A similar approach
is taken in the NHS, or schools. Some concern was expressed about the type of information
that could be easily collected on a standardised basis, and whether different procedures and
organisational structures in different organisations would make this type of comparison
meaningless. Some were also concerned about the sensitivities of making this information
public. One solution could be to compare performance against agreed standards on an
anonymised basis – each HEI would have information about all the other scores from the
other HEIs and its ranking compared against these, but would not know which scores
belonged to which HEIs. This would allow them to set targets based on improved
performance and knowing what was possible, but would be less useful in terms of
identification of specific role models to learn from. If this approach is developed further,
then it would be useful to develop performance targets in the first instance that relate to
common pressure points in the KE process. Customer satisfaction approaches could also be
considered, but this is less relevant for some aspects of the KE process, where the nature of
a negotiation, whether with an internal academic or an external partner, is to achieve the
best solution for all parties, not just to please one party to the deal. However, measures
such as repeat business could be useful here.
Operational parameters: it can be quite difficult for an HEI to identify standard practice and
typical approaches in certain aspects of KE policy and organisational structure. For example,
some HEIs make their internal IP policy available via their website, but this is by no means
universal. Other areas of interest would include staffing levels for support of specific aspects
of KE, and how these link to the outcomes that are achieved. This cuts across the parallel
project on best practice materials that is being developed by Research Consulting.
Outcomes: Ultimately, the aim of KE is to achieve a positive impact on the world outside the
HEI, and the inclusion of impact measures within grant applications and the REF process has
led to a much greater awareness and monitoring of these wider impact measures. In
revenue terms, the value to an HEI of sponsored research partnerships and similar
interactions far outweighs the revenues from licensing and spinouts, and there is an
increasing focus on building stronger and deeper strategic partnerships. Some HEIs have
tried to investigate whether they can measure the Gross Value Added from their activities to
the wider community. There are no easy ways to define and quantify this at present, but it is
an area of high interest and may develop into a more easily standardised process in the
future.
Deal values: one area where it was felt that sharing of comparator information would be
valuable was in the context of the types of deal structure and value that other HEIs had
achieved in their agreements. This is particularly true where a particular HEI does not have
much experience or throughput in a particular sector, and would value an understanding of
what is ‘normal’ for that type of agreement. There are potential issues relating to

71 | P a g e
competition law surrounding the sharing of this type of information, but there is a precedent
in the TransACT database which is being developed by AUTM in the USA. The Transactional
Academic Comparables Tracking (TransACT) Database35 is a new comprehensive database of
information on transactional structures, terms, scope and other relevant details for
agreements between USA HEIs and industry. It consists of a database of comprehensive
records of anonymised licensing agreements. It is available via subscription, with free access
available for member organisations which have provided a certain level of information to
the database. The easiest route to access to this type of information may be through
participation in this AUTM initiative, perhaps with a reciprocal sharing arrangement
facilitated by one of the UK professional organisations.
35 http://www.autm.net/resources-surveys/research-reports-databases/transact-database/

72 | P a g e
10 RESOURCES REQUIRED
In this section, we draw together some conclusions on proposed requirements and a structure for a
benchmarking tool which could be implemented without any additional data collection burden for
the HEIs, and which may have value particularly in terms of strategy and operational decisions for KE
management. As discussed in earlier sections, this data is already available through other routes, so
to be useful the tool should be easier to use and/or have additional functionality compared with
existing solutions. However, we would recommend that the tool is developed in a stepwise fashion,
with an initial simple solution which can be enhanced in later versions if there is a demand for
additional functionality. We would also strongly recommend significant user input into the
development of the tool to ensure that it is fit for purpose.
DATA INPUTS
Clear definitions are key, and should link explicitly to the definitions in the underlying data. It
will be important to know exactly what data is or is not included in each benchmarking
indicator.
Where data is taken from multiple data sources, some manipulation may be required to
ensure consistency, for example in HEI naming conventions.
Older data will need to be adapted to allow comparisons across years, for example to reflect
mergers between different HEIs.
Older data may also need to be updated to be expressed in real terms to allow for the
effects of inflation. Again, it should be very clear within the tool when and how these
adjustments are made.
It is not recommended in the first instance that the tool should include international data
(beyond the other countries of the UK), because the amount of comparable data that is
collected is too small, and the value that could be obtained from these comparisons would
not justify the effort required to include them. If the tool is expanded later to include
international data, then decisions will be required on how to handle exchange rate changes.
The data will need to be compiled into a consistent underlying database, or could perhaps
be interrogated in real time from the original sources, for example using the heidi API36. Not
all the data suggested is currently held in heidi, however, so this may be more difficult.
INTERFACE
A web-based interface is recommended and, as discussed, this should be made as user-
friendly and simple to manipulate as possible, allowing for the complexity of the underlying
KE activities. Alternatively, it may be possible to provide some functionality in Excel.
A simple outline structure is shown in the next section, but this is very much a starting point.
Modern data interfaces are now very intuitive and easy to interact with, and a good
benchmarking tool will use the best current interface conventions.
Flexible outputs would be beneficial – a simple ranking table may be useful in some
circumstances, but graphical outputs are often more powerful and allow the combination of
36 http://www.heidi.ac.uk/index.php/content/view/39/87/

73 | P a g e
related data. For example, it is much easier to interpret the split between different sources
of licensing income (SME vs other commercial vs non-commercial) in a bar chart than in a
table.
In the sections on potential indicators, we have suggested a smaller number of key
indicators, supported by a wider selection of other measures that may be used to give
additional insight. This ‘two-tier’ approach should be followed within the tool, to allow for
easy review of the key indicators, which can then be investigated in more depth.
Context sensitive help would be beneficial, both in the use of the tool, but also to assist with
understanding of the underlying data and the purpose and function of each indicator.
CAPABILITIES
Division of the KE space into categories of related activity is needed, as discussed previously.
It should offer a choice of comparators: e.g. all HEIs, free-selection of a shortlist of
comparator HEIs, or a limited selection of pre-populated groups (geographic, by research
intensity building on the previous work by PACEC, and perhaps by size or by mission group).
More work is needed to define which groupings would add value and the membership of
these groups.
It should offer a choice of base or normalised data. Within each category, we have selected
suitable normalisation approaches which would be relevant to those activities. In some
cases, more than one normalisation approach may have value, for example by number of
academics or by the amount of research or teaching income. The tool should allow the user
to choose between the original data, and the appropriate normalisation approach for that
indicator.
The tool should provide the ability to choose the date range of the data to be benchmarked
– this may be for individual years or to view trends across years.
A choice of indicators should be allowed.
In later iterations, it may be appropriate to develop a way to visualise the overall KE activity
of each organisation, perhaps through use of a composite index or balanced scorecard which
allows an HEI to view its strengths and weaknesses across the whole spectrum of KE activity.
This is likely to prove difficult, and is not recommended for implementation in an initial
version of the tool. It should also not detract from the ability of the tool to provide
additional insights into the reasons behind the differences between different institutions.
BENCHMARKING INDICATORS
The choice of the most appropriate key benchmarking indicators will need to be refined in
consultation with the end user community. We have proposed the following as potential starting
points for this discussion:
Total KE income (by income type) per academic FTE
Ratio of non-commercial income to commercial income (licence income + contract +
consultancy + CPD + facilities & equipment)
SME income as a % of total industry income
Total collaborative research + contract research income as a % of total research income

74 | P a g e
Value of consultancy engagements per FTE
Total SME income (licence income + contract + consultancy + CPD + facilities & equipment)
per academic FTE
Staff start-ups surviving 3 years as a % of total companies formed surviving 3 years
Graduate start-ups surviving 3 years as a % of total companies formed surviving 3 years
CPD income as a % of total teaching income
Total facilities and equipment income
Total IP income as a % of total research income
Number of disclosures
Value of licences granted by research income
Number of FTEs employed by active new enterprises
As an illustration, the following section shows a mock-up of one potential format for the
benchmarking tool, with selections of parameters to be benchmarked, and a graphical output.
Modern analysis tools can achieve very sophisticated results with easy to understand user
interfaces, and the emphasis should be on a tool that is easy to use, with outputs that are simple to
interpret. Jisc have a number of projects running in this area, for example their Business Intelligence
Maturity dashboard37 illustrates the type of tool that might be suitable for reporting and exploring
the KE benchmarking data.
37 https://www.business-intelligence.ac.uk/business-intelligence-maturity/

75 | P a g e
10.1 MOCK-UP OF POTENTIAL BENCHMARKING TOOL
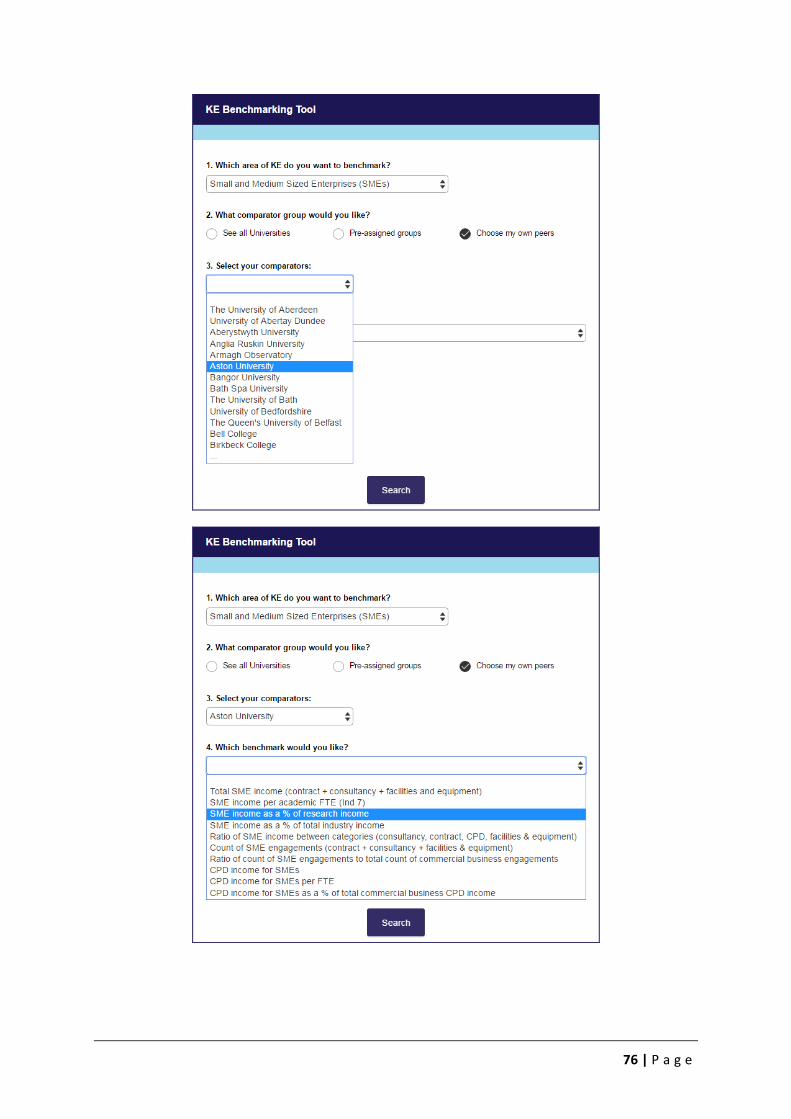
76 | P a g e

77 | P a g e
Data Source: 2014/15 HE-BCI survey Part B

78 | P a g e
10.2 POTENTIAL ROUTES FORWARD
This study has taken an initial look at the need for a benchmarking tool for KE and has investigated
the type of indicator that could be developed without collecting additional data. If this is to be
successful, it needs to be a living tool owned by the community. Some potential routes forward that
might allow this to happen are outlined in this section, but these are not the only options and may
not be mutually exclusive. Ultimately it should be up to the user community to define the type of
tool that they need and how best to put this into practice.
JISC/HEIDI LAB
Jisc is a not-for-profit organisation dedicated to the provision of digital services and solutions to the
higher education, further education and skills sectors. As such, it provides support to the HEI sector
in areas that would be relevant for this type of benchmarking tool. One particular development that
may be of relevance is the joint Jisc-HESA Business Intelligence project38. This project has been
developing the new interface to the HESA datasets, called Heidi Plus, which was released in
November 2015. Running alongside this interface is Heidi Lab, which is a new national analytics
experimentation project aiming to refresh Heidi Plus content with insights from a wide range of
alternative data sources. This could be one potential route to develop a benchmarking tool for KE
activities in the HEI sector, which would provide technical support and development alongside a
mechanism to elicit user input.
In Heidi Lab, analysis teams comprising staff from multiple institutions work together to solve
problems using well known data sources such as the HESA collections (drawing on a Jisc/HESA data
sharing agreement) linked to other external data sets. A suite of cutting-edge tools, currently
Tableau (a market leading tool according to Gartner 2015) and Pentaho Kettle (an open source data
transformation tool) is used to carry out analysis on that data. The analysis teams are able to rapidly
produce analyses, visualisations and dashboards for a wide variety of stakeholders from senior staff
to students to aid with decision making. They receive weekly feedback and use this for iterative re-
development in an Agile Scrum model based on one day of effort per person per week. The process
results in a suite of polished analysis in around three months.
Outputs of this process will be considered for migration to Heidi Plus or an alternative Jisc beta
service, which could represent an ultimate route to hosting and dissemination of the benchmarking
data. Another advantage of this route is that it would include access to the HESA data sets, which
can have constraints put on their use if they are accessed by an outside organisation.
The graphic below describes a single cycle of the Heidi Lab process. Two cycles have been
undertaken: winter (November 2015 – February 2016), and spring (February – May 2016). This will
be followed by evaluation then a further cycle later in the year.
38 https://www.jisc.ac.uk/rd/projects/business-intelligence-project

79 | P a g e
Source: https://www.business-intelligence.ac.uk/heidi-lab/
We would recommend further investigation of the process that would be needed to introduce the
potential KE benchmarking tool into this Heidi Lab development cycle.
PROFESSIONAL BODIES
The various professional bodies with an interest in knowledge exchange in HEIs have all been
involved with this project, including inputting valuable information and advice, as well as
participation in the Steering Group. Universities UK, PraxisUnico, AURIL and ARMA all represent
different parts of the KE infrastructure, and all could potentially be suitable drivers for further
development of the ideas outlined in this report and/or hosts of any tool that is developed. There is
overlap in the membership and representation of these groups, but none of them alone would cover
all the different aspects of KE that the tool might cover, or all the different HEIs in England (and the
rest of the UK). It may therefore be more appropriate for a joint approach to be taken, as has
already been seen in some other initiatives involving these groups. Any tool that is developed should
also be available to all HEIs, and not just to member organisations of the professional bodies. The
involvement of Universities UK and its members would give an endorsement of KE activity from the
highest management levels within the sector. Universities UK also coordinates the Efficiency

80 | P a g e
Exchange 39 , which has some overlapping aims in terms of improvement of efficiency and
effectiveness in HEI.
INDEPENDENT ORGANISATIONS
There are a number of other related organisations with an interest in this area, such as the National
Centre for Universities and Business40 (NCUB), the Big Innovation Centre,41 the Higher Education
Entrepreneurship Group42 and Global University Venturing43. Some of these also have interesting
data sets which might add to the value of the tool, for example the recent NCUB/CBR Survey of
Academics. As with the professional bodies, however, the remit of each of these and similar
organisations will not necessarily span all the KE activities of the sector. We have not explored with
any of these organisations whether they have any interest in getting involved with this project.
FUNDING BENCHMARKS
As discussed, Funding Benchmarks is a private company which already provides a tool with a limited
part of the proposed functionality of a benchmarking tool. They already understand many of the
data sets behind the indicators and have built a web-based tool which allows some interrogation and
reporting of the data. They also already have an agreement which allows them to use the HESA data
in a commercial tool. Part of their advantage is their position as an organisation which is
independent from the HEIs, and so would be seen as free from bias and vested interest, both by
individual HEIs and by funders and policy makers. They have an established business model, and a
limited client base within the HEIs. This is based on a charging model, which may not be compatible
if the aim is to develop a tool which is freely available to all those within HEIs who would find it
useful. However, other current routes to access the HE-BCI data also involve a cost to the
organisation, even if this is at an institutional level, rather than an individual user, so this may not be
a barrier. Jim Alexander at Funding Benchmarks has expressed an initial interest in potential
involvement in the future development of any benchmarking tool.
HEFCE
HEFCE has instigated this initial study as part of their overall work to develop a KE framework for
HEIs in England. It also chairs the UK HE-BCI survey Stakeholders Group. HESA, in agreement with the
HE-BCI Stakeholders, will be the main source of data for any benchmarking tool which is based on
existing data sets. For many, HEFCE would therefore be seen as the likely owner of any KE
benchmarking tool which is developed. HEFCE has current experience with the collection and
provision of benchmarking data to the sector in the form of the National Student Survey (NSS)44,
which gathers students’ opinions on the quality of their courses. This contributes to public
accountability, helps to inform the choices of prospective students and provides data to assist
39 http://www.efficiencyexchange.ac.uk 40 http://www.ncub.co.uk/ 41 http://www.biginnovationcentre.com/ 42 http://www.heeg.org.uk/ 43 http://www.globaluniversityventuring.com/ 44 http://www.hefce.ac.uk/lt/nss/

81 | P a g e
institutions in enhancing the student experience; all of these have potential parallels in the proposed
tool. As an interested party which is not affiliated to any one HEI or group, HEFCE would also bring
the value of independent endorsement of the metrics, which is one of the key successes of the NSS.
Their ownership of the survey ensures that the data is consistent and comparable, and validated as
unbiased and independent. However, the position of HEFCE as a funder of KE activities through the
HEIF stream may put it in a more difficult position if they were also to deliver the benchmarking tool,
and could lead to confusion about its purpose. The aim of the tool should be to drive improvement
within the HEIs and should not be to influence funding decisions. HEFCE would therefore prefer that
the development and direction of the tool is taken on and driven by the HE sector themselves to
ensure that it meets their needs, rather than being seen as imposed from a central body.
10.3 COSTS
It is not possible to cost the proposed tool at this point, as the specification is still far from finalised.
However, we can begin to identify the elements that would be required to make the tool a reality.
Each of these will have an associated cost, and funding would be required both for the development
and then to run the tool. As discussed, it may be possible to devise a charging mechanism for use of
the tool that would allow sector-wide access, but provide sufficient income to cover ongoing running
costs and updating of the data. It is unlikely that this mechanism would be able to fund the following
initial development steps:
Formation of team to define and finalise the benchmarking indicators and the functionality
of the tool. Iterative consultation and refinement with the user community
Specification of the components of the system, and the data sources needed to populate it
Build, test and refine the system, incorporating user feedback
Obtain access to the data and permission to use it in the tool
Raise awareness of the availability of the tool, and of the potential value of its use
Once the tool is built, ongoing running costs will include:
Buying access to new data sets as they are released
Manipulation and cleaning of the data to fit into the structure of the database
Uploading and testing new data
Hosting the system
Providing any support or training that may be needed to use the tool
Development of additional functionality for the tool
Mechanism for modification of existing indicators and addition of new ones
Ongoing marketing of the use of the tool

82 | P a g e
11 CONCLUSIONS, RECOMMENDATIONS AND NEXT STEPS
Benchmarking can be a very useful device to assess current practice and to compare
performance across organisations. As part of a wider approach, benchmarking can be used to
improve performance and to identify good practice in others which could be adopted. However,
any metric-based benchmarking tool should certainly not be viewed as the only way to judge
the quality of the knowledge exchange (KE) activity within an organisation.
In the context of KE, there is a willingness to engage with benchmarking within the community,
and some organisations are already using the data available as part of their strategic reviews of
KE performance.
There are a number of potential uses of benchmarking within KE: to investigate strategy,
operations, process improvement, or outcomes. The approach taken by a benchmarking tool
would need to be different to suit each of these outcomes, and it is important that the aims are
clearly defined before further work is done to develop any tool.
There are a number of inherent difficulties in developing a benchmarking approach for KE. The
success of KE activity is influenced much more by the underlying nature of the organisation than
by the efficiency and effectiveness of the KE staff and processes within the organisation. A
clustering approach is therefore recommended to contextualise the indicators in terms of the
underlying characteristics of the HEI: research intensity and discipline mix, research/teaching
balance, regional location, size, student mix, and the mission and aims of the institution.
Normalisation may also be useful to account for differences in the underlying scale of the
activities within the HEI. Suitable mechanisms include normalising by number of academic staff,
or by the relevant research or teaching incomes. However, normalisation can have the effect of
exaggerating the importance of outliers in the data, and is best used in combination with
careful selection of the right comparator organisations.
KE covers a wide spectrum of activities, and not all organisations would be expected to focus on
or excel across all of these. One of the values of any benchmarking tool may be to allow
organisations to identify which areas of KE are strategically important to them (and therefore
which they should be good at) and how to improve these. Some aspects of KE, such as licensing
and spinout activity, may be easier to measure and compare than others, but are likely to be of
lesser importance to the overall success of KE in an organisation than other aspects which are
harder to measure. There is certainly no single approach to KE which would be suitable across
the range of different HEIs in England.
The remit of this study was to examine what type of benchmarking could be achieved with no
additional data collection burden for the HEIs. Various sources of data have been considered
which might provide helpful information. The most comprehensive and useful existing source is
the higher education - business and community interaction survey (HE-BCI), run by HEFCE with
data collected by HESA. This is also the source of data cited by KE practitioners who are
currently attempting to benchmark their performance. However, there are additional sources of
data available which could add some additional data points which may be useful. The quality of
this data is variable, depending on the purpose for which it is collected.
The nature of the HE-BCI data points to the development of a tool which can provide insight
that is useful to guide overall strategy, and which would provide some clues as to operational
practices that may be worth further investigation. However, the HE-BCI data do not give good

83 | P a g e
insight into all aspects of KE that may be important to an organisation, so several types of KE
are not well covered by the indicators suggested.
Current methods of obtaining and interrogating the HE-BCI data can be cumbersome, and a tool
which allows easier access to this data and interpretation of its implications should give some
interesting insights, as well as allowing wider use of this data to support operational and
strategic decision making. This is particularly true when combining HE-BCI data with other data,
for example to allow normalisation by factors collected in other HESA data sets. However, this
additional insight may fall into the ‘nice to have’ category, rather than being able to drive
improvements in performance and behaviour. It is not yet clear from this study whether the
costs and effort of developing a tool which is largely based on just the HE-BCI data would
deliver sufficient value to justify the resource needed. Use of the new Heidi Plus tool may
facilitate better use of the existing data.
If, instead, the defined aim is to drive continuous improvement in performance, then an
approach which develops process indicators aligned with performance targets may be more
helpful. There is some scepticism within the profession about the feasibility of achieving a
uniform approach to definition of these targets, and it would involve an additional data
collection burden and sensitivities about sharing of the data. Some of this could be addressed
by adopting an anonymised reporting system, where each HEI knows its own position in the
performance table and what the other results are, but not which HEIs the other results belong
to. Examples of indicators which might be suitable for this type of approach are:
o Number of disclosures per member of KE staff
o Number (%) of research-active academics which interact with the KE team
o Translational funding applied for and/or raised
o Customer satisfaction ratings (internal and external customers)
o Use of performance targets, with reporting of the % achievement of the target
This type of performance indicator target approach is already being used in some HEIs and a
small number already share the results internally, and may consider publishing them externally.
On the other hand, if the aim of the benchmarking is to improve external economic impact and
downstream outcomes, which would align with the increased focus on the impact of research
beyond activity measures, then a different approach again would be required, which would
require more effort to be put into monitoring the outcomes of interactions, potentially for
many years after the HEI involvement has stopped. As before, some of these outcomes will be
intrinsically easier to measure than others. Examples of indicators which might be suitable for
this type of approach are:
o Number of products or services launched from licensed IP (a measure being used in Ireland)
o Gross sales of licensed products
o Spin-off company value on exit or trade sale
No benchmarking tool can cover all these aims, and the HEI community will need to decide
what is most important to them, what is achievable, and what could give the highest return in
enhancing existing KE performance.
Another consideration is whether the results of the benchmarking should be publicised, in a
similar way to the results of the National Student Satisfaction survey. No single indicator is likely
to be able to cover the complexity of KE performance within an organisation, so this may be a
later step, rather than an initial aim of the tool.

84 | P a g e
This study is only a starting point. If the HEI KE profession is to value and use the tool, then
further consultation across a wider audience is required. This would include consultation in
particular with HEIs, but also with professional groups, funders, policy makers and external
stakeholders, perhaps including industry, and others.
The first step is to identify who is willing to drive the next stage of the process. To maximise the
value to HEIs and reduce the potential for the tool to promote unwanted behaviour, we would
recommend that the HEI KE sector take this up themselves, perhaps through one or more of
their professional bodies. It will be important that the approach taken is inclusive of the whole
spectrum of HEIs and of all types of KE activity. This may be best achieved through a joint
initiative, including senior HEI management levels.
The next step would be to define much more tightly what the aims of the benchmarking
exercise need to be. This will then influence the approach that is taken and whether or not this
can be achieved using existing data.
If the decision is taken to implement a benchmarking tool based on available data then the next
step we would recommend is a pilot exercise to look at various aspects of the options suggested
in this report in more detail. This would include careful examination of the proposed shortlist of
indicators, as well as further consideration of a suitable categorisation for KE activities, and the
types of clusters and their membership which would be useful. The current shortlist we
recommend is:
o Total KE income (by income type) per academic FTE
o Ratio of non-commercial income to commercial income (licence income + contract +
consultancy + CPD + facilities & equipment)
o SME income as a % of total industry income
o Total collaborative research + contract research income as a % of total research income
o Value of consultancy engagements per FTE
o Staff start-ups surviving 3 years as a % of total companies formed surviving 3 years
o Graduate start-ups surviving 3 years as a % of total companies formed surviving 3 years
o CPD income as a % of total teaching income
o Total facilities and equipment income
o Total SME income (licence income + contract + consultancy + CPD + facilities & equipment)
per academic FTE
o Number of disclosures
o Value of licences granted by research income
o Number of FTEs employed by active new enterprises
o Total IP income as a % of total research income
This could then lead to stepwise development and adoption of the tool:
o Beginning with a selection of a small number of the indicators, which are easy to define and
collate, and using some pre-existing clusters
o The next step would be to make the tool more sophisticated and provide more in-depth
information. This may be best delivered via a Heidi Lab project
o If this proves successful, then we recommend that the approach is extended to some of the
other areas highlighted in this report, with the addition of further indicators, additional
data collection, and widening the scope to include process indicators and/or outcome
measurements.

85 | P a g e
APPENDIX 1: SELECTED READING LIST
The reading list below is not comprehensive, but contains a selection of the most relevant
documents relating to benchmarking approaches for knowledge exchange in higher education.
Monitoring tool for university business collaboration, NCUB, 2015
http://www.ncub.co.uk/state-of-the-relationship/university-business-collaboration-monitoring-
tool.html
Strategies For Sustaining Growth Of Income From Knowledge Exchange Across Higher Education
Institutions (HEIs) In The UK, NCUB, 2015
http://www.ncub.co.uk/reports/ke-income.html
Monitoring the knowledge transfer performance of universities: An international comparison of
models and indicators, CIMR Research Working Paper Series, Working Paper No. 24, 2015
http://www.bbk.ac.uk/innovation/publications/docs/WP24.pdf
The Metric Tide: Report of the Independent Review of the Role of Metrics in Research Assessment
and Management, HEFCE, 2015
http://www.hefce.ac.uk/pubs/rereports/Year/2015/metrictide/Title,104463,en.html
National Survey of Research Commercialisation, 2015 Review Report, Australian Government
Department of Industry and Science, 2015
http://www.industry.gov.au/NSRCReview
The efficiency of universities’ knowledge transfer activities: A multi-output approach beyond
patenting and licensing. CIMR Research Working Paper Series, Working Paper No. 16, 2014
http://www.bbk.ac.uk/innovation/publications/docs/WP16.pdf
Knowledge exchange performance and the impact of HEIF in the English higher education sector,
Report for HEFCE, 2014
http://www.hefce.ac.uk/pubs/rereports/Year/2014/keheifimpact/Title,92166,en.html
Measuring University-Business Links in the United States. A report for HEFCE, 2014
http://www.hefce.ac.uk/pubs/rereports/Year/2014/businesslinksus/Title,92160,en.html
The Entrepreneurial University: From Concept To Action, The National Centre for Entrepreneurship
in Education, 2013
http://ncee.org.uk/wp-content/uploads/2014/06/From-Concept-To-Action.pdf
A.P.L.U. CICEP New Metrics Project Analysis: a report to the National Science Foundation’s National
Center for Science and Engineering Statistics (NCSES), 2013
http://www.aplu.org/projects-and-initiatives/economic-development-and-community-
engagement/economic-engagement-framework/related-resources/aplu-new-metrics-analysis.pdf

86 | P a g e
Benchmarking knowledge transfer and commercialisation; in Commercialising Public Research: New
Trends and Strategies, OECD, 2013, DOI:10.1787/9789264193321-6-en
http://www.keepeek.com/Digital-Asset-Management/oecd/science-and-
technology/commercialising-public-research/benchmarking-knowledge-transfer-and-
commercialisation_9789264193321-6-en#page1
National periodic surveys and institutional data on patent applications and industry-university co-
publications; in Commercialising Public Research: New Trends and Strategies, OECD, 2013,
DOI:10.1787/9789264193321-10-en
http://www.keepeek.com/Digital-Asset-Management/oecd/science-and-
technology/commercialising-public-research/national-periodic-surveys-and-institutional-data-on-
patent-applications-and-industry-university-co-publications_9789264193321-10-en#page1
Performance Evaluation for Knowledge Transfer Organizations: Best European Practices and a
Conceptual Framework, Anna Comacchio and Sara Bonesso; in Management of Technological
Innovation in Developing and Developed Countries, 2012
http://cdn.intechopen.com/pdfs-wm/33286.pdf
A Composite Indicator for Knowledge Transfer, Report from the European Commission’s Expert
Group on Knowledge Transfer Indicators, Finne, H et al, 2011
https://ec.europa.eu/research/innovation-union/pdf/kti-report-final.pdf
International Benchmarking in UK Higher Education, Higher Education Statistics Agency, 2011
https://benchmarking.hesa.ac.uk/wp-content/uploads/2011/10/HESA_International_
Benchmarking_report.pdf
Benchmarking to improve efficiency: Status Report, HESA, 2010
https://www.hesa.ac.uk/benchmarking_report_nov10
Measuring the impact of knowledge transfer from public research organizations: A comparison of
metrics used around the world. Gardner et al, International Journal of Learning and Intellectual
Capital, 7(3/4), 318-327, 2010
http://www.hep.ucl.ac.uk/~markl/pp2020/tr.pdf
AUTM’s Proposal for the Institutional Economic Engagement Index, AUTM, (2010)
http://www.autm.net/AUTMMain/media/About/Documents/IEEEProposal.pdf
Metrics for Knowledge Transfer from Public Research Organisations in Europe: Report from the
European Commission’s Expert Group on Knowledge Transfer Metrics. EC Directorate General for
Research, 2009
http://ec.europa.eu/invest-in-research/pdf/download_en/knowledge_transfer_web.pdf
Metrics for the Evaluation of Knowledge Transfer Activities at Universities, Library House, 2008
http://ec.europa.eu/invest-in-research/pdf/download_en/library_house_2008_unico.pdf

87 | P a g e
APPENDIX 2: INTERNATIONAL APPROACHES
11.1 USA AND CANADA
The Association of University Technology Managers (AUTM) is the professional organisation for KE
professionals in the USA and Canada. The AUTM Licensing Activity Survey offers quantitative data
and real-world examples about licensing activities at USA and Canadian universities, hospitals and
research institutions. The data are collected within the AUTM Statistics Access for Tech Transfer
(STATT) database, which contains selected data from the Licensing Survey since it began.
AUTM surveys its members annually and has collected data for each fiscal year since fiscal year
1991. The definitions for the data elements are available to aid in the interpretation of the reported
data, and to provide a glossary of terms for the academic technology transfer community. The
questions that are asked are available here: https://www.autm.net/AUTMMain/media/
Resources/Documents/AUTM_FY2014_Licensing_Survey_Questionnaire.pdf, and include
information about the type of institution, the staffing levels of the TTO, the research expenditure of
the institution in different categories, the number of licences executed in different categories, the
income received from licences in different categories, legal costs, information about numbers of
disclosures, patents filed and patents granted, start-up companies in different categories,
information about products that have arisen based on licensed technologies, and plant variety
information.
AUTM warns that the statistics provided in the STATT database may not be directly comparable from
one institution to another, in light of the unique culture of each institution and the significant
variations between institutions. Some institutions are land-grant universities with unique missions,
some have teaching/research hospitals and some are located in rural communities with less
entrepreneurial infrastructure. Some institutions do not elect to have their survey answers published
via AUTM individually, even though their responses may be part of the published aggregate values.
This can make it difficult to follow an individual institution through the years of the survey, and the
fact that it is not listed for a particular year does not necessarily mean that they did not provide any
data.
Highlights of the aggregated data reported for all the respondents to the AUTM US Licensing Activity
Survey for financial year 2013-14 include:
5,435 licenses executed (up 4.5% over prior year)
1,461 options executed (up 7.7%)
549 executed licenses containing equity (up 17%)
914 startup companies formed (up 11.7%)
4,688 startups still operating as of the end of FY2014 (up 11.4%)
965 new commercial products created (up 34.2%)
6,363 US patents issued (up 11%)

88 | P a g e
AUTM summarise and publicise this aggregate data in the form of an infographic (below).
Source: AUTM
AUTM continues to have an interest in developing the metrics which are used to judge KE
performance. At the most recent AUTM annual meeting, a session on metrics opened with the
provocative question “Should we collect revenue figures at all?”, and considered other alternative

89 | P a g e
methods which are being used, including the REF Impact assessments and the in-depth study of
specific types of outcome that is being carried out in Ireland.
A report from the National Research Council of the National Academies in 201145 looked at
Managing Intellectual Property in the Public Interest. This report included a chapter on evaluation of
the technology transfer function, which recommended data collection at the national level which
focuses on placing IP-based transactions in the context of wider knowledge exchange and
dissemination. A more balanced set of measurements was suggested to be included in the National
Science Foundation’s annual survey of HEI expenditure and other surveys. They also recommended
using process indicators (e.g. how long agreements take to negotiate, satisfaction with service
among faculty and licensees, how many technologies are being promoted at any time, how well
technology transfer personnel qualifications are suited to this diversity, how many contacts are
made in the course of marketing the technologies, etc.) to measure the effectiveness of the TTOs,
and outcome measures appropriate to the HEI’s mission, such as the number of people benefited or
the extent of reduction in mortality and morbidity. These suggestions do not seem to have been
widely taken up. The report also recommends the approach taken by the HE-BCI survey, which
covers a broad spectrum of HEI activities with both financial and other objectives, which are not
found in the equivalent USA surveys.
Other benchmarking initiatives in the USA include a 2013 report by Tech Transfer Central46, a
commercial publisher of information relating to research commercialisation. Their Global Higher
Education Technology Transfer Office Benchmarks is focused on the structure and organisation of
the offices, rather than their KE outputs, however, and covers data on Staffing; Legal Services;
Partnering Activities; Technology Development; Salaries; Public Relations; Faculty Relations; Patent
Maintenance; Budgets; Marketing; and Legal Costs.
STAR METRICS is a federal and research institution collaboration to create a repository of data and
tools that will be useful to assess the impact of federal R&D investments. The National Institutes of
Health and the National Science Foundation, under the auspices of Office of Science and Technology
Policy, are leading this project. The information collected in this initiative is not however directly
relevant to KE performance, but relates more to the creation of jobs within research institutes as a
result of federal funding.
11.2 EUROPE
Within Europe, many individual countries have their own KE performance metric collections which
have varying levels of detail, and varying response rates. The main aggregator of this information is
ASTP-Proton47, which is a pan-European association for professionals involved in knowledge transfer
between HEIs and industry. By promoting and professionalising knowledge transfer practice, the
association aims to enhance the impact of public research on society and the economy. The
organisation carries out an annual survey, and the latest ASTP-Proton report with the results of the
annual survey is expected to be presented at the Annual Conference of ASTP-Proton in Copenhagen
45 http://nap.edu/13001 46 http://techtransfercentral.com/marketplace/prg/ttob/ 47 http://www.astp-proton.eu/

90 | P a g e
in late May 2016. Responses were received from 373 respondents, up significantly from 207 offices
in the previous survey. This highlights the voluntary nature of this reporting, however, which makes
year-on-year comparisons and data consistency difficult to manage.
Data from previous ASTP-Proton surveys are contained in the AUTM Statistics Access for Tech
Transfer (STATT) database, but most of the data are kept anonymous, and individual data are not
reported for many of the individual institutions.
The full survey questions are available on the ASTP-Proton website48. They include questions relating
to institution type, TTO staffing levels, expenditure levels, funding sources, activities, institution
research expenditure in different categories, academic staff levels, number and value of research
and consultancy agreements with industry, number of disclosures, patent families and patent grants,
number and value of licences in different categories, number of spin-offs and start-ups and
investment raised. Although there is some overlap with the AUTM survey, not all the definitions
match, making cross-border comparisons more difficult.
Another Europe-wide initiative is an EU funded project called PROGRESS-TT49. This project aims to
improving the transfer of technology from HEIs to industry through a programme of workshops,
training, bootcamps, coaching and mentoring to increase capacity within selected TTOs. The project
has developed a tool to assess TTO performance and potential for increased successes. The ‘TT
Diagnostic’ tool is used by the project to help select applicants wishing to receive capacity-building
support from PROGRESS-TT, and focuses largely on the structure and activities of the TTO, and the
tools that it has available to it, as well as their training needs. Based on their performance
assessment, respondents may be able to access further support from the project.
11.3 AUSTRALIA
In Australia, the National Survey of Research Commercialisation (NSRC)50 survey collects data on the
research collaboration and commercialisation activities of Australia’s publicly funded research
organisations. This includes universities, publicly funded research agencies and medical research
institutes. The survey was undertaken on a biennial basis until it moved to an annual collection cycle
in 2015. The last survey collection was conducted in 2015 to collect 2014 data. Unlike other
countries which collect data based on a fiscal year which matches the northern hemisphere
academic year (usually August-July), the Australian survey collects data in calendar years, which
again makes cross-territory comparisons more difficult.
For the first time in 2015, the data collection on patenting activity for 2014 will be via IP Australia,
and has not yet been added to the initial survey results.
The full survey questions are available on the Australian Government website51. They include
questions which mostly reflect a combination of questions from the AUTM survey and the HE-BCI
48 http://www.astp-proton.eu/wp-content/uploads/2014/08/ASTP-Proton-Survey.pdf 49 http://www.progresstt.eu/ 50 http://www.industry.gov.au/innovation/NSRC/Data/Pages/default.aspx 51 http://www.industry.gov.au/innovation/NSRC/Data/2014/Pages/2014-National-Survey-of-Research-
Commercialisation-Questions.aspx

91 | P a g e
survey. Topics covered are: Research Expenditure; Resourcing; Licences/Options/Assignments
(LOAs); Research Commercialisation Equity; Research Income – Consultancies, Contracts,
Collaborations and Direct Sales; Skills Development and Transfer; Engagement and Impact
The Australian Government also publishes a comparison52 of their overall activity with that of other
countries, using information from the Australian NSRC; AUTM US and Canadian Licensing Activity
Surveys; AUTM STATT Database; UK HE-BCI survey, and a special request from the Israel Central
Bureau Statistics.
52 http://www.industry.gov.au/innovation/NSRC/Data/2014/Pages/Table-3.aspx

92 | P a g e
11.4 IRELAND
Ireland has recently begun to collect and publish information about the KE activities of its HEIs in
their Annual Knowledge Transfer Survey (AKTS), following the establishment of Knowledge Transfer
Ireland53 (KTI) with a mission to maximise the use of HEI research to drive innovation in business. In
the first year of the AKTS data collection only aggregate figures were made public. In the most recent
years, some data has been split by Institution, but this is largely information about numbers of
interactions, and does not include the value of different types of KE income, although this is
published at an aggregate level.
Highlights from the 2014 report54 include:
A 46% increase in the number of companies in Ireland engaging with state-funded research
performing organisations (RPOs) to access research
2,337 agreements between companies and state-funded RPOs
27 new spinout companies created based on intellectual property and knowledge from Irish
RPOs
53 http://www.knowledgetransferireland.com/ 54 http://www.knowledgetransferireland.com/About_KTI/Reports-Publications/KTI-Annual-Report-and-
Annual-Knowledge-Transfer-Survey-2014.pdf

93 | P a g e
An increase of 21% to 168 IP-based transactions between RPOs and industry, including
licences, options and assignments.
Amongst these were a licence from University College Cork to Alimentary Health which led
to the creation of a new precision biotic product called Alflorex and a new cheese product
developed at Teagasc Moorepark in collaboration with Tipperary Co-Op and Ornua under
the Kerrygold brand.
This is highlighted in the infographic shown below.
94 | P a g e
KTI is focused on a limited subset of KE activities which involve HEIs and industry. As part of their
work, they have expanded these metrics by commissioning an in-depth study55 of two specific
outcomes – spinouts which have been active for more than three years, and products and services
which have been launched based on HEI research. This study looks in detail at these outcomes, to
gain further insight into their nature, their size and location, industry sectors, type of IP which is
involved, as well as employment and funding raised. The aim is to paint a richer picture of the
influence and outcomes of these industrial knowledge exchange activities.
Within Ireland, the HE community is small enough that it is easier for each institution to identify
which other organisations are comparable to them, and to network effectively with each other.
There is a history of learning from each other, monitoring each other’s public relations and reports,
and adopting and adapting KE initiatives that have proved successful. The community also looks
internationally, and to the UK in particular, for examples of good KE practice.
11.5 SCOTLAND
Within Scotland, the Scottish Higher Education Funding Council (SHEFC) is the equivalent of HEFCE.
SHEFC funds KE activities in HEIs through the University Innovation Fund (UIF), which has recently
replaced the Knowledge Transfer Grant, and is similar to the HEIF funding in England. All HEIs in
Scotland participate in the HE-BCI survey, which is a condition of the receipt of the UIF. This is the
main source of KE performance in Scotland. Some information is also available via the individual
Outcome Agreements which are set up between each HEI and SHEFC – these are deliberately not
standardised to reflect the diversity of activities and capabilities in the different HEIs.
The metrics used to allocate the UIF have been simplified, and no longer include information relating
to Translational Awards, Enterprise Schemes, Venturing or Outreach, which were previously
collected. The total Knowledge Transfer Income Metrics for HEIs in Scotland relating to the Academic
Years 2012/13, 2013/14 and 2014/15 are shown in the table below. These figures are also available
broken down by individual HEI56.
55 http://www.knowledgetransferireland.com/About_KTI/Reports-Publications/KTI-AKTS-Impact-Study-
2014.pdf 56 http://www.sfc.ac.uk/nmsruntime/saveasdialog.aspx?filename=kt_metrics_2014-
15_with_scottish_smes.xlsx

95 | P a g e
Type of Income 2012/13
£
2013/14
£
2014/15
£
External research grants and contracts
UK central government bodies/local authorities, health and hospital authorities
111,825,703 109,168,493 109,487,520
Industry, commerce and public corporations 91,805,384 91,059,686 100,266,731
Total 203,631,087 200,228,179 209,754,251
Of which from Scottish SMEs 3,339,646 3,723,202 4,101,291
Continuing professional development (CPD) 65,371,043 66,112,937 65,347,877
Of which from Scottish SMEs 881,560 873,887 898,029
Licensing 6,377,813 6,783,772 10,988,136
Of which from Scottish SMEs 834,465 1,313,748 2,054,679
Consultancy 75,773,646 78,048,132 79,665,221
Of which from Scottish SMEs 13,892,097 13,272,056 12,246,751
Enterprise schemes 7,479,056 7,867,276 11,751,910
Translational Awards 16,937,225 21,896,241 23,966,970
Venturing 48,187,554 46,087,840 9,190,420
Outreach 12,964,446 14,358,323 9,251,997
Total 436,721,870 441,382,701 419,916,781
Of which from Scottish SMEs 18,947,768 19,182,893 19,300,749

96 | P a g e
APPENDIX 3: DRAFT BENCHMARKING HEI CLUSTERS (FROM CBR/PACEC)
Source: Evaluation of the effectiveness and role of HEFCE/OSI third stream funding. Report to HEFCE
by PACEC and the Centre for Business Research, University of Cambridge. April 2009/15

97 | P a g e

98 | P a g e

99 | P a g e
APPENDIX 4: LIST OF ABBREVIATIONS
AKTS Annual Knowledge Transfer Survey
ARMA Association of Research Managers and Administrators
ASTP Association of European Science and Technology Transfer Professionals
AURIL Association for University Research and Industry Links
AUTM Association of University Technology Managers
FTE Full time equivalent
HE Higher education
HE-BCI Higher education - business and community interaction survey
HEFCE The Higher Education Funding Council for England
HEI Higher education institution
HEIF Higher Education Innovation Fund
HESA Higher Education Statistics Agency
IP Intellectual property
Jisc (Formerly) the Joint Information Systems Committee
KE Knowledge exchange
KPI Key performance indicator
KTI Knowledge Transfer Ireland
KTP Knowledge Transfer Partnership
LEP Local enterprise partnership
LOAs Licences/Options/Assignments
NCUB National Centre for Universities and Business
NERF Non-exclusive, royalty-free licence
NSRC National Survey of Research Commercialisation
NSS National Student Survey
REF Research Excellence Framework
RPO Research performing organisation
SBC Small Business Charter
SHEFC Scottish Higher Education Funding Council
SME Small and medium sized enterprise
STATT Statistics Access for Tech Transfer
TRL Technology readiness level
TT Technology transfer
TTO Technology transfer office
UIF University Innovation Fund
UKPI UK Performance Indicators
UKSPA UK Science Parks Association