benchmarking automatic machine learning frameworks · h2ois a machine learning framework similar to...
TRANSCRIPT
Benchmarking Automatic Machine Learning Frameworks
Adithya Balaji * 1 Alexander Allen * 1
AbstractAutoML serves as the bridge between varying lev-els of expertise when designing machine learningsystems and expedites the data science process.A wide range of techniques is taken to addressthis, however there does not exist an objectivecomparison of these techniques. We present abenchmark of current open source AutoML so-lutions using open source datasets. We test auto-sklearn, TPOT, auto ml, and H2Os AutoML solu-tion against a compiled set of regression and clas-sification datasets sourced from OpenML and findthat auto-sklearn performs the best across classifi-cation datasets and TPOT performs the best acrossregression datasets.
1. IntroductionThe progression of machine learning from niche R&D ap-plications to enterprise applications creates a need for tech-niques that are accessible to companies that do not have theresources to hire an experienced data science team.
In response to the demand for accessible, automatic machinelearning (AutoML) platforms, open source frameworks havebeen created to extract value from data as quickly and withas little effort as possible. These platforms automate mostof the tasks associated with constructing and implement-ing a machine learning pipeline that would normally beengineered by specialized teams. AutoML platforms pro-vide value to businesses who already have in-house datascience teams and allow them to focus on more complexprocesses such as model construction without spending timeon time-consuming processes such as feature engineeringand hyperparameter optimization.
There are multiple areas of focus for automatic machinelearning. There are a diverse set of AutoML frameworksclaiming to produce the most valuable results with the leastamount of effort. These frameworks apply relatively stan-
*Equal contribution 1Georgian Partners, Toronto, On-tario, Canada. Correspondence to: Adithya Balaji <[email protected]>, Alexander Allen <[email protected]>.
dardized techniques to the data developed over the years andcollected in open source machine learning libraries such asscikit-learn. However, the methods that are used to automatethe application and assessment of these techniques widelydiffer. These methods cannot be assessed on the rigor oftheir theory alone or by the individual performance of theconstituent algorithms. Thus, they must be experimentallyassessed as a whole across a variety of data. We performa quantitative assessment on the most mature open sourcesolutions available for AutoML.
2. Selected Frameworks2.1. Auto ml
Auto ml is a framework designed to be used in produc-tion systems to allow companies to quickly pass extractedvalue from their data on to their customers. Auto ml au-tomates many parts of a machine learning pipeline. First,it automates the feature engineering process through tf-idfprocessing (natural language), date processing, categoricalencoding and numeric feature scaling. Its date preprocess-ing includes converting timestamps into binary features likeweekend or weekday and splitting up components such asday, month and year. Auto ml also performs feature reduc-tion when more than 100,000 columns exist using reductionmethods such as PCA. This library requires the type of eachfeature as input in order to preprocess correctly. In addition,auto ml automates the model construction, tuning, selection,and ensembling process.
Auto ml utilizes highly optimized libraries such as Scikit-Learn, XGBoost, TensorFlow, Keras, and LightGBM for itsalgorithm implementations. It also contains pre-built modelinfrastructures for each classification and regression methodwhich have a < 1 millisecond prediction time. It optimizesmodels using an evolutionary grid search algorithm fromsklearn-deap.,
Despite its features, it has poor extensibility. It also tends toperforms poorly with multi-class classification problems. Italso does not support a time limiting feature and thus each al-gorithm must be run to completion in an unbounded amountof time. This weighs against the usage of this frameworkin time constrained scenarios such as frequently retrainedproduction systems. Also note that version 2.7.0 was used
arX
iv:1
808.
0649
2v1
[cs
.LG
] 1
7 A
ug 2
018
Benchmarking Automatic Machine Learning Frameworks
when testing this framework.
2.2. Auto-sklearn
AutoMLsystem
ML framework
{X train,Ytrain,X test,b,L}
meta-learning
data pre-processor
featurepreprocessor classif er build
ensemble Ytest
Bayesian optimizer
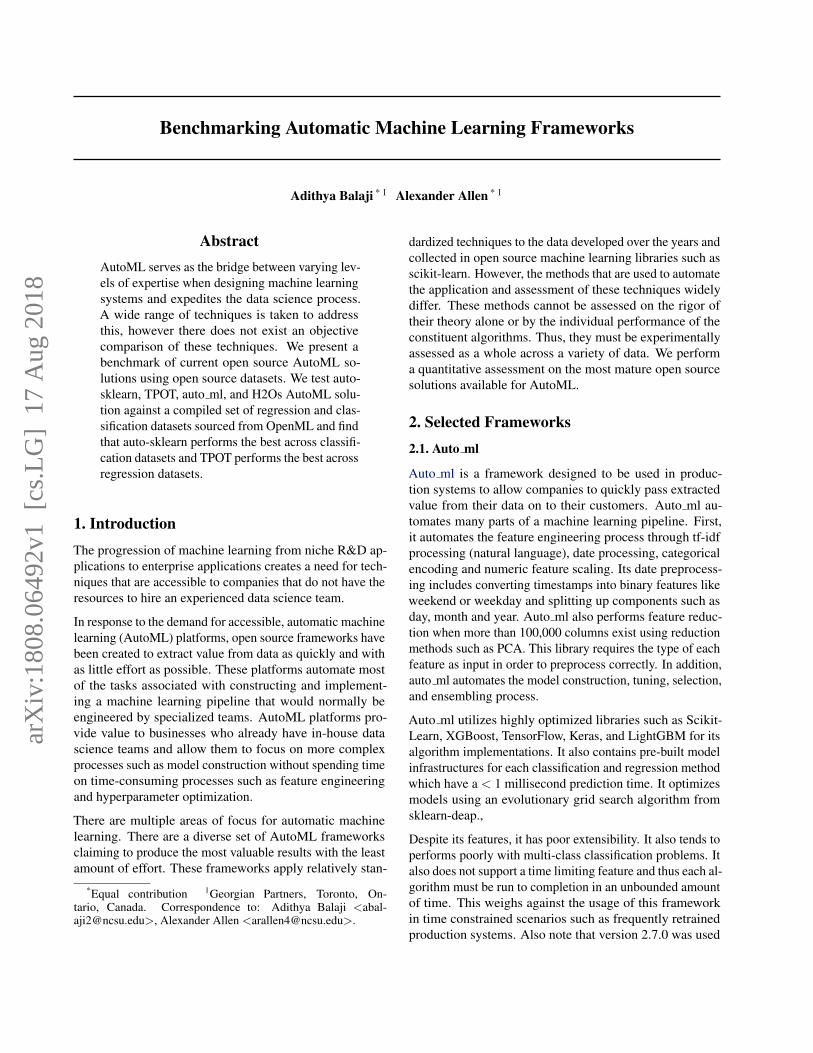
Figure 1. Auto-sklearns process for pipeline optimization
Auto-sklearn wraps the sklearn framework to automaticallycreate a machine learning pipeline. It includes feature engi-neering methods such as one-hot encoding, numeric featurestandardization, PCA and more. The models use sklearnestimators for classification and regression problems. Auto-sklearn creates a pipeline and optimizes it using bayesiansearch. The default hyperparameter values are warm startedusing 140 pre-trained datasets from OpenML using the meta-learning process outlined in figure 1 (Feurer et al., 2015).It computes 38 statistics for a dataset and initializes the hy-perparameters to the optimized parameters of a dataset withstatistics closest to the train set (determined by L1 distance).
Auto-sklearn tries all the relevant data manipulators andestimators on a dataset but can be manually restricted. Italso has multi-threading support. One of the greatest advan-tages of this platform is its easy integration into the existingsklearn ecosystem of tools which provides an avenue forextension. Auto-sklearn uses the optimization frameworkSMAC3 which implements bayesian search along with aracing mechanism to quickly assess model performance.
This package lacks the ability to process natural languageinputs and the ability to automatically discern between cat-egorical and numerical inputs. The package also does nothandle string inputs and requires manual integer encodingto accept categorical strings. Note that version 0.4.0 wasused to test this framework.
2.3. TPOT
Raw Data Data Cleaning
Feature
Selection
Feature Transformation
Model Selection
Feature Construction
Parameter Optimization
Automated by TPOT
Model Validation
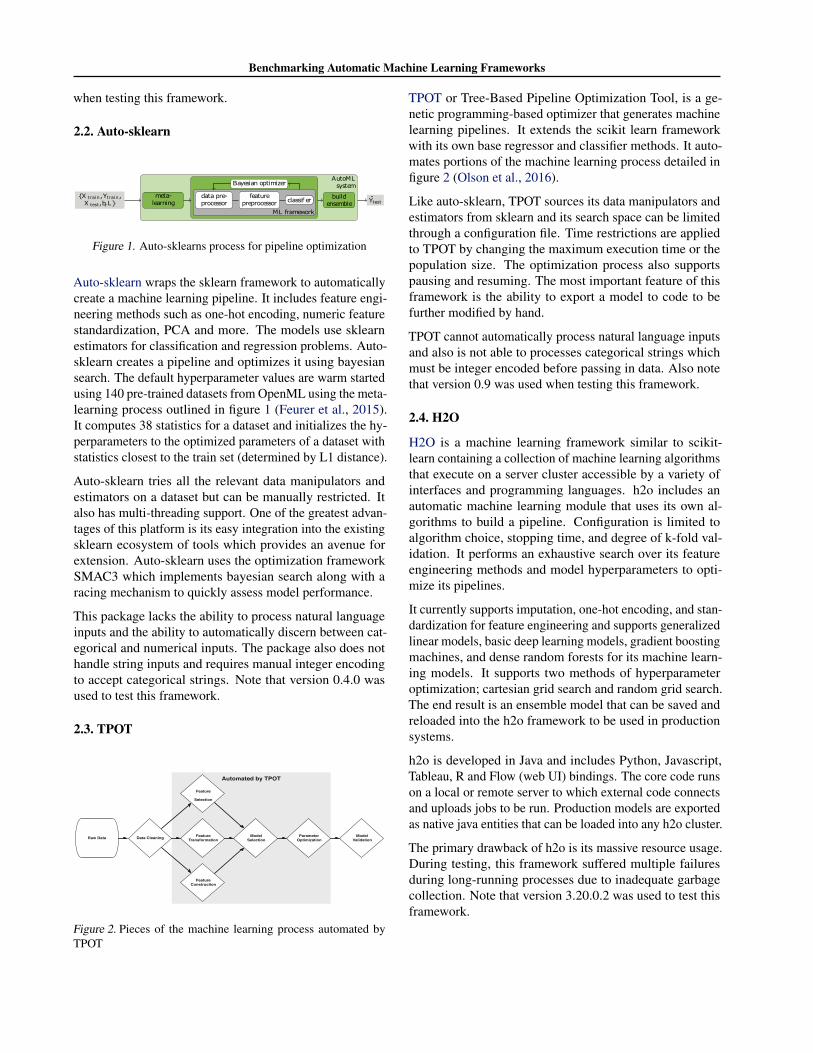
Figure 2. Pieces of the machine learning process automated byTPOT
TPOT or Tree-Based Pipeline Optimization Tool, is a ge-netic programming-based optimizer that generates machinelearning pipelines. It extends the scikit learn frameworkwith its own base regressor and classifier methods. It auto-mates portions of the machine learning process detailed infigure 2 (Olson et al., 2016).
Like auto-sklearn, TPOT sources its data manipulators andestimators from sklearn and its search space can be limitedthrough a configuration file. Time restrictions are appliedto TPOT by changing the maximum execution time or thepopulation size. The optimization process also supportspausing and resuming. The most important feature of thisframework is the ability to export a model to code to befurther modified by hand.
TPOT cannot automatically process natural language inputsand also is not able to processes categorical strings whichmust be integer encoded before passing in data. Also notethat version 0.9 was used when testing this framework.
2.4. H2O
H2O is a machine learning framework similar to scikit-learn containing a collection of machine learning algorithmsthat execute on a server cluster accessible by a variety ofinterfaces and programming languages. h2o includes anautomatic machine learning module that uses its own al-gorithms to build a pipeline. Configuration is limited toalgorithm choice, stopping time, and degree of k-fold val-idation. It performs an exhaustive search over its featureengineering methods and model hyperparameters to opti-mize its pipelines.
It currently supports imputation, one-hot encoding, and stan-dardization for feature engineering and supports generalizedlinear models, basic deep learning models, gradient boostingmachines, and dense random forests for its machine learn-ing models. It supports two methods of hyperparameteroptimization; cartesian grid search and random grid search.The end result is an ensemble model that can be saved andreloaded into the h2o framework to be used in productionsystems.
h2o is developed in Java and includes Python, Javascript,Tableau, R and Flow (web UI) bindings. The core code runson a local or remote server to which external code connectsand uploads jobs to be run. Production models are exportedas native java entities that can be loaded into any h2o cluster.
The primary drawback of h2o is its massive resource usage.During testing, this framework suffered multiple failuresduring long-running processes due to inadequate garbagecollection. Note that version 3.20.0.2 was used to test thisframework.
Benchmarking Automatic Machine Learning Frameworks
3. Benchmarking Methodology3.1. Overview
To accurately compare the selected AutoML frameworks,we design a testing rig to assess each frameworks effective-ness. We write snippets of code for each of the selectedframeworks (TPOT, auto-sklearn, h2o, and auto ml) usingtheir respective pipelines. Depending on the type of model-ing problem, regression or classification, we use differentmetrics: MSE and F1 score (weighted), respectively.
The selection of the benchmarking datasets proves to be achallenging problem. Many open datasets require extensivepreprocessing before use and do not come in the same shapeor form. The OpenML database is chosen to solve thisproblem. (Bischl et al., 2017) OpenML hosts datasets ontheir website while exposing an API to access the datasets.We use a custom set of 57 classification datasets and acustom set of 30 regression datasets to benchmark eachframework.,
In order to achieve consistent results, we generate a set of10 random seeds to fix the random number generator. Thisresults in a compute space of 3,480 test items (10 seeds * 4frameworks * 87 datasets). We set a soft compute time limitof 3 hours per framework and a hard limit of 3.5 hours basedon a survey of each frameworks runtime. The combinationof compute time and the search space results in an estimated10,440 compute hours. This is infeasible to compute locally,thus we implement a distributed solution to execute thebenchmarking suite.
3.2. Distributed Computing Setup
3.2.1. AWS BATCH
We initially choose the Amazon Web Services (AWS) Batchframework to handle the parallelization and load balancingfor this benchmark. This framework accepts a Docker con-tainer from an Amazon Elastic Container Repository (ECR).The container is then repeatedly executed on an Elastic Con-tainer Service (ECS) managed cluster of Elastic Compute(EC2) instances.
We configure the ECS compute cluster to create C4 compute-optimized EC2 instances. These instances run on Intel XeonE5-2666 v3 processors operating at a 2.6 GHz base clockwith a max clock of 3.3 Ghz. Amazons Hardware VirtualMachine (HVM) virtualization method is used to host theseinstances while Docker is used to host the individual con-tainers. These instances include 1.88 Gb of memory pervCPU, 2 to 16 vCPUs and 250 Mbps storage bandwidthper vCPU. ECS automatically selects a combination of in-stances to achieve the necessary number of vCPUs to fullyparallelize the process. Instances with more than 16 vCPUinstances are available but consistency issues with Docker
and Elastic Block Storage (EBS) arise when attempting toexecute more than 16 containers on a single EC2 instance.Thus, we restrict the instance types available to ECS to thec4.4xlarge tier and below. We allocate 2 vCPUs and 4 GBof memory to each container and ECS handles the rest ofthe provisioning process.
We create a Docker image based on the Amazon Linuximage because it is lightweight and compatible with AWSservices. This image includes a script which bootstraps thecontainer with all requirements at runtime. We also create ajob file to serve as an index of all test items and upload itto S3. We then push the local repository to a remote branchand use the boto3 python framework to dispatch the AWSBatch array job to the compute cluster.
Upon container execution, the script clones down the repos-itory, and provisions the python environment. The job fileis also downloaded from S3 and parsed. A unique indexpassed into the container by AWS Batch determines whichjob to execute. Using an OpenML dataset number fromthe job, the required dataset is downloaded to the containerusing the OpenML API.
Finally, the benchmarking core code is called to execute theframework with the specified dataset, framework, and seedfrom the job file. If the framework overruns its time withoutgenerating a model we record this failure, kill the job, andmove to the next test. We take a best-effort approach in en-suring all tests complete and all tests have at least 3 chancesto succeed. The results are then uploaded to S3. These filesare downloaded and concatenated locally to create the finaloutput file which is used to generate the results.
3.2.2. BARE METAL
We find that AWS Batch managed compute environmentsand docker-based resource management can occasionallyresult in unpredictable behavior and performance on largerdatasets on highly parallelized frameworks. The majority ofh2o runs fail and many TPOT runs also fail due to memorylimitations. Specifically, the docker manager sends a killsignal to the benchmarking process if the amount of memoryused by the process exceeds the amount allocated by Batch.This hard limit is not differentiable from the memory used toallocate compute resources in Amazon ECS and thus cannotbe changed without greatly increasing instance size per run.For AutoML frameworks that may spike in memory this isa major issue.
Additionally, it is a known issue that java does not respectdocker container CPU and memory limits by default andthus the heap has to be manually allocated. However, asmentioned above, if the garbage collector space exceeds themax memory, the JVM is killed. This bug is the source ofmany of the failures of h2o.
Benchmarking Automatic Machine Learning Frameworks
In response to these limitations of AWS Batch, we developa custom distributed computing solution running on AWS.We spawn EC2 spot instances with boto3, provision themover SSH, then dispatch a task list to them. Instances arecleaned up by the dispatcher once the time limit for theprocesses are reached. This also allows us to allocate swapspace which is necessary for h2o to execute on machineswith small amounts of RAM. The amount of RAM makesno significant difference in the ability of these frameworksto execute as long as the limit is not reached. h2o moreconsistently succeeds using this method and is no longerkilled for excessive RAM usage.
Although this mechanism is not containerized whereas AWSBatch is; the same memory and CPU constraints are appliedto the system, which is executed on the same hypervisor andhardware platform and thus results in a identical operatingenvironment. The virtualization layer of docker is provento be negligible in regard to RAM access time, RAM space,and CPU capacity. (Felter et al., 2015)
3.3. Issues Encountered
We encounter a multitude of issues when attempting to exe-cute these automatic machine learning frameworks at scalethat we do not typically see when executing them on singledatasets. These issues arise when there are inconsistenciesbetween the datasets we are using, inconsistencies betweenthe random processes of the different pipelines, and incon-sistencies between instances of the compute environments.
Some issues are in the datasets themselves. In some ofthe OpenML datasets, the target feature being predictedis null, a condition which none of the automatic machinelearning frameworks are prepared to handle. Other edgecases include column name hash collisions and extremelylarge datasets such as the full MNIST set (70k data points)which none of the frameworks can complete within therequired time and with the given resources.
Other issues exist in the random processes that occur in themachine learning pipeline. One common failure is in largemulti-class classification tasks in which one of the classeslies entirely on one side of the train test split. Another caseof this is when an entire category of a categorical variablelies on one side of the train test split. We also observerandom failures with some of the sklearn estimators onspecific seeds.
Finally, we resolve framework errors in TPOT and auto mlthat prevent them from executing on certain datasets. InTPOT, the prediction method does not impute null values inthe input, we resolve this by applying the default imputationmethod to any null values. Auto ml also has a number ofbugs and dependency issues in regard to multi-class prob-lems, and multi-model fitting. We also implement weighted
F1 score metrics and optimization in auto ml.
3.4. Individual Framework Configuration
We configure each framework as consistently as possiblein order to ensure maximum fairness. Following is a briefsummary of the configuration and preprocessing required toexecute each framework.
For auto-sklearn, we set the total time left for the task to thetotal available runtime (3 hours) and we also set the per runtime limit to an eighth of that value. The resampling strategyis set to five fold cross validation, and the optimizationmetric is either set to weighted F1 score or mean squarederror depending on the problem type. In addition, we arerequired to provide whether each feature is a categoricalcolumn using OpenML metadata when fitting the estimator.
For TPOT we set the number of generations to 100 and thesize of the population to 100. For classification problems,the internal LinearSVC estimator is disabled as it does notcontain the predict proba function which is required for ourscoring. We also set the max time to 3 hours, the optimiza-tion metric to weighted F1 or mean squared error, and thenumber of jobs to 2 (the number of vCPUs of the computeresource).
For h2o we set the number of threads to 2, the maximumruntime to 3.5 hours (this is decreased to 1.5 hours in incre-ments of 0.5 hours to achieve maximum completion withinthe time limit), the minimum memory allocated to the JVMto seven gigabytes and the maximum memory allocatedto the JVM to 100 gigabytes (enough to prevent cappingout, this is provided through a swap partition allocated atVM provisioning). We also manually define the categor-ical columns as factors using OpenML metadata and setthe optimization metric to mean squared error for regres-sion and log-loss for classification (weighted F1 score is notimplemented).
Finally, for auto ml we provide the feature type fromthe OpenML metadata and set the optimization metric toweighted F1 score for classification and mean squared er-ror for regression. We also limit the classification estima-tors to AdaBoostClassifier, ExtraTreesClassifier, Random-ForestClassifier and XGBClassifier, and limit the regres-sion estimators to BayesianRidge, ElasticNet, Lasso, Las-soLars, LinearRegression, Perceptron, LogisticRegression,AdaBoostRegressor, ExtraTreesRegressor, PassiveAggres-siveRegressor, RandomForestRegressor, SGDRegressor andXGBRegressor. We are unable to set a time limit for auto mland thus to remain within the time limits of the tests we dis-able GridSearchCV hyperparameter optimization.
Benchmarking Automatic Machine Learning Frameworks
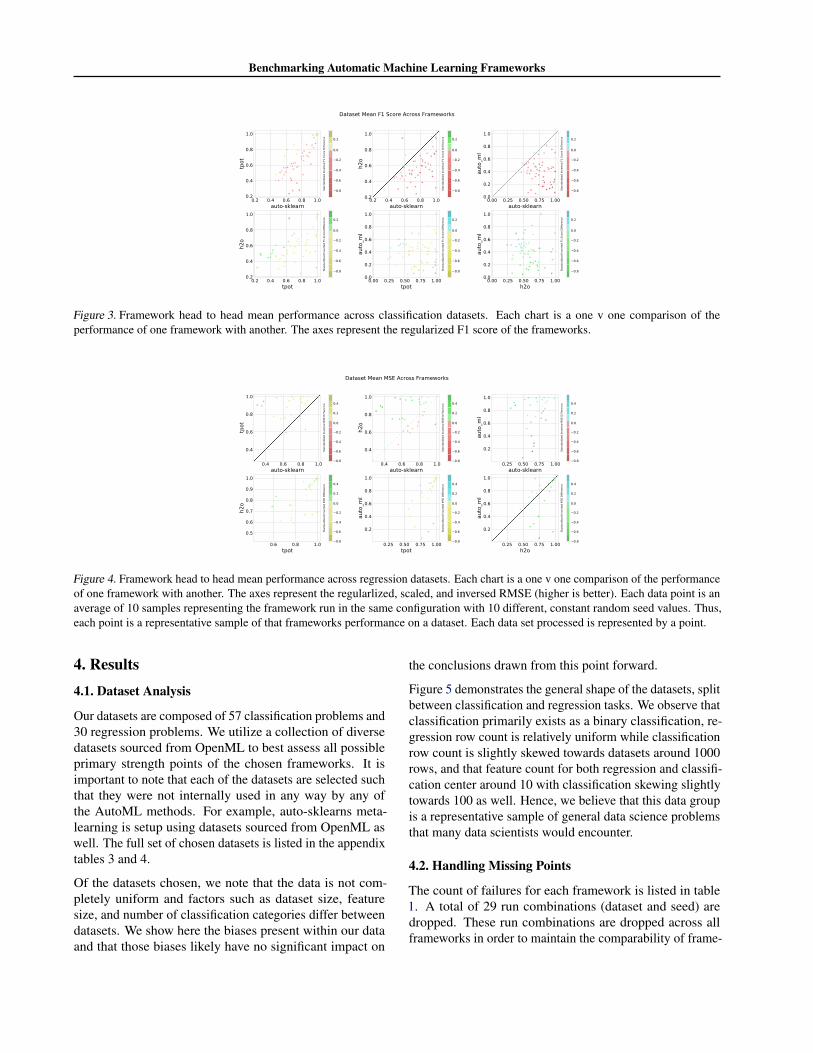
Figure 3. Framework head to head mean performance across classification datasets. Each chart is a one v one comparison of theperformance of one framework with another. The axes represent the regularized F1 score of the frameworks.
Figure 4. Framework head to head mean performance across regression datasets. Each chart is a one v one comparison of the performanceof one framework with another. The axes represent the regularlized, scaled, and inversed RMSE (higher is better). Each data point is anaverage of 10 samples representing the framework run in the same configuration with 10 different, constant random seed values. Thus,each point is a representative sample of that frameworks performance on a dataset. Each data set processed is represented by a point.
4. Results4.1. Dataset Analysis
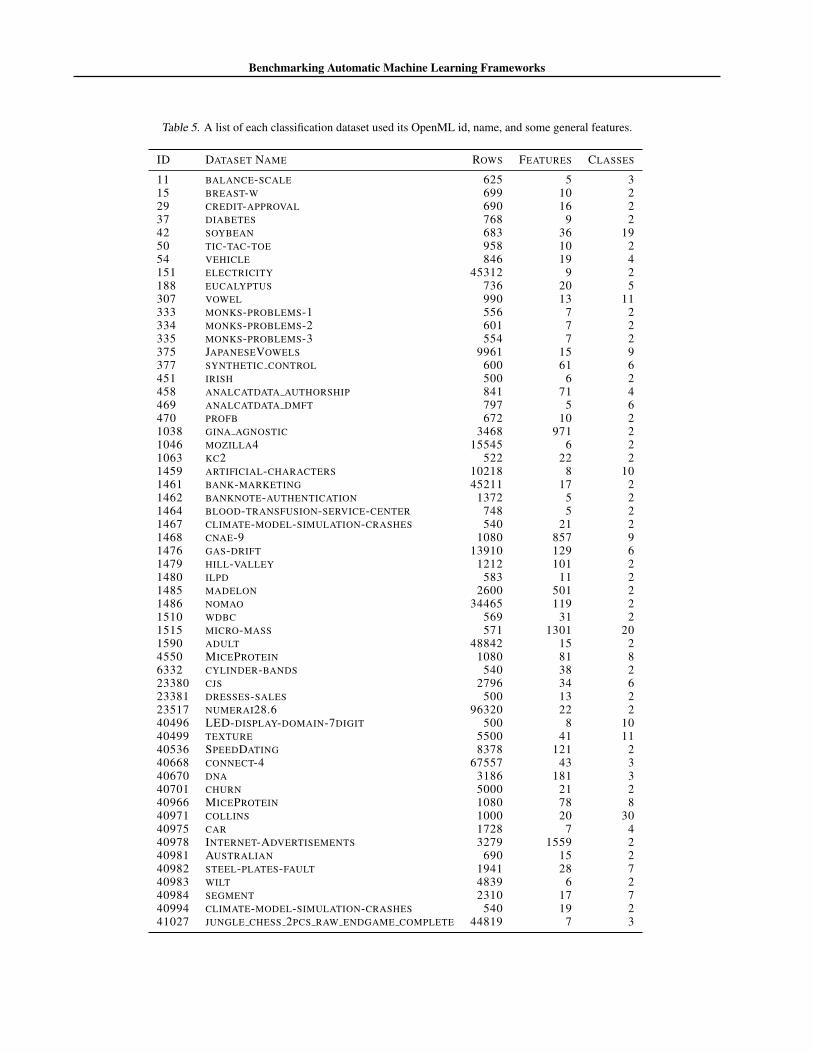
Our datasets are composed of 57 classification problems and30 regression problems. We utilize a collection of diversedatasets sourced from OpenML to best assess all possibleprimary strength points of the chosen frameworks. It isimportant to note that each of the datasets are selected suchthat they were not internally used in any way by any ofthe AutoML methods. For example, auto-sklearns meta-learning is setup using datasets sourced from OpenML aswell. The full set of chosen datasets is listed in the appendixtables 3 and 4.
Of the datasets chosen, we note that the data is not com-pletely uniform and factors such as dataset size, featuresize, and number of classification categories differ betweendatasets. We show here the biases present within our dataand that those biases likely have no significant impact on
the conclusions drawn from this point forward.
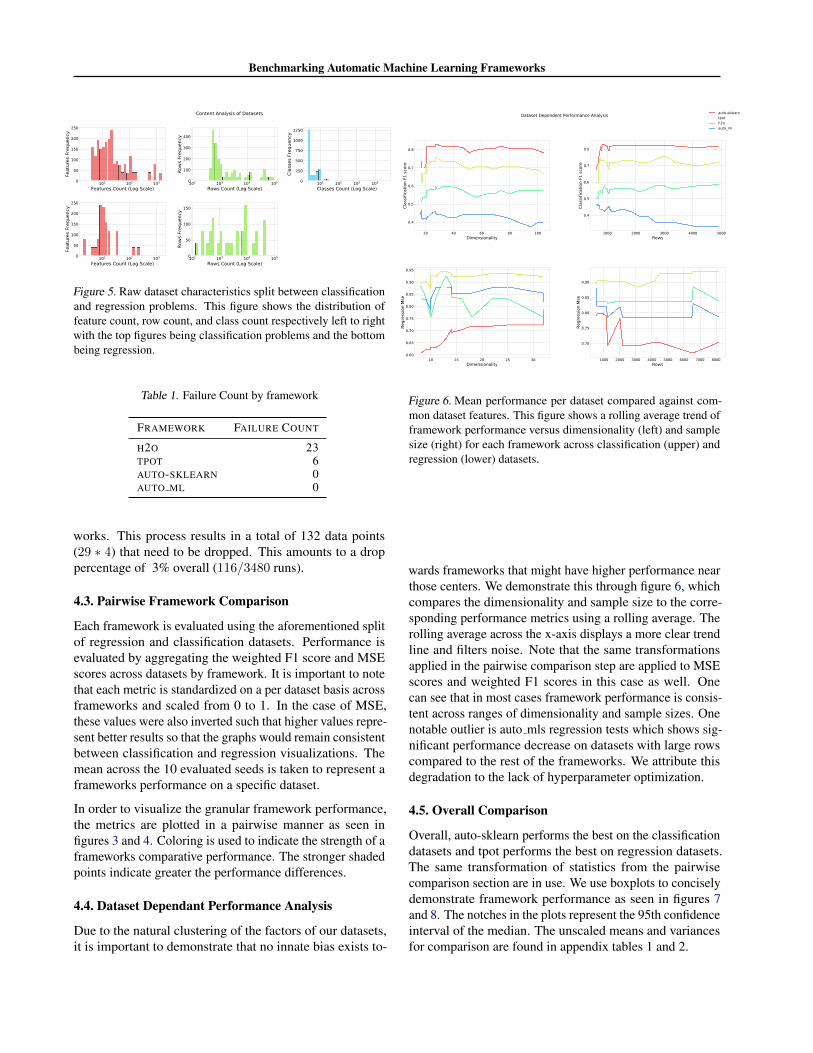
Figure 5 demonstrates the general shape of the datasets, splitbetween classification and regression tasks. We observe thatclassification primarily exists as a binary classification, re-gression row count is relatively uniform while classificationrow count is slightly skewed towards datasets around 1000rows, and that feature count for both regression and classifi-cation center around 10 with classification skewing slightlytowards 100 as well. Hence, we believe that this data groupis a representative sample of general data science problemsthat many data scientists would encounter.
4.2. Handling Missing Points
The count of failures for each framework is listed in table1. A total of 29 run combinations (dataset and seed) aredropped. These run combinations are dropped across allframeworks in order to maintain the comparability of frame-
Benchmarking Automatic Machine Learning Frameworks
Figure 5. Raw dataset characteristics split between classificationand regression problems. This figure shows the distribution offeature count, row count, and class count respectively left to rightwith the top figures being classification problems and the bottombeing regression.
Table 1. Failure Count by framework
FRAMEWORK FAILURE COUNT
H2O 23TPOT 6AUTO-SKLEARN 0AUTO ML 0
works. This process results in a total of 132 data points(29 ∗ 4) that need to be dropped. This amounts to a droppercentage of 3% overall (116/3480 runs).
4.3. Pairwise Framework Comparison
Each framework is evaluated using the aforementioned splitof regression and classification datasets. Performance isevaluated by aggregating the weighted F1 score and MSEscores across datasets by framework. It is important to notethat each metric is standardized on a per dataset basis acrossframeworks and scaled from 0 to 1. In the case of MSE,these values were also inverted such that higher values repre-sent better results so that the graphs would remain consistentbetween classification and regression visualizations. Themean across the 10 evaluated seeds is taken to represent aframeworks performance on a specific dataset.
In order to visualize the granular framework performance,the metrics are plotted in a pairwise manner as seen infigures 3 and 4. Coloring is used to indicate the strength of aframeworks comparative performance. The stronger shadedpoints indicate greater the performance differences.
4.4. Dataset Dependant Performance Analysis
Due to the natural clustering of the factors of our datasets,it is important to demonstrate that no innate bias exists to-
Figure 6. Mean performance per dataset compared against com-mon dataset features. This figure shows a rolling average trend offramework performance versus dimensionality (left) and samplesize (right) for each framework across classification (upper) andregression (lower) datasets.
wards frameworks that might have higher performance nearthose centers. We demonstrate this through figure 6, whichcompares the dimensionality and sample size to the corre-sponding performance metrics using a rolling average. Therolling average across the x-axis displays a more clear trendline and filters noise. Note that the same transformationsapplied in the pairwise comparison step are applied to MSEscores and weighted F1 scores in this case as well. Onecan see that in most cases framework performance is consis-tent across ranges of dimensionality and sample sizes. Onenotable outlier is auto mls regression tests which shows sig-nificant performance decrease on datasets with large rowscompared to the rest of the frameworks. We attribute thisdegradation to the lack of hyperparameter optimization.
4.5. Overall Comparison
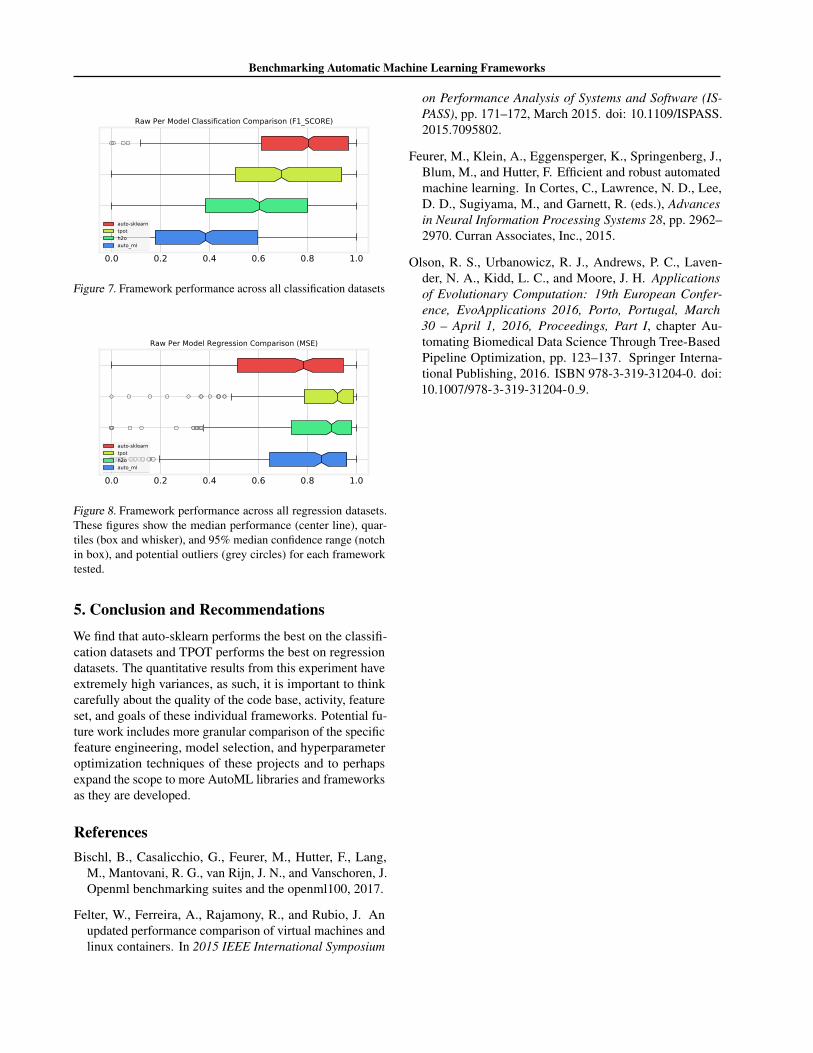
Overall, auto-sklearn performs the best on the classificationdatasets and tpot performs the best on regression datasets.The same transformation of statistics from the pairwisecomparison section are in use. We use boxplots to conciselydemonstrate framework performance as seen in figures 7and 8. The notches in the plots represent the 95th confidenceinterval of the median. The unscaled means and variancesfor comparison are found in appendix tables 1 and 2.
Benchmarking Automatic Machine Learning Frameworks
Figure 7. Framework performance across all classification datasets
Figure 8. Framework performance across all regression datasets.These figures show the median performance (center line), quar-tiles (box and whisker), and 95% median confidence range (notchin box), and potential outliers (grey circles) for each frameworktested.
5. Conclusion and RecommendationsWe find that auto-sklearn performs the best on the classifi-cation datasets and TPOT performs the best on regressiondatasets. The quantitative results from this experiment haveextremely high variances, as such, it is important to thinkcarefully about the quality of the code base, activity, featureset, and goals of these individual frameworks. Potential fu-ture work includes more granular comparison of the specificfeature engineering, model selection, and hyperparameteroptimization techniques of these projects and to perhapsexpand the scope to more AutoML libraries and frameworksas they are developed.
ReferencesBischl, B., Casalicchio, G., Feurer, M., Hutter, F., Lang,
M., Mantovani, R. G., van Rijn, J. N., and Vanschoren, J.Openml benchmarking suites and the openml100, 2017.
Felter, W., Ferreira, A., Rajamony, R., and Rubio, J. Anupdated performance comparison of virtual machines andlinux containers. In 2015 IEEE International Symposium
on Performance Analysis of Systems and Software (IS-PASS), pp. 171–172, March 2015. doi: 10.1109/ISPASS.2015.7095802.
Feurer, M., Klein, A., Eggensperger, K., Springenberg, J.,Blum, M., and Hutter, F. Efficient and robust automatedmachine learning. In Cortes, C., Lawrence, N. D., Lee,D. D., Sugiyama, M., and Garnett, R. (eds.), Advancesin Neural Information Processing Systems 28, pp. 2962–2970. Curran Associates, Inc., 2015.
Olson, R. S., Urbanowicz, R. J., Andrews, P. C., Laven-der, N. A., Kidd, L. C., and Moore, J. H. Applicationsof Evolutionary Computation: 19th European Confer-ence, EvoApplications 2016, Porto, Portugal, March30 – April 1, 2016, Proceedings, Part I, chapter Au-tomating Biomedical Data Science Through Tree-BasedPipeline Optimization, pp. 123–137. Springer Interna-tional Publishing, 2016. ISBN 978-3-319-31204-0. doi:10.1007/978-3-319-31204-0 9.
Benchmarking Automatic Machine Learning Frameworks
A. Additional Tables
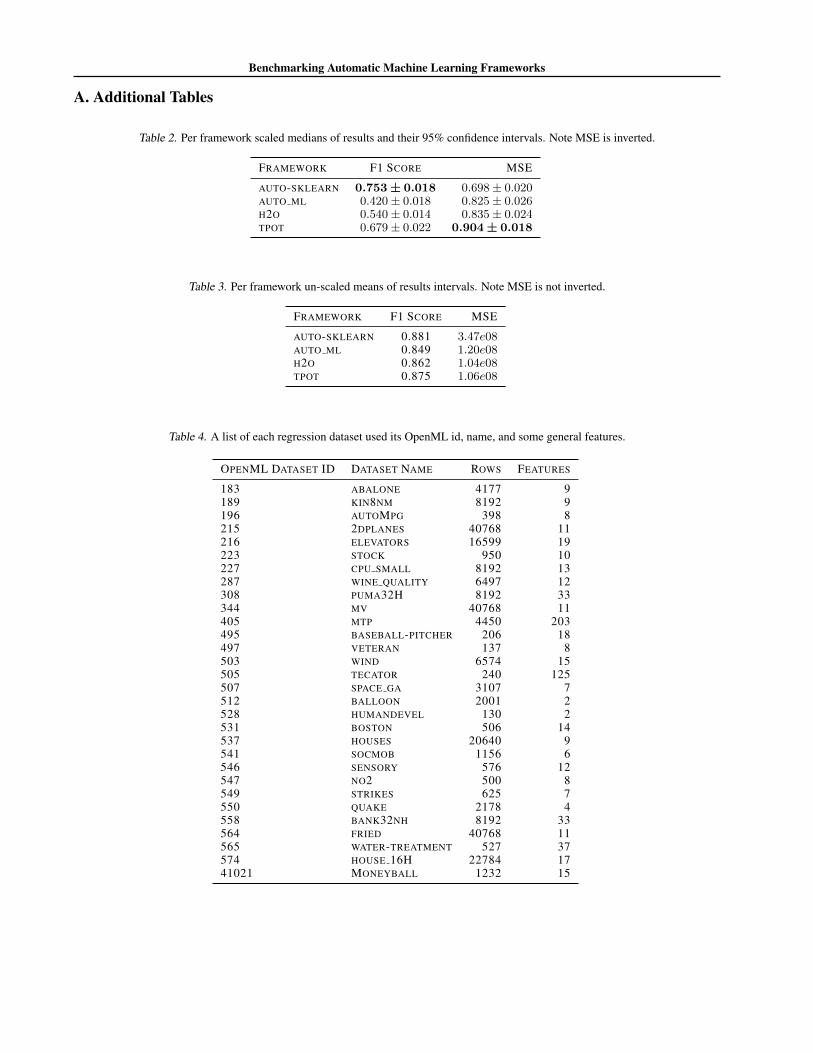
Table 2. Per framework scaled medians of results and their 95% confidence intervals. Note MSE is inverted.
FRAMEWORK F1 SCORE MSE
AUTO-SKLEARN 0.753± 0.018 0.698± 0.020AUTO ML 0.420± 0.018 0.825± 0.026H2O 0.540± 0.014 0.835± 0.024TPOT 0.679± 0.022 0.904± 0.018
Table 3. Per framework un-scaled means of results intervals. Note MSE is not inverted.
FRAMEWORK F1 SCORE MSE
AUTO-SKLEARN 0.881 3.47e08AUTO ML 0.849 1.20e08H2O 0.862 1.04e08TPOT 0.875 1.06e08
Table 4. A list of each regression dataset used its OpenML id, name, and some general features.
OPENML DATASET ID DATASET NAME ROWS FEATURES
183 ABALONE 4177 9189 KIN8NM 8192 9196 AUTOMPG 398 8215 2DPLANES 40768 11216 ELEVATORS 16599 19223 STOCK 950 10227 CPU SMALL 8192 13287 WINE QUALITY 6497 12308 PUMA32H 8192 33344 MV 40768 11405 MTP 4450 203495 BASEBALL-PITCHER 206 18497 VETERAN 137 8503 WIND 6574 15505 TECATOR 240 125507 SPACE GA 3107 7512 BALLOON 2001 2528 HUMANDEVEL 130 2531 BOSTON 506 14537 HOUSES 20640 9541 SOCMOB 1156 6546 SENSORY 576 12547 NO2 500 8549 STRIKES 625 7550 QUAKE 2178 4558 BANK32NH 8192 33564 FRIED 40768 11565 WATER-TREATMENT 527 37574 HOUSE 16H 22784 1741021 MONEYBALL 1232 15
Benchmarking Automatic Machine Learning Frameworks
Table 5. A list of each classification dataset used its OpenML id, name, and some general features.
ID DATASET NAME ROWS FEATURES CLASSES
11 BALANCE-SCALE 625 5 315 BREAST-W 699 10 229 CREDIT-APPROVAL 690 16 237 DIABETES 768 9 242 SOYBEAN 683 36 1950 TIC-TAC-TOE 958 10 254 VEHICLE 846 19 4151 ELECTRICITY 45312 9 2188 EUCALYPTUS 736 20 5307 VOWEL 990 13 11333 MONKS-PROBLEMS-1 556 7 2334 MONKS-PROBLEMS-2 601 7 2335 MONKS-PROBLEMS-3 554 7 2375 JAPANESEVOWELS 9961 15 9377 SYNTHETIC CONTROL 600 61 6451 IRISH 500 6 2458 ANALCATDATA AUTHORSHIP 841 71 4469 ANALCATDATA DMFT 797 5 6470 PROFB 672 10 21038 GINA AGNOSTIC 3468 971 21046 MOZILLA4 15545 6 21063 KC2 522 22 21459 ARTIFICIAL-CHARACTERS 10218 8 101461 BANK-MARKETING 45211 17 21462 BANKNOTE-AUTHENTICATION 1372 5 21464 BLOOD-TRANSFUSION-SERVICE-CENTER 748 5 21467 CLIMATE-MODEL-SIMULATION-CRASHES 540 21 21468 CNAE-9 1080 857 91476 GAS-DRIFT 13910 129 61479 HILL-VALLEY 1212 101 21480 ILPD 583 11 21485 MADELON 2600 501 21486 NOMAO 34465 119 21510 WDBC 569 31 21515 MICRO-MASS 571 1301 201590 ADULT 48842 15 24550 MICEPROTEIN 1080 81 86332 CYLINDER-BANDS 540 38 223380 CJS 2796 34 623381 DRESSES-SALES 500 13 223517 NUMERAI28.6 96320 22 240496 LED-DISPLAY-DOMAIN-7DIGIT 500 8 1040499 TEXTURE 5500 41 1140536 SPEEDDATING 8378 121 240668 CONNECT-4 67557 43 340670 DNA 3186 181 340701 CHURN 5000 21 240966 MICEPROTEIN 1080 78 840971 COLLINS 1000 20 3040975 CAR 1728 7 440978 INTERNET-ADVERTISEMENTS 3279 1559 240981 AUSTRALIAN 690 15 240982 STEEL-PLATES-FAULT 1941 28 740983 WILT 4839 6 240984 SEGMENT 2310 17 740994 CLIMATE-MODEL-SIMULATION-CRASHES 540 19 241027 JUNGLE CHESS 2PCS RAW ENDGAME COMPLETE 44819 7 3