benchmarking air emissions of the 100 largest electric ... · pollutant emissions of the 100...
TRANSCRIPT

March 2002
Benchmarking Air Emissions of the100 Largest Electric GenerationOwners in the U.S.--2000
Natural ResourcesDefense Council(NRDC)
Public ServiceEnterprise Group
(PSEG)
Coalition for EnvironmentallyResponsible Economies
(CERES)
Second Edition

i
PREFACE
This report is the product of a collaborative effort between the Natural Resources Defense Council
(NRDC), Public Service Enterprise Group (PSEG) and the Corporate Climate Accountability Project of
the Coalition for Environmentally Responsible Economies (CERES). The report uses publicly reported
data to compare 2000 emissions performance of the largest electric generation owners in the U.S. It
follows and parallels two previous reports that examined 1995 and 1996 emissions performance in the
industry.
The report is available in PDF format on the Internet at: http://www.ceres.org
An additional printed copy of this report can be obtained for a cost of $50 from:
Dan BakalCERES11 Arlington StreetBoston, MA 02116Tel: 617-247-0700E-mail: [email protected]
Questions or comments about the report please contact:
Michael WalkerE3 Ventures, Inc.1140 Kildaire Farm Rd., Suite 304Cary, NC 27511Tel: 919-469-3737E-mail: [email protected]

ii
ACKNOWLEDGMENTS
Project Managers:
Mark Brownstein, PSEG
David Gardiner, Gardiner & Associates, LLC
Report Author:
Michael Walker, E3 Ventures, Inc.
Contributors:
Ralph Cavanagh, NRDC
Lily Donge, Calvert Asset Management Co.
Chris Fox, CERES
Debra Hall, CERES
David Johnson, E3 Ventures, Inc.
Daniel Lashof, NRDC
Nicole St. Clair, CERES
Ian Watt, CERES

iii
TABLE OF CONTENTS
EXECUTIVE SUMMARY..............................................................................1
1.0 REPORT METHODOLOGY................................................................6
Power plant data
Plant Ownership
Emissions Rates
2.0 RANKINGS OF LARGEST 100
ELECTRIC GENERATION OWNERS................................................8
Emissions Rankings
3.0 INFORMATION TRANSPARENCY &CORPORATE ACCOUNTABILITY................................................29
Public Information
Corporate Self-evaluation
4.0 POLICY CONSIDERATIONS...........................................................32
Energy Efficiency
Advanced Generation Technologies
Multi-pollutant Legislation
5.0 CONCLUSIONS.................................................................................38
APPENDIX A: ENVIRONMENTAL IMPACTS......................................39
APPENDIX B: GENERATION TECHNOLOGIES...................................46
APPENDIX C: DATA QUALITY..............................................................54
NOTES..........................................................................................................62

Electricity production is a vital component of the
national economy. Its availability, price and
reliability have extensive impacts on economic
production, energy security and individual
consumers. At the same time, electricity production
from fossil-fuel power plants, which account for
about 70% of total U.S. electric generation, releases
air emissions that contribute to local, regional and
global air pollution problems that affect public
health and the environment. In combination, these
circumstances support the need for transparent
public information on electric industry operations
and emissions to promote public understanding,
corporate accountability and informed public policy
decisions.
This report examines and compares the air
pollutant emissions of the 100 largest electric
generation owners in the U.S.--including both
public and private entities (”companies”)--based
on year 2000 plant ownership and emissions
data (Table ES-1). These companies together
own about 2,000 power plants and account for
about 90% of reported electric industry
generation and emissions.
The report focuses on four power plant
pollutants for which public emissions
information is available—carbon dioxide (CO2),
mercury (Hg), oxides of nitrogen (NOx) and
sulfur dioxide (SO2). Figure ES-1 illustrates
seven primary concerns associated with these
1
EXECUTIVE SUMMARY
Rank Name
2000 MWh(Millions)
2000 MWh(Millions)
2000 MWh(Millions)
2000 MWh(Millions)
1 American Electric Power 199.1
2 Southern Company 172.2
3 Tennessee Valley Authority 153.4
4 Exelon 134.0
5 Xcel Energy 110.2
6 Entergy 103.9
7 Duke Energy 99.1
8 TXU 96.9
9 Progress Energy 85.1
10 FPL Group 84.3
11 Reliant Energy 83.3
12 Edison International 82.6
13 FirstEnergy 72.9
14 US Army Corp of Eng. 72.5
15 Dominion Resources 70.3
16 Cinergy 64.8
17 Ameren 59.6
18 ScottishPower 53.1
19 Allegheny Energy 48.7
20 US Bureau of Recl. 48.7
21
PPL 47.422
PG&E 43.923
DTE Energy 41.424
Mirant 40.925
PSEG 40.2
Rank Name
51 Associated Electric Coop 15.2
52 Los Angeles City of 15.0
53 Kansas City Power & Light 15.0
54 Orion Power 14.5
55 Nebraska Pub Power District 14.4
56 Sierra Pacific Resources 13.7
57 Intermountain Power Agency 13.2
58 Conectiv 12.4
59 JEA 12.4
60 WPS Resources 12.3
61 UniSource Energy 12.2
62 Enron 12.0
63
64
Omaha Pub Power District 11.8
65
Lower CO River Auth 11.4
66
Municipal Electric Auth 11.4
67
Great River Energy 11.1
68
Dow Chemical 11.0
69
Austin Energy 10.8
70
Tri-State G & T Assn 10.7
71
Public Service Co of NM 10.5
72
Calpine 10.4
73
Sithe 10.3
74
Arkansas Electric Coop 10.0
75
PUD No 2 of Grant Cnty 9.6
Rank Name
26
Power Authority of NY 37.127
PowerGen 48.3
28 AES 36.1
29 Wisconsin Energy 33.5
30 Constellation Energy 32.8
31 Western Resources 26.2
32 Alliant Energy 25.1
33 CMS Energy 25.1
34 Salt River Project 24.8
35 Pinnacle West Capital 24.3
36 OGE Energy 23.3
37 Dynegy 22.2
38 Northeast Utilities 21.8
39 SCANA 21.5
40 S.C. Pub Serv Auth 20.6
41 MidAmerican Energy 20.5
42 San Antonio Pub Serv Bd 19.7
43 Oglethorpe Power 18.6
44 DPL 17.7
45 NiSource 17.2
46 TECO Energy 17.1
47 Ipalco Enterprises 17.0
48 KeySpan 16.3
49 IDACORP 16.3
50 Basin Elec Power Coop 16.2
Rank Name
76
Transalta 9.5
77
PUD No 1 of Chelan Cnty 9.5
78
Seminole Electric Coop 9.2
79
E. Kentucky Power Coop 9.1
80
British Energy 9.1
81
Energy Northwest 8.7
82
El Paso Electric 8.7
83
Vectren 8.6
84
Hoosier Energy R E C 8.5
85
State St Bank Trust 8.4
86
Niagara Mohawk 8.2
87
Puget Sound Energy 7.9
88
Buckeye Power 7.4
89
CLECO 7.0
90
Allete 6.9
91
N.C. Mun Power Agny 6.7
92
Utilicorp United 6.7
93
RGS Energy 6.6
94
Seattle City of 6.4
95
Exxon Mobil 6.0
96
Avista 5.8
97
Orlando Utilities Comm 5.8
98
Cogen Technologies 5.6
99
Hawaiian Elec Industries 5.5
100
International PaperGrand River Dam Auth.
5.55.3
Table ES-1. 100 largest owners of electric generation in the U.S. in 2000.

pollutants, including acid deposition (NOx, SO2),
climate change (CO2), fine particulates (NOx, SO2),
mercury deposition (Hg), nitrogen deposition (NOx),
ozone smog (NOx), and regional haze (NOx, SO2)
(See Appendix A for details).
Corporate emissions and emission rates (“emissions
performance”) for these four pollutants are
compared across the 100 companies to “benchmark”
their performance against one another. This type of
performance “benchmarking” is commonly used to
evaluate productivity, financial performance or
safety records and, in recent years, a growing
number of companies have begun to benchmark
their annual environmental performance through
their participation in initiatives such as CERES
and the Global Reporting Initiative (GRI). The
information contained in this report is intended
to aid comparison and corporate self-evaluation
of emissions performance across the largest
electric generating companies.
The information also enables consumers and
investors to independently assess electric
industry emissions and emissions rates. For
example, the information could be used to
evaluate the accuracy of corporate
environmental statements, the contributions of
individual companies to air quality
problems and corporate exposures to
potential changes in environmental
requirements. Concerns stemming from
the Enron case are likely to increase
public appetite for transparent
information about all aspects of
corporate performance, including this
type of environmental information.
Finally, the information is relevant for
evaluating the merits and impacts of
different energy and environmental
policy proposals affecting the electric
industry. On February 14, 2002 the
Bush Administration proposed new
power plant emission reduction
programs for Hg, NOx and SO2, as
well as a CO2 initiative. At the same
time, federal legislators are actively
considering proposals for
comprehensive energy legislation,
multi-pollutant emissions reduction
programs, renewable energy portfolio
standards, efficiency standards, tax
incentives and other initiatives that
affect electric industry operations and
the environment. Basic information on
current emissions performance in the
industry helps inform these policy
discussions.
2
NitrogenDeposition
MercuryDeposition
ClimateChange
OzoneSmog
FineParticulates
AcidDeposition
RegionalHaze
ClimateChange
MercuryDeposition
OzoneSmog
NitrogenDeposition
FineParticulates
AcidDeposition
CO2
Hg
NOx
NOx
NOx, SO2
NOx, SO2
NOx, SO2
--Extreme weather
--Respiratory harm
--Crop damage
--Excess nitrogen loading insensitive water bodies
--Premature mortality
--Lung & heart disease
--Acidifies lakes & streams
--Forest damage
--Reduced visibility inNational Parks
--Bioaccumulation
--Toxic to humans
Problems ImpactsEmissions
--Harms aquatic plants & animals
--Reduced crop yields andimpacts to natural systems
RegionalHaze
RegionalHaze
Figure ES-1. Seven environmental concerns associated with powerplant emissions.

Major Findings
The U.S. electric industry remains a major sourceof air pollution
• Power plants are responsible for about 40% of
CO2, 33% of Hg, 23% of NOx, and 67% of SO2
emissions in the U.S. (Figure ES-2).
• The U.S. electric industry accounts for 26% of
worldwide CO2 emissions from electricity and
heat production, and almost 10% of total
manmade CO2 emissions worldwide (Figure
ES-2).
The largest owners of electric generationaccount for the vast majority of power plantemissions
• Over 650 public and private entities owned
some portion of the electricity produced in
the U.S. in 2000.
• The 100 largest electric generation owners
accounted for 87% of U.S. generation and
emitted between 88% (CO2) and 93% (SO2)
of total reported electric industry emissions.
• Public power accounted for about 10% of
emissions among the 100 largest generation
owners, with the federally-owned Tennessee
Valley Authority responsible for about 6%.
• Across the entire electric industry, fewer
than 20 companies accounted for over 50%
of reported industry emissions, as follows:
– 16 companies were responsible for 50% of
NOx emissions;
– 12 companies were responsible for 50% of
SO2 emissions;
– 18 companies were responsible for 50% of
CO2 emissions; and
– 12 companies were responsible for 50% of
Hg emissions (Figure ES-3).
• Six or fewer companies accounted for 25%
of reported industry emissions, as follows:
– 5 companies were responsible for 25% of
NOx emissions;
– 4 companies were responsible for 25% of
SO2 and Hg emissions; and
– 6 companies were responsible for 25% of
CO2 emissions (Figure ES-3).
• The three largest electric generating
companies--American Electric Power,
Southern Company, and Tennessee Valley
Authority--collectively accounted for
between 17-24% of total industry emissions
for each pollutant.
3
Electric67%
23%
7%
Electric40%
15%
32%
6%
Electric33%
33%
18%
10%
Electric23%
16%55%
CO2 Hg
SO2NOx
Industrial
Commercial
Residential
Transportation
Manufacturing
Incinerators
Other
Sources:NOx and SO : EPA, National Air Quality and Emissions Trend Report 1999, March 2001.2
CO : EIA, Emissions of Greenhouse Gases in the United States 2000, November 2001.2
Hg: EPA, Mercury Study Report to Congress, December 1997.
U.S. Electric10%
OtherSectors
65%
Total Electric35%
U.S.26%
Manmade CO Worldwide2 Worldwide CO fromElectricity & Heat production
2
Source: International Energy Administration,CO Emissions from Fuel Combustion, 1999 Edition.2
ES-2. U.S. electric industry emissions contribution.

Significant emissions rate disparities continue toexist in the electric industry
• The weighted average “all source” emission rates
of the largest 100 companies, measured as
pounds of emissions per megawatt-hour of
generation across all generation sources
(lbs/MWh), were 3.0 for NOx, 6.7 for SO2 and
1,400 for CO2.
• There is broad variability around these average
all source emission rates. For example, four
companies had rates more than twice the average
NOx rate and eight companies had rates more
than twice the average SO2 rate. No companies
had CO2 rates more than twice the average, but
19 companies (including seven companies with
zero emissions) had CO2 rates that were less than
half the average.
• When only the emissions and generation from
coal plants were evaluated, NOx emission rates
were over two times higher for some companies
than others, SO2 emission rates were four times
higher and the highest CO2 emission rate was
34% higher than the lowest.
Electric industry emissions information shouldbe accessible and accurate
• Transparent electric industry emissions and
operational information enables consumers,
investors and policymakers to independently
evaluate emissions performance to inform
purchasing and policy decisions.
• Public information is currently available
through multiple government databases that
are not user friendly and contain inconsistent
data.
• The federal government can and should do
more to improve the consistency, accuracy
and accessibility of reported electric industry
information.
Corporate self-evaluation of emissionsperformance is prudent and beneficial
• Emissions performance comparisons enable
companies to put their emissions and
emission rates in context.
• By understanding and tracking corporate
performance, companies can evaluate how
4
25%
50%
75%
100%
NOx(5.5 million tons)
SO(
2
11.5 million tons)
CO(
2
2.6 billion tons)
Hg(48 tons)
Top 100Generators
(89%)
Top 100Generators
(93%)
Top 100Generators
(93%)
Top 100Generators
(88%)
5 Companies 4 Companies 6 Companies
18 Companies
49 Companies
4 Companies
16 Companies
43 Companies
12 Companies
31 Companies
12 Companies
32 Companies
Percent oftotal
ES-3. Contribution of individual companies to total electric industry emissions.

different business decisions may affect emissions
performance and be in a position to appropriately
consider environmental issues in corporate
decision-making.
• Since most power plant investment decisions
involve emissions creation or reduction, and
power plants tend to last well over 30 years,
small changes in corporate behavior can have
significant implications for environmental
quality over time.
Federal energy and environmental policies need tobe coordinated
• Power plant emissions are directly linked to the
efficiency of electricity production and
consumption.
• Energy policies that influence the next
generation of electric appliances and generation
technologies will also affect electric industry
emissions and the costs of emissions reduction.
• National multi-pollutant power plant emissions
reduction proposals, energy efficiency programs,
and advanced generation technology incentives
are compatible policy initiatives for reducing air
pollutant emissions, improving business
certainty, enhancing the efficiency of electricity
consumption and commercializing technologies
that will provide economic and sustainable
long-term electricity supplies.
5

This report examines the air pollutant emissions of
the 100 largest electric generation owners in the U.S.
based on year 2000 plant ownership and emissions
data.1 It follows and parallels two previous reports
that examined 1995 and 1996 electric industry air
pollutant emissions.2 Like the previous reports, this
report provides comparison rankings for evaluating
corporate total emissions (tons) and average
emissions rates, expressed in pounds per
megawatt-hour (lbs/MWh).
The emissions information and comparisons were
derived from publicly available data from the
Environmental Protection Agency (EPA), Energy
Information Administration (EIA), corporate web
pages, and corporate filings with the Securities and
Exchange Commission (SEC). With very few
exceptions (See Appendix C), the data used in the
report reflect power plant emissions and generation
data reported by the electric industry to the federal
government, which have been summed using the
best information available on power plant ownership
to illustrate corporate totals.
Power Plant Data
Power plant CO2, NOx, and SO2 emissions
information was derived primarily from EPA’s acid
rain emissions reporting program, which collects
hourly emissions data from over 900 power plants
based on Continuous Emissions Monitors (CEMs).3
After collecting and reviewing the hourly CEM data,
EPA publishes annual CO2, NOx, and SO2 emissions
totals for each reporting plant in its Emissions
Scorecard. The 2000 Emissions Scorecard was used
to establish 2000 power plant CO2, NOx and SO2
emissions totals for all plants subject to CEM
reporting. This data accounted for about 97% of
the emissions information for these pollutants
used in this report.
Additional emissions data for smaller plants not
reported in the Emissions Scorecard were
derived from EPA’s EGRID2000 database,
which reports 1998 emissions and emissions
rates for over 2,800 plants. For plants not subject
to CEM reporting, NOx, SO2 and CO2 emissions
rates from EGRID2000 were applied to year
2000 generation data to derive year 2000
emissions estimates. Emissions estimated using
EGRID2000 account for about 3% of the CO2 ,
NOx and SO2 emissions data used in the report
(See Appendix C for details).
Power plant mercury emissions information was
taken from EPA’s web site, which provides
plant-by-plant mercury emissions estimates for
all major coal-fired power plants.4 These
mercury emissions data are based on
calculations by EPA using 1999 fuel information
and the latest emissions factors for coal-fired
power plants developed by the agency. Although
they represent the best information currently
available, the mercury emissions data are
probably less accurate than information derived
from CEM monitoring.
Importantly, the SO2 emissions and emissions
rates in this report are based on actual emissions
and do not take into account emissions
allowances purchased or sold under the acid rain
emissions trading program. Companies with
high SO2 emissions or emission rates may be
paying for emissions reductions elsewhere by
6
1.0 REPORT METHODOLOGY

purchasing emissions allowances, and companies
with low SO2 emissions may be selling allowances
that enable other companies to increase emissions.
This report focuses on physical emissions only, and
does not take into account the effects of emissions
trading transactions.
Along with EPA emissions information, information
on 2000 power plant electricity generation was
derived from data reported by electric generators to
the Energy Information Administration (EIA). EIA
releases power plant generation information through
several databases, including the EIA-906 and
EIA-767 databases. The EIA-906 database provides
monthly and annual generation information by fuel
type for utility power plants as well as monthly
generation information by fuel type for non-utility
power plants. Year 2000 generation data were
established for all but 12 power plants using this
database. EIA-906 generation data were found to be
missing or not compatible with other data for 12
plants, so EIA-767 generation data were substituted
(See Appendix C for details).
Plant Ownership
This report seeks to capture power plant ownership
as of December 31, 2000. Ownership was
established using EPA’s ownership information
from its EGRID2000 database (with ownership as of
December 31, 2000), which was further updated
with information from corporate web pages, annual
reports, and SEC 10K filings. Appendix C indicates
where the ownership information in this report
differs from EPA’s EGRID2000 ownership
information.
Identifying “who owns what” in the rapidly
changing electric industry is the most difficult and
complex aspect of developing corporate emissions
performance rankings. Not only are a number of
power plants jointly owned by different companies,
but in recent years many power plants, or shares of
power plants, have been bought and sold, and many
companies have merged or reorganized.
Although considerable effort was expended
checking the accuracy of the power plant
ownership information used in this report, there
may be inadvertent errors in the assignment of
ownership for some plants where public
information was not current or could not be
verified.
Emissions Rates
The corporate emission rate comparisons
presented in the report represent weighted
average emission rates for all plants owned by
each company. All-source emission rates,
expressed as pounds of emissions per
megawatt-hour of total generation, were
developed by simply dividing each company’s
NOx, SO2 and CO2 emissions totals (converted
to pounds), by each company’s total MWh’s of
generation. No emission rates were developed
for Hg because EPA Hg emissions estimates are
based on 1999 fuel information that may not be
compatible with 2000 generation information.
Similarly, fossil-fuel emissions rates were
derived by dividing each company’s emissions
associated with fossil fuel plants, by the
company’s MWh of fossil generation. Fossil
generation was determined using the fuel
information contained in the EIA-906 databases.
In the same manner, coal plant emission rates
were determined by taking the emissions
associated with each company’s coal plants and
dividing by the MWh’s of generation from these
coal plants. The coal plant emissions and
generation information was based on annual
plant totals, including only plants where
coal-fired generation accounted for at least 75%
of total fossil generation. Since most coal plants
fire other fuels in addition to coal, the coal plant
emission rates include some emissions and
generation from fuels other than coal.
7

Over 5,000 power plants generate electricity in the
United States.5 About 70% of the electricity
generation in 2000 was fueled by fossil fuels, with
52% from coal (Figure 2.1).6 Although technologies
exist today for fossil fuel-fired electricity generation
to achieve very low emissions, the existing fleet of
power plants generally does not have state-of-the-art
pollution control technologies and remains a major
emissions source that contributes to multiple air
pollution problems related to health, environmental,
and climate concerns.
The 100 largest owners of electric generation
cumulatively own over 1,900 power plants in the
U.S., produce about 87% of the nation’s
electricity, and are responsible for about 90% of
reported air emissions. These “companies”
include 73 investor owned companies, 8
municipalities, 7 cooperatives, 6 power districts,
3 state power authorities and 3 federal power
authorities (Figure 2.2).
Each of the 100 companies’ 2000 electricity
generation, expressed in megawatt-hours
(MWh), is shown by fuel type in Figure 2.3.
These generation totals represent 2000
generation from facilities owned or partially
owned by each company and reported by EIA.
The figure shows the wide
range of fuels used to
generate electricity, with
coal and/or nuclear
accounting for the largest
percentages of most
companies’ generation. The
exceptions are a few
companies that operate
large hydroelectric facilities
and several companies with
significant natural gas-fired
generation. The figure also
illustrates the small role
currently played by
non-hydro renewable
energy sources, which
account for less than 1-2%
of generation for most
companies.
8
2.0 RANKINGS OF LARGEST 100 ELECTRIC
GENERATION OWNERS
Coal
Oil
Gas
Nuclear
Hydro
Other Renewable
Coal
Oil
Gas
Nuclear
Hydro
Other Renewable
Location & relative size of U.S. power plants by fuel type
Figure 2.1. U.S. Electric generation by fuel type.

Emissions Rankings
The CO2, Hg, NOx, and SO2 emissions and emission
rates of the 100 largest generating companies are
ranked in the charts and tables that follow. The
charts rank emissions using four basic categories of
emissions measurement: “total tons” emitted,
“all-source emission rates,” “fossil emission rates”
and “coal plant emission rates.”
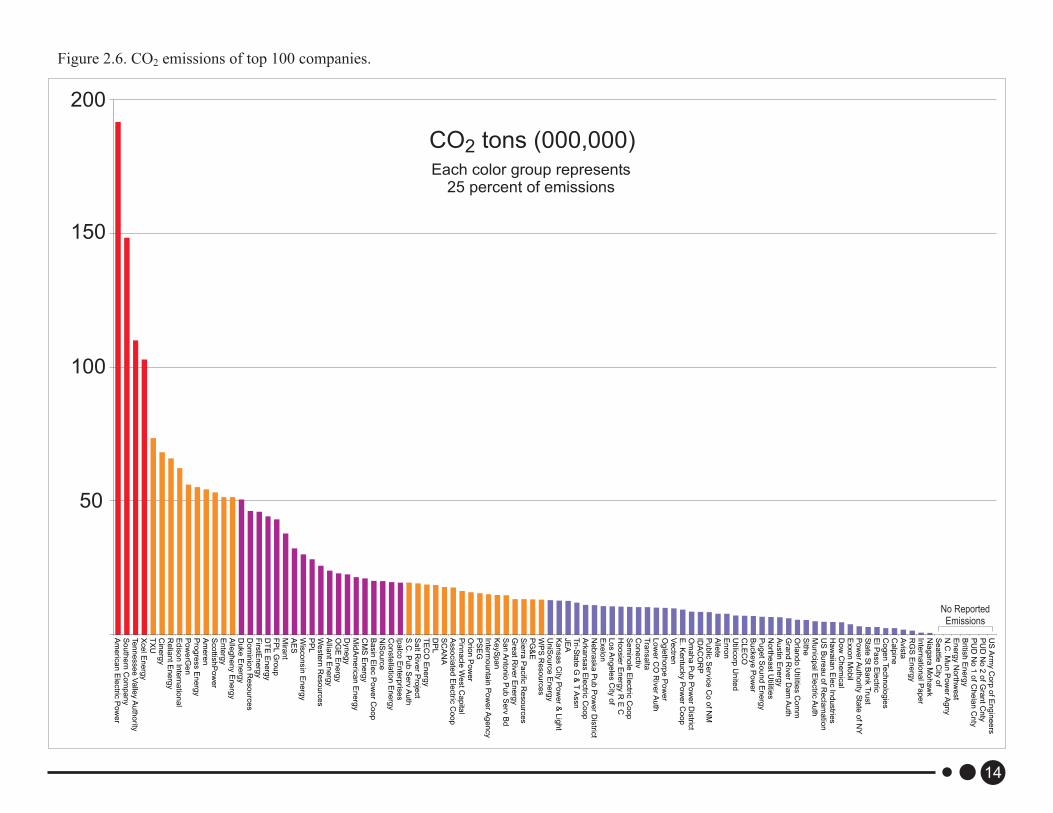
Total Tons -- Figures 2.4-2.7 below illustrate total
tons of emissions for each company and each
pollutant (CO2, Hg, NOx, SO2). These comparisons
reflect the total quantity of emissions attributable to
each company in 2000 based on their ownership
stakes in power plant facilities with reported
emissions information. The emissions totals are most
relevant for understanding each company’s relative
contribution to overall emissions loadings, which is
heavily influenced by the amount of generation
owned by each company. It should be noted that
mercury emissions information is only reported by
EPA for coal-fired facilities, so the mercury
emissions comparisons only reflect emissions
associated with each company’s coal-fired power
plants.
The total tons rankings indicate that fewer than
15 companies account for over 50% of the
emissions of CO2, Hg, NOx and SO2 among the
largest 100 companies (fewer than 20 account
for 50% across the entire industry). Furthermore,
four companies account for about 25% of SO2
and Hg emissions among the largest 100
companies, while five and six companies
account for 25% of NOx and CO2. American
Electric Power, which generated the most
electricity in 2000, was the largest emitter of
CO2, Hg, NOx and SO2, accounting for 7-10%
of industry emissions.
Total tons comparisons are most appropriately
considered in conjunction with corporate
emission rates. Some companies may have high
emissions totals (because they own many fossil
fuel power plants), but relatively low emission
rates, because their fossil fuel power plants have
emissions controls and/or they own significant
non-emitting generation facilities such as
hydro-electric, nuclear, or renewable energy
power plants. Alternatively, some companies
with relatively high emission rates may only
emit a modest amount of total emissions because
they own only a few fossil fuel power plants
with high emission rates. For example, Utilicorp
United had the third highest all source NOx
emission rate, but ranked 52 in terms of total
tons of NOx emissions among the 100
companies.
All-Source Emission Rates -- Figures 2.8-2.10
illustrate emission rate performance for each
company for NOx, SO2 and CO2 in lbs/MWh,
considering all electric generation sources
owned by the company (“all source”). These
emission rate comparisons are based on taking
the total tons of emissions for each company and
dividing by the total generation of each
company. This metric demonstrates corporate
emissions per total electricity product.
Companies with significant non-emitting
9
3.2 million MWh
U.S.
Corporations
78%
Foreign Corporations 3%
Districts/Sub-divisions 2%
Municipalities 3%
State 2%
Federal 9%
Cooperatives 3%
Figure 2.2 . Entity types that make up 100 largestgeneration owners (percent of generation).

generation sources, including nuclear and
hydroelectric generation, tend to have lower all
source emission rates than generators owning
primarily fossil-fuel power plants because the
megawatt-hours of generation from non-emitting
sources are included in the all source emission rate
denominator.
Fossil Emission Rates -- Figures 2.11-2.13 illustrate
emission rate performance in lbs/MWh, considering
only fossil-fuel generation sources. This comparison
removes non-emitting generation from the emission
rate denominator to illustrate how the companies’
fossil-fuel fleets compare. The fossil fuels
predominantly used to generate electricity include
coal, oil and natural gas.
With this metric, the relative performance of
different companies is determined by what types of
fossil fuels their power plants use (coal tends to be
associated with higher emissions than oil or natural
gas), the efficiency of their power plants (the higher
the efficiency the lower the emissions on a lbs/MWh
basis), and the extent to which their power plants
have emissions controls installed (the more controls,
the lower the emission rates). Since no technologies
are currently used commercially to reduce CO2
emissions from flue gas, there is less disparity in
rates for this pollutant and the disparity that exists is
driven entirely by efficiency and fuel mix.
Again, it is important to consider these emission
rates in the context of total tons of emissions. For
example, Figure 1.12 indicates that RGS Energy’s
2000 fossil SO2 emission rate was significantly
higher than any other company. At the same time,
however, RGS Energy is ranked 65th in overall SO2
emissions. A closer look at RGS Energy’s
play-by-plant emissions data indicates that the
company operates a relatively small fossil-fuel
power plant fleet and that the high fossil SO2
emission rate is primarily reflective of the emissions
reported for a single coal-fired power plant
(Rochester 7).
Coal Plant Emission Rates -- Figures 2.14 -
2.16 illustrate lbs/MWh emission rates for each
company based on isolating the emissions and
generation reported for coal-fired power plants.
This comparison illustrates how coal plant fleets
compare across the companies, illustrating a
wide disparity in emissions performance among
coal plants. Differences in emission rates are due
primarily to the use of different types of coal
(low versus high sulfur coal for instance), and
different levels of investment in emissions
control technologies at the plants.
The figures illustrate that for NOx, the highest
emissions rate companies operate coal plants
with rates over 7 lbs/MWh, while the lowest
emission rate companies operate around 3
lbs/MWh. For SO2, the highest rates are above
20 lbs/MWh (with the highest at about 35
lbs/MWh), and the lowest rates are below 5
lbs/MWh. As one would expect, the coal-only
CO2 emission rates are relatively consistent
across companies, because no CO2 emissions
controls are currently installed and most coal
plants have similar efficiencies.
10

1111
Million MWh
Coal
Oil
Gas
Nuclear
Hydro
Renewable (non-hydro)
Other
200
150
100
50
Gra
nd
Riv
er
Da
mA
uth
Inte
rna
tion
alP
ap
er
Ha
wa
iian
Ele
cIn
du
strie
sC
og
en
Te
ch
no
log
ies
Orla
nd
oU
tilities
Co
mm
Avis
taE
xxo
nM
ob
ilS
eattle
City
of
RG
SE
nerg
yU
tilico
rpU
nite
dN
.C.M
un
Po
we
rA
gn
yA
llete
CL
EC
OB
ucke
ye
Po
we
rP
ug
etS
ou
nd
En
erg
yN
iag
ara
Mo
ha
wk
Sta
teS
tB
an
kT
rust
Ho
osie
rE
ne
rgy
RE
CV
ectre
nE
lP
aso
Ele
ctric
En
erg
yN
orth
we
st
Britis
hE
ne
rgy
E.K
en
tucky
Po
we
rC
oo
pS
em
ino
leE
lectric
Co
op
PU
DN
o1
ofC
he
lan
Cn
tyT
ran
sa
ltaP
UD
No
2o
fG
ran
tC
nty
Ark
an
sa
sE
lectric
Co
op
Sith
eC
alp
ine
Pu
blic
Se
rvic
eC
oo
fN
MT
ri-Sta
teG
&T
Assn
Au
stin
En
erg
yD
ow
Ch
em
ica
lG
rea
tR
ive
rE
ne
rgy
Munic
ipa
lE
lectric
Auth
Lo
we
rC
OR
ive
rA
uth
Om
ah
aP
ub
Po
we
rD
istric
tE
nro
nU
niS
ou
rce
En
erg
yW
PS
Re
so
urc
es
JE
AC
on
ectiv
Inte
rmo
un
tain
Po
we
rA
ge
ncy
Sie
rraP
acific
Re
so
urc
es
Ne
bra
ska
Pu
bP
ow
er
Dis
trict
Orio
nP
ow
er
Ka
nsa
sC
ityP
ow
er
&L
igh
tL
os
An
ge
les
City
of
Associa
ted
Ele
ctric
Coop
Ba
sin
Ele
cP
ow
er
Co
op
IDA
CO
RP
Ke
yS
pa
nIp
alc
oE
nte
rpris
es
TE
CO
Energ
yN
iSo
urc
eD
PL
Og
leth
orp
eP
ow
er
Sa
nA
nto
nio
Pu
bS
erv
Bd
Mid
Am
eric
an
En
erg
yS
.C.P
ub
Serv
Auth
SC
AN
AN
orth
ea
stU
tilities
Dyn
eg
yO
GE
Energ
yP
inn
acle
We
stC
ap
ital
Sa
ltR
ive
rP
roje
ct
CM
SE
ne
rgy
Allia
ntE
ne
rgy
We
ste
rnR
eso
urc
es
Co
nste
llatio
nE
ne
rgy
Wis
co
nsin
En
erg
yA
ES
Pow
erA
uth
ority
Sta
teofN
YP
SE
GM
iran
tD
TE
En
erg
yP
G&
EP
PL
Pow
erG
en
US
Bu
rea
uo
fR
ecla
ma
tion
Alle
gh
en
yE
ne
rgy
Sco
ttish
Po
we
rA
mere
nC
ine
rgy
Do
min
ion
Re
so
urc
es
US
Arm
yC
orp
ofE
ng
ine
ers
Firs
tEnerg
yE
dis
on
Inte
rna
tion
al
Re
lian
tE
ne
rgy
FP
LG
rou
pP
rog
ress
En
erg
yT
XU
Du
ke
En
erg
yE
nte
rgy
Xce
lE
ne
rgy
Exe
lon
Te
nn
esse
eV
alle
yA
uth
ority
So
uth
ern
Co
mpa
ny
Am
eric
an
Ele
ctric
Pow
er
Figure 2.3. Generation of top 100 companies by fuel type.

12
500
400
300
200
100
NOx tons (000)Each color group represents
25 percent of emissions
No ReportedEmissions
US
Arm
yC
orp
ofE
ng
ine
ers
PU
DN
o2
ofG
ran
tC
nty
PU
DN
o1
ofC
he
lan
Cn
tyB
ritish
En
erg
yE
ne
rgy
No
rthw
est
N.C
.M
un
Po
we
rA
gn
yS
ea
ttleC
ityo
fC
og
en
Te
ch
no
log
ies
Nia
ga
raM
oh
aw
kE
xxo
nM
ob
ilC
alp
ine
Inte
rna
tion
alP
ap
er
Sta
teS
tB
an
kT
rust
Do
wC
he
mic
al
RG
SE
ne
rgy
Po
we
rA
uth
ority
Sta
teo
fN
YA
vis
taS
ithe
ElP
aso
Ele
ctric
Orla
nd
oU
tilities
Co
mm
Mu
nic
ipa
lE
lectric
Au
thU
SB
ure
au
ofR
ecla
ma
tion
Au
stin
En
erg
yG
ran
dR
ive
rD
am
Au
thH
aw
aiia
nE
lec
Ind
ustrie
sN
orth
ea
stU
tilities
Lo
sA
ng
ele
sC
ityo
fC
LE
CO
Pu
ge
tS
ou
nd
En
erg
yA
llete
Gre
atR
ive
rE
ne
rgy
Om
ah
aP
ub
Po
we
rD
istric
tE
nro
nID
AC
OR
PE
xe
lon
Lo
we
rC
OR
ive
rA
uth
Sa
nA
nto
nio
Pu
bS
erv
Bd
Og
leth
orp
eP
ow
er
Ark
an
sa
sE
lectric
Co
op
Ke
yS
pa
nE
.K
en
tucky
Po
we
rC
oo
pB
ucke
ye
Po
we
rP
ub
licS
erv
ice
Co
ofN
MC
on
ectiv
Tra
nsa
ltaT
ri-Sta
teG
&T
Assn
Ho
osie
rE
ne
rgy
RE
CP
G&
ES
em
ino
leE
lectric
Co
op
Utilic
orp
Un
ited
Ne
bra
ska
Pu
bP
ow
er
Dis
trict
Ve
ctre
nU
niS
ou
rce
En
erg
yS
ierra
Pa
cific
Re
so
urc
es
WP
SR
eso
urc
es
Ka
nsa
sC
ityP
ow
er
&L
igh
tJE
AIn
term
ou
nta
inP
ow
erA
ge
ncy
Ipa
lco
En
terp
rise
sB
asin
Ele
cP
ow
er
Co
op
PS
EG
Pin
na
cle
We
stC
ap
ital
SC
AN
AO
rion
Po
we
rC
MS
En
erg
yM
idA
me
rica
nE
ne
rgy
S.C
.P
ub
Se
rvA
uth
OG
EE
ne
rgy
Sa
ltR
ive
rP
roje
ct
Co
nste
llatio
nE
ne
rgy
Dyn
eg
yD
PL
PP
LA
llian
tE
ne
rgy
NiS
ou
rce
We
ste
rnR
eso
urc
es
Wis
co
nsin
En
erg
yT
EC
OE
ne
rgy
AE
SA
sso
cia
ted
Ele
ctric
Co
op
Mira
nt
Re
lian
tE
ne
rgy
Am
ere
nF
PL
Gro
up
DT
EE
ne
rgy
Sco
ttish
Po
we
rD
uke
En
erg
yP
ow
erG
en
Pro
gre
ss
En
erg
yF
irstE
ne
rgy
En
terg
yD
om
inio
nR
eso
urc
es
Alle
gh
en
yE
ne
rgy
Ed
iso
nIn
tern
atio
na
lT
XU
Cin
erg
yX
ce
lE
ne
rgy
Te
nn
esse
eV
alle
yA
uth
ority
So
uth
ern
Co
mpa
ny
Am
eric
an
Ele
ctric
Po
we
r
Figure 2.4. NOx emissions of top100 companies.

13
US
Arm
yC
orp
ofE
ng
ine
ers
PU
DN
o2
ofG
ran
tC
nty
PU
DN
o1
ofC
he
lan
Cn
tyB
ritish
En
erg
yE
ne
rgy
No
rthw
est
N.C
.M
un
Po
we
rA
gn
yS
ea
ttleC
ityo
fS
tate
StB
an
kT
rust
Ca
lpin
eC
og
en
Te
ch
no
log
ies
Do
wC
he
mic
al
Exxo
nM
ob
ilU
SB
ure
au
ofR
ecla
ma
tion
Avis
taE
lP
aso
Ele
ctric
Po
we
rA
uth
ority
Sta
teo
fN
YIn
tern
atio
na
lP
ap
er
Inte
rmo
un
tain
Po
we
rA
ge
ncy
Nia
ga
raM
oh
aw
kP
ug
etS
ou
nd
En
erg
yO
rlan
do
Utilitie
sC
om
mL
os
An
ge
les
City
of
Sith
eT
ri-Sta
teG
&T
Assn
Au
stin
En
erg
yID
AC
OR
PS
ierra
Pa
cific
Re
so
urc
es
En
ron
Ha
wa
iian
Ele
cIn
du
strie
sA
llete
Gra
nd
Riv
er
Da
mA
uth
Pu
blic
Se
rvic
eC
oo
fN
MC
LE
CO
Lo
we
rC
OR
ive
rA
uth
Sa
nA
nto
nio
Pu
bS
erv
Bd
Mu
nic
ipa
lE
lectric
Au
thR
GS
En
erg
yU
tilico
rpU
nite
dN
eb
raska
Pu
bP
ow
er
Dis
trict
Pin
na
cle
We
stC
ap
ital
Om
ah
aP
ub
Po
we
rD
istric
tA
rka
nsa
sE
lectric
Co
op
Sa
ltR
ive
rP
roje
ct
Un
iSo
urc
eE
ne
rgy
Se
min
ole
Ele
ctric
Co
op
Ka
nsa
sC
ityP
ow
er
&L
igh
tA
sso
cia
ted
Ele
ctric
Co
op
Ke
yS
pa
nH
oo
sie
rE
ne
rgy
RE
CG
rea
tR
ive
rE
ne
rgy
JE
AO
GE
En
erg
yO
gle
tho
rpe
Po
we
rE
xe
lon
NiS
ou
rce
WP
SR
eso
urc
es
No
rthe
astU
tilities
E.K
en
tucky
Po
we
rC
oo
pB
asin
Ele
cP
ow
er
Co
op
PG
&E
Ve
ctre
nM
idA
me
rica
nE
ne
rgy
S.C
.P
ub
Se
rvA
uth
Co
ne
ctiv
We
ste
rnR
eso
urc
es
Bu
cke
ye
Po
we
rP
SE
GT
ran
sa
ltaD
yn
eg
yA
llian
tE
ne
rgy
Sco
ttish
Po
we
rT
EC
OE
ne
rgy
CM
SE
ne
rgy
Ipa
lco
En
terp
rise
sE
nte
rgy
SC
AN
AO
rion
Po
we
rD
PL
Wis
co
nsin
En
erg
yC
on
ste
llatio
nE
ne
rgy
AE
SF
PL
Gro
up
Mira
nt
Re
lian
tE
ne
rgy
PP
LD
TE
En
erg
yA
me
ren
TX
UD
uke
En
erg
yE
dis
on
Inte
rna
tion
al
Po
we
rGe
nD
om
inio
nR
eso
urc
es
Firs
tEn
erg
yP
rog
ress
En
erg
yX
ce
lE
ne
rgy
Alle
gh
en
yE
ne
rgy
Cin
erg
yTe
nn
esse
eV
alle
yA
uth
ority
So
uth
ern
Co
mpa
ny
Am
eric
an
Ele
ctric
Po
we
r
1,200
1,000
800
600
400
200
SO tons (000)2
Each color group represents25 percent of emissions
No ReportedEmissions
Figure 2.5. SO2 emissions of top 100 companies.
14
200
150
100
50
CO tons (000,000)2
Each color group represents25 percent of emissions
No ReportedEmissions
US
Arm
yC
orp
ofE
ng
ine
ers
PU
DN
o2
ofG
ran
tC
nty
PU
DN
o1
ofC
he
lan
Cn
tyB
ritish
En
erg
yE
ne
rgy
No
rthw
est
N.C
.M
un
Po
we
rA
gn
yS
ea
ttleC
ityo
fN
iag
ara
Mo
ha
wk
Inte
rna
tion
alP
ap
er
RG
SE
ne
rgy
Avis
taC
alp
ine
Co
ge
nTe
ch
no
log
ies
ElP
aso
Ele
ctric
Sta
teS
tB
an
kT
rust
Po
we
rA
uth
ority
Sta
teo
fN
YE
xxo
nM
ob
ilD
ow
Ch
em
ica
lH
aw
aiia
nE
lec
Ind
ustrie
sU
SB
ure
au
ofR
ecla
ma
tion
Mu
nic
ipa
lE
lectric
Au
thS
ithe
Orla
nd
oU
tilities
Co
mm
Gra
nd
Riv
er
Da
mA
uth
Au
stin
En
erg
yN
orth
ea
stU
tilities
Pu
ge
tS
ou
nd
En
erg
yB
ucke
ye
Po
we
rC
LE
CO
Utilic
orp
Un
ited
En
ron
Alle
teP
ub
licS
erv
ice
Co
ofN
MID
AC
OR
PO
ma
ha
Pu
bP
ow
er
Dis
trict
E.K
en
tucky
Po
we
rC
oo
pV
ectre
nO
gle
tho
rpe
Po
we
rL
ow
er
CO
Riv
erA
uth
Tra
nsa
ltaC
on
ectiv
Se
min
ole
Ele
ctric
Co
op
Ho
osie
rE
ne
rgy
RE
CL
os
An
ge
les
City
of
Exe
lon
Ne
bra
ska
Pu
bP
ow
er
Dis
trict
Ark
an
sa
sE
lectric
Co
op
Tri-S
tate
G&
TA
ssn
JE
AK
an
sa
sC
ityP
ow
er
&L
igh
tU
niS
ou
rce
En
erg
yW
PS
Re
so
urc
es
PG
&E
Sie
rraP
acific
Re
so
urc
es
Gre
atR
ive
rE
ne
rgy
Sa
nA
nto
nio
Pu
bS
erv
Bd
Ke
yS
pa
nIn
term
ou
nta
inP
ow
erA
ge
ncy
PS
EG
Orio
nP
ow
er
Pin
na
cle
We
stC
ap
ital
Asso
cia
ted
Ele
ctric
Co
op
SC
AN
AD
PL
TE
CO
En
erg
yS
alt
Riv
er
Pro
ject
S.C
.P
ub
Se
rvA
uth
Ipa
lco
En
terp
rise
sC
on
ste
llatio
nE
ne
rgy
NiS
ou
rce
Ba
sin
Ele
cP
ow
er
Co
op
CM
SE
ne
rgy
Mid
Am
eric
an
En
erg
yD
yn
eg
yO
GE
En
erg
yA
llian
tE
ne
rgy
We
ste
rnR
eso
urc
es
PP
LW
isco
nsin
En
erg
yA
ES
Mira
nt
FP
LG
rou
pD
TE
En
erg
yF
irstE
ne
rgy
Do
min
ion
Re
so
urc
es
Du
ke
En
erg
yA
lleg
he
ny
En
erg
yE
nte
rgy
Sco
ttish
Po
we
rA
me
ren
Pro
gre
ss
En
erg
yP
ow
erG
en
Ed
iso
nIn
tern
atio
na
lR
elia
ntE
ne
rgy
Cin
erg
yT
XU
Xce
lE
ne
rgy
Te
nn
esse
eV
alle
yA
uth
ority
So
uth
ern
Co
mpa
ny
Am
eric
an
Ele
ctric
Po
we
r
Figure 2.6. CO2 emissions of top 100 companies.

15
Hg tonsEach color group represents
25 percent of emissions
1
2
3
4
5
No ReportedHg Emissions
US
Arm
yC
orp
ofE
ng
ine
ers
Po
we
rA
uth
ority
Sta
teo
fN
YK
eyS
pa
nD
ow
Ch
em
ica
lC
alp
ine
Sith
eP
UD
No
2o
fG
ran
tC
nty
PU
DN
o1
ofC
he
lan
Cn
tyB
ritish
En
erg
yE
ne
rgy
No
rthw
est
Sta
teS
tB
an
kT
rust
Nia
ga
raM
oh
aw
kN
.C.M
un
Po
we
rA
gn
yS
ea
ttleC
ityo
fE
xxo
nM
ob
ilC
og
en
Te
ch
no
log
ies
Ha
wa
iian
Ele
cIn
du
strie
sIn
tern
atio
na
lP
ap
er
Inte
rmo
un
tain
Po
we
rA
ge
ncy
ElP
aso
Ele
ctric
US
Bu
rea
uo
fR
ecla
ma
tion
No
rthe
astU
tilities
CL
EC
OO
rlan
do
Utilitie
sC
om
mA
vis
taR
GS
En
erg
yL
os
An
ge
les
City
of
Se
min
ole
Ele
ctric
Co
op
Sie
rraP
acific
Re
so
urc
es
JE
AH
oo
sie
rE
ne
rgy
RE
CO
ma
ha
Pu
bP
ow
er
Dis
trict
Ve
ctre
nID
AC
OR
PG
ran
dR
ive
rD
am
Au
thM
un
icip
alE
lectric
Au
thU
tilico
rpU
nite
dP
G&
EE
nro
nF
PL
Gro
up
SC
AN
AA
ustin
En
erg
yP
ug
etS
ou
nd
En
erg
yA
llete
Tri-S
tate
G&
TA
ssn
Ne
bra
ska
Pu
bP
ow
er
Dis
trict
Ark
an
sa
sE
lectric
Co
op
S.C
.P
ub
Se
rvA
uth
Bu
cke
ye
Po
we
rC
on
ectiv
Ipa
lco
En
terp
rise
sS
alt
Riv
er
Pro
ject
Ka
nsa
sC
ityP
ow
er
&L
igh
tO
gle
tho
rpe
Po
we
rL
ow
er
CO
Riv
erA
uth
E.K
en
tucky
Po
we
rC
oo
pT
ran
sa
ltaA
sso
cia
ted
Ele
ctric
Co
op
Exe
lon
TE
CO
En
erg
yP
ub
licS
erv
ice
Co
ofN
MW
PS
Re
so
urc
es
Un
iSo
urc
eE
ne
rgy
Pin
na
cle
We
stC
ap
ital
Dyn
eg
yP
SE
GG
rea
tR
ive
rE
ne
rgy
OG
EE
ne
rgy
En
terg
yN
iSo
urc
eS
an
An
ton
ioP
ub
Se
rvB
dD
PL
Ba
sin
Ele
cP
ow
er
Co
op
Allia
ntE
ne
rgy
Orio
nP
ow
er
Mid
Am
eric
an
En
erg
yC
MS
En
erg
yA
ES
We
ste
rnR
eso
urc
es
Co
nste
llatio
nE
ne
rgy
Wis
co
nsin
En
erg
yM
iran
tD
uke
En
erg
yS
co
ttish
Po
we
rD
TE
En
erg
yP
ow
erG
en
Alle
gh
en
yE
ne
rgy
PP
LD
om
inio
nR
eso
urc
es
Xce
lE
ne
rgy
Am
ere
nP
rog
ress
En
erg
yC
ine
rgy
Firs
tEn
erg
yR
elia
ntE
ne
rgy
Te
nn
esse
eV
alle
yA
uth
ority
TX
UE
dis
on
Inte
rna
tion
al
So
uth
ern
Co
mpa
ny
Am
eric
an
Ele
ctric
Po
we
r
Figure 2.7. Mercury emissions of top 100 companies.

16
1
2
3
4
5
6
7
8
9
All Source NOx Rate(lbs/MWh)
Each color represents25 companies
No ReportedEmissions
US
Arm
yC
orp
ofE
ng
ine
ers
PU
DN
o2
ofG
ran
tC
nty
PU
DN
o1
ofC
he
lan
Cn
tyB
ritish
En
erg
yE
ne
rgy
No
rthw
est
N.C
.M
un
Po
we
rA
gn
yS
ea
ttleC
ityo
fP
ow
erA
uth
ority
Sta
teo
fN
YN
iag
ara
Mo
ha
wk
Co
ge
nTe
ch
no
log
ies
Exe
lon
Ca
lpin
eU
SB
ure
au
ofR
ecla
ma
tion
Sta
teS
tB
an
kT
rust
Do
wC
he
mic
al
Exxo
nM
ob
ilIn
tern
atio
na
lP
ap
er
Sith
eR
GS
En
erg
yP
G&
EN
orth
ea
stU
tilities
Avis
taE
lP
aso
Ele
ctric
Mu
nic
ipa
lE
lectric
Au
thP
SE
GS
an
An
ton
ioP
ub
Se
rvB
dA
ustin
En
erg
yL
os
An
ge
les
City
of
Og
leth
orp
eP
ow
er
IDA
CO
RP
Re
lian
tE
ne
rgy
Du
ke
En
erg
yP
PL
En
terg
yK
eyS
pa
nF
PL
Gro
up
Om
ah
aP
ub
Po
we
rD
istric
tP
rog
ress
En
erg
yE
nro
nG
rea
tR
ive
rE
ne
rgy
Co
nste
llatio
nE
ne
rgy
Pin
na
cle
We
stC
ap
ital
Lo
we
rC
OR
ive
rA
uth
Orla
nd
oU
tilities
Co
mm
TX
UF
irstE
ne
rgy
Am
ere
nC
on
ectiv
Do
min
ion
Re
so
urc
es
CM
SE
ne
rgy
Ed
iso
nIn
tern
atio
na
lX
ce
lE
ne
rgy
SC
AN
AN
eb
raska
Pu
bP
ow
er
Dis
trict
AE
SM
iran
tW
isco
nsin
En
erg
yS
alt
Riv
er
Pro
ject
Ark
an
sa
sE
lectric
Co
op
Pu
ge
tS
ou
nd
En
erg
yP
ub
licS
erv
ice
Co
ofN
MO
GE
En
erg
yTe
nn
esse
eV
alle
yA
uth
ority
So
uth
ern
Co
mpa
ny
Ka
nsa
sC
ityP
ow
er
&L
igh
tT
ri-Sta
teG
&T
Assn
Sie
rraP
acific
Re
so
urc
es
Sco
ttish
Po
we
rIp
alc
oE
nte
rpris
es
CL
EC
OS
.C.P
ub
Se
rvA
uth
Mid
Am
eric
an
En
erg
yE
.K
en
tucky
Po
we
rC
oo
pA
llian
tE
ne
rgy
Gra
nd
Riv
er
Da
mA
uth
Ba
sin
Ele
cP
ow
er
Co
op
Dyn
eg
yT
ran
sa
ltaW
este
rnR
eso
urc
es
Alle
teU
niS
ou
rce
En
erg
yH
aw
aiia
nE
lec
Ind
ustrie
sW
PS
Re
so
urc
es
JE
AP
ow
erG
en
DT
EE
ne
rgy
Inte
rmo
un
tain
Po
we
rA
ge
ncy
Se
min
ole
Ele
ctric
Co
op
Ho
osie
rE
ne
rgy
RE
CC
ine
rgy
Am
eric
an
Ele
ctric
Po
we
rB
ucke
ye
Po
we
rA
lleg
he
ny
En
erg
yO
rion
Po
we
rD
PL
Ve
ctre
nN
iSo
urc
eU
tilico
rpU
nite
dT
EC
OE
ne
rgy
Asso
cia
ted
Ele
ctric
Co
op
Figure 2.8. All source NOx emission rates of top 100 companies.

17
5
10
15
20
25
All Source SO Rate(lbs/MWh)
2
Each color represents25 companies
No ReportedEmissions
US
Arm
yC
orp
ofE
ng
ine
ers
PU
DN
o2
ofG
ran
tC
nty
PU
DN
o1
ofC
he
lan
Cn
tyB
ritish
En
erg
yE
ne
rgy
No
rthw
est
N.C
.M
un
Po
we
rA
gn
yS
ea
ttleC
ityo
fS
tate
StB
an
kT
rust
Ca
lpin
eD
ow
Ch
em
ica
lE
xxo
nM
ob
ilC
og
en
Te
ch
no
log
ies
US
Bu
rea
uo
fR
ecla
ma
tion
Po
we
rA
uth
ority
Sta
teo
fN
YE
lP
aso
Ele
ctric
Inte
rmo
un
tain
Po
we
rA
ge
ncy
Avis
taE
xe
lon
Inte
rna
tion
alP
ap
er
Nia
ga
raM
oh
aw
kL
os
An
ge
les
City
of
Pu
ge
tS
ou
nd
En
erg
yID
AC
OR
PS
ierra
Pa
cific
Re
so
urc
es
Sith
eE
nte
rgy
Au
stin
En
erg
yT
ri-Sta
teG
&T
Assn
Pin
na
cle
We
stC
ap
ital
En
ron
Sa
nA
nto
nio
Pu
bS
erv
Bd
Sa
ltR
ive
rP
roje
ct
PG
&E
Pu
blic
Se
rvic
eC
oo
fN
MO
rlan
do
Utilitie
sC
om
mL
ow
er
CO
Riv
erA
uth
Sco
ttish
Po
we
rN
eb
raska
Pu
bP
ow
er
Dis
trict
FP
LG
rou
pO
GE
En
erg
yP
SE
GM
un
icip
alE
lectric
Au
thA
llete
Ke
yS
pa
nA
sso
cia
ted
Ele
ctric
Co
op
Ka
nsa
sC
ityP
ow
er
&L
igh
tO
ma
ha
Pu
bP
ow
er
Dis
trict
Ha
wa
iian
Ele
cIn
du
strie
sU
niS
ou
rce
En
erg
yR
elia
ntE
ne
rgy
Og
leth
orp
eP
ow
er
Du
ke
En
erg
yT
XU
CL
EC
ON
orth
ea
stU
tilities
We
ste
rnR
eso
urc
es
Ark
an
sa
sE
lectric
Co
op
Gra
nd
Riv
er
Da
mA
uth
JE
AE
dis
on
Inte
rna
tion
al
Xce
lE
ne
rgy
Mid
Am
eric
an
En
erg
yN
iSo
urc
eS
.C.P
ub
Se
rvA
uth
Gre
atR
ive
rE
ne
rgy
Se
min
ole
Ele
ctric
Co
op
Allia
ntE
ne
rgy
Dyn
eg
yW
isco
nsin
En
erg
yR
GS
En
erg
yB
asin
Ele
cP
ow
er
Co
op
CM
SE
ne
rgy
Utilic
orp
Un
ited
Pro
gre
ss
En
erg
yA
ES
Am
ere
nD
om
inio
nR
eso
urc
es
Co
nste
llatio
nE
ne
rgy
Firs
tEn
erg
yH
oo
sie
rE
ne
rgy
RE
CP
PL
WP
SR
eso
urc
es
Te
nn
esse
eV
alle
yA
uth
ority
Mira
nt
SC
AN
AA
me
rica
nE
lectric
Po
we
rD
TE
En
erg
yS
ou
the
rnC
om
pa
ny
Co
ne
ctiv
TE
CO
En
erg
yP
ow
erG
en
Ipa
lco
En
terp
rise
sD
PL
E.K
en
tucky
Po
we
rC
oo
pV
ectre
nO
rion
Po
we
rA
lleg
he
ny
En
erg
yT
ran
sa
ltaC
ine
rgy
Bu
cke
ye
Po
we
r
Figure 2.9. All source SO2 emission rates of top 100 companies.

18
500
1,000
1,500
2,000
2,500
All Source CO Rate(lbs/MWh)
2
Each color represents25 companies
No ReportedEmissions
US
Arm
yC
orp
ofE
ng
ine
ers
PU
DN
o2
ofG
ran
tC
nty
PU
DN
o1
ofC
he
lan
Cn
tyB
ritish
En
erg
yE
ne
rgy
No
rthw
est
N.C
.M
un
Po
we
rA
gn
yS
ea
ttleC
ityo
fE
xe
lon
Po
we
rA
uth
ority
Sta
teo
fN
YN
iag
ara
Mo
ha
wk
US
Bu
rea
uo
fR
ecla
ma
tion
Inte
rna
tion
alP
ap
er
RG
SE
ne
rgy
Ca
lpin
eP
G&
EN
orth
ea
stU
tilities
ElP
aso
Ele
ctric
Avis
taS
tate
StB
an
kT
rust
PS
EG
Do
wC
he
mic
al
Mu
nic
ipa
lE
lectric
Au
thC
og
en
Te
ch
no
log
ies
En
terg
yD
uke
En
erg
yF
PL
Gro
up
IDA
CO
RP
Sith
eO
gle
tho
rpe
Po
we
rP
PL
Co
nste
llatio
nE
ne
rgy
Au
stin
En
erg
yF
irstE
ne
rgy
Pro
gre
ss
En
erg
yE
xxo
nM
ob
ilE
nro
nD
om
inio
nR
eso
urc
es
Pin
na
cle
We
stC
ap
ital
Lo
sA
ng
ele
sC
ityo
fTe
nn
esse
eV
alle
yA
uth
ority
Om
ah
aP
ub
Po
we
rD
istric
tS
an
An
ton
ioP
ub
Se
rvB
dE
dis
on
Inte
rna
tion
al
TX
UN
eb
raska
Pu
bP
ow
er
Dis
trict
Sa
ltR
ive
rP
roje
ct
Re
lian
tE
ne
rgy
Pu
blic
Se
rvic
eC
oo
fN
MS
CA
NA
Co
ne
ctiv
CM
SE
ne
rgy
Ka
nsa
sC
ityP
ow
er
&L
igh
tP
ug
etS
ou
nd
En
erg
yS
ou
the
rnC
om
pa
ny
Ha
wa
iian
Ele
cIn
du
strie
sL
ow
er
CO
Riv
erA
uth
AE
SW
isco
nsin
En
erg
yA
me
ren
Ke
yS
pa
nM
iran
tX
ce
lE
ne
rgy
S.C
.P
ub
Se
rvA
uth
Allia
ntE
ne
rgy
Bu
cke
ye
Po
we
rA
me
rica
nE
lectric
Po
we
rO
rlan
do
Utilitie
sC
om
mS
ierra
Pa
cific
Re
so
urc
es
We
ste
rnR
eso
urc
es
OG
EE
ne
rgy
Sco
ttish
Po
we
rD
yn
eg
yJE
AC
LE
CO
E.K
en
tucky
Po
we
rC
oo
pC
ine
rgy
Mid
Am
eric
an
En
erg
yA
lleg
he
ny
En
erg
yD
PL
DT
EE
ne
rgy
Un
iSo
urc
eE
ne
rgy
WP
SR
eso
urc
es
Utilic
orp
Un
ited
Tra
nsa
ltaO
rion
Po
we
rT
EC
OE
ne
rgy
Ark
an
sa
sE
lectric
Co
op
Tri-S
tate
G&
TA
ssn
Se
min
ole
Ele
ctric
Co
op
Alle
teV
ectre
nIp
alc
oE
nte
rpris
es
Inte
rmo
un
tain
Po
we
rA
ge
ncy
Po
we
rGe
nA
sso
cia
ted
Ele
ctric
Co
op
NiS
ou
rce
Gra
nd
Riv
er
Da
mA
uth
Gre
atR
ive
rE
ne
rgy
Ho
osie
rE
ne
rgy
RE
CB
asin
Ele
cP
ow
er
Co
op
Figure 2.10. All source CO2 emission rates of top 100 companies.

19
1
2
3
4
5
6
7
8
9
Fossil NOx Rate(lbs/MWh)
Each color represents25 companies
No ReportedEmissions
US
Arm
yC
orp
ofE
ng
ine
ers
PU
DN
o2
ofG
ran
tC
nty
PU
DN
o1
ofC
he
lan
Cn
tyB
ritish
En
erg
yE
ne
rgy
No
rthw
est
N.C
.M
un
Po
we
rA
gn
yS
ea
ttleC
ityo
fC
og
en
Te
ch
no
log
ies
Sta
teS
tB
an
kT
rust
Do
wC
he
mic
al
Exxo
nM
ob
ilC
alp
ine
Sith
eP
ow
erA
uth
ority
Sta
teo
fN
YIn
tern
atio
na
lP
ap
er
Re
lian
tE
ne
rgy
Ke
yS
pa
nL
os
An
ge
les
City
of
Sa
nA
nto
nio
Pu
bS
erv
Bd
Au
stin
En
erg
yN
iag
ara
Mo
ha
wk
Gre
atR
ive
rE
ne
rgy
PG
&E
Lo
we
rC
OR
ive
rA
uth
Orla
nd
oU
tilities
Co
mm
FP
LG
rou
pE
nro
nE
lP
aso
Ele
ctric
AE
SM
iran
tE
xe
lon
PP
LD
uke
En
erg
yA
rka
nsa
sE
lectric
Co
op
En
terg
yM
un
icip
alE
lectric
Au
thO
gle
tho
rpe
Po
we
rO
GE
En
erg
yT
XU
Xce
lE
ne
rgy
Tri-S
tate
G&
TA
ssn
Am
ere
nO
ma
ha
Pu
bP
ow
er
Dis
trict
Sie
rraP
acific
Re
so
urc
es
Ipa
lco
En
terp
rise
sR
GS
En
erg
yP
rog
ress
En
erg
yC
LE
CO
Avis
taE
.K
en
tucky
Po
we
rC
oo
pU
SB
ure
au
ofR
ecla
ma
tion
PS
EG
IDA
CO
RP
SC
AN
AC
MS
En
erg
yB
asin
Ele
cP
ow
er
Co
op
Dyn
eg
yM
idA
me
rica
nE
ne
rgy
Tra
nsa
ltaC
on
ectiv
Sco
ttish
Po
we
rU
niS
ou
rce
En
erg
yH
aw
aiia
nE
lec
Ind
ustrie
sN
orth
ea
stU
tilities
Pu
ge
tS
ou
nd
En
erg
yG
ran
dR
ive
rD
am
Au
thE
dis
on
Inte
rna
tion
al
Pin
na
cle
We
stC
ap
ital
DT
EE
ne
rgy
JE
AS
ou
the
rnC
om
pa
ny
Sa
ltR
ive
rP
roje
ct
S.C
.P
ub
Se
rvA
uth
Wis
co
nsin
En
erg
yP
ow
erG
en
Alle
teIn
term
ou
nta
inP
ow
erA
ge
ncy
Se
min
ole
Ele
ctric
Co
op
Ho
osie
rE
ne
rgy
RE
CC
ine
rgy
Co
nste
llatio
nE
ne
rgy
Am
eric
an
Ele
ctric
Po
we
rW
este
rnR
eso
urc
es
Firs
tEn
erg
yD
om
inio
nR
eso
urc
es
Ne
bra
ska
Pu
bP
ow
er
Dis
trict
Pu
blic
Se
rvic
eC
oo
fN
MB
ucke
ye
Po
we
rK
an
sa
sC
ityP
ow
er
&L
igh
tA
lleg
he
ny
En
erg
yW
PS
Re
so
urc
es
Allia
ntE
ne
rgy
Orio
nP
ow
er
DP
LV
ectre
nTe
nn
esse
eV
alle
yA
uth
ority
NiS
ou
rce
Utilic
orp
Un
ited
TE
CO
En
erg
yA
sso
cia
ted
Ele
ctric
Co
op
Figure 2.11. Fossil NOx emission rates of top 100 companies.

20
5
10
15
20
25
30
35
40
Fossil SO Rate(lbs/MWh)
2
Each color represents25 companies
No ReportedEmissions
US
Arm
yC
orp
ofE
ng
ine
ers
PU
DN
o2
ofG
ran
tC
nty
PU
DN
o1
ofC
he
lan
Cn
tyB
ritish
En
erg
yE
ne
rgy
No
rthw
est
N.C
.M
un
Po
we
rA
gn
yS
ea
ttleC
ityo
fS
tate
StB
an
kT
rust
Do
wC
he
mic
al
Ca
lpin
eE
xxo
nM
ob
ilC
og
en
Te
ch
no
log
ies
Inte
rmo
un
tain
Po
we
rA
ge
ncy
US
Bu
rea
uo
fR
ecla
ma
tion
ElP
aso
Ele
ctric
Po
we
rA
uth
ority
Sta
teo
fN
YL
os
An
ge
les
City
of
Pu
ge
tS
ou
nd
En
erg
yA
vis
taS
ierra
Pa
cific
Re
so
urc
es
Sith
eT
ri-Sta
teG
&T
Assn
Inte
rna
tion
alP
ap
er
Au
stin
En
erg
yE
nro
nID
AC
OR
PS
alt
Riv
er
Pro
ject
Sa
nA
nto
nio
Pu
bS
erv
Bd
En
terg
yL
ow
er
CO
Riv
erA
uth
Pin
na
cle
We
stC
ap
ital
Orla
nd
oU
tilities
Co
mm
Sco
ttish
Po
we
rO
GE
En
erg
yK
eyS
pa
nA
sso
cia
ted
Ele
ctric
Co
op
Pu
blic
Se
rvic
eC
oo
fN
MA
llete
Ha
wa
iian
Ele
cIn
du
strie
sU
niS
ou
rce
En
erg
yC
LE
CO
Re
lian
tE
ne
rgy
Ne
bra
ska
Pu
bP
ow
er
Dis
trict
FP
LG
rou
pA
rka
nsa
sE
lectric
Co
op
Ka
nsa
sC
ityP
ow
er
&L
igh
tJE
AT
XU
Gra
nd
Riv
er
Da
mA
uth
NiS
ou
rce
Mid
Am
eric
an
En
erg
yW
este
rnR
eso
urc
es
Om
ah
aP
ub
Po
we
rD
istric
tS
em
ino
leE
lectric
Co
op
Gre
atR
ive
rE
ne
rgy
Xce
lE
ne
rgy
S.C
.P
ub
Se
rvA
uth
Dyn
eg
yB
asin
Ele
cP
ow
er
Co
op
Utilic
orp
Un
ited
AE
SE
dis
on
Inte
rna
tion
al
PG
&E
Du
ke
En
erg
yH
oo
sie
rE
ne
rgy
RE
CA
llian
tE
ne
rgy
Mira
nt
Am
ere
nE
xe
lon
CM
SE
ne
rgy
PS
EG
Wis
co
nsin
En
erg
yM
un
icip
alE
lectric
Au
thO
gle
tho
rpe
Po
we
rD
TE
En
erg
yW
PS
Re
so
urc
es
Am
eric
an
Ele
ctric
Po
we
rN
iag
ara
Mo
ha
wk
TE
CO
En
erg
yIp
alc
oE
nte
rpris
es
Po
we
rGe
nS
CA
NA
Pro
gre
ss
En
erg
yD
om
inio
nR
eso
urc
es
So
uth
ern
Co
mpa
ny
DP
LE
.K
en
tucky
Po
we
rC
oo
pF
irstE
ne
rgy
Te
nn
esse
eV
alle
yA
uth
ority
Co
ne
ctiv
Co
nste
llatio
nE
ne
rgy
PP
LV
ectre
nO
rion
Po
we
rA
lleg
he
ny
En
erg
yT
ran
sa
ltaC
ine
rgy
No
rthe
astU
tilities
Bu
cke
ye
Po
we
rR
GS
En
erg
y
Figure 2.12. Fossil SO2 emission rates of top 100 companies.
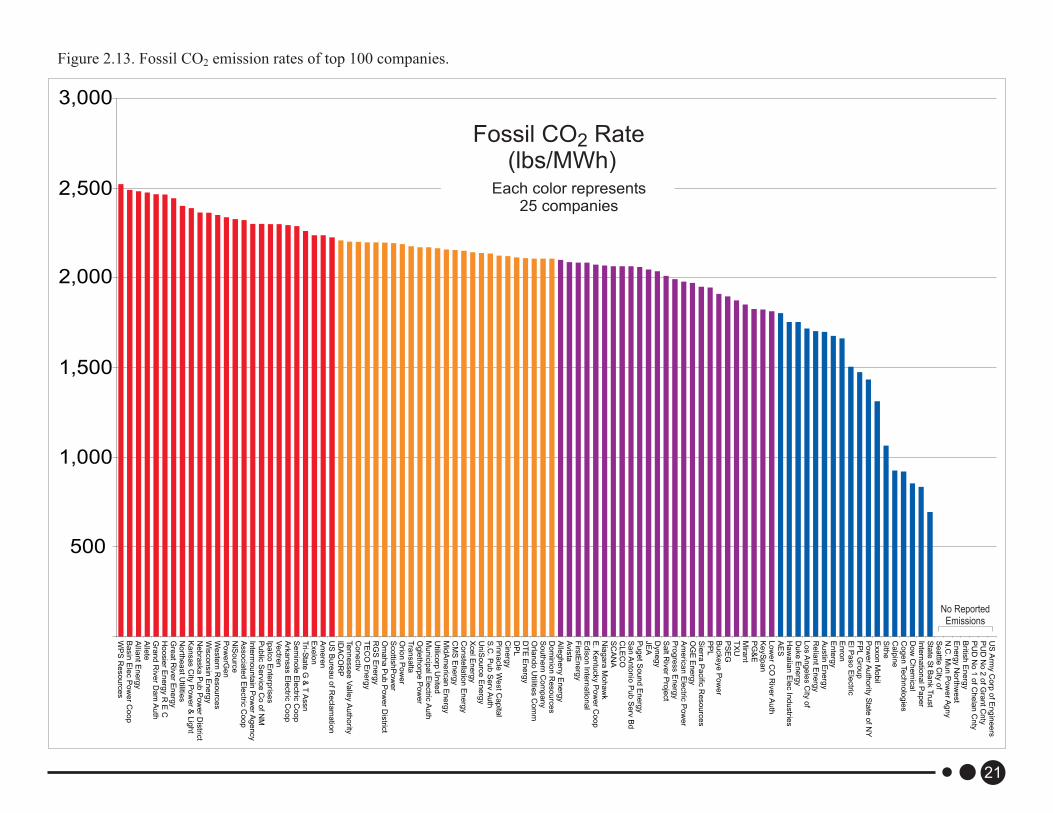
21
500
1,000
1,500
2,000
2,500
3,000
No ReportedEmissions
Each color represents25 companies
Fossil CO Rate(lbs/MWh)
2
US
Arm
yC
orp
ofE
ng
ine
ers
PU
DN
o2
ofG
ran
tC
nty
PU
DN
o1
ofC
he
lan
Cn
tyB
ritish
En
erg
yE
ne
rgy
No
rthw
est
N.C
.M
un
Po
we
rA
gn
yS
ea
ttleC
ityo
fS
tate
StB
an
kT
rust
Inte
rna
tion
alP
ap
er
Do
wC
he
mic
al
Co
ge
nTe
ch
no
log
ies
Ca
lpin
eS
ithe
Exxo
nM
ob
ilP
ow
erA
uth
ority
Sta
teo
fN
YF
PL
Gro
up
ElP
aso
Ele
ctric
En
ron
En
terg
yA
ustin
En
erg
yR
elia
ntE
ne
rgy
Lo
sA
ng
ele
sC
ityo
fD
uke
En
erg
yH
aw
aiia
nE
lec
Ind
ustrie
sA
ES
Lo
we
rC
OR
ive
rA
uth
Ke
yS
pa
nP
G&
EM
iran
tT
XU
PS
EG
Bu
cke
ye
Po
we
rP
PL
Sie
rraP
acific
Re
so
urc
es
OG
EE
ne
rgy
Am
eric
an
Ele
ctric
Po
we
rP
rog
ress
En
erg
yS
alt
Riv
er
Pro
ject
Dyn
eg
yJE
AP
ug
etS
ou
nd
En
erg
yS
an
An
ton
ioP
ub
Se
rvB
dC
LE
CO
SC
AN
AN
iag
ara
Mo
ha
wk
E.K
en
tucky
Po
we
rC
oo
pE
dis
on
Inte
rna
tion
al
Firs
tEn
erg
yA
vis
taA
lleg
he
ny
En
erg
yD
om
inio
nR
eso
urc
es
So
uth
ern
Co
mpa
ny
Orla
nd
oU
tilities
Co
mm
DT
EE
ne
rgy
DP
LC
ine
rgy
Pin
na
cle
We
stC
ap
ital
S.C
.P
ub
Se
rvA
uth
Un
iSo
urc
eE
ne
rgy
Xce
lE
ne
rgy
Co
nste
llatio
nE
ne
rgy
CM
SE
ne
rgy
Mid
Am
eric
an
En
erg
yU
tilico
rpU
nite
dM
un
icip
alE
lectric
Au
thO
gle
tho
rpe
Po
we
rT
ran
sa
ltaO
rion
Po
we
rS
co
ttish
Po
we
rO
ma
ha
Pu
bP
ow
er
Dis
trict
RG
SE
ne
rgy
TE
CO
En
erg
yC
on
ectiv
Te
nn
esse
eV
alle
yA
uth
ority
IDA
CO
RP
US
Bu
rea
uo
fR
ecla
ma
tion
Am
ere
nE
xe
lon
Tri-S
tate
G&
TA
ssn
Se
min
ole
Ele
ctric
Co
op
Ark
an
sa
sE
lectric
Co
op
Ve
ctre
nIp
alc
oE
nte
rpris
es
Pu
blic
Se
rvic
eC
oo
fN
MIn
term
ou
nta
inP
ow
erA
ge
ncy
Asso
cia
ted
Ele
ctric
Co
op
NiS
ou
rce
Po
we
rGe
nW
este
rnR
eso
urc
es
Wis
co
nsin
En
erg
yN
eb
raska
Pu
bP
ow
er
Dis
trict
Ka
nsa
sC
ityP
ow
er
&L
igh
tN
orth
ea
stU
tilities
Gre
atR
ive
rE
ne
rgy
Ho
osie
rE
ne
rgy
RE
CG
ran
dR
ive
rD
am
Au
thA
llete
Allia
ntE
ne
rgy
Ba
sin
Ele
cP
ow
er
Co
op
WP
SR
eso
urc
es
Figure 2.13. Fossil CO2 emission rates of top 100 companies.

22
1
2
3
4
5
6
7
8
9
No ReportedCoal Plant Emissions
Coal Plants NOx Rate(lbs/MWh)
Each color represents25 companies
US
Arm
yC
orp
ofE
ng
ine
ers
Po
we
rA
uth
ority
Sta
teo
fN
YK
eyS
pa
nD
ow
Ch
em
ica
lC
alp
ine
Sith
eP
UD
No
2o
fG
ran
tC
nty
PU
DN
o1
ofC
he
lan
Cn
tyB
ritish
En
erg
yE
ne
rgy
No
rthw
est
Sta
teS
tB
an
kT
rust
Nia
ga
raM
oh
aw
kN
.C.M
un
Po
we
rA
gn
yS
ea
ttleC
ityo
fE
xxo
nM
ob
ilC
og
en
Te
ch
no
log
ies
Ha
wa
iian
Ele
cIn
du
strie
sIn
tern
atio
na
lP
ap
er
Sa
nA
nto
nio
Pu
bS
erv
Bd
Gre
atR
ive
rE
ne
rgy
Re
lian
tE
ne
rgy
Orla
nd
oU
tilities
Co
mm
PG
&E
Au
stin
En
erg
yL
ow
er
CO
Riv
erA
uth
Exe
lon
PP
LT
XU
Ark
an
sa
sE
lectric
Co
op
Mu
nic
ipa
lE
lectric
Au
thO
gle
tho
rpe
Po
we
rT
ri-Sta
teG
&T
Assn
En
terg
yA
me
ren
Om
ah
aP
ub
Po
we
rD
istric
tIp
alc
oE
nte
rpris
es
OG
EE
ne
rgy
RG
SE
ne
rgy
No
rthe
astU
tilities
FP
LG
rou
pL
os
An
ge
les
City
of
US
Bu
rea
uo
fR
ecla
ma
tion
Sie
rraP
acific
Re
so
urc
es
E.K
en
tucky
Po
we
rC
oo
pID
AC
OR
PB
asin
Ele
cP
ow
er
Co
op
SC
AN
AT
ran
sa
ltaC
MS
En
erg
yE
nro
nG
ran
dR
ive
rD
am
Au
thU
niS
ou
rce
En
erg
yX
ce
lE
ne
rgy
Mid
Am
eric
an
En
erg
yS
alt
Riv
er
Pro
ject
Pu
ge
tS
ou
nd
En
erg
yA
vis
taS
co
ttish
Po
we
rP
rog
ress
En
erg
yA
llete
So
uth
ern
Co
mpa
ny
Du
ke
En
erg
yS
.C.P
ub
Se
rvA
uth
DT
EE
ne
rgy
Po
we
rGe
nC
on
ectiv
Inte
rmo
un
tain
Po
we
rA
ge
ncy
CL
EC
OS
em
ino
leE
lectric
Co
op
Dyn
eg
yJE
AH
oo
sie
rE
ne
rgy
RE
CW
isco
nsin
En
erg
yA
ES
Cin
erg
yW
este
rnR
eso
urc
es
Co
nste
llatio
nE
ne
rgy
Pin
na
cle
We
stC
ap
ital
Firs
tEn
erg
yN
eb
raska
Pu
bP
ow
er
Dis
trict
Ed
iso
nIn
tern
atio
na
lM
iran
tB
ucke
ye
Po
we
rP
SE
GA
llian
tE
ne
rgy
Pu
blic
Se
rvic
eC
oo
fN
MA
lleg
he
ny
En
erg
yA
me
rica
nE
lectric
Po
we
rD
om
inio
nR
eso
urc
es
WP
SR
eso
urc
es
Ka
nsa
sC
ityP
ow
er
&L
igh
tD
PL
Ve
ctre
nTe
nn
esse
eV
alle
yA
uth
ority
NiS
ou
rce
ElP
aso
Ele
ctric
Orio
nP
ow
er
Utilic
orp
Un
ited
TE
CO
En
erg
yA
sso
cia
ted
Ele
ctric
Co
op
Figure 2.14. Coal Plant NOx emission rates of top 100 companies.

23
5
10
15
20
25
30
35
40
No ReportedCoal Plant Emissions
Coal Plants SO Rate(lbs/MWh)
2
Each color represents25 companies
US
Arm
yC
orp
ofE
ng
ine
ers
Po
we
rA
uth
ority
Sta
teo
fN
YK
eyS
pa
nD
ow
Ch
em
ica
lC
alp
ine
Sith
eP
UD
No
2o
fG
ran
tC
nty
PU
DN
o1
ofC
he
lan
Cn
tyB
ritish
En
erg
yE
ne
rgy
No
rthw
est
Sta
teS
tB
an
kT
rust
Nia
ga
raM
oh
aw
kN
.C.M
un
Po
we
rA
gn
yS
ea
ttleC
ityo
fE
xxo
nM
ob
ilC
og
en
Te
ch
no
log
ies
Ha
wa
iian
Ele
cIn
du
strie
sIn
tern
atio
na
lP
ap
er
Inte
rmo
un
tain
Po
we
rA
ge
ncy
US
Bu
rea
uo
fR
ecla
ma
tion
Tri-S
tate
G&
TA
ssn
Pu
ge
tS
ou
nd
En
erg
yA
vis
taS
ierra
Pa
cific
Re
so
urc
es
IDA
CO
RP
Lo
sA
ng
ele
sC
ityo
fO
rlan
do
Utilitie
sC
om
mS
alt
Riv
er
Pro
ject
Sco
ttish
Po
we
rP
inn
acle
We
stC
ap
ital
Asso
cia
ted
Ele
ctric
Co
op
Alle
teP
ub
licS
erv
ice
Co
ofN
MJE
AS
an
An
ton
ioP
ub
Se
rvB
dE
lP
aso
Ele
ctric
Lo
we
rC
OR
ive
rA
uth
Au
stin
En
erg
yU
niS
ou
rce
En
erg
yO
GE
En
erg
yE
nro
nN
eb
raska
Pu
bP
ow
er
Dis
trict
Ark
an
sa
sE
lectric
Co
op
En
terg
yG
ran
dR
ive
rD
am
Au
thN
iSo
urc
eK
an
sa
sC
ityP
ow
er
&L
igh
tW
este
rnR
eso
urc
es
Om
ah
aP
ub
Po
we
rD
istric
tF
PL
Gro
up
Se
min
ole
Ele
ctric
Co
op
Mid
Am
eric
an
En
erg
yG
rea
tR
ive
rE
ne
rgy
S.C
.P
ub
Se
rvA
uth
Ba
sin
Ele
cP
ow
er
Co
op
CL
EC
OD
yn
eg
yX
ce
lE
ne
rgy
Ho
osie
rE
ne
rgy
RE
CU
tilico
rpU
nite
dA
llian
tE
ne
rgy
Am
ere
nR
elia
ntE
ne
rgy
Wis
co
nsin
En
erg
yM
un
icip
alE
lectric
Au
thO
gle
tho
rpe
Po
we
rC
MS
En
erg
yE
dis
on
Inte
rna
tion
al
PG
&E
WP
SR
eso
urc
es
DT
EE
ne
rgy
TE
CO
En
erg
yIp
alc
oE
nte
rpris
es
Po
we
rGe
nD
uke
En
erg
yA
ES
SC
AN
AT
XU
Am
eric
an
Ele
ctric
Po
we
rE
xe
lon
PS
EG
Do
min
ion
Re
so
urc
es
Pro
gre
ss
En
erg
yS
ou
the
rnC
om
pa
ny
DP
LE
.K
en
tucky
Po
we
rC
oo
pF
irstE
ne
rgy
Te
nn
esse
eV
alle
yA
uth
ority
PP
LC
on
ste
llatio
nE
ne
rgy
Ve
ctre
nM
iran
tA
lleg
he
ny
En
erg
yC
on
ectiv
Tra
nsa
ltaC
ine
rgy
Orio
nP
ow
er
No
rthe
astU
tilities
Bu
cke
ye
Po
we
rR
GS
En
erg
y
Figure 2.15. Coal Plant SO2 emission rates of top 100 companies.

24
500
1,000
1,500
2,000
2,500
3,000
Each color represents25 companies
Coal Plants CO Rate(lbs/MWh)
2
No ReportedCoal Plant Emissions
US
Arm
yC
orp
ofE
ng
ine
ers
Po
we
rA
uth
ority
Sta
teo
fN
YK
eyS
pa
nD
ow
Ch
em
ica
lC
alp
ine
Sith
eP
UD
No
2o
fG
ran
tC
nty
PU
DN
o1
ofC
he
lan
Cn
tyB
ritish
En
erg
yE
ne
rgy
No
rthw
est
Sta
teS
tB
an
kT
rust
Nia
ga
raM
oh
aw
kN
.C.M
un
Po
we
rA
gn
yS
ea
ttleC
ityo
fE
xxo
nM
ob
ilC
og
en
Te
ch
no
log
ies
Ha
wa
iian
Ele
cIn
du
strie
sIn
tern
atio
na
lP
ap
er
PG
&E
Bu
cke
ye
Po
we
rP
PL
Du
ke
En
erg
yE
xe
lon
SC
AN
AA
ES
Am
eric
an
Ele
ctric
Po
we
rE
.K
en
tucky
Po
we
rC
oo
pF
irstE
ne
rgy
Alle
gh
en
yE
ne
rgy
Orla
nd
oU
tilities
Co
mm
Lo
we
rC
OR
ive
rA
uth
Au
stin
En
erg
yS
ou
the
rnC
om
pa
ny
DP
LC
ine
rgy
Do
min
ion
Re
so
urc
es
DT
EE
ne
rgy
S.C
.P
ub
Se
rvA
uth
PS
EG
Pro
gre
ss
En
erg
yL
os
An
ge
les
City
of
Mira
nt
Co
nste
llatio
nE
ne
rgy
Mu
nic
ipa
lE
lectric
Au
thO
gle
tho
rpe
Po
we
rR
elia
ntE
ne
rgy
JE
AT
ran
sa
ltaD
yn
eg
yE
nro
nC
MS
En
erg
yT
EC
OE
ne
rgy
OG
EE
ne
rgy
RG
SE
ne
rgy
Un
iSo
urc
eE
ne
rgy
Te
nn
esse
eV
alle
yA
uth
ority
Om
ah
aP
ub
Po
we
rD
istric
tID
AC
OR
PF
PL
Gro
up
US
Bu
rea
uo
fR
ecla
ma
tion
Sa
ltR
ive
rP
roje
ct
Sie
rraP
acific
Re
so
urc
es
Am
ere
nM
idA
me
rica
nE
ne
rgy
CL
EC
OT
ri-Sta
teG
&T
Assn
Ed
iso
nIn
tern
atio
na
lS
co
ttish
Po
we
rE
lP
aso
Ele
ctric
Sa
nA
nto
nio
Pu
bS
erv
Bd
Se
min
ole
Ele
ctric
Co
op
Utilic
orp
Un
ited
Ipa
lco
En
terp
rise
sIn
term
ou
nta
inP
ow
erA
ge
ncy
Ve
ctre
nP
ug
etS
ou
nd
En
erg
yA
vis
taA
sso
cia
ted
Ele
ctric
Co
op
NiS
ou
rce
Pu
blic
Se
rvic
eC
oo
fN
MP
inn
acle
We
stC
ap
ital
Orio
nP
ow
er
No
rthe
astU
tilities
Po
we
rGe
nC
on
ectiv
Ark
an
sa
sE
lectric
Co
op
Xce
lE
ne
rgy
Ne
bra
ska
Pu
bP
ow
er
Dis
trict
Alle
teE
nte
rgy
We
ste
rnR
eso
urc
es
Gre
atR
ive
rE
ne
rgy
Wis
co
nsin
En
erg
yT
XU
Allia
ntE
ne
rgy
Ho
osie
rE
ne
rgy
RE
CG
ran
dR
ive
rD
am
Au
thK
an
sa
sC
ityP
ow
er
&L
igh
tB
asin
Ele
cP
ow
er
Co
op
WP
SR
eso
urc
es
Figure 2.16. Coal Plant CO2 emission rates of top 100 companies.

25
Company
Total
MWh
Fossil
MWh
NOx
tons
SO2
tons
CO2
tons
Hg
tons
All Source
NOx Rate
lb/MWh
All Source
SO2 Rate
lb/MWh
All Source
CO2 Rate
lb/MWh
Fossil
NOx Rate
lb/MWh
Fossil
SO2 Rate
lb/MWh
Fossil
CO2 Rate
lb/MWh
American Electric Power 199,092,729 193,560,480 487,270 1,077,587 191,486,171 4.57 4.89 10.82 1,924 5.03 11.13 1,979
Southern Company 172,188,817 140,720,688 321,670 949,097 148,263,452 3.45 3.74 11.02 1,722 4.57 13.49 2,107
Tennessee Valley Authority 153,393,767 99,902,318 285,849 727,037 109,992,800 1.76 3.73 9.48 1,434 5.72 14.55 2,202
Exelon 134,006,028 9,569,441 16,743 48,238 10,707,932 0.27 0.25 0.72 160 3.50 10.08 2,238
Xcel Energy 110,174,086 95,948,459 183,492 357,638 102,811,263 1.13 3.33 6.49 1,866 3.82 7.45 2,143
Entergy 104,028,017 61,310,542 112,868 101,379 51,389,613 0.35 2.17 1.95 988 3.68 3.31 1,676
Duke Energy 99,100,807 57,634,798 104,951 258,486 50,541,427 0.68 2.12 5.22 1,020 3.64 8.97 1,754
TXU 96,850,759 78,393,891 146,923 253,548 73,467,697 2.31 3.03 5.24 1,517 3.75 6.47 1,874
Progress Energy 85,128,730 55,349,797 111,223 340,641 55,139,805 1.25 2.61 8.00 1,295 4.02 12.31 1,992
FPL Group 84,298,456 58,478,261 94,949 170,610 43,104,896 0.13 2.25 4.05 1,023 3.25 5.83 1,474
Reliant Energy 83,289,354 77,406,881 84,619 211,476 65,907,912 1.52 2.03 5.08 1,583 2.19 5.46 1,703
Edison International 82,633,287 59,724,160 135,088 266,743 62,236,462 3.03 3.27 6.46 1,506 4.52 8.93 2,084
FirstEnergy 72,918,567 44,123,018 112,331 312,418 45,979,982 1.43 3.08 8.57 1,261 5.09 14.16 2,084
US Army Corp of Engineers 72,532,929 - - - - - - - - - - -
Dominion Resources 70,319,589 43,913,567 114,011 291,377 46,266,168 1.12 3.24 8.29 1,316 5.19 13.27 2,107
Cinergy 64,787,036 64,286,736 158,511 577,154 68,207,317 1.32 4.89 17.82 2,106 4.93 17.96 2,122
Ameren 59,555,305 48,535,397 93,930 239,948 54,305,770 1.18 3.15 8.06 1,824 3.87 9.89 2,238
ScottishPower 53,057,532 48,539,725 104,092 91,404 53,240,075 0.74 3.92 3.45 2,007 4.29 3.77 2,194
Allegheny Energy 48,691,258 48,925,098 130,214 411,453 51,376,362 1.03 5.35 16.90 2,110 5.32 16.82 2,100
US Bureau of Reclamation 48,674,543 4,397,387 9,056 1,175 4,893,466 0.04 0.37 0.05 201 4.12 0.53 2,226
PowerGen 48,342,148 47,986,535 110,964 283,824 56,100,838 0.81 4.59 11.74 2,321 4.62 11.83 2,338
PPL 47,418,059 29,024,505 51,182 222,291 28,244,679 1.12 2.16 9.38 1,191 3.53 15.32 1,946
PG&E 43,887,857 14,555,688 20,964 65,210 13,293,695 0.13 0.96 2.97 606 2.88 8.96 1,827
DTE Energy 41,387,068 41,903,380 95,241 227,924 44,209,250 0.81 4.60 11.01 2,136 4.55 10.88 2,110
Mirant 40,859,778 40,859,778 71,063 199,217 37,831,071 0.67 3.48 9.75 1,852 3.48 9.75 1,852
PSEG 40,155,529 16,357,585 34,086 83,221 15,517,284 0.33 1.70 4.14 773 4.17 10.18 1,897
Power Authority State of NY 37,121,806 4,527,886 3,599 2,436 3,244,846 - 0.19 0.13 175 1.59 1.08 1,433
AES 36,106,702 35,836,687 61,529 144,988 32,307,788 0.54 3.41 8.03 1,790 3.43 8.09 1,803
Wisconsin Energy 33,471,462 25,399,780 58,732 129,571 30,008,853 0.66 3.51 7.74 1,793 4.62 10.20 2,363
Constellation Energy 32,798,084 18,262,254 45,632 137,674 19,644,925 0.57 2.78 8.40 1,198 5.00 15.08 2,151
Western Resources 26,234,922 21,976,330 55,539 76,006 25,818,059 0.57 4.23 5.79 1,968 5.05 6.92 2,350
Alliant Energy 25,130,722 19,300,632 51,985 90,744 23,968,797 0.49 4.14 7.22 1,908 5.39 9.40 2,484
CMS Energy 25,092,437 19,552,773 40,846 98,972 21,073,324 0.54 3.26 7.89 1,680 4.18 10.12 2,156
Salt River Project 24,773,166 19,092,620 43,835 30,343 19,194,692 0.22 3.54 2.45 1,550 4.59 3.18 2,011
Pinnacle West Capital 24,335,290 15,461,682 35,114 26,905 16,418,018 0.30 2.89 2.21 1,349 4.54 3.48 2,124
OGE Energy 23,324,626 23,324,626 43,195 47,327 22,988,503 0.34 3.70 4.06 1,971 3.70 4.06 1,971
Dynegy 22,167,547 22,167,547 46,397 84,609 22,577,500 0.32 4.19 7.63 2,037 4.19 7.63 2,037
Northeast Utilities 21,847,052 5,597,678 12,187 59,342 6,719,562 0.04 1.12 5.43 615 4.35 21.20 2,401
SCANA 21,512,944 17,337,418 36,213 105,346 17,902,835 0.13 3.37 9.79 1,664 4.18 12.15 2,065
S.C. Pub Serv Auth 20,592,838 18,264,316 42,126 69,381 19,503,948 0.20 4.09 6.74 1,894 4.61 7.60 2,136
MidAmerican Energy 20,452,152 19,989,221 41,854 67,569 21,575,961 0.54 4.09 6.61 2,110 4.19 6.76 2,159
San Antonio Pub Serv Bd 19,710,733 14,363,030 17,094 23,272 14,829,663 0.37 1.73 2.36 1,505 2.38 3.24 2,065
Oglethorpe Power 18,639,080 9,283,160 17,167 48,151 10,075,656 0.23 1.84 5.17 1,081 3.70 10.37 2,171
DPL 17,659,691 17,659,691 48,523 120,680 18,671,556 0.40 5.50 13.67 2,115 5.50 13.67 2,115
NiSource 17,249,958 17,207,814 52,882 57,742 20,030,738 0.35 6.13 6.69 2,322 6.15 6.71 2,328
TECO Energy 17,098,633 17,098,633 60,549 98,949 18,794,070 0.28 7.08 11.57 2,198 7.08 11.57 2,198
Ipalco Enterprises 16,990,974 16,990,974 33,415 100,047 19,535,328 0.22 3.93 11.78 2,299 3.93 11.78 2,299
KeySpan 16,331,586 16,331,586 17,965 36,555 14,894,855 - 2.20 4.48 1,824 2.20 4.48 1,824
IDACORP 16,277,320 7,778,396 16,227 11,969 8,593,605 0.11 1.99 1.47 1,056 4.17 3.08 2,210
Basin Elec Power Coop 16,156,933 16,156,933 33,779 63,332 20,113,866 0.45 4.18 7.84 2,490 4.18 7.84 2,490
Table 2.1. Company Data Summary.

26
Company
Total
MWh
Fossil
MWh
NOx
tons
SO2
tons
CO2
tons
Hg
tons
All Source
NOx Rate
lb/MWh
All Source
SO2 Rate
lb/MWh
All Source
CO2 Rate
lb/MWh
Fossil
NOx Rate
lb/MWh
Fossil
SO2 Rate
lb/MWh
Fossil
CO2 Rate
lb/MWh
Associated Electric Coop 15,209,586 15,209,586 62,658 34,773 17,660,528 0.27 8.24 4.57 2,322 8.24 4.57 2,322
Los Angeles City of 15,008,715 12,409,021 13,660 9,604 10,658,699 0.06 1.82 1.28 1,420 2.20 1.55 1,718
Kansas City Power & Light 14,985,716 10,727,124 28,202 34,507 12,811,019 0.23 3.76 4.61 1,710 5.26 6.43 2,389
Orion Power 14,513,711 14,513,711 39,766 117,667 15,881,337 0.54 5.48 16.21 2,188 5.48 16.21 2,188
Nebraska Pub Power District 14,370,909 9,372,917 24,342 26,873 11,080,489 0.19 3.39 3.74 1,542 5.19 5.73 2,364
Sierra Pacific Resources 13,747,209 13,701,066 26,669 12,485 13,363,439 0.07 3.88 1.82 1,944 3.89 1.82 1,951
Intermountain Power Agency 13,184,564 13,184,564 30,919 3,474 15,168,027 0.00 4.69 0.53 2,301 4.69 0.53 2,301
Conectiv 12,429,654 9,432,714 20,106 70,328 10,377,578 0.21 3.24 11.32 1,670 4.26 14.91 2,200
JEA 12,401,815 12,401,815 28,263 39,982 12,690,855 0.09 4.56 6.45 2,047 4.56 6.45 2,047
WPS Resources 12,302,150 10,475,149 28,010 57,769 13,214,873 0.30 4.55 9.39 2,148 5.35 11.03 2,523
UniSource Energy 12,152,244 12,152,244 26,083 30,538 12,992,114 0.30 4.29 5.03 2,138 4.29 5.03 2,138
Enron 12,004,346 9,479,111 15,722 13,723 7,881,671 0.13 2.62 2.29 1,313 3.32 2.90 1,663
Omaha Pub Power District 11,760,782 7,868,038 15,296 27,874 8,641,881 0.09 2.60 4.74 1,470 3.89 7.09 2,197
Lower CO River Auth 11,431,914 11,214,702 16,784 19,494 10,170,513 0.25 2.94 3.41 1,779 2.99 3.48 1,814
Municipal Electric Auth 11,399,064 4,672,524 8,641 24,236 5,071,414 0.12 1.52 4.25 890 3.70 10.37 2,171
Great River Energy 11,127,314 10,949,711 14,898 39,957 13,376,201 0.33 2.68 7.18 2,404 2.72 7.30 2,443
Dow Chemical 10,964,503 10,964,503 2,570 24 4,682,614 - 0.47 0.00 854 0.47 0.00 854
Austin Energy 10,847,800 7,791,929 9,672 11,182 6,617,152 0.14 1.78 2.06 1,220 2.48 2.87 1,698
Tri-State G & T Assn 10,688,263 10,688,263 20,625 11,171 12,081,135 0.17 3.86 2.09 2,261 3.86 2.09 2,261
Public Service Co of NM 10,489,817 7,390,998 19,348 17,050 8,502,779 0.29 3.69 3.25 1,621 5.24 4.61 2,301
Calpine 10,397,428 5,499,441 1,581 13 2,549,226 - 0.30 0.00 490 0.57 0.00 927
Sithe 10,343,625 10,343,625 4,347 9,872 5,509,127 - 0.84 1.91 1,065 0.84 1.91 1,065
Arkansas Electric Coop 10,024,851 9,749,907 17,773 29,527 11,181,622 0.19 3.55 5.89 2,231 3.65 6.06 2,294
PUD No 2 of Grant Cnty 9,621,814 - - - - - - - - - - -
Transalta 9,505,770 9,505,770 20,115 83,600 10,345,031 0.26 4.23 17.59 2,177 4.23 17.59 2,177
PUD No 1 of Chelan Cnty 9,459,693 - - - - - - - - - - -
Seminole Electric Coop 9,205,481 9,175,479 21,856 33,160 10,494,411 0.06 4.75 7.20 2,280 4.76 7.23 2,287
E. Kentucky Power Coop 9,138,083 9,118,678 18,749 63,042 9,455,365 0.26 4.10 13.80 2,069 4.11 13.83 2,074
British Energy 9,080,420 - - - - - - - - - - -
Energy Northwest 8,687,893 - - - - - - - - - - -
El Paso Electric 8,679,570 3,879,439 6,480 1,947 2,918,349 0.03 1.49 0.45 672 3.34 1.00 1,505
Vectren 8,593,917 8,593,917 24,347 66,829 9,880,792 0.10 5.67 15.55 2,299 5.67 15.55 2,299
Hoosier Energy R E C 8,522,436 8,522,436 20,714 39,870 10,503,580 0.09 4.86 9.36 2,465 4.86 9.36 2,465
State St Bank Trust 8,413,648 8,413,648 1,739 2 2,923,086 - 0.41 0.00 695 0.41 0.00 695
Niagara Mohawk 8,215,335 730,972 944 4,166 756,368 - 0.23 1.01 184 2.58 11.40 2,069
Puget Sound Energy 7,919,317 6,610,910 14,559 5,382 6,812,233 0.14 3.68 1.36 1,720 4.40 1.63 2,061
Buckeye Power 7,350,076 7,350,076 19,295 80,305 7,025,076 0.21 5.25 21.85 1,912 5.25 21.85 1,912
CLECO 6,959,261 6,959,261 14,023 18,885 7,185,628 0.04 4.03 5.43 2,065 4.03 5.43 2,065
Allete 6,954,011 6,409,101 14,851 15,180 7,935,044 0.16 4.27 4.37 2,282 4.63 4.74 2,476
N.C. Mun Power Agny 6,714,139 - - - - - - - - - - -
Utilicorp United 6,713,657 6,713,657 21,973 26,713 7,266,674 0.12 6.55 7.96 2,165 6.55 7.96 2,165
RGS Energy 6,611,462 1,455,915 2,903 25,705 1,600,089 0.05 0.88 7.78 484 3.99 35.31 2,198
Seattle City of 6,393,346 - - - - - - - - - - -
Exxon Mobil 5,985,110 5,985,110 1,534 24 3,927,512 - 0.51 0.01 1,312 0.51 0.01 1,312
Avista 5,795,494 1,887,610 3,855 1,645 1,970,757 0.04 1.33 0.57 680 4.08 1.74 2,088
Orlando Utilities Comm 5,791,497 5,318,791 8,530 9,423 5,604,889 0.04 2.95 3.25 1,936 3.21 3.54 2,108
Cogen Technologies 5,619,070 5,619,070 652 24 2,586,573 - 0.23 0.01 921 0.23 0.01 921
Hawaiian Elec Industries 5,516,254 5,516,254 11,980 13,751 4,837,930 - 4.34 4.99 1,754 4.34 4.99 1,754
International Paper 5,464,150 2,065,527 1,721 2,535 862,375 - 0.63 0.93 316 1.67 2.45 835
Grand River Dam Auth 5,314,828 5,037,124 11,098 16,351 6,211,705 0.11 4.18 6.15 2,337 4.41 6.49 2,466
Table 2.1 (cont.). Company Data Summary.

27
Company
Total
MWh
NOx
tons
SO2
tons
CO2
tons
Hg
tons
All Source
NOx Rate
All Source
SO2 Rate
All Source
CO2 Rate
Fossil
NOx Rate
Fossil
SO2 Rate
Fossil
CO2 Rate
Coal Plants
NOx Rate
Coal Plants
SO2 Rate
Coal Plants
CO2 Rate
AES 28 22 20 21 23 46 26 44 72 40 76 27 25 76
Allegheny Energy 19 8 5 14 14 8 4 23 11 6 51 14 8 72
Allete 89 71 71 69 57 21 58 11 25 63 4 41 69 12
Alliant Energy 32 27 31 25 27 27 34 37 9 35 3 16 40 6
Ameren 17 18 14 11 10 54 25 42 59 33 24 67 39 38
American Electric Power 1 1 1 1 1 10 15 35 19 24 65 13 22 75
Arkansas Electric Coop 73 62 59 54 54 42 44 14 67 56 20 72 58 15
Associated Electric Coop 51 21 54 39 43 1 56 6 1 65 15 1 70 23
Austin Energy 68 78 76 76 59 74 74 69 81 77 81 77 64 70
Avista 95 84 87 90 76 79 84 83 52 82 52 44 78 24
Basin Elec Power Coop 50 41 42 30 28 25 30 1 45 42 2 55 46 2
British Energy 79 97 97 97 97 97 97 97 97 97 97 97 97 97
Buckeye Power 87 59 35 73 52 9 1 36 13 2 69 18 2 81
Calpine 71 90 92 89 91 89 92 87 89 91 89 89 89 89
Cinergy 16 5 4 6 8 11 2 25 21 4 45 26 5 66
CLECO 88 73 68 72 78 31 47 27 53 60 58 33 45 36
CMS Energy 33 36 28 29 24 51 29 50 46 31 39 52 34 50
Cogen Technologies 97 93 91 88 90 91 89 78 93 89 90 90 90 90
Conectiv 58 57 37 60 51 53 12 51 41 11 28 35 7 16
Constellation Energy 30 31 21 32 21 60 23 70 20 10 40 24 11 58
Dominion Resources 15 9 9 16 12 52 24 64 16 17 50 12 19 65
Dow Chemical 67 87 90 83 86 86 91 80 91 92 91 91 91 91
DPL 44 29 23 37 29 6 8 22 7 15 46 9 16 67
DTE Energy 24 16 15 18 16 15 14 21 32 26 47 37 30 64
Duke Energy 7 14 12 15 18 69 49 76 68 37 78 39 26 79
Dynegy 37 30 32 27 36 24 33 29 44 43 62 31 44 52
E. Kentucky Power Coop 78 60 43 65 45 28 7 26 51 14 55 57 15 74
Edison International 12 7 11 8 3 50 41 58 34 39 54 20 33 34
El Paso Electric 81 82 86 87 81 78 86 84 73 86 84 5 65 32
Energy Northwest 80 98 98 98 98 98 98 98 98 98 98 98 98 98
Enron 62 68 73 70 62 62 71 65 74 76 83 51 60 51
Entergy 6 10 26 13 32 67 75 77 66 72 82 68 57 11
Exelon 4 66 47 56 42 90 83 93 70 32 23 75 21 78
Exxon Mobil 94 91 89 84 87 85 90 66 90 90 87 87 87 87
FirstEnergy 13 11 8 17 7 55 22 68 17 13 53 22 14 73
FPL Group 10 17 19 19 61 65 62 75 75 57 85 61 51 42
Grand River Dam Auth 100 77 70 77 66 26 43 4 35 52 5 50 56 4
Great River Energy 66 70 51 46 34 61 36 3 79 46 7 81 48 9
Hawaiian Elec Industries 98 76 72 82 85 19 53 46 38 62 77 85 85 85
Hoosier Energy R E C 83 54 52 58 70 12 21 2 22 36 6 29 42 5
IDACORP 49 67 75 67 67 71 78 74 48 75 26 56 76 43
Intermountain Pwr Ag 57 43 83 43 82 14 85 8 24 88 16 34 82 27
International Paper 99 89 84 92 92 84 82 89 86 78 92 92 92 92
Ipalco Enterprises 47 42 27 33 50 32 9 9 56 21 18 65 28 28
JEA 59 44 50 52 71 17 42 28 31 54 61 30 67 54
Kansas City Pwr & Light 53 45 55 51 48 36 55 49 12 55 9 10 54 3
KeySpan 48 61 53 44 83 66 57 41 84 66 74 84 84 84
Los Angeles City of 52 74 79 57 74 73 80 62 83 84 79 60 75 60
Lower CO River Auth 64 65 67 62 46 58 65 45 77 71 75 76 63 69
MidAmerican Energy 41 35 39 28 25 29 39 24 43 50 38 47 49 37
Table 2.2. Company Rankings Summary (1 = highest emissions, 100 = lowest emissions).

28
Company
Total
MWh
NOx
tons
SO2
tons
CO2
tons
Hg
tons
All Source
NOx Rate
All Source
SO2 Rate
All Source
CO2 Rate
Fossil
NOx Rate
Fossil
SO2 Rate
Fossil
CO2 Rate
Coal Plants
NOx Rate
Coal Plants
SO2 Rate
Coal Plants
CO2 Rate
Mirant 25 20 18 20 19 45 17 40 71 34 72 19 9 59
Municipal Electric Auth 65 80 65 80 65 77 59 79 65 28 36 71 36 57
N.C. Mun Power Agny 90 99 99 99 99 99 99 99 99 99 99 99 99 99
Nebraska Pub Pwr Dist 55 50 62 55 55 47 63 56 15 58 10 21 59 13
Niagara Mohawk 85 92 82 93 93 92 81 91 80 23 56 83 83 83
NiSource 45 26 46 31 31 4 38 5 4 51 14 6 55 22
Northeast Utilities 38 75 44 75 79 80 46 85 37 3 8 62 3 18
OGE Energy 36 33 49 26 33 39 61 31 63 67 66 64 61 48
Oglethorpe Power 43 63 48 63 47 72 50 72 64 27 35 70 35 56
Omaha Pub Pwr Dist 63 69 60 66 69 64 54 60 58 48 31 66 52 44
Orion Power 54 37 24 41 26 7 5 16 8 7 33 4 4 19
Orlando Utilities Comm 96 81 80 78 77 57 66 34 76 69 48 79 74 71
PG&E 23 53 41 48 63 81 68 86 78 38 73 78 32 82
Pinnacle West Capital 35 39 61 40 37 59 72 63 33 70 44 23 71 20
Power Auth State of NY 27 85 85 85 88 93 87 92 87 85 86 86 86 86
PowerGen 21 13 10 9 15 16 10 7 26 20 13 36 27 17
PPL 22 28 16 23 13 68 20 71 69 9 68 74 12 80
Progress Energy 9 12 7 10 9 63 27 67 54 18 64 42 18 61
PSEG 26 40 34 42 35 76 60 81 49 30 70 17 20 62
Public Service Co of NM 70 58 69 68 40 40 67 53 14 64 17 15 68 21
PUD No 1 of Chelan Cnty 76 96 96 96 96 96 96 96 96 96 96 96 96 96
PUD No 2 of Grant Cnty 74 95 95 95 95 95 95 95 95 95 95 95 95 95
Puget Sound Energy 86 72 81 74 58 41 79 48 36 83 60 45 79 25
Reliant Energy 11 19 17 7 6 70 51 54 85 59 80 80 38 55
RGS Energy 92 86 64 91 75 82 31 88 55 1 30 63 1 47
S.C. Pub Serv Auth 40 34 38 34 53 30 37 38 28 44 43 38 47 63
Salt River Project 34 32 58 35 49 43 69 55 29 74 63 46 73 40
San Antonio Pub Serv Bd 42 64 66 45 30 75 70 59 82 73 59 82 66 31
SCANA 39 38 25 38 60 48 16 52 47 19 57 54 24 77
ScottishPower 18 15 30 12 17 33 64 30 40 68 32 43 72 33
Seattle City of 93 100 100 100 100 100 100 100 100 100 100 100 100 100
Seminole Electric Coop 77 52 56 59 73 13 35 12 23 47 21 32 50 30
Sierra Pacific Resources 56 47 74 47 72 34 77 33 57 81 67 58 77 39
Sithe 72 83 78 79 84 83 76 73 88 80 88 88 88 88
Southern Company 2 2 2 2 2 37 13 47 30 16 49 40 17 68
State St Bank Trust 84 88 93 86 89 87 93 82 92 93 93 93 93 93
TECO Energy 46 23 29 36 41 2 11 15 2 22 29 2 29 49
Tennessee Valley Auth 3 3 3 3 5 38 18 61 5 12 27 7 13 45
Transalta 75 56 33 61 44 23 3 17 42 5 34 53 6 53
Tri-State G & T Assn 69 55 77 53 56 35 73 13 60 79 22 69 80 35
TXU 8 6 13 5 4 56 48 57 62 53 71 73 23 7
UniSource Energy 61 48 57 50 38 20 52 20 39 61 42 49 62 46
US Army Corp of Eng 14 94 94 94 94 94 94 94 94 94 94 94 94 94
US Bureau of Recl 20 79 88 81 80 88 88 90 50 87 25 59 81 41
Utilicorp United 91 51 63 71 64 3 28 18 3 41 37 3 41 29
Vectren 82 49 40 64 68 5 6 10 6 8 19 8 10 26
Western Resources 31 25 36 24 22 22 45 32 18 49 12 25 53 10
Wisconsin Energy 29 24 22 22 20 44 32 43 27 29 11 28 37 8
WPS Resources 60 46 45 49 39 18 19 19 10 25 1 11 31 1
Xcel Energy 5 4 6 4 11 49 40 39 61 45 41 48 43 14
Table 2.2 (cont.). Company Rankings Summary (1 = highest emissions, 100 = lowest emissions).

The emissions performance comparisons above are
intended to provide information to assist electric
companies, investors, consumers, and policymakers
in evaluating relative emissions performance in the
industry. This type of transparent information
supports corporate self-evaluation by providing
companies a reference to assess their own
performance in relation to key competitors, prior
years, and industry benchmarks. By understanding
and tracking corporate performance, companies can
evaluate how different business decisions may affect
emissions performance over time and be in a
position to appropriately consider environmental
issues in corporate decision-making. At the same
time, transparent information helps promote broader
public understanding of emissions performance and
stimulate consideration of environmental factors in
investment and purchasing decisions.
Public Information
Electricity is not a typical commodity that is bought
and sold based exclusively on preferences and
economics. Instead, it is an essential public good
whose availability, price and reliability have
extensive impacts on the economy, energy security,
and individual consumers’ well being. Its production
and use also can have wide-ranging, long-term
environmental impacts. These circumstances create
the need for transparent public emissions and
operational information so that consumers, investors
and policymakers can independently evaluate
industry operations and corporate performance.
Public information also promotes understanding of
the economic and environmental tradeoffs of
different generating technologies and policy
approaches, which supports informed public
policy making.
Transparent public information is common and
expected in some areas of business, such as
financial reporting, where investors require and
rely on corporate data to evaluate investment
decisions. In other areas, confidential treatment
of information is viewed as important to protect
trade secrets, or maintain incentive for corporate
innovation.
In the electric industry, some environmental
information, including monitored emissions data
and information on toxic emissions, is required
by law to be reported to EPA and publicly
disclosed.7 Companies must report other
information, such as fuel and generation data
(needed to analyze power plant and corporate
emissions rates), to the Energy Information
Administration (EIA), which publishes the data
in a series of databases. While these data are
useful for experienced users, they are not user
friendly, frequently contain inconsistent data and
usually must be combined and manipulated
before basic comparisons can be made across the
industry. The federal government can and should
do more to make this information accurate,
accessible and understandable.
In addition, the public availability of EIA data is
subject to EIA policies that have been changing
over time.8 In March 2000, EIA proposed a
policy change that would have significantly
29
3.0 INFORMATION TRANSPARENCY &
CORPORATE ACCOUNTABILITY

reduced the amount of electric industry information
released to the public. However, after an
overwhelming adverse response from state and
federal officials, public interest groups, consumer
advocates, and others who rely on the data for a
variety of important private and public policy
purposes, EIA amended its proposal and agreed to
maintain public access to virtually all reported
electric industry data.9 The public reaction to EIA’s
proposed policy change indicates significant public
interest in maintaining access to electric industry
information.
Use of Environmental Data
Environmental factors are becoming increasingly
important in investment and purchasing decisions,
which increases the need for accurate environmental
information. The creation of CERES by investors,
public pension funds, and others in 1989 was an
early sign of increased environmental awareness in
the investment community. More recently, the
emergence of firms such as Innovest and KLD,
which specialize in assessing the implications of
corporate environmental performance data for fund
managers, indicates a rising demand for corporate
environmental information among major investors.
According to the Social Investment Forum,
socially-responsible investment funds currently
manage approximately $2.1 trillion. All of these
trends point to the growing investor appetite for
environmental information.
Environmental information is particularly important
as investors look to assess the value of their
investments over time. Changing environmental
requirements could have important implications for
long-term value, depending on how they impact a
company’s assets relative to its competitors.
Especially in the context of climate change, which
poses considerable uncertainty and different
economic impacts for different types of power
plants, environmental performance today could shed
important light on the prospects for sustained value.
Environmental information is also important to
enable consumers to evaluate performance and
hold companies accountable for decisions and
activities that affect the environment or public
health and welfare. As part of electric industry
restructuring, some states have enacted
environmental information disclosure programs
that require electricity suppliers to provide
consumers emissions and fuel mix information
about the electricity they sell (Figure 3.1).
Emissions and fuel mix disclosure programs
exist or are being implemented in Arizona,
Illinois, Maine, Maryland, Massachusetts,
Michigan, New Hampshire, New Jersey, New
Mexico, New York, Ohio, Oregon, Rhode Island
and Vermont.10 In these states, consumers can
30
Energy Source
Air Emissions
Energy Conservation
XYZ Energy Supplier guarantees that theseenergy resources will be used to generatethis new electricity product.
Coal 30%Gas 20%Hydroelectric (large) 5%Nuclear 30%Oil 5%Renewable energy
Captured methane gas 5%Fuel cells 0%Geothermal 0%Hydroelectric (small) 2%Solar 0%Solid Waste 2%Wind 1%Wood or other biomass 0%
Total 100%
XYZ Energy Supplier guarantees that the amountof air pollution associated with the generation of theelectricity product will not exceed the amountshown. This amount is compared to the NewJersey benchmark. The benchmark approximatesthe average emissions rate for all electricitygeneration in New Jersey.
XYZ Energy Supplier will invest in energyconservation measures sufficient to avoidthe electricity generation shown and theassociated air emissions. Energy con-servation measures means less electricityneeds to be generated and pollution isavoided.
CO is a “greenhouse gas” which may contribute to globalclimate change. SO and NO react to form acids found inacid rain. NO also reacts to form ground level ozone, anunhealthful component of “smog.”
2
2 x
x
100%
0%CO2 NOx SO2
gre
ate
rp
ollu
tio
nle
sse
rp
ollu
tio
n
Avoided Generation Avoided Air Emissions
80%90%
150%
NJ Benchmark
10,000 KWh 10 tons CO1 ton NO1 tons SO
2
x
2
See your Terms of Service for further information regarding this label. You may also call XYZ EnergySupplier for additional information or a copy of the Terms of Service at (800) 555-1212.
Renewable energy sources subtotal 10%.
Figure 3.1. New Jersey Environmental DisclosureLabel.

choose to hold electric companies responsible for
their environmental performance by considering it in
purchasing decisions. To the extent environmental
factors play a role in consumer choices and create
financial penalties for poor environmental
performance, companies are likely to react quickly
to improve performance.
Transparent information also allows the public to
verify that companies are meeting their
environmental commitments and claims. For
example, some electric companies are establishing
voluntary emissions reduction goals for CO2 and
other pollutants and many companies are reporting
significant CO2 emissions reductions from voluntary
actions they are taking. Public information is
necessary to verify the legitimacy of these claims.
Corporate Self-evaluation
Companies in all sectors of the economy regularly
evaluate their performance by comparing it to others
in their industry. Productivity, financial results and
safety records are commonly compared across
companies and against industry benchmarks to
“reality check” performance. Increasingly,
companies are also benchmarking their
environmental performance through participation in
initiatives such as CERES and the Global Reporting
Initiative (GRI).
Emissions performance comparisons in the electric
industry enable companies to put their emissions and
emissions rates in context. Comparative emissions
information also helps companies evaluate the
relative economic impacts that may result from
changes in environmental regulations, and assess
what role environmental and other factors should
play in business investment decisions. In this way,
transparent information is a tool for corporate
self-evaluation and business planning.
In the electric industry, virtually all power plant
investment decisions have some impact on the
environment, whether they involve determining
what type of technologies or fuels to use at a
new power plant facility, or what types of
environmental controls to install (or not install)
on existing facilities. Uncertainty about future
emissions control requirements facing the
industry make business planning difficult (see
discussion below in Policy Considerations), but
also create legitimate business reasons for
companies to look beyond current environmental
requirements as they consider investment
options. For example, investing in cleaner
technologies to improve emissions performance
may help reduce a company’s exposure to
regulatory changes that pose economic risks for
competitors, or help position a company to take
advantage of changing market conditions under
new regulatory programs. Alternatively,
maintaining poor emissions performance,
particularly when it involves harmful air
pollution that affects public health and the
environment, may generate unwanted negative
publicity and conflict with corporate policies
regarding environmental stewardship. For these
reasons, it is prudent for companies to
understand emissions performance and assess
how it may affect strategic positioning.
Ultimately, companies must decide whether it is
in their interest to take responsibility for
improving emissions performance beyond
regulatory requirements. The first step is to
conduct a self-evaluation of performance, which
the information in this report is intended to
facilitate. If the evaluation leads to a new
perspective on corporate emissions, the second
step is committing to progress towards reducing
emissions. Since the electric industry is
responsible for considerable air pollutant
emissions, and just about every investment
decision in the industry involves emissions
creation or reduction, small changes in corporate
behavior could have important implications for
environmental quality over time.
31

Maintaining reliable, low-cost and long-term
electricity supplies is important for the national
economy and individual prosperity. At the same
time, reducing air pollutant emissions from power
plants is important to protect public health and
mitigate local, regional and global air pollution
impacts. A range of policy approaches have been
proposed that promote clean, efficient and economic
electricity production and consumption to support
these energy and environmental policy objectives.
The discussion that follows reviews key policy
approaches under consideration that seek to improve
energy efficiency, stimulate advanced technologies,
and reduce electric industry emissions.
Energy Efficiency
Fossil fuel consumption, air pollutant emissions and
the price of electricity are all directly affected by the
overall demand for electricity. Reducing electricity
demand helps save resources, lower emissions and
reduce electricity prices. Improving the efficiency of
electric appliances (e.g., reducing the amount of
electricity it takes to heat, cool, wash, light, spin,
etc), and improving the insulation and
weatherization of homes and offices are important
means of lowering electricity demand.
Traditionally, utility-run Demand Side Management
(DSM) programs, designed to encourage and assist
consumers to reduce or modify their patterns of
electricity use, have been relied on to promote
energy efficiency and conservation. These programs
continue to play an important role in reducing
electricity demand, accounting for a reported 54
billion kWh of energy savings in 2000 (or an energy
savings of 1.6 percent of electricity sales).11 As
state and federal restructuring reduces the role of
traditional electric utilities (see Box 4.1. Electric
Industry Restructuring), implementation of new
state and federal policies and programs will
become increasingly important for stimulating
energy efficiency and conservation programs.
Many states are working to ensure that electric
restructuring supports continued investment in
energy efficiency by establishing long-term
funding mechanisms. Virtually all states
undertaking restructuring initiatives (see Figure
4.1) have established or are considering some
level of energy conservation funding. Most
programs provide funding through a small
surcharge ("wires charge" or "system benefits
charge") on electricity bills. In addition, several
states are taking the lead in establishing building
and appliance standards to promote efficiency
improvement.
Going forward, energy efficiency investments
will be a potentially crucial part of
electric-resource portfolios to assure affordable
and reliable service to customers. Several state
programs have already demonstrated
considerable energy conservation achievements.
For example, California reduced its peak
electricity needs by 10,000 megawatts thorough
energy efficiency investments and standards
prior to 1999, and added at least another 5,000
MW since then.12
On the federal side, there are a number of policy
options to promote energy efficiency. One
federal policy approach is to establish new
efficiency standards for appliances, including
3232
4.0 POLICY CONSIDERATIONS

washers and dryers, refrigerators, water heaters, and
heating and cooling systems. Since 1987, when
Congress passed the National Appliance Energy
Conservation Act (NAEC), the Department of
Energy (DOE) has been responsible for testing
various appliance technologies and establishing
efficiency standards. These standards and other
technological improvements by appliance
manufacturers have improved energy efficiency.
For example, the average energy efficiency of new
refrigerators nearly tripled from 1972 to 1999.
Nonetheless, appliance efficiency standards have
remained contentious over the years. Congress
issued a moratorium on new standards in 1995,
which resulted in no new standards between 1996
and 2000. In addition, in January 2001, DOE
issued new air conditioning efficiency standards
that were subsequently withdrawn, a decision
that is now being challenged in court.
Legislation introduced by Senator Daschle, the
Energy Policy Act of 2002, would reinstate
DOE’s revised air conditioning efficiency
standards, and grant DOE new authority to
promulgate efficiency standards for additional
products.
Federal tax incentives are also under
consideration to support energy efficiency.
Several federal legislative proposals provide tax
incentives for various energy efficiency
expenditures, such as improvements to existing
33
Box 4.1. Electric Industry Restructuring
Federal and state initiatives dating back to the Energy Policy Act of 1992 (EPACT) have been transforming the
electric industry from a highly regulated system of local monopoly utilities providing the full range of electric
services (generation, transmission and distribution) to a system of competitive markets in which unregulated
companies compete to provide wholesale and retail electricity (with utilities continuing to provide transmission
and distribution service). Wholesale competition expanded considerably in 1996 when the Federal Energy
Regulatory Commission (FERC) promulgated Order 888, requiring all public utilities owning or controlling
interstate transmission facilities to offer non-discriminatory transmission service. Today, wholesale electricity is
an actively traded commodity, with 50% of all
electricity sales to ultimate customers supplied
from wholesale transactions.
In addition, since about 1995, there has been
significant activity in state legislatures and at
utility commissions to examine activities
designed to promote competition at the retail
level (i.e., to provide electricity consumers the
ability to choose their electricity supplier) that
would complement the wholesale competition
promoted by FERC. As of February 2002,
legislation or regulatory orders had been passed
in 16 states and the District of Columbia to
promote retail competition. However, after the
electricity supply problems in California in 2000,
California suspended retail competition and a
number of other states passed laws or issued
orders to delay implementing retail competition.
(Figure 4.1).
States with Legislation or
Regulations to Implement
Retail Competition
Retail Competition
Delayed or SuspendedNo Activity
Source: EIA, http://www.eia.doe.gov/cneaf/electricity/chg_str/regmap.html
Figure 4.1. Status of state electric restructuringactivity as of February 2002.

homes or commercial buildings, purchase of
efficient appliances, and the construction of efficient
new homes. There are also proposals to fund
additional research and development of efficient
technologies and require federal buildings and
equipment to meet certain efficiency standards. All
of these proposals seek to reduce electricity
consumption by supporting greater energy
efficiency, which also works to reduce emissions.
The potential of these efforts to make a difference is
large. The U.S. Department of Energy estimates that
increasing energy efficiency throughout the
economy could cut national energy use by 10% or
more in 2010 and about 20% in 2020, with net
economic benefits for consumers and businesses, as
well as reductions in a broad array of air pollutants.
Advanced GenerationTechnologies
Another important policy consideration is how to
stimulate development and commercial use of clean
and more efficient power plants. Currently, over
50% of the electricity generated in the U.S. comes
from coal-fired power plants, which produce about
90% of electric industry emissions. The other
primary energy sources are nuclear, natural gas,
water, oil and renewable resources. (Figure 4.2).
A number of generation technologies exist to
produce electricity with significantly less
environmental impact than the current power plant
fleet. Renewable energy sources--such as biomass,
geothermal heat, solar radiation and wind--account
for only about 2% of electricity generation in the
U.S. These resources can be used to generate
electricity without most of the clean air, climate and
other environmental concerns associated with the
coal, nuclear and hydroelectric plants that account
for the majority of generation today.13 Furthermore,
advanced fossil fuel technologies, such as combined
cycle natural gas and integrated coal gasification
combined cycle (IGCC) can produce electricity with
only a small fraction of the emissions of
traditional fossil generation (see Appendix B for
a description of these and other generation
technologies). Federal policy initiatives can play
an important role to promote cleaner generation
and establish commercial acceptance of new
technologies, which is vital for achieving
long-term energy solutions that minimize
environmental impacts while maintaining
economic electricity supplies.
One policy approach for promoting greater use
of renewable generation is the establishment of
Renewable Portfolio Standards (RPS). RPS
programs generally require electricity providers
to maintain a minimum renewable energy
content in the electricity they sell (other
programs require generators to have a minimum
amount of renewable capacity). Twelve states
already have these types of requirements,
including, Arizona, Connecticut, Maine,
Massachusetts, Nevada, New Jersey, New
Mexico, Pennsylvania, Texas and Wisconsin. In
addition, national RPS requirements have been
proposed by Senator Jeffords and others that call
for up to a 20% RPS by 2020.
34
Coal52%
Oil3%
NaturalGas16%
Nuclear20%
Hydro7%
Renewable 2%
3.8 billion MWh
Figure 4.2. 2000 U.S. electricity generation fuel mix.

There are also a number of tax incentive proposals to
stimulate development of various technologies. The
Energy Policy Act of 1992 (EPACT) established a
1.5 cent/kWh production tax credit for wind and
closed-loop biomass facilities through 1999, which
was subsequently extended through 2001. A number
of proposals would extend and expand this
production tax credit to be available for future years
and cover other renewable energy sources. There are
also tax incentive proposals for other technologies,
such as IGCC coal generation.
Energy policy initiatives that support commercial
use of cleaner generating technologies directly help
reduce emissions and can also help reduce the cost
of complying with emissions reduction
requirements, such as the multi-pollutant emission
reduction proposals discussed below.
Multi-pollutant Legislation
Between January 2000 and February 2002, 18 bills
were introduced in Congress proposing consistent,
nationwide power plant emissions reduction
programs (Figure 4.3). Most of the bills cover
several pollutants and seek to establish
industry-wide emissions caps that would be
implemented with flexible emissions trading
programs similar to the acid rain SO2 program. The
proposals would all require significant emissions
reductions beyond what is currently required and
would be implemented in the 2005—2008 time
frame.
These “multi-pollutant” proposals have gained
considerable support as competitively neutral
approaches for improving business certainty and
achieving substantial emissions reductions. As of
February 2002, over 140 Congressmen and Senators
across 29 states were endorsing multi-pollutant
proposals (Figure 4.4). In January 2002, a
Subcommittee of the Senate Environment and Public
Works Committee held hearings on a multi-pollutant
proposal from Senator Jeffords (S. 556), with further
discussion and debate expected. In addition, the
February 2002 Clear Skies Initiative proposed
by the Bush Administration, calling for roughly
a 70% reductions in power plant NOx, SO2 and
Hg emissions, is likely to stimulate further
consideration and debate.
The majority of environmental organizations
support multi-pollutant proposals as efficient
and cost effective approaches to address power
plant contributions to air quality and climate
concerns. In addition, a number of electric
generating companies have voiced support for
comprehensive emissions legislation,
recognizing the benefits of more predictable
regulations to facilitate business planning.
35
Sponsor Bill Pollutants
Allen (D-ME) H.R. 2667 Hg
Allen (D-ME) H.R. 2980 NOx, SO2, CO2, Hg
Boehlert (R-NY) H.R. 25 NOx, SO2, Hg
Jeffords (I-VT) S. 1369 NOx, SO2, CO2, Hg
Kucinich (D-OH) H.R. 2645 NOx, SO2, CO2, Hg
Leahy (D-VT) S. 1949 NOx, SO2, CO2, Hg
Leahy (D
Leahy (D
-
-
VT)
VT)
S. 673
S. 1875
Hg
Hg
Moynihan (D-NY) S. 172 NOx, SO2, Hg
Pallone (D-NJ) H.R. 2569 NOx, SO2, CO2, Hg
Sweeny (R-NY) H.R. 657 NOx, SO2, Hg
Waxman (D-CA) H.R. 2900 NOx, SO2, CO2, Hg
Allen (D
Allen (D
-
-
ME)
ME)
H.R. 1335
H.R. 2729
NOx, SO2, CO2, Hg
Hg
Jeffords (I-VT) S. 556 NOx, SO2, CO2, Hg
Schumer (D-NY) S. 588 NOx, SO2
Sweeny (R-NY) H.R. 25 NOx, SO2, Hg
Waxman (D-CA) HR 1256 NOx, SO2, CO2, Hg
107th Congress (2001-2002)
106th Congress (1999-2000)
(through February 2002)
Figure 4.3. Federal multi-pollutant power plantemissions reduction proposals.

One example of industry
support is the proposal by the
Clean Energy Group (CEG),
which is a coalition of nine
energy companies that
produce enough electricity to
supply more than 80 million
homes across the country. The
CEG proposal calls for a 50%
NOx and SO2 reduction
(beyond current
requirements), 65% hg
reduction and stabilization of
CO2 emission at 2000 levels
(with flexibility mechanisms)
by 2008. In addition, the
proposal calls for achieving a
60% SO2 reduction, 79-93%
hg reduction and stabilization
of CO2 emissions at 1990
levels (with flexibility
mechanisms) by 2012.
Business Certainty
With a number of multi-pollutant power plant
emissions reduction proposals under consideration in
Congress, and ongoing questions about where
domestic and international climate change policies
are headed, the electric industry faces considerable
uncertainty about the future path of emissions
regulation. This uncertainty makes short and
long-term business planning difficult because it
increases the risk associated with capital
expenditures. To the extent the uncertainty leads to
delayed, unnecessary, or uneconomic investments,
the result will be higher electricity prices. The longer
multi-pollutant and climate change policy debates go
on, the more likely it is that sub-optimal investments
will be made today that will cost consumers
tomorrow.
A prime example of uncertainty in the electric
industry is the uncertainty facing power plant
owners in the eastern U.S. as they invest in NOx
controls to comply with EPA’s regional NOx
emissions reduction program (the “NOx SIP
Call”— see discussion in Appendix A, Box
A-2). Affected companies have a variety of
options for how to reduce NOx emissions,
ranging from shutting down facilities, to fuel
switching or re-powering, to installing back-end
NOx control technologies such as selective
catalytic reduction (SCR). Most companies are
opting to install SCR and other back-end
controls, which is the most economic
compliance approach for significantly reducing
NOx emissions in isolation. However, if
additional SO2, mercury, and/or CO2 reductions
are required in the not too distant future,
investments in back-end NOx controls may turn
out to be less economic than an initial decision
to fuel switch, install multi-pollutant control
technologies, or invest in low or zero emissions
advanced technologies.
To reduce regulatory uncertainty, future
emissions reduction programs should provide
clear timetables and firm emissions reduction
36
House ofRepresentatives
Senate
Senate & House ofRepresentatives
Member supporting in:
As of February 2002
Figure 4.4. States with Congressmen currently sponsoring or co-sponsoredmulti-pollutant legislation.

targets. Most of the multi-pollutant proposals under
consideration provide clear reduction time lines that
would greatly enhance business certainty for the
industry. Clear regulatory requirements would also
benefit the development and commercialization of
advanced generation technologies by forcing
companies to explicitly consider environmental costs
in their investment decisions.
Competitive Markets
The electric industry would also benefit from greater
consistency in emissions control requirements.
Current regulations do not cover certain pollutants
(mercury and CO2), establish different standards
based on facility age (New Source Performance
Standards that do not apply to older plants), and
create different requirements for facilities located in
different geographic regions (such as non-attainment
vs. attainment areas and in different states and
regions). These inconsistencies create competitive
inequities and inefficiencies in wholesale electricity
markets.
Today, these markets are highly competitive, with
the buying and selling of wholesale power
accounting for 50% of all electricity sold to ultimate
customers (see Box 4.1), but the physical supply of
electricity remains determined by a process called
“economic dispatch.” Economic dispatch means that
power plants are selected to run by central dispatch
centers based on their costs. Under this system,
small economic advantages derived from less
stringent emissions control requirements can
increase the dispatch of certain facilities. Owners of
these facilities are at a competitive advantage and
can sell more energy in wholesale markets than plant
owners that have invested in cleaner technologies
and fuels. This result is environmentally harmful
since it increases generation at the dirtiest plants and
economically inefficient since neither power plant
operations, nor electricity prices reflect the true cost
of generation, which includes external air pollution
costs.14
These economic issues are one reason some in
the industry support consistent, nationwide
power plant emissions reduction programs. The
Clean Air Act acid rain SO2 reduction program
is frequently cited as an example of a successful
national program that has cost-effectively
reduced power plant emissions and is
compatible with the functioning of wholesale
energy markets. Under the acid rain program,
companies are allocated tradable emissions
allowances and must hold an emissions
allowance for each ton of SO2 they emit during
the year. In wholesale energy markets the cost of
SO2 allowances is included in the cost
calculations and bids that determine power plant
dispatch order, indicating that this cost has been
internalized by power plants and is reflected in
wholesale energy prices. Similar national
programs for other pollutants could help
improve the consistency and efficiency of
environmental regulations.
37

The U.S. has the second highest electricity
consumption per capita in the world (just behind
Canada), with an average consumption of about
12,500 kilowatt-hours per person, per year (about
equivalent to running 25, 60-watt light bulbs 24
hours a day for 1 year).15 Over 600 companies own
power plants that generate electricity to meet this
demand. Their power plants create environmental
impacts, including significant air emissions.
Transparent public information on these companies
operations and emissions is essential to promote
public understanding of environmental issues,
encourage corporate self-evaluation and
environmental stewardship, and facilitate informed
public policy decisions that consider the energy,
economic and environmental tradeoffs associated
with different policy approaches.
This report focused on the emissions performance of
the 100 largest electric generation owners in the U.S.
to illustrate and discuss important uses of public
environmental information. Major findings of the
report include:
• The U.S. electric industry remains a major
source of air pollution. Consistent and
coordinated national programs should be pursued
to improve energy efficiency and reduce power
plant emissions.
• The largest owners of electric generation account
for the vast majority of power plant emissions,
with fewer than 20 companies responsible for
over 50% of emissions in the industry.
• Significant emissions rate disparities continue to
exist in the electric industry, illustrating potential
inequities in existing regulations and the ability
of some companies to generate electricity with
substantially lower by-product air emissions
than others.
• Public information on electric industry
emissions serves important public and
private purposes that would benefit from
federal efforts to improve the accessability
and accuracy of reported data.
• Corporate self-evaluation of emissions
performance, which is facilitated by
transparent information, is prudent and
beneficial for improving business investment
decisions and corporate environmental
stewardship.
38
CONCLUSIONS

Emissions from fossil fuel power plants
contribute to local, regional, and global air
pollution problems that affect public health,
sensitive ecosystems, aesthetic quality, and
global climate. Seven primary concerns
include: acid deposition, climate change, fine
particulates, mercury deposition, nitrogen
deposition, ozone smog, and regional haze.
Many of these air pollution problems are
interrelated, and they are all linked to power
plant emissions. For example, power plant
NOx and SO2 emissions contribute to acid
deposition, fine particulates, and regional haze
concerns and power plant NOx emissions have
cascading effects—a single NOx molecule can
contribute to multiple concerns as it travels,
reacts, and settles in the environment. The
discussion below describes these seven
concerns and their links to power plant
emissions.
Acid Deposition
Acid deposition is the process by which acidic
compounds formed in the atmosphere are
delivered to the ground.16 When delivered by
precipitation (through rain, snow, sleet, and fog), the
process is called wet deposition, and when delivered
as gases (aerosols and particles), it is called dry
deposition. Acid deposition is comprised of sulfuric
acid (H2SO4), nitric acid (HNO3) and ammonium
(NH4) derived from SO2 and NOx emissions from
power plants and other sources, as well as from
ammonia (NH3) emissions. Recent data indicate that
power plant SO2 reductions under the acid rain
program resulted in almost a linear reduction in
sulfate deposition, while consistent levels of
NOx emissions have corresponded to very little
change in nitrate deposition.17 Most research
now indicates that significantly greater
reductions in NOx and SO2 emissions beyond
those from the acid rain program are needed to
address acid deposition impacts.
Acidity is expressed in terms of pH levels, and a
logarithmic scale is used to compare different
values. Lower levels indicate acidic conditions,
while higher levels indicate base conditions. A
39
APPENDIX A: ENVIRONMENTAL IMPACTS
Appendix A
Acidic
Lemon Juice Milk Lye1 2 3 4 5 6 7 8 9 10 11 12 13 14Acidic Neutral Basic
All fish die
Brook trout die Frogs crayfish die
Snails, rainbow trout die
Lemon Juice Milk Lye
pH
1999 pH levels in rainfall
Normal withouthuman influenceSource: National Atmospheric Deposition Program/National Trends Network
Figure A-1. pH scale and 1999 levels in rainfall.

normal pH level for most lakes and streams is
around 7, while normal for rainfall is above about
5.2. Some fish species begin to die at levels below
about 6, while no fish can survive pH levels below
about 3. In 1997 wet deposition in the Northeast
had an average pH of 4.4, which is about ten times
more acidic than background conditions (Figure
A-1).18
Acid deposition alters soils, stresses forest
vegetation, acidifies lakes and streams, and harms
fish and other aquatic life. Recent studies indicate
that acid deposition has had a greater
environmental impact than previously projected as
years of deposition have made many ecosystems
increasingly sensitive.19 The research is revealing
that acid deposition continues to alter soils by
depleting calcium and other base substances,
causing them to lose their ability to neutralize
inputs of acid and provide productive growing
conditions. Although reductions in acid deposition
corresponding to SO2 emissions reductions from
the acid rain program are evident, chemical and
biological recovery of soils, surface waters, trees
and fish has been minimal. Scientists estimate that
from the time acid deposition is substantially
eliminated it may take decades for chemical
recovery of soils and water and centuries for full
biological recovery of trees and fish.20
Climate Change
Carbon dioxide is a greenhouse gas that
contributes to global warming. Fossil-fuel power
plants in the U.S. emit 37 percent of the nation’s
CO2 emissions and power plant CO2 emissions
have been increasing faster than overall U.S.
emissions. Between 1990 and 2000, total U.S. CO2
emissions increased 15.5 percent, while electric
generator CO2 emissions increased over 26 percent
(Figure A-2).21
Today there is general agreement within the
scientific community that pollution in the
40Appendix A
10%
20%
30%
1991 1992 1993 1994 1995 1996 1997 1998 1999 2000
Electric Industry
U.S. Economy(including electricity)
15.5%
26.5%
Figure A-2. Percentage change in total CO2 emissionsfrom 1990.
1860 1880 1900 1920 1940 1960 1980 2000-0.8
-0.4
0.0
0.4
0.8
Red bars: year by year temperature variation
Thin black whisker bars: 95% confidence range
Black line: decade by decade curve
360
340
320
300
280
260
1200 1400 1600 18001000 2000
Year
Year
Curve illustrates data compiled from ice
core and firn data as well as direct
atmospheric samples from recent decades.
Source: IPCC 3rd Assessment.
CO
(ppm
)2
Global CO atmospheric concentrations2
Global surface temperatures(data from thermometers)
Dep
artu
rein
tem
pera
ture
from
1961
to19
90av
erag
e(de
gree
sC
)Figure A-3. IPCC data on atmospheric CO2
concentrations and global surface temperatures.

atmosphere with heat trapping gases is contributing
to climate change (Box A-1: Intergovernmental
Panel on Climate Change (IPCC) and its findings).
Specifically, global average surface temperature
readings indicate a clear pattern of global warming
during the 20th century, which correlates with the
build up of CO2 and other heat-trapping gases in the
atmosphere (Figure A-3). The warming trend is
much greater in rate and duration than any global
temperature changes that occurred over the past 9
centuries.22
Uncertainty remains about how much global
warming will impact future climate conditions, but
recent estimates reported by the IPCC indicate that
surface temperatures will increase 1.4 to 5.8 degrees
C (2.5 to 10.4 degrees F) between 1990 and 2100.23
These forecasted changes could have a wide range of
impacts on natural systems—such as glaciers, coral
reefs, tropical forests, alpine ecosystems, prairie
wetlands and other sensitive areas—as well as
human activities and society. Likely societal impacts
include reductions in crop yields in tropical,
sub-tropical and mid-latitudes, decreases in water
availability in water-scarce regions, increases in
property and personal loss due to coastal
flooding and severe weather (droughts, floods,
heat waves, wind storms, etc.), increases in
exposure to certain diseases, and increases in
heat stress mortality.24
In addition, there is the potential for large-scale
and potentially irreversible impacts on certain
Earth systems, such as ocean circulations and
polar icepack, and the possibility that initial
warming trends could lead to additional,
accelerated warming (due to carbon cycle
feedbacks in the biosphere, releases of terrestrial
carbon from permafrost regions, and methane
releases from coastal areas).25
Fine Particulates
Fine particulate matter (PM) is a general term
that describes small pollution particles in the
atmosphere. It includes compounds such as
sulfates, nitrates, elemental and organic carbon,
and dust. Existing data on the compounds that
make up fine PM is somewhat limited, but it
41
Box A-1. Intergovernmental Panel on Climate Change and its Findings.
The Intergovernmental Panel on Climate Change (IPCC) was established by the United Nations and World
Meteorological Organization in 1988 to provide unbiased assessments of climate change science. Since its
formation, the IPCC has issued three reports on the state of climate change science. In its most recent Third
Assessment, issued in 2001, IPCC documented substantial scientific evidence of global warming and concluded
definitively that “there is new and stronger evidence that most of the warming observed over the last 50 years is
attributable to human activities.”
Following release of the IPCC Third Assessment, the Bush Administration asked the National Academy of
Sciences (NAS) to review the document and its conclusions. In June 2001, the NAS issued a report
fundamentally in agreement with the IPCC assessment that stated unequivocally, “greenhouse gases are
accumulating in the Earth’s atmosphere as a result of human activities, causing surface temperatures to rise.”
Important scientific findings documenting the evidence of global warming in the IPCC Third Assessment
include:
• Global average surface temperature has increased by 0.6 degrees C (1.08 degrees F) since the late 19th century;
• It is very likely that the decade of the 1990s was the warmest of the millennium; and
• 1998 was the warmest year in the instrumental record since 1861.
Appendix A

indicates that ammonium sulfate and ammonium
nitrate, which are formed by SO2 and NOx
emissions from power plants and other sources,
account for 50% to 75% of fine PM in the eastern
U.S. (Figure A-4).26
Many scientific studies have shown a link between
fine particulate matter (alone, or combined with
other pollutants in the air) and a series of significant
health effects. Two major studies, the 1992 Harvard
Six-Cities Study and the 1995 American Cancer
Society (ACS) study found that fine PM increases
the risk of death. Although these results were
originally challenged, they were subsequently
reaffirmed in an independent evaluation by the
Health Effects Institute (HEI) (Figure A-5.).
Uncertainty remains about the specific cause of
increased risk and about which fine PM components
are causing observed health effects, but there is
general consensus that exposure to high levels of
fine PM creates serious health risks and that power
plant NOx and SO2 emissions contribute
significantly to elevated fine PM concentrations.
Mercury Deposition
Mercury is a toxic substance that exists in the
environment in three forms—as elemental
mercury, inorganic mercury, and organic
mercury (methylmercury). Elemental mercury is
the most volatile form and the dominant form
that is released into the air by the combustion of
materials containing mercury, such as coal and
oil. Coal-fired power plants are responsible for
42
1999 AnnualFine PM Mass
22
11
2.2
SulfatesNitratesOrganic CarbonElemental CarbonSoil
11.09
10.80
11.53
12.07
12.36
13.17
10.43
9.13
Figure A-4. 1999 fine PM species at select monitors inthe eastern U.S.
Appendix A
1993 Harvard Six-Cities Study
1993 study that tracked over 8,000
people over 17 years in six cities.
Found risk of death was 26% higher
in highly polluted areas.
Also found linear relationship
between risk and PM concentrations
1995 American Cancer Society Study•
•
Tracked over 500,000 adults in 151
different cities for more than 7 years.
•
•
Found 17% increase in mortality risk
in areas with high fine PM
•
•
Concluded that exposure to current
levels is shortening lives by several
years.
2000 HEI Re-analysis• Audit and replication of Harvard &
Cancer Society studies.
• Evaluated sensitivity of original
studies to other variables such as
other pollutants, climate and
socioeconomic factors.
• Confirmed the earlier findings and
found little influence from other
factors.
Figure A-5. Major Fine PM health effects studies

about 1/3 of stationary source mercury emissions in
the U.S.27
After it is emitted, some elemental mercury adheres
to dust or ash particles and deposits back to the
ground not far from its emissions source. However,
most elemental mercury is released in vapor form
and remains in the air until it reacts with ozone or
other oxidants to form inorganic mercury
compounds. In this form, mercury is highly soluble
and returns to the earth’s surface with rain and snow.
Once it enters lakes and streams, inorganic mercury
reacts with bacteria to form organic mercury, or
methylmercury, the form considered most toxic to
humans and animals (Figure A-6).28
Methylmercury makes its way through and
bioaccumulates in the food chain, beginning with
algae and microscopic animals, to forage fish,
and then predator fish such as salmon and trout.
Consumption of contaminated fish is the major
source of human mercury exposure. Mercury
exposure can result in a wide array of health
effects, including central nervous system effects,
damage to brain development, liver
degeneration, abnormal heart rhythms and
gastrointestinal problems. The greatest risks
from mercury exposure are to sensitive
populations, including pregnant women,
children and fetuses, subsistence fishermen and
Native Americans.29
43Appendix A
Fossil fuelcombustion &
waste incinerators
Elementalmercury vapor
Inorganicmercury
photochemicoxidation
vaporizes
Inorganicmercury
Inorganicmercury
Organicmercury
Organicmercury
Elementalmercury
Natural sources
settles
outDissolves
Bacteria
Sediment
fish tohumans
(methylmercury)
Based on an illustration by Lori Messengerreprinted in Clean Air Network, TurningUp the Heat on Dirty Power, March 1998.
Figure A-6. Mercury cycle in the environment.

Nitrogen Deposition
Nitrogen is a nutrient that is vital to plant growth.
However, too much nitrogen in soils or water can
alter ecosystems, causing harmful effects to plants
and wildlife. For example, excess nitrogen loading
in water bodies contributes to eutrophication
(oxygen depletion), which can result in algae
blooms, declines in the health of fish and shellfish,
loss of seagrass beds and coral reefs, and ecological
changes in food chains.30
Run-off of agricultural and lawn fertilizers and
atmospheric deposition caused by power plant and
other NOx emissions sources are the primary causes
of excess nitrogen loadings in sensitive water
bodies. Scientists estimate that from 10-45 percent
of nitrogen produced by various human activities
that reaches estuaries and coastal ecosystems is
transported and deposited via the atmosphere.31
For example, about 21 percent of the nitrogen in
the Chesapeake Bay comes from atmospheric
deposition.32
Ozone Smog
One of the most publicized, persistent and
documented air pollution problems in the U.S. is
ground level ozone, or ozone smog. Ozone
pollution is formed through a photochemical
reaction between volatile organic compounds
(VOCs) and NOx. Power plants currently emit
about 23% of NOx emissions in the U.S.
Particularly in the eastern U.S., power plant
emissions have been identified as a primary
contributor to the formation and transport of
44Appendix A
Box A-2. Regional Ozone Transport in the Eastern U.S.
Ozone formation and transport across the eastern U.S. has been the subject of considerable study over the past
decade. The most recent and thorough evaluation was the 2-year study by the 35-state Ozone Transport
Assessment Group (OTAG) that concluded in 1997. OTAG utilized state-of-the-art models, emissions
inventories, and air quality analysis to thoroughly characterize eastern ozone pollution. OTAG’s findings
documented the process of ozone transport, the role of regional NOx emissions in ozone formation, and the
critical contribution of power plant NOx emissions to the ozone problem. The OTAG analysis and findings
provided the basis for EPA to initiate its “NOx SIP Call” and “126 Petition” rulemakings to reduce ozone season
NOx emissions in the eastern U.S.
The NOx SIP Call, promulgated in 1998 under Section 110 of the Clean Air Act, required 19 states in the eastern
U.S. to revise their State Implementation Plans (SIPs) to achieve reductions sufficient to mitigate their
contribution to downwind ozone nonattainment. Under the NOx SIP Call, EPA promulgated state NOx
emissions budgets that, if implemented on schedule, will reduce power plant NOx emissions by about 1 million
tons per year, beginning in 2004.
In the second rulemaking, the “126 Petitions” rule, EPA granted petitions filed under Section 126 of the Clean
Air Act from four Northeast states. In granting the petitions, EPA found that NOx emissions from power plants
in 12 upwind states were significantly contributing to ozone nonattainment in the petitioning states. As a remedy,
EPA published a final rule in January 2000 granting the petitions and requiring power plant emission reductions
for the 12 states that would result in about 500,000 tons of NOx reduction per year.
Both the NOx SIP Call and 126 Petition rules were challenged and largely upheld in court, but they were
remanded back to EPA for clarification of technical issues relating to EPA’s calculation of emissions budgets.
for the affected states. As of this writing, EPA has not responded to the Court’s remand and it remains unclear if
the rules will be implemented as intended in 2004.

ozone pollution.33 To begin to address power plant
contributions to this problem, EPA promulgated two
separate rules to reduce summertime power plant
NOx emissions across the region. Although they
remain subject to legal challenge, the rules are due
to be implemented beginning in 2004 and reduce
summer power plant NOx emissions by about 60
percent across the eastern U.S. (see Box A-2.
Regional Ozone Transport in the Eastern U.S.).
Hundreds of published studies document health
affects from ozone pollution, which include
breathing and respiratory problems, asthma attacks,
loss of lung function, possible long-term lung
damage, and lowered immunity to disease. Children,
asthmatics, elderly, and other sensitive populations
are most susceptible to these health effects.34
Furthermore, a new 10-year study released January
2002 by the California Air Resources Board, found
that ozone not only exacerbates asthma, but that it
can cause asthma in children.35
Finally, many studies document that prolonged
ozone exposure can reduce crop and forest yields
and increase plant vulnerability to disease, pests, and
severe weather.
Regional Haze
Regional haze results from pollution particles and
gases in the atmosphere that impair visibility by
scattering and absorbing light. In the eastern U.S.,
there is a strong correlation between atmospheric
sulfate levels and visibility impairment, suggesting
that power plant SO2 emissions are a primary factor.
In the west, nitrates, carbon and dust particles have
the greatest impact on visibility, resulting in a
greater focus on NOx emissions from power plant
and other sources.36
Reduced visibility is a problem in both urban and
rural areas but is of most concern in national parks
and wilderness areas that are valued for their
aesthetic qualities. Without the effects of pollution, a
natural visual range is approximately 140 miles in
the West and 90 miles in the East. However,
over the last few decades, sulfates, nitrates and
other particles in the atmosphere have reduced
that range to 33-90 miles in the West and 14-24
miles in the East (Figure A-7).37
45Appendix A
Good Visibility
Poor Visibility
Very Poor Visibility
Source: Grand Canyon Visibility Transport Commission
Figure A-7. Visibility impairment in theGrand Canyon.

Many different technologies are available to
generate electricity using different energy sources.
Each of these technologies has different
environmental, economic and operational
characteristics. No single generation technology or
fuel is right for all applications, so determining what
technologies and fuels to use involves weighing a
number of tradeoffs. The discussion below provides
brief descriptions of major electric generating
technologies.
Coal
Pulverized Coal
Coal-fired power plants account for over 50% of
U.S. electricity generation. Virtually of these power
plants are pulverized coal boilers.
In pulverized coal boilers, coal is milled to a fine
powder in a pulverizer and then blown into a
combustion chamber of a boiler where it is
combusted. The hot gases and heat energy from the
combustion process convert water in tubes lining
the boiler into steam. This high-pressure steam
is passed into a steam turbine to produce
electricity.
Pulverized coal power plants are typically
30-35% efficient, meaning that for every unit of
energy (from coal) put into the plant, 30-35% of
that energy leaves the plant in the form of
electricity. The rest of the energy is used in the
generating process or released as heat from the
plant.
Pulverized coal power plants account for about
90% of electric industry emissions. Emissions
can be reduced from these plants by
technologies to alter the combustion process,
such as low-NOx burners that reduce NOx
formation during combustion, or by installing
pollution control devices that clean pollutants
from the flue gases before they exit the
smokestack (often referred to as “back-end
controls”), such as Selective Catalytic Reduction
(SCR) for NOx control, Flue Gas
Desulfurization (FGD) for SO2 control, and
Activated Carbon Injection for mercury control.
Fluidized-Bed Combustion (FBC)
Rather than burning coal as a blown-in powder,
fluidized bed combustion mixes pulverized coal
with limestone (or other sorbent) and suspends
the mixture on jets of air in a floating “bed” that
resembles a boiling fluid. FBC allows the coal to
burn more efficiently because it is in the
combustion chamber longer. Like pulverized
coal, fluidized-bed combustion is used to create
steam, which drives a steam turbine to generate
46
APPENDIX B: GENERATION TECHNOLOGIES
Pulverized coal power plant.
Appendix B

electricity. There are two types of fluidized-bed
systems, atmospheric fluidized-bed combustion
(AFBC), which operates at atmospheric pressure,
and pressurized fluidized-bed combustion (PFBC),
which operates within a pressurized vessel.
In fluidized-bed combustors, the combustion of the
coal in the presence of a limestone or other sorbent
facilitates the capture of SO2. In addition, the
turbulent action of the bubbling bed reduces the
temperature of the combustion process below the
threshold where large amounts of NOx form. As a
result, fluidized bed systems can reduce sulfur
dioxide by 90 to 95% and nitrogen oxides by 90% or
more versus uncontrolled pulverized coal plants.
Although initial FBC systems have efficiencies
similar to pulverized coal, further research and
development is expected to lead to FBC systems
with efficiencies around 50%.
Integrated Gasification Combined Cycle
(IGCC)
According to the DOE, coal gasification represents
the next generation of coal-based energy production.
Rather than burning coal directly, coal gasification
reacts coal with steam and a carefully controlled
mixture of air or oxygen under high temperatures
and pressures. The heat and pressure break apart the
chemical bonds in the coal, setting into motion
chemical reactions that form a gaseous mixture,
typically hydrogen and carbon monoxide. This hot
gas is used to power a gas turbine (in the same
manner as natural gas discussed below). Hot exhaust
from the gas turbine is then used to create steam that
is fed into a conventional steam turbine, producing a
second source of power. This dual, or “combined
cycle,” arrangement of turbines - a configuration not
possible with conventional coal combustion - offers
major improvements in power plant efficiencies over
traditional pulverized coal boilers.
In addition, pollutant-forming impurities and
greenhouse gases can be separated from the gaseous
stream before it is fed into the turbine. As much as
99% of sulfur and other pollutants can be removed
and processed into commercial products such as
chemicals and fertilizers. Uncreated solids can
be collected and marketed as a co-product such
as slag (used, for example, in road building).
Carbon containing gases also can be separated
and potentially sequestered back in the ground,
reducing or eliminating the plant’s release of
greenhouse gases. In addition, the primary
fuel-grade product is hydrogen, which can be
used to power fuel cells, which generate
electricity with no emissions (see discussion
below).
Gasification is used today in refineries, chemical
plants, and for power production. Two
utility-scale coal gasification power plants (the
Polk Power Station in Tampa, FL, and Wabash
River in Indiana) were built in the U.S. as part of
DOE’s clean power initiative. Current
gasification-based power plants are estimated to
cost about $1200 per kilowatt of capacity,
compared to conventional pulverized coal plants
at around $900 per kilowatt.
47
Tampa Electric Polk Power Station IGCCplant.
Appendix B

Natural Gas Turbines
According to DOE, of the next 1,000 power plants to
be built in the United States, as many as 900 of them
are likely to use natural gas turbines. Natural gas
turbines are essentially the same as jet engines on
airplanes modified to optimize electricity
production. Gas turbines produce electricity by
combusting fuel and air to produce
high-temperature, high-pressure gas that spins
specially designed turbine blades and drives an
electric generator.
In general, there are two types of natural gas turbine
systems used to generate electricity: simple cycle
and combined cycle. In simple cycle systems, only
the rotation of the gas turbine itself is used to
generate electricity. In combined cycle systems, hot
exhaust from the gas turbine creates steam that is fed
into a conventional steam turbine, producing a
second source of power. With the latest turbine
technologies, natural gas combined cycle power
plants can operate at around 50% efficiency, which
reduces emissions per electricity output.
Natural gas is generally a cleaner-burning fuel than
coal. As a result, even without potential efficiency
advantages, natural gas power plants tend to produce
fewer by-product emissions than coal-fired power
plants. Specifically, natural gas contains very little
sulfur or mercury, resulting in very low SO2 and
mercury emissions. It also contains about 40%
less carbon than coal, resulting in over 40%
lower CO2 emissions. Depending on the
combustion process, NOx emissions can also be
significantly lower with natural gas. In addition,
many of the same back-end control technologies
that can be used to reduce coal plant emissions
can be installed on natural gas systems to further
reduce emissions.
Nuclear Energy
Power plants that generate electricity from
nuclear energy are similar in many respects to
fossil fuel-fired steam electric plants, such as
pulverized coal plants. Just like fossil steam
plants, nuclear plants create high-pressure steam
that turns the blades of a turbine to generate
electricity. In a nuclear power plant, however,
splitting atoms of uranium in a reactor, rather
than combusting coal or other fuels in a boiler,
generates the heat to produce steam. Nuclear
power plants are fueled by uranium formed into
small ceramic pellets that are inserted into long,
vertical tubes within the reactor core. As
uranium atoms in these pellets are struck by
atomic particles, they split-or fission-to release
particles of their own and create heat that is used
to boil water to produce steam to generate
electricity.
48
General Electric gas turbine.
Nuclear power plant.
Appendix B

Nuclear energy, like virtually all generation sources,
poses environmental tradeoffs. Nothing is
combusted in nuclear reactors, so they do not
produce air pollution. However, the spent fuel and
other material from the reactor are radioactive and
therefore must be carefully handled and safely stored
for long periods of time to avoid environmental
harm.
Hydro-electric Power
Conventional hydroelectric plants use the flow of
water from a reservoir or river to generate
electricity. Many hydroelectric facilities are built as
part of dam projects. Hydroelectric dams hold water
in a reservoir or lake and the force of the water being
released from the reservoir spins the blades of a
turbine to produce electricity. Alternatively, some
hydroelectric plants use a small canal to channel
river water directly through a turbine. These plants,
called run-of-river projects, utilize the flow of water
within the natural range of the river, requiring little
disruption of the natural flow, but subjecting the
output of the plant to the flow of the river.
Another type of hydroelectric plant is
non-conventional pumped-storage. These plants use
two reservoirs, a lower reservoir and an upper
reservoir. During periods of low demand for
electricity, such as nights and weekends, water is
pumped from the lower to the upper reservoir.
During periods of high electricity demand, the
stored water is released from the upper reservoir
and flows through turbines to generate
electricity and then back into the lower
reservoir. Pumped storage power plants are
useful for storing energy and producing
electricity when it is needed most, but in sum
they use more electricity to pump water than
they produce.
Hydroelectric power produces no air emissions
and is a renewable energy source. However,
hydroelectric power raises environmental
concerns relating to the destruction of natural
habitats and systems (when a dam is built and
floods a river valley) and harmful impacts to fish
and aquatic species disrupted by dams and
generating facilities.
Fuel Cells
Fuel cells generate electricity by tapping the
chemical energy in hydrogen, using the same
basic electrochemical reaction found in batteries.
A fuel cell consists of two electrodes (through
which electric current passes) sandwiched
around an electrolyte (liquid which conducts
electricity). Oxygen passes over one electrode
and hydrogen over the other, generating
electricity, water and heat. A fuel cell system
that includes a “fuel reformer” can utilize the
hydrogen from any hydrocarbon fuel - from
natural gas to methanol, and even gasoline. The
reformer converts these more complex fuels into
the hydrogen and oxygen needed to run the fuel
cell. One of the biggest challenges in promoting
widespread commercial use of fuel cell
technologies is developing a means of supplying
(either directly or through the use of a reformer)
a consistent supply of hydrogen fuel.
49
U.S. Army Corps of Engineers 600 MW IceHarbor Hydroelectric Dam on the Snake River.
Appendix B

There are a number of fuel cell technologies that use
different materials, operate at different temperatures
and efficiencies, and have different advantages and
disadvantages for different applications. Although
the technology is still maturing, fuel cells are a
promising source for clean electricity production
because the only emission from fuel cells running on
hydrogen is water vapor.
Wind Energy
Wind turbines employ propeller like blades to catch
the wind’s energy and convert it into electricity.
Usually, two or three blades are mounted on a shaft
on top of a high tower. When the wind blows, a
pocket of low-pressure air forms on the downwind
side of the blade, causing the rotor to turn. The
rotation is used to produce electricity in an electric
generator.
Wind energy is one of the most cost-effective
renewable energy sources where adequate winds are
available. Large wind turbines perform best with
constant wind speeds of at least 15 MPH (“class 4"
and above wind conditions), which occur primarily
in parts of California, the upper Midwest, Texas,
Oklahoma, Northern New England and along the
Appalachian mountains. In these regions, wind
turbines can generate electricity at costs that are
competitive with fossil fuels and other
traditional technologies and do so with no air
pollution or fossil fuel consumption. However,
wind turbines have the drawback of only
generating electricity when adequate wind is
blowing, so they are not suitable to serve as a
stand-alone, base load power sources. In
addition, if not sited correctly, wind turbines can
cause harm to migratory birds and impact
aesthetic quality.
Solar Energy
There are two main types of technologies for
generating electricity with solar energy:
photovoltaic (PV) cells and concentrating solar
power systems.
Photovoltaic
Photovoltaic cells are solar cells made of
semi-conducting material. When sunlight is
absorbed by the semi-conducting materials, the
solar energy knocks electrons loose from their
atoms, allowing the electrons to flow through
the material to produce electricity. This process
of converting light (photons) to electricity
(voltage) is called the photovoltaic effect.
50
Wind turbine.
Ballard 250 KW fuel cell.
Appendix B

PV cells are typically combined into modules that
hold about 40 cells; about 10 of these modules are
mounted in PV arrays that can measure up to several
meters on a side. These flat-plate PV arrays can be
mounted at a fixed angle facing south, or they can be
mounted on a tracking device that follows the sun,
allowing them to capture the most sunlight over the
course of a day. About 10 to 20 PV arrays can
provide enough power for a household, but for large
electric utility or industrial applications, hundreds of
arrays must be interconnected.
The performance of a PV cell is measured in terms
of its efficiency at turning sunlight into electricity.
The first PV cells, built in the 1950s, had
efficiencies of less than 4%, but today commercial
PV cells have efficiencies of about 15% (about
one-sixth of the sunlight striking the cell generates
electricity). Low efficiencies mean that larger arrays
are needed, which results in higher cost. Continuing
to improve PV cell efficiencies is important for
improving their economics and making them more
competitive with traditional technologies. Currently,
it costs about 15-30 cents per kilowatt-hour to
produce electricity using PV technologies, compared
to 2-4 cents for traditional fossil generation.
Concentrating Solar Power
Rather than directly converting sunlight into
electricity, concentrating solar power systems
use the sun’s heat to produce steam that
generates electricity There are three main types
of concentrating solar power systems:
parabolic-trough , dish/engine , and power
tower.
Parabolic-trough systems concentrate the sun’s
energy through long rectangular, curved
(U-shaped) mirrors. The mirrors are tilted
toward the sun, focusing sunlight on a pipe that
runs down the center of the trough. This heats
oil flowing through the pipe. The hot oil is used
to boil water in a conventional steam generator
to produce electricity.
A dish/engine system uses a mirrored dish
(similar to a large satellite dish). The
dish-shaped surface collects and concentrates the
sun’s heat onto a receiver, which absorbs the
heat and transfers it to fluid within the engine.
51
Large PV array.
Concentrating dish/engine solar powersystem.
Appendix B

The heat causes the fluid to expand against a piston
or turbine to produce mechanical power. The
mechanical power is then used to run a generator or
alternator to produce electricity.
A power tower system uses a large field of mirrors
to concentrate sunlight onto the top of a tower,
where a receiver sits. The concentrated sunlight
heats molten salt flowing through the receiver. The
salt’s heat is used to generate electricity through a
conventional steam generator.
Biomass
Biomass includes any organic matter available on a
renewable basis, including agricultural food and feed
crops, agricultural crop wastes and residues,
dedicated energy crops and trees, wood wastes and
residues, aquatic plants, animal wastes, municipal
wastes, and other waste materials. There are several
different technologies used for converting biomass
into electricity, including direct combustion,
co-firing, landfill methane capture, gasification,
pyrolysis, and anaerobic digestion.
Direct Combustion
Direct combustion involves the burning of biomass
with excess air, producing hot flue gases that are
used to produce steam and generate electricity
similar to fossil-fired boilers. Direct combustion is
the simplest and most common method of capturing
the energy contained within biomass, but also results
in by-product emissions that raise similar concerns
as fossil fuel combustion.
Co-firing
Co-firing refers to the practice of introducing
biomass in high-efficiency coal fired boilers as a
supplementary energy source. Biomass substances
that are co-fired are usually low-cost feedstocks, like
wood or agricultural waste. Co-firing these
feedstocks can help reduce emissions from coal
combustion.
Gasification
Biomass gasification for power production is
similar to coal gasification and involves heating
biomass in an oxygen-starved environment to
produce a medium or low calorific gas. This
“biogas” is then used as fuel in a combined cycle
power generation plant that includes a gas
turbine and secondary steam turbine cycle.
Pyrolysis
Biomass pyrolysis refers to a process where
biomass is exposed to high temperatures in the
absence of air, causing the biomass to
decompose. The end product of pyrolysis is a
mixture of solids (char), liquids (oxygenated
oils), and gases (methane, carbon monoxide, and
carbon dioxide) that can be used to generate
electricity.
Landfill Methane
Landfill gas is created when waste in a landfill
decomposes. This gas, which is about 50 percent
methane and 45 percent carbon dioxide, can be
captured and used to generate electricity. Use of
landfill gas is a well-developed process with
several hundred landfill gas to energy projects in
operation in the U.S.
52
Biomass power plant in California.
Appendix B

Anaerobic Digestion
Anaerobic digestion is a process by which organic
matter is decomposed by bacteria in the absence of
oxygen to produce methane and other byproducts.
The primary energy product is a low to medium
calorific gas, normally consisting of 50 to 60 percent
methane that can be used to generate electricity.
Geothermal
Geothermal power plants generate electricity
without emissions using steam produced from
reservoirs of hot water found a couple of miles or
more below the Earth’s surface. In the United States,
most geothermal reservoirs are located in the
western states, Alaska, and Hawaii. Geothermal is a
proven clean energy source that can be used to
provide base load power (2,700 MW of geothermal
capacity exist in the U.S.), but its use is limited to
where the resource is available. There are three types
of geothermal power plants in use today: dry steam,
flash steam, and binary cycle.
Dry steam power plants draw from underground
resources of steam. The steam is piped directly from
underground wells to the power plant, where it is
directed into a turbine/generator unit. There are only
two known underground resources of steam in the
United States: The Geysers in northern California
and Old Faithful in Yellowstone National Park in
Wyoming. Since Yellowstone is protected from
development, the only dry steam plants in the
country are at The Geysers, which includes about
1,500 MW of geothermal capacity.
Flash steam geothermal power plants are the most
common. They use geothermal reservoirs with very
hot water. This hot water flows up through wells in
the ground under its own pressure. As it flows
upward, the pressure decreases and some of the hot
water boils into steam. The steam is then separated
from the water and used to power a
turbine/generator. Any leftover water and condensed
steam are injected back into the reservoir,
making this a sustainable resource.
Binary cycle power plants operate on water at
somewhat lower temperatures. These plants use
the heat from the hot water to boil a secondary
working fluid, usually an organic compound
with a low boiling point. This working fluid is
vaporized in a heat exchanger and used to turn a
turbine. The water is then injected back into the
ground to be reheated. The water and the
working fluid are kept separated during the
whole process, so there are little or no air
emissions.
53
Geysers geothermal power plant.
Appendix B

The data used to compile this report were derived
from public sources, including power plant
emissions data from EPA’s 2000 Emissions
Scorecard and EPA’s EGRID2000 database, power
plant generation data from the EIA 906 and 767
databases, and power plant ownership information
from EPA’s EGRID2000, SEC filings and corporate
web pages. The discussion below reviews the
methodology, discusses data outliers that were found
during quality assurance reviews, and indicates
where substitutions or modifications were made in
reported data. As a general matter, the approach was
to use data as reported, except where adjustments
were needed to make the reporting within a single
database internally consistent, or where one set of
reported data could be replaced by another set of
reported data. Based on quality assurance reviews
and these criteria, less than 2% of the data (based on
generation) was adjusted to improve data accuracy.
EPA 2000 Emissions Scorecard
Over 97% of the CO2, NOx and SO2 emissions data
used in this report were taken from EPA’s 2000
Emissions Scorecard. Emissions Scorecard data
were screened to identify emissions rate data outside
of expected ranges. Specifically, CO2 emissions rates
were screened to identify rates outside of a range
20% above or below EPA average emissions factors
for coal, oil, and natural gas combustion from the
Inventory of US Greenhouse Gas Emissions and
Sinks (207, 168, 117 lbs/mmBtu). The ranges are as
follows:
• For coal-fired plants, 166 - 248 lbs/mmBtu;
• For oil-fired plants, 134 - 202 lbs/mmBtu
• For natural gas-fired plants, 94 -140
lbs/mmBtu.
Eight plants were identified with CO2 emissions
rates outside of these ranges. The CO2 emissions
of these plants were adjusted by applying EPA’s
reported heat input times the emissions rates at
the 20% error range. For example, if the
reported emissions rate for a coal plant was 278
lbs/mmBtu, that rate was reduced to 248
lbs/mmBtu and the CO2 emissions for the plant
recalculated by multiplying 248 lbs/mmBtu by
the reported heat input and dividing by 2000
lbs/ton. Table C-1 illustrates the eight plants
where changes were made in reported Emissions
Scorecard CO2 emissions.
Emissions Scorecard data were also screened to
identify any plants with NOx emissions rates
above 1.4 lbs/mmBtu, or SO2 emissions rates
above 5.0 lbs/mmBtu. No plants included in this
report were found to have reported emissions
rates above these levels.
EGRID2000 Emissions Data
About three percent of the emissions data used
in this report were derived from EPA’s
EGRID2000 database, which provides emissions
data for many smaller plants that do not report
under the acid rain program and therefore are
not included in the Emissions Scorecard. The
EGRID2000 database provides 1998 lbs/MWh
emissions rates, which were multiplied by 2000
generation data to estimate 2000 emission.
Similar to the Emissions Scorecard, the EGRID
54
APPENDIX C: DATA QUALITY
Appendix C

2000 plant data were screened to identify emissions
rates outside of expected ranges. Five fossil plants
were found to have lb/mmBtu CO2 emissions rates
outside of the 20% ranges. The CO2 emissions rates
for these plants were adjusted to the 20% ranges and
new lb/MWh emissions rates calculated for use with
2000 generation data. Table C-2 illustrates these
facilities and the adjustments made.
In addition, 39 plants were found to have NOx
emissions rates above 1.4 lb/mmBtu. The NOx
emissions rates for these plants were adjusted to 1.4
lb/mmBtu and a new 1998 lb/MWh emissions rate
calculated for use with year 2000 generation data.
Table C-3 illustrates these data adjustments.
The EGRID2000 database was also screened for
heat rates above 20,000 btu/kWh or below 6,000
Btu/kWh. This screen revealed 38 plants with heat
rates above 20,000 Btu/kWh that were adjusted back
to a 20,000 btu/kWh heat rate. Similarly, 20 plants
were identified as having heat rates below 6,000
Btu/kWh that were adjusted back to 6,000 Btu/kWh
heat rate. Based on these heat rate revisions, new
lb/MWh emissions rates were calculated for these
plants and multiplied by 2000 generation data to
estimate 2000 emissions. Table C-4 illustrates plants
for which heat rate adjustments were made.
EIA 906 Generation Data
The EIA 906 databases were used to establish 2000
generation data and fuel types. The data were
screened to establish plants where heat rates
calculated using EIA 906 generation data and EPA
Emissions Scorecard heat input data were above
20,000 Btu/kWh or below 6,000 Btu/kWh. In these
cases, EIA 906 generation data were compared with
EIA 767 generation data to check for consistency. In
cases where the data were not consistent and the
calculated heat rates were more reasonable using
EIA 767 data, EIA 906 generation data was replaced
with EIA 767 generation data. Table C-5 illustrates
the 12 plants for which EIA 767 data were
substituted for EIA 906 data.
Changes in EPA Ownership
The report seeks to capture power plant
ownership as of December 31, 2000. Ownership
was established using EPA’s ownership
information from its EGRID2000 database (with
ownership as of December 31, 2000), which was
further updated with information from corporate
web pages, annual reports, and SEC 10K filings.
Table C-6 indicates where the ownership
information in this report differs from EPA’s
EGRID2000 ownership information. All other
plant ownership information is based on EPA’s
EGRID2000 data.
Incompatible EPA and EIAData
To establish lb/MWh emissions rates, EPA
reported emissions data is combined with EIA
reported generation data. In some cases, the data
reported by EPA do not appear compatible with
the data reported by EIA. Incompatibilities can
show up either as power plant heat rates that are
outside of expected ranges or lb/MWh emissions
rates outside of expected ranges. In most cases,
it is difficult to determine why the data is
incompatible and, if there is a reporting error,
whether it occurred in the EPA or EIA data. For
this reason, no changes were made to adjust for
incompatibilities in EPA and EIA data where the
data from each data source was internally
consistent, but appeared incompatible when
combined.
55Appendix C
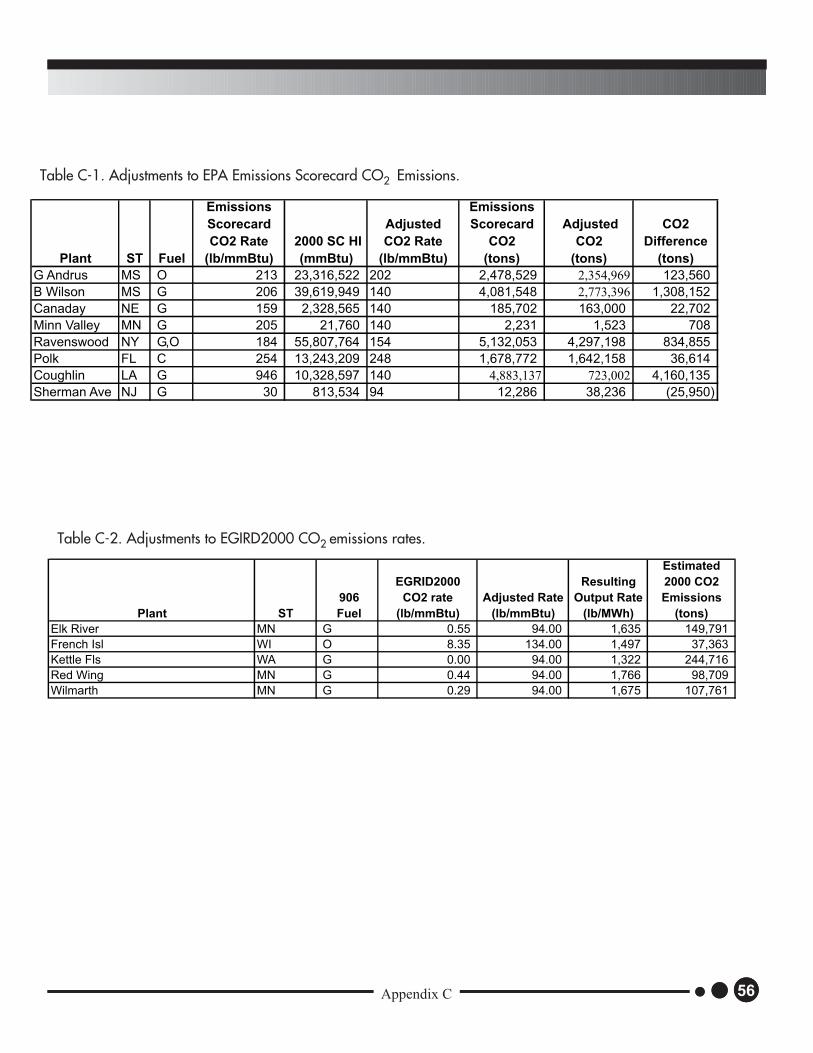
56Appendix C
Plant ST Fuel
Emissions
Scorecard
CO2 Rate
(lb/mmBtu)
2000 SC HI
(mmBtu)
Adjusted
CO2 Rate
(lb/mmBtu)
Emissions
Scorecard
CO2
(tons)
Adjusted
CO2
(tons)
CO2
Difference
(tons)
G Andrus MS O 213 23,316,522 202 2,478,529 2,354,969 123,560
B Wilson MS G 206 39,619,949 140 4,081,548 2,773,396 1,308,152
Canaday NE G 159 2,328,565 140 185,702 163,000 22,702
Minn Valley MN G 205 21,760 140 2,231 1,523 708
Ravenswood NY G,O 184 55,807,764 154 5,132,053 4,297,198 834,855
Polk FL C 254 13,243,209 248 1,678,772 1,642,158 36,614
Coughlin LA G 946 10,328,597 140 4,883,137 723,002 4,160,135
Sherman Ave NJ G 30 813,534 94 12,286 38,236 (25,950)
Table C-1. Adjustments to EPA Emissions Scorecard CO2 Emissions.
Plant ST
906
Fuel
EGRID2000
CO2 rate
(lb/mmBtu)
Adjusted Rate
(lb/mmBtu)
Resulting
Output Rate
(lb/MWh)
Estimated
2000 CO2
Emissions
(tons)
Elk River MN G 0.55 94.00 1,635 149,791
French Isl WI O 8.35 134.00 1,497 37,363
Kettle Fls WA G 0.00 94.00 1,322 244,716
Red Wing MN G 0.44 94.00 1,766 98,709
Wilmarth MN G 0.29 94.00 1,675 107,761
Table C-2. Adjustments to EGIRD2000 CO2 emissions rates.

57
Plant ST
EGRID2000
NOx Rate
(lb/mmBtu)
EGRID2000
1998 NOx
Emissions
(tons)
Adjusted NOx
Rate
(lb/mmBtu)
Resulting
Output Rate
(lb/MWh)*
Estimated
2000 NOx
Emissions
(tons)
Ames IA 4.34 3 1.40 19.97 1
Battle Mtn NV 4.35 4 1.40 8.40 4
Bayview V VA 4.32 207 1.40 15.19 109
Brunswick NV 4.35 6 1.40 8.40 2
Colfax MI 4.34 46 1.40 18.47 5
Cook HI 4.40 756 1.40 12.61 254
Crisfield MD 4.34 159 1.40 14.92 69
Crystal Mtn WA 4.63 6 1.40 23.30 3
David City NE 3.71 50 1.40 17.05 25
Dayton MI 4.34 39 1.40 18.75 4
E Hampton NY 1.57 161 1.40 18.50 166
Eagle River WI 4.31 13 1.40 15.90 1
Gabbs NV 4.35 3 1.40 8.40 2
Kings Beach CA 4.36 17 1.40 8.40 4
Lyons NE 4.39 2 1.40 15.18 2
Maalaea HI 2.42 8,253 1.40 12.40 5,033
Madison NE 3.05 18 1.40 18.41 10
Miami Wbash IN 4.40 115 1.40 28.00 37
Miki Basin HI 4.41 574 1.40 13.12 189
Montauk NY 4.36 69 1.40 15.99 24
Monument OH 4.38 74 1.40 14.85 3
Oliver MI 4.34 57 1.40 20.13 7
Oneida Casi WI 4.31 8 1.40 13.76 1
Ord NE 3.92 58 1.40 15.38 21
Parr SC 7.07 68 1.40 8.40 40
Pebbly Bech CA 4.36 702 1.40 16.08 241
Placid MI 4.34 53 1.40 17.30 3
Portola CA 4.36 5 1.40 8.40 1
Putnam MI 4.34 51 1.40 18.18 6
Reno Val Rd NV 4.35 7 1.40 8.40 2
Rocky Ford CO 4.36 21 1.40 27.61 94
S Phillips FL 4.01 1,325 1.40 13.54 534
Salmon D ID 4.36 7 1.40 17.17 24
Sidney OH 4.38 78 1.40 14.75 3
Slocum MI 4.34 54 1.40 17.31 4
Sutherland NE 4.39 13 1.40 15.02 6
Tucumcari NM 4.44 12 1.40 28.00 1
Vernon TX 4.36 10 1.40 19.28 0
Wilmot MI 4.34 51 1.40 17.29 6
Table C-3. Adjustments to EPA EGRID2000 NOx emissions rates.
Appendix C

58
Plant ST
EGRID2000
Heat Rate
Revised
Heat Rate
Estimated
2000 NOx
Prior to Heat
Rate Change
(tons)
Estimated
2000 SO2 Prior
to Heat Rate
Change
(tons)
Estimated
2000 CO2 Prior
to Heat Rate
Change
(tons)
Estimated
2000 NOx
with Heat
Rate
Change
(tons)
Estimated
2000 SO2
with Heat
Rate Change
(tons)
Estimated
2000 CO2
with Heat
Rate
Change
(tons)
NOx
Change
(tons)
SO2
Change
(tons)
CO2
Change
(tons)
Abilene KS 24,481 20,000 20 0 7,028 16 0 5,741 (4) (0) (1,286)
Alamosa CO 25,799 20,000 32 4 8,710 25 3 6,752 (7) (1) (1,958)
Beaumont Refinery TX 30,184 20,000 246 15 2,636,107 163 10 1,746,678 (83) (5) (889,430)
Blue Lake MN 22,228 20,000 57 17 10,281 51 15 9,250 (6) (2) (1,030)
Brunot Ilnd PA 53,642 20,000 294 42 52,768 110 16 19,674 (184) (26) (33,094)
Buras LA 21,662 20,000 6 0 2,382 6 0 2,199 (0) (0) (183)
Burton SC 20,496 20,000 5 0 1,571 4 0 1,533 (0) (0) (38)
Calumet IL 22,561 20,000 154 2 55,752 137 1 49,423 (17) (0) (6,329)
Carll Cornr NJ 30,939 20,000 122 20 22,047 79 13 14,252 (43) (7) (7,795)
Centerville IA 22,202 20,000 9 0 1,241 8 0 1,118 (1) (0) (123)
Cogentrix Hopewell VA 39,234 20,000 4660 7,345 1,404,992 2,376 3,744 716,210 (2,285) (3,601) (688,781)
Delaware Cy DE 29,592 20,000 11 2 1,944 7 2 1,314 (3) (1) (630)
Dicks Creek OH 22,575 20,000 17 0 6,193 15 0 5,486 (2) (0) (706)
Douglas AZ 24,282 20,000 39 6 7,118 32 5 5,862 (7) (1) (1,255)
Enid OK 21,528 20,000 15 0 5,554 14 0 5,160 (1) (0) (394)
Faber Place SC 21,111 20,000 1 0 182 0 0 173 (0) (0) (10)
Fishbach PA 36,320 20,000 9 1 1,592 5 1 876 (4) (1) (715)
Franklin LA 27,800 20,000 1 0 278 1 0 200 (0) (0) (78)
Ft Stockton TX 45,289 20,000 0.1 0 47 0 0 21 (0) (0) (26)
International Paper Augusta Mill GA 54,071 20,000 604 4,031 204,002 604 1,491 75,457 - (2,540) (128,546)
Kirksville MO 20,444 20,000 2 0 653 2 0 639 (0) (0) (14)
Lost Nation NH 24,317 20,000 6 2 1,124 5 2 924 (1) (0) (200)
Mad River OH 24,723 20,000 34 6 6,102 27 5 4,936 (6) (1) (1,166)
Miami Wbash IN 32,499 20,000 189 2 6,859 37 2 4,221 (152) (1) (2,638)
Morehead NC 21,970 20,000 5 1 924 5 1 841 (0) (0) (83)
Pueblo New CO 72,556 20,000 1,161 11 198,920 320 3 54,832 (841) (8) (144,088)
R Madison DE 32,115 20,000 0 0 49 0 0 30 (0) (0) (18)
Richland OH 28,824 20,000 9 1 2,787 7 1 1,934 (3) (0) (853)
Sabrooke IL 23,292 20,000 130 11 23,521 111 9 20,196 (18) (2) (3,325)
Stallings IL 20,331 20,000 13 0 4,879 13 0 4,800 (0) (0) (79)
Stryker OH 31,010 20,000 8 2 1,446 5 1 932 (3) (1) (513)
Superior MI 23,165 20,000 11 4 1,964 9 3 1,696 (1) (1) (268)
Texarkana Mill TX 36,488 20,000 37 4 3,113 6 1 512 (31) (3) (2,601)
Tolna PA 20,294 20,000 18 3 3,206 17 3 3,160 (0) (0) (46)
Tucumcari NM 22,655 20,000 5 0 190 1 0 168 (4) (0) (22)
Viaduct MO 25,801 20,000 4 0 1,394 3 0 1,080 (1) (0) (313)
Vicksburg Mill MS 51,517 20,000 110 2 49,274 43 1 173,468 (67) (1) 124,194
Zorn KY 20,925 20,000 3 0 941 2 0 900 (0) (0) (42)
Aes Placerita Inc CA 8 6,000 0 0 147 29 0 113,989 29 0 113,842
Androscoggin Mill ME 5,344 6,000 27 216 1,691 31 243 1,899 3 27 208
Battle Mtn NV (9,550) 6,000 (19) (0) (705) 4 0 443 23 1 1,148
Blewett NC 18 6,000 1 0 144 21 5 3,816 20 5 3,672
Brunswick NV (18,869) 6,000 (21) (0) (782) 2 0 249 23 1 1,030
Eagle Point Cogeneration NJ 5,226 6,000 348 0 518,759 400 0 595,638 52 0 76,878
Gabbs NV (23,258) 6,000 (22) (0) (815) 2 0 210 24 1 1,025
Georgetown Mill SC 4,223 6,000 65 38 3,966 92 54 5,634 27 16 1,668
International Paper Riegelwood Mill NC 3,995 6,000 148 285 88,044 222 428 204,127 74 143 116,082
Ipc Pine Bluff Mill AR 4,455 6,000 108 0 127,061 145 0 171,136 37 0 44,075
Kings Beach CA (39,517) 6,000 (73) (1) (2,678) 4 0 407 77 1 3,085
Las Vegas NM (4,832,352) 6,000 (8,644) (9,269) (1,534,521) 11 12 1,905 8,655 9,280 1,536,427
Louisiana Mill LA 3,416 6,000 83 43 10,291 145 76 18,076 63 33 7,785
March Point Cogeneration Co WA 3,192 6,000 17 0 213,523 31 0 401,376 15 0 187,853
Midland Cogeneration Venture MI 857 6,000 248 0 417,615 1,739 2 2,923,086 1,491 1 2,505,472
Mobile Mill AL 1,490 6,000 23 57 1,018 94 231 4,100 71 174 3,082
Parr SC 840 6,000 28 1 632 40 8 4,513 12 7 3,881
Portola CA (30,137) 6,000 (19) (0) (700) 1 0 139 20 0 839
Reno Val Rd NV (15,660) 6,000 (20) (0) (744) 2 0 285 23 1 1,029
S Meadow CT 542 6,000 105 35 19,102 1,167 389 211,346 1,062 354 192,243
Table C-4. Adjustments to EGRID2000 Heat Rates.
Appendix C

59
Plant ST Fuel
Emissions
Scorecard Heat
Input
(lb/mmBtu)
906
Generation
Data
(MWh)
2000 767
Total MWH
Generaion
Data
difference
Calculated Heat
Rate with 906
Generation Data
(Bt/kWh)
Calculated Heat
Rate with 767
Generation Data
(Btu/kWh)
Armstrong PA C 23,493,485 964,272 2,375,119 1,410,847 24,364 9,891
B L England NJ C 18,880,014 1,256,331 1,590,820 334,489 15,028 11,868
Clark NV G 7,843,589 3,691,787 697,433 (2,994,354) 2,125 11,246
Collins IL G 29,858,553 1,882,217 2,050,373 168,156 15,864 14,562
Coughlin LA G 10,328,597 - 361,459 361,459 - 28,575
Hatfield PA C 98,188,899 14,001,880 9,800,118 (4,201,762) 7,013 10,019
High Bridge MN C 18,715,315 1,199,398 1,315,037 115,639 15,604 14,232
Hmp&L Station Two KY C 25,652,264 1,579,560 2,194,827 615,267 16,240 11,688
La Station LA G 37,075,394 49,352 2,330,205 2,280,853 751,244 15,911
Mitchell PA C 18,897,355 2,392,252 1,746,373 (645,879) 7,899 10,821
R E Ritchie AR G 23,460,537 966,225 2,004,910 1,038,685 24,281 11,702
T H Wharton TX G 6,853,749 4,024,769 593,524 (3,431,245) 1,703 11,548
Warrick IN C 60,039,947 868,445 5,236,076 4,367,631 69,135 11,467
Cecil Lynch AR G 1,832,211 - 75,496 75,496 - 24,269
M L Hibbard MN C 2,972,009 - 45,585 45,585 - 65,197
Ham Moses AR G 1,220,157 - 79,258 79,258 - 15,395
Table C-5. EIA 767 Generation Data Substituted for EIA 906 Generation Data.
Appendix C

60
Plant Name EPA Owner
EPA
Owner % Revised Owner
Revised
Owner %
Arlington Valley Energy Duke Energy Maricopa Llc 100.00% Duke Energy Corporation 100.00%
ARTHUR KILL NRG Energy 100.00% Xcel Energy 100.00%
ASTORIA GAS NRG Energy 100.00% Xcel Energy 100.00%
Audrain Generating Station Duke Energy Audrain 100.00% Duke Energy Corporation 100.00%
Bell Energy Facility Duke Energy Bell Lp 100.00% Duke Energy Corporation 100.00%
BIG CAJUN 1 NRG Energy 100.00% Xcel Energy 100.00%
Big Cajun 2 NRG Energy 81.70% Xcel Energy 86.00%
Big Cajun 2 Entergy 4.30% Entergy 14.00%
Bollinger Generating Station Duke Energy Bollinger Llc 100.00% Duke Energy Corporation 100.00%
BRANFORD NRG Energy 100.00% Xcel Energy 100.00%
BRIDGEWATER POWER COMPANY LP Bridgewater Power Co LP 100.00% PSEG 40.00%
BRIDGEWATER POWER COMPANY LP Bridgewater Power Co LP 100.00% Bridgewater Power Co LP 60.00%
BROOKLYN NAVY YARD COGEN PARTN L P Brklyn Navy Yrd Cogn Prtns L P 100.00% Edison International 50.00%
C R HUNTLEY NRG Energy 100.00% Xcel Energy 100.00%
CADILLAC RENEWABLE ENERGY Cadillac Renewable Energy Llc 100.00% Xcel Energy 100.00%
Cecil Lynch Arkansas Power & Light Co 100.00% Entergy Corporation 100.00%
Clifty Creek Indiana-Kentucky Electric Corp 100.00% Allegheny Energy 12.50%
Clifty Creek Indiana-Kentucky Electric Corp 100.00% American Electric Power 44.20%
Clifty Creek Indiana-Kentucky Electric Corp 100.00% Cinergy 9.00%
Clifty Creek Indiana-Kentucky Electric Corp 100.00% DPL 4.90%
Clifty Creek Indiana-Kentucky Electric Corp 100.00% PowerGen 7.40%
Clifty Creek Indiana-Kentucky Electric Corp 100.00% FirstEnergy 20.50%
Clifty Creek Indiana-Kentucky Electric Corp 100.00% Vectren 1.50%
Clinton Amergen 100.00% Excelon Corporation 50.00%
Clinton Amergen 100.00% British Energy 50.00%
COALINGA COGENERATION COMPANY Coalinga Cogeneration Co 100.00% Edison International 50.00%
COGENTRIX HOPEWELL James River Cogeneration Co 100.00% Edison International 50.00%
COLSTRIP PPL Corp 36.30% PPL Corp 25.26%
COMMONWEALTH ATLANTIC LTD PARTN Commonwealth Atlantic L P 100.00% Edison International 50.00%
CONEMAUGH HYDROELECTRIC PLANT Pennsylvania Renewable Resour 100.00% PSEG 50.00%
CONEMAUGH HYDROELECTRIC PLANT Pennsylvania Renewable Resour 100.00% Pennsylvania Renewable Resour 50.00%
Cook Energy Facility Duke Energy Cook Llc 100.00% Duke Energy Corporation 100.00%
COS COB NRG Energy 100.00% Xcel Energy 100.00%
Crockett Cogeneration Project Crockett Cogeneration Lp 100.00% Xcel Energy 57.67%
Crystal River Progress Energy 97.80% Progress Energy 91.78%
D B WILSON STATION Louisiana Pacific 100.00% PowerGen 100.00%
Desoto Generating Station Duke Energy Desoto Llc 100.00% Duke Energy Corporation 100.00%
DEVON NRG Energy 100.00% Xcel Energy 100.00%
DIVISION NRG Energy 50.00% Xcel Energy 50.00%
Duke Energy Attala Llc Duke Energy Attala Llc 100.00% Duke Energy Corporation 100.00%
Duke Energy Hinds Llc Duke Energy Hinds Llc 100.00% Duke Energy Corporation 100.00%
Duke Energy Murray Llc Duke Energy North America Llc 100.00% Duke Energy Corporation 100.00%
Duke Energy Southaven Llc Duke Energy Southern Llc 100.00% Duke Energy Corporation 100.00%
Duke Energy Washoe Facility Duke Energy Washoe Llc 100.00% Duke Energy Corporation 100.00%
DUNKIRK NRG Energy 100.00% Xcel Energy 100.00%
EAGLE POINT COGENERATION Coastal Technology Inc 100.00% PSEG 50.00%
EAGLE POINT COGENERATION Coastal Technology Inc 100.00% Eagle Point Cogen Partnership 50.00%
EL CAJON NRG Energy 50.00% Xcel Energy 50.00%
EL SEGUNDO POWER NRG Energy 50.00% Xcel Energy 50.00%
Elwood Energy Llc Dominion Energy 100.00% Dominion Resources, Inc 50.00%
ENCINA NRG Energy 50.00% Xcel Energy 50.00%
Enterprise Energy Facility Duke Energy Enterprise Llc 100.00% Duke Energy Corporation 100.00%
FRANKLIN DRIVE NRG Energy 100.00% Xcel Energy 100.00%
GORDONSVILLE ENERGY L P Gordonsville Energy LP 100.00% Edison International 50.00%
GRANT TOWN POWER PLANT Amer Bituminous Power Ptnr L P 100.00% Edison International 50.00%
GREEN STATION Louisiana Pacific 100.00% PowerGen 100.00%
Guadalupe Generating Station Guadalupe Power Partners Lp 100.00% PSEG 50.00%
Guadalupe Generating Station Guadalupe Power Partners Lp 100.00% Guadalupe Power Partners Lp 50.00%
Ham Moses Arkansas Power & Light Co 100.00% Entergy Corporation 100.00%
HANFORD Hanford Ltd Partnership 100.00% PSEG 50.00%
HANFORD Hanford Ltd Partnership 100.00% Hanford Ltd Partnership 50.00%
HARBOR COGENERATION COMPANY Black Hills Capital 100.00% Edison International 30.00%
HERMISTON GENERATING PLANT U S Operating Services Co 100.00% ScottishPower PLC 50.00%
HMP&L STATION TWO Louisiana Pacific 100.00% PowerGen 100.00%
HOPEWELL COGENERATION Hopewell Cogeneration Inc 100.00% Edison International 25.00%
HYDRO KENNEBEC PROJECT UAH-Hydro Kennebec Ltd Partner 100.00% PSEG 16.00%
HYDRO KENNEBEC PROJECT UAH-Hydro Kennebec Ltd Partner 100.00% UAH-Hydro Kennebec Ltd Partner 84.00%
Jack Energy Facility Duke Energy Jack Lp 100.00% Duke Energy Corporation 100.00%
KALAEOLA COGENERATION PLANT Kalaeloa Partners LP 100.00% PSEG 50.00%
KALAEOLA COGENERATION PLANT Kalaeloa Partners LP 100.00% Kalaeloa Partners LP 50.00%
Table C-6. Changes to EPA EGRID2000 Ownership Information.
Appendix C

61
Plant Name EPA Owner
EPA
Owner % Revised Owner
Revised
Owner %
KEARNY NRG Energy 50.00% Xcel Energy 50.00%
KENNETH C COLEMAN STATION Louisiana Pacific 100.00% PowerGen 100.00%
KERN RIVER COGENERATION COMPANY Kern River Cogeneration Co 100.00% Edison International 50.00%
Kyger Creek Ohio Valley Electric Corp 100.00% Allegheny Energy 12.50%
Kyger Creek Ohio Valley Electric Corp 100.00% American Electric Power 44.20%
Kyger Creek Ohio Valley Electric Corp 100.00% Cinergy 9.00%
Kyger Creek Ohio Valley Electric Corp 100.00% DPL 4.90%
Kyger Creek Ohio Valley Electric Corp 100.00% PowerGen 7.40%
Kyger Creek Ohio Valley Electric Corp 100.00% FirstEnergy 20.50%
Kyger Creek Ohio Valley Electric Corp 100.00% Vectren 1.50%
Lee County Generating Station Duke Energy Lee County Llc 100.00% Duke Energy Corporation 100.00%
LONG BEACH GENERATION LLC NRG Energy 50.00% Xcel Energy 50.00%
Luna Energy Facility Duke Energy Luna Llc 100.00% Duke Energy Corporation 100.00%
Mabelvale Arkansas Power & Light Co 100.00% Entergy Corporation 100.00%
Madison Generating Station Duke Energy Madison Llc 100.00% Duke Energy Corporation 100.00%
MARCH POINT COGENERATION March Point Cogeneration Co 100.00% Edison International 50.00%
Metcalfe Generating Station Duke Energy Metcalfe Llc 100.00% Duke Energy Corporation 100.00%
MIDDLETOWN NRG Energy 100.00% Xcel Energy 100.00%
MIDWAY SUNSET COGENERATION Midway-Sunset Cogeneration Co 100.00% Edison International 50.00%
MIRAMAR NRG Energy 50.00% Xcel Energy 50.00%
Mission Duke Power Company 100.00% Duke Energy Corporation 100.00%
Moapa Energy Facility Duke Energy Moapa Llc 100.00% Duke Energy Corporation 100.00%
MONTVILLE NRG Energy 100.00% Xcel Energy 100.00%
MORGANTOWN ENERGY FACILITY Dominion Energy 100.00% Dominion Resources, Inc 50.00%
Mustang Station Denver City Energy Assoc Lp 100.00% Xcel Energy 25.00%
NAVAL STATION NRG Energy 50.00% Xcel Energy 50.00%
NAVAL TRAINING CTR NRG Energy 50.00% Xcel Energy 50.00%
NEVADA SUN PEAK PROJECT Nevada Sun-Peak Ltd Partners 100.00% Edison International 50.00%
No Branch Virginia Electric 100.00% Dominion Resources, Inc 100.00%
NORTH ISLAND NRG Energy 50.00% Xcel Energy 50.00%
NORWALK HARBOR NRG Energy 100.00% Xcel Energy 100.00%
NRG GENERATING NEWARK COGEN NRG Energy 100.00% Xcel Energy 100.00%
NRG GENERATING PARLIN COGEN NRG Energy 100.00% Xcel Energy 100.00%
OSWEGO NRG Energy 89.64% Xcel Energy 89.64%
Oyster Creek Amergen 100.00% Excelon Corporation 50.00%
Oyster Creek Amergen 100.00% British Energy 50.00%
Peach Bottom Exelon 42.50% Exelon 46.25%
Peach Bottom PSEG 42.50% PSEG 46.25%
Peach Bottom Conectiv 15.02% Conective 7.51%
REID STATION Louisiana Pacific 100.00% PowerGen 100.00%
Remington Combustion Turbine Dominion Energy 100.00% Dominion Resources, Inc 100.00%
Rocky Road Power Llc Rocky Road Power Llc 100.00% Xcel Energy 50.00%
RUMFORD COGENERATION COMPANY Mead Corp 100.00% Dominion Resources, Inc 10.20%
Ruston Generating Facility Duke Energy Ruston Llc 100.00% Duke Energy Corporation 100.00%
SAGUARO POWER COMPANY Saguaro Power Co 100.00% Edison International 50.00%
Salem PSEG 42.59% PSEG 50.00%
Salem Conectiv 14.82% PSEG 7.41%
SALINAS RIVER COGENERATION Salinas River Cogeneration Co 100.00% Edison International 50.00%
SARGENT CANYON COGENERATION Sargent Canyon Cogeneration Co 100.00% Edison International 50.00%
SEI BIRCHWOOD POWER FACILITY Birchwood Power Partners L P 100.00% Mirant 50.00%
SEI BIRCHWOOD POWER FACILITY Birchwood Power Partners L P 100.00% Cogentrix 50.00%
Sei Texas Bosque County Peaking Plant Sei Texas Lp 100.00% Mirant 100.00%
Sei Wisconsin Neenah Plant Sei Wisconsin Llc 100.00% Mirant 100.00%
SOMERSET NRG Energy 100.00% Xcel Energy 100.00%
SUSQUEHANNA NUCLEAR PPL Corp 100.00% PPL Corp 90.00%
SUSQUEHANNA NUCLEAR PPL Corp 100.00% Allegheny Electric Coop Inc 10.00%
SYCAMORE COGENERATION COMPANY Sycamore Cogeneration Co 100.00% Edison International 50.00%
Three Mile Island Nuclear Amergen 100.00% Excelon Corporation 50.00%
Three Mile Island Nuclear Amergen 100.00% British Energy 50.00%
TORRINGTON NRG Energy 100.00% Xcel Energy 100.00%
TRACY BIOMASS PLANT Thermal Energy Dev Partner LP 100.00% PSEG 35.00%
TRACY BIOMASS PLANT Thermal Energy Dev Partner LP 100.00% Thermal Energy Dev Partner LP 65.00%
Vermillion Generating Station Duke Energy Vermillion Llc 100.00% Duke Energy Corporation 100.00%
Washington Energy Facility Duke Energy Washington Llc 100.00% Duke Energy Corporation 100.00%
WATSON COGENERATION COMPANY BP Amoco 100.00% Edison International 49.00%
WICHITA FALLS ENERGY COMPANY LIMITED Wichita Falls Energy Co Ltd 100.00% Mirant 100.00%
Table C-6. Changes to EPA EGRID2000 Ownership Information (cont.).
Appendix C

1. The 100 largest companies are determined based
on year 2000 generation.
2. The previous reports are: Benchmarking Air
Emissions of Electric Utility Generators in the
United States, June 1998; Benchmarking Air
Emissions of Electric Utility Generators in the
Eastern United States, April 1997.
3. For information about the acid rain program,
including emissions monitoring and reporting
requirements see: http://www.epa.gov/airmarkets/.
4. See: http://www.epa.gov/mercury/.
5. EIA, Inventory of Electric Utility Power Plants in
the United States 1999, September 2000; EIA,
Inventory of Nonutility Electric Power Plants in the
United States 1999, November 2000.
6. EIA, Form EIA-906 Database, 2000.
7. See Clean Air Act 42 U.S.C. 7651; and
http://www.epa.gov/ttn/atw/eparules.html.
8. For a discussion of EIA policies on confidentiality
of electricity data see:
http://www.eia.doe.gov/cneaf/electricity/forms/ssele
cpower98.html.
9. Id.
10. Based on research by the American Council for
an Energy Efficient Economy, available at:
http://www.aceee.org/.
11. EIA, Electric Utility Demand Side Management
2000, available at:
http://www.eia.doe.gov/cneaf/electricity/dsm00/dsm
_sum.html
12. See California Energy Commission, The
Energy Efficiency Public Goods Charge Report,
December 1999, at 12 (savings estimates cover
1975-1998).
13. Air pollution is a primary concern associated
with traditional coal-fired plants. However, coal
generation also raises concerns associated with
water use (for cooling), solid waste, and the
impacts of coal mining. Similarly, although
neither hydroelectric generation nor nuclear
generation produce air emissions, they raise
other environmental concerns, including habitat
destruction (hydroelectric dams), harmful
impacts to fish and aquatic species and, in the
case of nuclear, the creation of radioactive waste
that must be carefully handled and stored (See
Appendix B for more information on these
generation sources).
14. For a discussion of environmental
externalities see: EIA, Electric Generation and
Environmental Externalities: Case Studies,
September 1995.
15. For information on acid rain and power plant
emissions see: Environmental Protection
Agency, Progress Report on the EPA Acid Rain
Program, November 1999.
16. Per capita electricity consumption calculated
based on electricity consumption and population
data from: Energy Information Administration,
International Energy Outlook 2001, March
2001.
17. General Accounting Office, Acid Rain:
Emissions Trends and Effects in the Eastern
United States, March 2000.
62
NOTES

18. Hubbard Brooks Research Foundation, Acid
Rain Revisited: Advances in Scientific
Understanding since the Passage of the 1970 and
1990 Clean Air Act Amendments, 2001.
19. Id.
20. Id.
21. Intergovernmental Panel on Climate Change
(IPCC), Third Assessment Report-Climate Change
2001, Technical Summary, 2001.
22. Id.
23. Id.
24. Id.
25. Id.
26. IMPROVE, Spatial and Seasonal Patterns and
Temporal Variability of Haze and its Constituents in
the United States, Report III, May 2000;
27. For detailed information on mercury emissions
and health impacts see:
http://www.epa.gov/mercury/.
28. Clean Air Network, Turn Up the Heat on Dirty
Power, Why Power Plants Must Reduce Their
Mercury Pollution, March 1998.
29. U.S. Environmental Protection Agency, Mercury
White paper; http://www.epa.gov/
mercury/information.htm#reports.
30. Environmental Protection Agency, NOx: How
Nitrogen Oxides Affect the Way We Live and
Breathe, September 1998.
31. Environmental Protection Agency, Deposition of
Air Pollution to the Great Waters, Third Report to
Congress, June 2000.
32. Id. See also:
http://www.epa.gov/owow/oceans/airdep/air3.html.
33. Ozone Transport Assessment Group (OTAG),
Final Report,
http://www.epa.gov/ttn/rto/otag/finalrpt/.
34. See U.S. Environmental Protection Agency
National Ambient Air Quality Standards for
Ozone, 40 CFR Part 50, Vol. 62, No. 138, July
18, 1997.
35. California Air Resources Board News
Release, January 31, 2002. available at:
http://www.arb.ca.gov/newsrel/nr013102.htm
36. For a detailed discussion of visibility
impairment see: William C. Malm, Air
Resources Division, National Park Service,
Introduction to Visibility, May 1999.
37. See: http://www.epa.gov/air
/visibility/what.html.
63