benchmark january 2012 - applied mechanics and bioengineeringamb.unizar.es/pdfs/benchmark.pdf ·...
TRANSCRIPT

benchmarkthe international magazine for engineering designers & analysts
january12
analysis in your pocket
simulation on a smartphone
also in this issue . . .
rocket science I simulation at ford I stress on railway vehicles I icons of cfd
I


wel
com
e
1
‘ll spare you the “new year” editorial about the passage of time and looking forward tothe coming 12 months. I’ll even let you get away without mentioning the Christmas breakwe’ve all just come back from. Might skip a discussion on winter weather, and I’mdefinitely not going to write about new year’s resolutions.
Promise.
Right. Now that’s out of the way, we can concentrate.
This issue of benchmark includes an article on using a smartphone to run simulationsoftware. Yes, you heard me. Running analysis on your Android-powered device isbecoming a reality. Whilst this will obviously never (never say never....) replacesupercomputing, it’s a development that I’m sure many of us would never have seencoming a few years ago. Yet, it’s a mark of just how Moore’s Law continues to change theworld we live in. What next? NASA mission control being run from someone’s kitchen onan iPhone? NNSA being run out of a garage using an array of tablets, netbooks and iPads?The mind boggles. Whilst we’re not exactly at that stage (yet!), it’s certainly a real-worldeye-opener into how quickly technology is developing and how nothing in the world ofhigh-performance computing stays the same for very long.
In November last year, I had the opportunity to sit down and talk to a number of keynotespeakers at the Siemens NX CAE Symposium in North Carolina. One of those interviews isincluded in this issue, and my discussion with Nathan Christensen from ATK Launch Systemcertainly raised a number of interesting points and gave me an insight into the simulationprocesses at a high-technology company such as ATK. With simulation data managementbeing a topic of much discussion within NAFEMS over the past few years, it wasinteresting to note that companies as advanced as ATK have the same problems and issueswith this as everyone else. The role of NAFEMS in bringing the simulation communitytogether, across industries, to look at how best to manage simulation data, has in my viewnever been more important. We can all learn from each other, no matter what industry orspecialty we focus on, and sometimes looking “outside” our own industries anddepartments can be the most effective way of finding a solution to long-standing orseemingly impossible problems.
And so, to NAFEMS. It’s a busy time at the moment as we prepare for our 2012 regionalconference programme. We hope that you’ll be able to participate in some of our eventsthis year, as we gear up to give you a number of conferences and events covering topicswhich are of interest to you and your colleagues. We can’t emphasise enough thatNAFEMS is YOUR organisation – if you think we need to be looking at certain topics moreclosely, tell us. If you want us to produce more publications on a certain technical area, tell
us. If you think we’re doing something right, tell us! Our technical working groupsand regional steering groups are busier than ever, which in turn leads to morebenefits for our members and the wider analysis community. So the message isthe same as ever – get involved.
Let’s make 2012 the year you become more active in your community (IKNEW I couldn’t make it to the end without saying something like that!).
David Quinn I Editor I [email protected] I twitter.com/benchtweet
I
benchmark january12

cont
ents
2 benchmark january12
Editorial
EditorDavid Quinn
Deputy EditorNicola McLeish
Design/Productiond2 print
AdvertisingPaul Steward
SubscriptionsChristine Bell
MembershipFor information on membership of NAFEMS, contact Paul Steward on
ISSN 0951 6859
Publisher
NAFEMSBeckford Business Centre
Beckford StreetHamilton, Lanarkshire
ML3 0BTUK
t +44(0)1355 225688 f +44(0)1698 823311 e [email protected]
Errors & Omissions: While every care is taken in compiling benchmark,neither the Editors, nor NAFEMS, can be held responsible for the
consequences of any errors in, or omissions from, the contents. Theviews expressed by contributors are their own and all information is
accepted in good faith as being correct at the time of going to press. TheEditors will not accept any advertisement considered by them to be
misleading or otherwise unsuitable for inclusion in benchmark, however,the presence of any advertisement should not be considered to convey
or imply any form of commendation by NAFEMS.
benchmarkthe international magazine for engineering designers & analysts
january12
interactive simulationon a smart phone12
this article, based on a presentation givenat a recent NAFEMS seminar in Madrid,outlines how simulation and analysis canbe used on the new generation of touch-
screen, handheld devices, and whatimpact this may have on the future of
engineering analysis

cont
ents
3benchmark january12
CONFNA
30 31 MA 16 20-25rocket sciencean interview with NathanChristensen of ATK LaunchSystems on analysisprocesses, SDM, and muchmore
nafems conferencesDACH, Nordic, UK & France
30stress time signals on arailway vehicleanalysis of multi-bolted joints
26accelerating design at fordhow one of the majorinternational motormanufacturers is acceleratingthe design process
36icons of cfdLewis Fry-Richardson – “thefather of weather forecasting”
34vendor viewAlbrecht Pfaff – MSC Software
39john ellison horspool1957-2011
regulars4 NafEms news
6 NafEms events
8 the CaE guy
40 industry events

nafe
ms
new
s
4 benchmark january12
With four Regional Conferencesalready planned in 2012, thisyear promises to feature a full
programme of NAFEMS events. Takingplace in May and June of this year,regional events will be held inGermany, Sweden, UK and France:
NAFEMS encourages you to getinvolved in the upcoming conferencesthrough attending, sponsoring,exhibiting and presenting. Full detailsof how to get involved with each ofthese events can be found within thecentre pages of this issue.
The Call for Presentations for many ofthe Regional Conferences closes in thenext few weeks so if you areintending to submit, please ensureyou are aware of the deadlines below.
Call for Presentations Deadline
UK Conference Closed
deutschsprachige Konferenz 1 Feb 12
Nordic Conference 13 Feb 12
France Conference 29 Feb 12
Full details for all of the conferencescan be found at
www.nafems.org/2012
Get Involved-NafEmsRegionalConferences a
UK team including NAFEMS has successfully presented a bid for the UK tohost the Structural Mechanics in Reactor Technology International (SMiRT)conference in 2015.
This large international conference has run biennially since 1971 with the eventalternating between Asia, North America and Europe. Covering a wide range oftechnical issues, the event features keynote presentations and plenary lecturesfrom leading figures in nuclear related research and development activities.
Two bids from within Europe were considered by the International Association ofSMiRT for the 2015 conference with the UK bid being successfully approved atthe SMiRT 21 general assembly in New Delhi, India on Thursday 10 November.
NAFEMS would like to mention the rest of the team who also helped to securethe UK bid to host the conference:Dave Shepherd (ONR)Manus O’Donnell (EDF Energy)Nawal K. Prinja (AMEC)Robert Hayman (Nuclear Institute - NI)with support from Barry Marsden & Derek Tsang (Manchester University)
NafEms helps secure UK smiRT Bid
NAFEMS Iberia’s Seminar entitled“New and Future Trends inSimulation” was held in October
last year with an exceptionally highstandard of presentations. A total ofnine presentations offered theaudience an opportunity to increasetheir knowledge in topics including:high performance computing,stochastics, automatic optimisation,electromagnetic calculations and testscaling. The presentation by EliasCueto offering a new way to developmodels and a breakdown scenario foronline and real-time simulationapplications through model data
reduction using proper generaliseddecomposition techniques wasparticularly well received. This issue ofbenchmark includes an article basedon this presentation on page 12.
The seminar was extremely wellattended by industry, revealing astrong Iberian interest in simulation –in both traditional areas and emergingpossibilities.
Following this success, the nextIberian Seminar will be held in Spring2012 – details to follow!
• Provide a framework for fosteringdiscussions on the state-of-the-art ofmultibody dynamics theory and for sharinglesson learnt of simulating from differentapplications
• Benchmark different multibody dynamicsmethodologies based on challenging andnonconventional applications
• Offer guidelines and recommendations touser community
• Suggest multibody research developmentbased on real-life applications
• Highlight benefits gained using Multi-bodyDynamics Software
For further information on the group, and howto get involved, visit www.nafems.org/tech/mbd
NAFEMS has recently formed anew working groupspecifically focussed on multi-
body dynamics. Involvingindustrialists, consultants, vendors,and academia researchers, theMulti-body Dynamics WorkingGroup (MBD-WG) will:
annual Iberia seminar
NafEms formsmulti-BodyDynamicsWorking Group
CONFERENCENAFEMS UK
30 – 31 MAY I GRANTHAM, UKENGINEERING SIMULATION: REALISING THE POTENTIAL

nafe
ms
new
s
5benchmark january12
We would like to invite you tocomplete our benchmark andNAFEMS publications survey.
Your feedback is extremely important
to us so please use this opportunityto tell us what you think of themagazine and other NAFEMSpublications.
The survey should only take fiveminutes to complete, and can beaccessed fromwww.nafems.org/survey
New Publications from NafEms
Simulation Data Management Survey ReportThere is a considerable amount of interest within the NAFEMS community in theemerging technology of Simulation Data Management (SDM). It offers significantpotential for impacting the management of data, models, processes, documentsand metadata.
The initial work of the Simulation Data Management Working Group was focusedon compiling a baseline set of user requirements for SDM. This involved thecompletion of an industry survey, the results of which are explored within thisreport.
Further publications aimed at developing a common understanding of what SDMcomprises, and explaining how to justify investing in SDM are already nearingcompletion and will be distributed to you in due course.
Idealisation of JointsComponents are joined together using a variety of methods. As simulation is nowroutinely used to assess performance and integrity, it is necessary to represent avariety of joints with an idealisation that represents the stiffness characteristics andallows the recovery of loads for application to more detailed models.
This document provides a synopsis of a NAFEMS seminar on the Idealisation ofJoints including a summary of the information that was provided and copies of thepapers which were presented.
www.nafems.org/publications
Why Do Multi-Body System Simulation?Multi-Body Simulation (MBS) techniques provide engineers with a way of developingan understanding of complex dynamic systems. They have been successfully used todescribe the real-world behaviour of systems in a range of industries such astransportation, industrial machinery, aerospace systems and consumer goods.
MBS has been part of the technology encompassed by NAFEMS for some time, yetthis is our first publication dedicated to its application. The purpose of the book is toprovide a high-level overview of the methodology, demonstrate through exampleshow it is used in various industries today, and illustrate the benefits gained from doingso. This introductory book has been written under the auspices of our Education andTraining Working Group. Its creation has spawned the recent formation of a newNAFEMS working group dedicated to Multi-Body Dynamics, which now has plans toproduce a range of further guidelines dedicated to the subject.
anumber of new books have recently been published by NAFEMS, and will be mailed to our members as part of theirmember benefits package. These are also now available on the NAFEMS website for non-members to purchase, and formembers to purchase additional copies.
benchmark survey 2012
Simulation Data Management Survey Report

nafe
ms
even
ts
6 benchmark january12
Basic FE Analysis
e-learning course
Online
Jan122012
www.nafems.org/events
Structural Optimization in FE Analysis
e-learning course
Online
Jan172012
Einfuehrung in die praktische Anwendungder Finite-Elemente-Methode (FEM)
course
Wiesbaden, Germany
Jan232012
Practical Introduction to CFD
e-learning course
Online
Jan242012
Introduction au Calcul de Structures, auxElements Finis et a la Simulation Numerique
course
Paris, France
Mar202012
Practical Introduction to FEA
course
Stratford-upon-Avon, UK
Mar202012
Engineering Optimisation for IndustrialApplications
seminar
Gaydon, UK
Mar212012
Einfuehrung in die praktische Anwendungder Finite-Elemente-Methode (FEM)
training course
Bamberg, Germany
May72012
Practical CFD Analysis
course
Bamberg, Germany
May82012
DACH Konferenz 2012
conference
Bamberg, Germany
May82012
Nordic Conference 2012
conference
Gothenburg, Sweden
May222012
UK Conference 2012
conference
Lincolnshire, UK
May302012
France Conference 2012
conference
Paris, France
Jun52012
KONFERENZNAFEMS DEUTSCHSPRACHIGE
8.-9. MAI I BAMBERG, DEUTSCHLAND
CONFERENCENAFEMS UK
30-31 MAY I LINCOLNSHIRE, UK

As the only independent, internationalassociation dedicated to engineering analysisand simulation, NAFEMS provides a range oftraining courses which are open to all, in bothface-to-face and e-learning formats.
Basic FE Analysise-learning course, online
12 January 2012
Structural Optimization in FE Analysise-learning course, online
17 January 2012
Einfuehrung in die praktische Anwendung
der Finite-Elemente-Methode (FEM)training course, Wiesbaden, Germany
23 January 2012
Practical Introduction to CFDe-learning course, online
24 January 2012
Introduction au Calcul de Structures, aux
Elements Finis et a la Simulation Numeriquetraining course, Paris, France
20 March 2012
Practical Introduction to FEAtraining course, Stratford-upon-Avon, UK
20 March 2012
Einfuehrung in die praktische Anwendung
der Finite-Elemente-Methode (FEM)training course, Bamberg, Germany
7 May 2012
Practical CFD Analysistraining course, Bamberg, Germany
8 May 2012
Introduction au Calcul de Structures, aux
Elements Finis et a la Simulation Numerique training course, Paris, France
6 June 2012
New courses and dates are announced regularly – visit
www.nafems.org/training for full details

Dear CAE Community,In my last column, I briefly talked abouttrust and how it relates to CFD1,2. Ioutlined that our primary goal in the(relatively) newly formed CFD group isto have CFD results trusted by otherswithin the vehicle developmentdivision, even to the point ofequivalency with wind tunnel results.While that is indeed a worthy goal, Ithink that this idea of trust can beexpanded to include other items of notewithin the world. This certainly applies to
the U.S. Congress, which isenduring its worst approvalratings in modern history (in the~10% range)3. This concept oftrust also relates to specifictopics rather than groups ofpeople. Take global warmingfor instance4: I think that allthe “but”, “if”, and “howabout” items brought up byglobal warming naysayerscan all be adequatelyargued away and it allcomes back to trust – or,more specifically, mistrust– in the government5.There just seems to be asmall, but vocal, groupof people that just doesnot trust “government”.Here in the U.S, theyjust seem to get adisproportionateamount of coverage.That they understandthe full implications ofthis mistrust is not clear;for example, the states
that want smallergovernment receive themost government funding6.
Anyway (enough of that),these past few months ofleading my company’s newCFD group have seemedlonger than usual – probablyhaving to do with trust beinghard to establish, but easy tolose. I think we should bemaking more progress towardscreating better CFD modelsfaster and producing betteranalysis, but the advancementwe’re making seems slow.Perhaps it is the Law ofAccelerating Returns in action,which states that technologicalprogress occurs exponentiallyinstead of linearly7. While mosttake this as meaning that eachnew advancement enablesseveral higheradvancements instead of
just one higher advancement, and concordantly, everyyear, more useful inventions and discoveries are madethan were made in the last8, to me, however, thismeans that people – including me – tend tooverestimate the near-term benefits, or progress, ofsome new procedure or method. Think of the copieror the personal computer. In the early days of theirusage, both struggled to gain wide acceptance;probably to the dismay of their inventors/producers.Now, however, both are so ubiquitous that it isimpossible to imagine modern society without themand I would judge that their penetration into society iswell beyond the imagination of those initialinventors/producers. To me, this means I just need tostay the course and keep planning for the future,whether near-, mid-, or far-term.
In other news: it looks like I will be moving again – asin changing desk locations. We have decided to re-organize at the division level and pair like-mindedgroups under the same management. Not wanting towaste a crisis, our manager decided to restructure theaero-thermal department, but I was able to hold on tothe fledgling CFD group in its current form – I mean,we’ve only been at this a few months and we’d loseeverything if we got swallowed up a largermanagement structure. I will be going back to thesame size/type desk that I had before – with a newer,bigger, badder workstation under my desk and so Iwill probably need to revive my thermal mitigationapparatus9. Nevertheless, with this new managementstructure, it looks like we’ll have to break in some newpeople to our way – the CAE/CFD way – of thinking.I’ll let you know how it goes in future columns.
What are your thoughts on any of this? Drop me ane-mail at: [email protected]
-The CAE Guy
References[1] “The CAE Guy”, Benchmark, NAFEMS, October 2011
[2] My Dad – an avid CAE Guy reader – also pointed outthat “Trustworthy” is the first Boy Scout Law,http://usscouts.org/advance/boyscout/bsoathlaw.asp
[3] “Congress Approval Rating Lower than Porn, Polygamy,BP Oil Spill, 'U.S. Going Communist'”, The HuffingtonPost (on-line), November 15, 2011.
[4] I think the statement that global warming is actuallypretty much settled; whether it is caused by people is thecurrent battle front.
[5] This is my humble, but informed, opinion: It would betoo long, and well beyond the scope of this forum, tooutline this in its entirety. You’ll just have to trust me onwhether this is, indeed, possible or not.
[6] “Federal Taxes Paid vs. Federal Spending Received byState, 1981-2005”, The Tax Foundation, October 19,2007, http://www.taxfoundation.org/research/show/22685.html
[7] The Singularity is Near, Kurzweil, R., Penguin Books,2005. "http://www.singularity.com/"http://www.singularity.com/
[8] http://en.wikipedia.org/wiki/The_Singularity_Is_Near
[9] “The CAE Guy”, Benchmark, NAFEMS, July 2008
cae
guy
benchmark january1288

even
t fo
cus
Siemens PLM held its first NXCAE Symposium in Charlotte,NC, USA during Novemberlast year, welcoming a host ofinteresting and informativespeakers who covered arange of applications fromNASCAR racing to satellitelaunches. The symposiumbrought together users of thesoftware for the first time,and topics under discussiondelved much deeper than thesoftware itself.
As with many recentconferences, the topic of SDMwas covered by a number ofspeakers includingrepresentatives from Procter &Gamble, JPL, Siemens Energyand many more. In this issue ofbenchmark, you can read thethoughts of Nathen Christensenfrom ATK Launch Systems, as hespoke with benchmark andshared a host of opinions andtheories on simulation relating toATK.
A lively panel discussion closedthe conference, featuringquestions ‘from the floor’ for aspecially assembled panel ofexperts on the use of simulationand analysis, processmanagement, and softwareintegration in the design process.What was clear was that evenwith the event being focussedon a specific suite of softwareofferings, the same issues andconcerns permeate the entiresimulation and analysiscommunity – namely handlinglarge amounts of simulationdata, integrating analysis intothe design process, and the skill-sets required to use cutting-edgeanalysis software. These areissues which will also come tothe fore during NAFEMS’ 2012regional conference series, moreinformation on which can befound in the mid-section of thisissue of benchmark.
eventfocus


ITT
11benchmark january12
“How to Model Bonded and Welded Joints”Booklet outline(It should be note d that the outline provided below isthat suggested by the CSM-WG but the prospectiveauthor may suggest changes based on their ownexperience.)
• Identification of the joints covered in thedocument, bonded and welded example.
• Introduction of the key features and mechanismof load transfer of the various types of joint.
• Introduction of the key parameters important tothe performance of the joints, modes of failureand assessment criteria using established sourcesof references where available and appropriate.
• Identify the significance of preload and/or pre-stress inherent in the joint and how to accountfor it in assessment of joint performance.
• Examples of idealisation of various types of jointto represent joint stiffness characteristics in largerassemblies of products.
• Examples of idealisation of various types of jointfor detail analysis at component level.
Guidance for proposal
Each proposal should consist of;
1. The proposed structure of the book with thetitles of the examples to be developed
2. The proposed source of the data to be published
3. Work plan including milestones and interimdeliveries for early review
4. Cost
5. The authors’ credentials, curriculum vitae, etc.Proposals from single authors and consortiumswill be considered.
Typical “ How to…” documents are 60-100 pages longand the cost of preparing the document is expected tobe in the low thousands of pounds.
PurposeThe Computational Structural Mechanics Working Group(CSM-WG) wishes to commission a new document withthe suggested title: “How to Model Bonded andWelded Joints”. The book will form part of the existing“How to...” series of NAFEMS documents.
Joints are an integral part of products in all sectors ofindustry: Civil and Offshore, Power and Pressure,Aerospace and Land Transport, Consumer Goods andBiomechanical applications. Joints are important not onlywith respect to structural integrity and performance of theproducts themselves but in the jigs, fixtures and testhardware used throughout the product manufacture andqualification process.
Components are assembled together to maintainstructural integrity and performance using a variety ofmethods either temporary allowing for repeateddisassembly and reassembly necessary for maintenanceactivities or permanent attachment. Mechanically FastenedJoints, bolted and riveted are considered inherentlydifferent to permanent bonded and welded joints and issubject of a separate publication.
• Permanent joints include for example:
• Bonded, single lap, double lap
• Welded, fillet welds, spot welds, seam welds
• Soldered/Brazed
To maintain performance the joints need to survive all theloading environments experienced during themanufacture, assembly and testing and to deliver therequired product performance throughout the in servicelife. The loads can be steady state or cyclic from vibration,shock and thermal environments.
Intended ReadershipThe document should be applicable to those familiar withor involved in design and engineering analysis and wish tolearn about this subject area of simulation technology. Thedocument should also be of value to Project Managersover seeing the use of these analyses. It should beassumed that the design engineers and analysts arefamiliar with basic Finite Element theory.
TENDER
www.nafems.org/publications/tender
Closing DateAny proposal should be sent to NAFEMS at [email protected] to arrive no later than 31st January 2012Further details are available from the NAFEMS office or by contacting [email protected]
supe
rcom
puti
ng
12 benchmark january12
Traditionally, Simulation-based Engineering Sciences(SBES) made use of staticdata inputs to perform thesimulations. Namely
parameters of the model,boundary conditions, etc. weretraditionally obtained byexperimentation and could notbe modified during the course ofthe simulation. More recently,large efforts have been investedin developing dynamic data-driven application systems(DDDAS): systems in whichmeasurements and simulationsare continuously influencingeach other in a symbioticmanner. It should be understoodthat measurements should beincorporated in real time to thesimulations, while simulationscould eventually control the wayin which measurements aredone.
F. Darema in a NSF workshop onthis topic coined the term DynamicData-Driven Application System in
2000. The document that initiallyput forth this initiative stated thatDDDAS constitute “applicationsimulations that can dynamicallyaccept and respond to 'online' fielddata and measurements and/orcontrol such measurements. Thissynergistic and symbiotic feedbackcontrol loop among applications,simulations, and measurements is anovel technical direction that canopen new domains in thecapabilities of simulations with ahigh potential pay-off, and createapplications with new andenhanced capabilities. It has thepotential to transform the wayscience and engineering are done,and induces a major beneficialimpact in the way many functions inour society are conducted, such asmanufacturing, commerce,transportation, hazardprediction/management, andmedicine, to name a few" [1].
A crucial aspect of DDDAS is that ofreal-time simulation. This meansthat the simulations must run at the
same time (or faster) than data arecollected. While this is not alwaystrue (as in weather forecasting, forinstance, where collected data areusually incorporated to thesimulations after long time periods),most applications require differentforms of real-time simulations. Inhaptic surgery simulators, forinstance, the simulation result (i.e.,forces acting on the surgical tool)must be translated to the peripheraldevice at a rate of at least 500 Hz,which is the frequency of the freehand oscillation. In otherapplications, such as somemanufacturing processes, the timescales are much bigger, andtherefore real-time simulations canlast for seconds or minutes.A new generation of simulationtechniques, Proper GeneralizedDecomposition (PGD), has receivedan increasing level of attention bythe SBES community. Because itempowers SBES with fastsimulations able to cope withuncertainty, multiscale phenomena,inverse problems and many other
Interactive simulationon a smart PhoneE. Cueto, Universidad de Zaragoza, spain
a. Huerta, Universitat Politecnica de Catalunya, BarcelonaTech, spain
f. Chinesta, EaDs Corporate foundation Chair, Ecole Centrale de Nantes, france
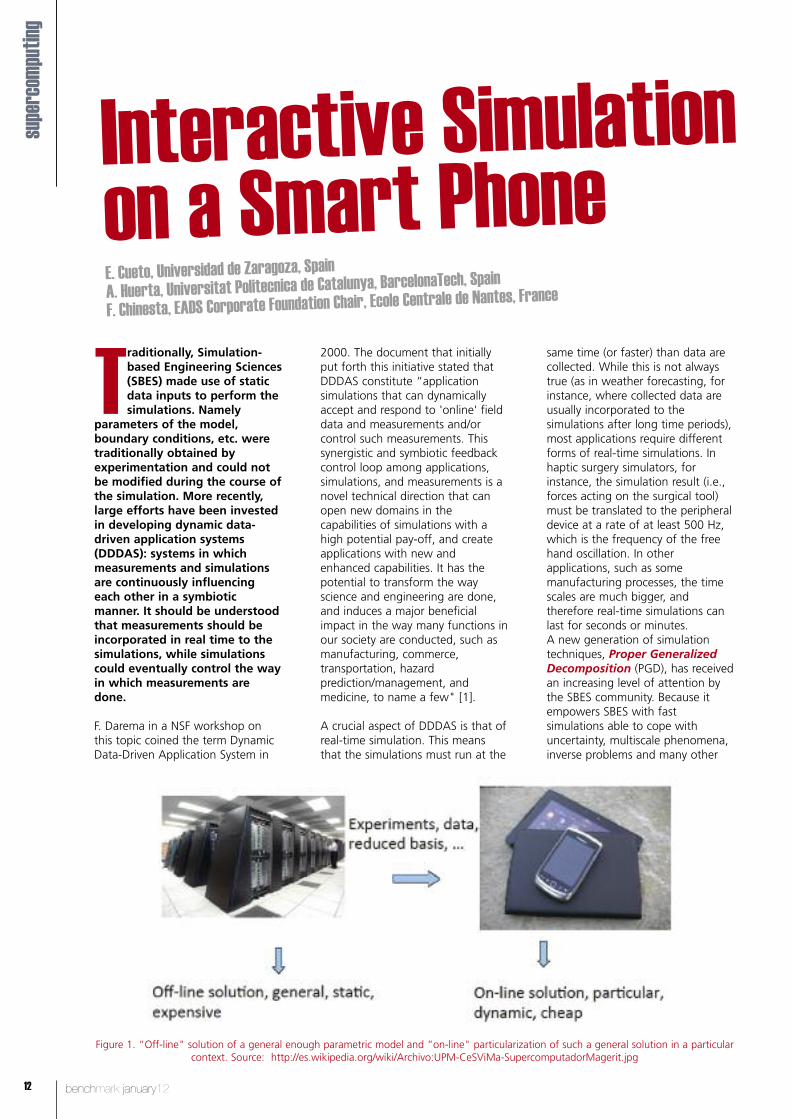
Figure 1. “Off-line" solution of a general enough parametric model and “on-line" particularization of such a general solution in a particularcontext. Source: http://es.wikipedia.org/wiki/Archivo:UPM-CeSViMa-SupercomputadorMagerit.jpg

supe
rcom
puti
ng
13benchmark january12
features that will be discussed.PGD was initially introduced inmultidimensional modelsencountered in science andengineering [2] and was thenextended to address generalcomputational mechanics models.
What really constitutes a noveltyabout the PGD method is its abilityto construct physics-based meta-models without the need forany prior computer experiment.These meta-models are then usedto perform real-time simulationsfor which very light computingplatforms are enough. The so-called deployed platforms(smartphones, tablets) are oftenenough to equip engineers with apowerful tool to analyze complexproblems and take decisions in veryshort lapses of time, as will bedemonstrated.
Imagine for example that we areinterested in solving the heatequation but the material's thermalconductivity is not known, becauseit has a stochastic nature or simplybecause no experimental measuresare available. Three possibilitiesarise: (i) wait to know theconductivity before solving theheat equation (a conservativesolution); (ii) solve the equation formany values of the conductivity (asort of Monte Carlo method); or(iii) solve the heat equation onlyonce for any value of theconductivity. Obviously the thirdalternative is the most appealingone. To compute this quite generalsolution it suffices to introduce theconductivity as an extraindependent coordinate, takingvalues in a certain interval andplaying a similar role as standardspace and time coordinates. Thus,by solving only once the resultingmultidimensional thermal model,the most general solution iscomputed; that is, a solution thatproduces at each physical pointand instant the value of thetemperature for any value of thethermal conductivity.
This approach is feasible and, asshown below, the results arepromising. Note also that manyother extra-coordinates can beaccounted for: source term, initialconditions, boundary conditionsand even the domain geometry.Thus, moving loads in structuralmechanics, geometrical parameters
Figure 2. The PGD-based application is able to determine the optimum values for workingtemperatures in the pultrusion furnace and provides a color map of the temperature field. Inthe event of malfunctioning values (a heater is broken, for instance), thermocouples will send asignal to the pone to indicate that they are registering non-optimal temperatures. The following
step, determines which heater is not working well, by solving, always in real-time, thecorresponding inverse problem. Once it is identified, the working temperature of the “healthy”heaters should be optimized again (bottom left figure) to allow the furnace to continue workingin the presence of a broken heater. The resulting optimized temperature field in the case of one
malfunctioning heater is shown in the bottom right figure.

supe
rcom
puti
ng
14 benchmark january12
in shape optimization, material parameters in materialcharacterization, boundary conditions in inverse analysis orprocess optimization, etc., can be treated as extra-coordinates to compute off-line multidimensionalparametric solutions that could then be used on-line,running in real time. These general solutions computedoff-line could be introduced in very light computingdevices, as for example smartphones, opening anunimaginable field of applications that Figure 1caricatures. This methodology constitutes, in the authors’opinion, a new paradigm of real-time simulation.
PGD techniques are designed to preclude the “curse ofdimensionality”. That is, high-dimensional problemsbecome non-computable because the number of degreesof freedom in a model grows exponentially with thenumber of dimensions of the space! A separatedapproximation of the unknown function reads:
where each xi constitutes a coordinate, not necessarilyphysical. For instance, as referred earlier, conductivity of amaterial, if it is unknown, can be seen as a newcoordinate. This constitutes no more than a generalizationof the method of separation of variables to solve partialdifferential equations. Note that functions xi
j unknown andmust be determined. They are obtained off-line by meansof the weak form of the problem (principle of virtualwork). The price to pay is that now the problem is non-linear even if the original one was linear. However, it issolved only once and off-line. The resulting solution isprecisely the desired meta-model that can be used on-linewith the required speedup to obtain real-time response.
This methodology enables, for instance, the control ofindustrial processes like pultrusion, and even to identifymalfunctioning and decision making with the help ofoptimization tools that run in real time. In order todetermine optima in the solutions there is no more theneed to perform really complex and repetitive simulations;
now the solution is known for all parameter values,physical position and time instant, and it can beconveniently stored in separated form in our smartphone.Figure 2 illustrates the use of a Nokia phone to control apultrusion equipment in the event of a breakdown ofsome of the heaters.
This same framework can be applied in a variety of fields.For instance, for surgery planning, complex anatomicaldeformable models can be handled in real-time bysurgeons, allowing them to have accurate information totake decisions prior to practicing surgery (see Figure 3).
As can be noticed from the above examples, PGDmethods open unimaginable possibilities in the field ofDDDAS. We continue exploring the capabilities, and alsothe possible limitations, of this new generation ofnumerical simulation techniques that can revolutionize theway we think of simulation based engineering sciences.
AcknowledgementsThe authors wish to thank all their students andcollaborators, who did the most important part in thework here presented: Icíar Alfaro, Felipe Bordeu, ChadyGhnatios, David González, Adrien Leygue, David Modesto,Siamak Niroomandi, Françoise Retat-Masson, …
References[1] F. Darema, Engineering/Scientific and Commercial applications:
differences, similarities, and future evolution, Proceedings ofthe Second Hellenic European Conference on Mathematicsand Informatics. HERMIS, vol. 1, pp. 367-374, 1994.
[2] A. Ammar, B. Mokdad, F. Chinesta, R. Keunings, A new familyof solvers for some classes of multidimensional partialdifferential equations encountered in kinetic theory modelingof complex fluids, J. Non-Newtonian Fluid Mech., 139, 153-176, 2006.
[3] Ch. Ghnatios, F. Masson, A. Huerta, A. Leygue, E. Cueto, F.Chinesta. Proper Generalized Decomposition Based DynamicData-Driven Control of Thermal Processes. ComputerMethods in Applied Mechanics and Engineering, to appear,2011.
Figure 3. A PGD model of a human liver running in real time on a Motorola Xoom tablet under Android 3.0. Theuser can perceive not only the anatomy of a particular patient, but deform it in real time by simply touching inthe screen. This same architecture could eventually be linked to haptic devices to construct surgery simulators.

SysFera develops anddistributes SysFera-DS: anopen-source softwaresolution for mutualizing,managing and optimizingheterogeneous anddistributed HPC resourcesand infrastructures, inparticular for intensiveapplications. SysFera-DSoffers a simple, efficient,evolutive and transparentway to make using HPCresources easier and fasterfor end-users andadministrators. It is basedupon more than 10 yearsof research work byGRAAL, an INRIA researchteam based at the LIP(Laboratoired'Informatique duParallélisme) at ÉcoleNormale Supérieure Lyon,France.
SysFera provides tools,support and maintenancefor this solution. It alsoproposes consulting and
training courses for itscustomers. SysFeracontinuously developsnew features in closecollaboration withresearch labs andinnovative customers.
Innovation is at the coreof the SysFera company,which relies on a team ofexperts and scientificadvisors in the domain ofHPC. By joining NAFEMS,we hope to have betterinsight into theexpectations ofcompanies that have FEA,FEM, CFD and relatedtopics at the core of theirbusiness, to integrate oursoftware more seamlesslywith the existingapplications, and to findbusiness partners. Ourexpertise can helpcompanies improve theirsoftware and make thebest use of HPCinfrastructures.

rock
et s
cien
ce
16 benchmark january12
Nathan joined ATK as a design engineer in composite structures, designing and analyzing
missiles and rockets. He spent a significant portion of his 28-year career working with
PLM/CAD/CAE and computational tools for design and analysis. Christensen is one of the
technical founders of ATK’s PLM system, which now manages hundreds of thousands of pieces
of product and engineering information used at ATK facilities across the US. He has published
numerous technical articles and papers on rocket motor design and analysis, CAE tools and
computational methods. He also holds a patent for hybrid pressure vessels.
Christensen was first appointed manager of the CAE group in 1992, with responsibilities for
engineering computational tools and methods. In his current position as manager of
Engineering Tools and Analysis group, his responsibilities include PLM/CAD/CAE tools, trend
analysis, rocket motor performance databases, analytical methods and software
development, reliability engineering and high-performance computing.
Background image courtesy of ATK Launch Systems. Nathan Christensen photographed by Branco Liu, Siemens

rock
et s
cien
ce
17benchmark january12
How do you benchmarkyour use of simulationcompared to otherorganizations?Traditionally we review our work withour customers, prime contractors andjoint venture partners – comparingtools, methods and approaches withtheir technical people. More recently,we’ve been working with severaldifferent partners, like GM andNorthrop Grumman to benchmarkinside and outside of our businesssector. Through organizations like
Siemens PLM World, we have madecross-industry contacts that areinterested in sharing best practicesand in benchmarking. Bybenchmarking ourselves, we haveadopted a strategy to understand andapply cross-industry best practices toimprove what we do in our ownbusiness sector.
We are under a lot of cost pressureinternally to do more with less. Boththe US economy and governmentspending is down substantially incertain areas of aerospace. Thechallenge for ATK is to produce thesame great products for less money or
produce improved products for thesame price.
We’ve done benchmarking with GM,Ford, Lockheed, and NorthropGrumman. It’s been great workingwith GM since we’re not in the sameindustry. That’s one reason GM isparticipating too. Since we don’tcompete in the same market space,we can share more openly than wewould with a competitor in our ownmarket sector. GM was looking tonon competing industries to share andbenchmark themselves. We thoughtthat was a great idea, and we’vestarted doing quite a bit of that too.
So this cross-industrycooperation and discussionmust really help you driveyour processes forward? I think that it does; I think it gives us adifferent perspective. Sometimes it’seasy to get too comfortable in your
own processes and in acceptedpractices in your own industry sector.Looking across industry certainly hasmade us think more about theprocesses we use. I think thathistorically aerospace has focusedprimarily on performance and safety.Cost and efficiency has taken a backseat. These days, we are using toolslike value stream mapping and Toyota
production system to improve our costand efficiency.
It’s interesting to see that race shopslike Joe Gibbs Racing are making partand system changes in a week thatwould take aerospace a year or moreto implement. I think that there is alot to be learned when we share ideasand methods across industries.
It seems like aerospace hasalways been at theforefront of analysis andsimulation. Things start withaerospace and then fallsdown to automotive etc etc?
You’re right, we in aerospace havebeen using numerical simulation sincethe beginning. Automotive has reallyleveraged that development andexpertise from aerospace. What haschanged from the early days is thatanalysis and simulation has becomemuch more trustworthy. People areusing it for things we never evendreamed of before. Things like golf
clubs, recreation equipment,consumer packaging, and high speedmachines used to make consumergoods like Pringles potato chips,diapers or shampoo.

rock
et s
cien
ce
18 benchmark january12
So now you’re involved inusing multi-physicssimulations?
Yes, we routinely do a lot of multi-physics analyses that we didn’t doeven 10 years ago. We regularlycouple fluid flow, thermal andstructural analyses. This is done eitheras loosely coupled (a manual methodwhere results from one discipline fedas input to the next) or tightly coupled(an automated method where solversiterate and converge on a multi-
physics based solution with minimalintervention). We use commercial offthe shelf and internally developedsolvers with internally developedsolver coupling software to performmulti-physics analyses.
For example, today we regularlyanalyze fluid-structure interactions(FSI) in solid propellant grain (shape)design. A typical design concern weregularly analyze with FSI is “borechoking”. In a solid rocket motor, thesolid fuel typically has a centerperforation (hole) down the full
length of the motor. When the motorignites, the entire surface is burningfrom the center radially outward untilall of the fuel is consumed. Theexpanding gases travel along thecenter bore and exit the nozzle tocreate the thrust that propels therocket. If not designed properly,exiting gas creates a structural loadclosing down the center bore resultingin an overpressure that can cause therocket to explode catastrophically.That’s just one of the typical multi-physics simulations we routinely runtoday in our design and analysisprocess.
So how has simulationchanged what you do overthe time you’ve been usingit? I think the biggest change is theacceptance of simulation. A majorsimulation project I was involved inearly in my career was the SpaceShuttle Challenger failure in 1986.During the failure investigation andsubsequent redesign, we relied heavilyon simulation to understand the O-ring seal and joint failure mechanismsthat are attributed to causing theChallenger disaster. At that time,simulation was only accepted whenaccompanied with significantvalidating physical tests. Today,analysis leads physical testing. Ourcustomers demand that we runextensive simulations and predictexactly what the physical testing willshow prior to testing. When we run amulti-million dollar test, they don’twant any surprises. If our simulationsdon’t predict exactly what is going tohappen in the physical tests -- it’s abad day for our Engineering team.
When I first started as an engineer,analysis was “nice to have” but itwasn’t really a trusted source or evenviewed as necessary for design sign-off. Physical tests were the final wordand were required for designvalidation. Today, we wouldn’t dreamof coming to a critical design review
with our customers, without an arrayof simulation models and results.
Nowadays, we have to predict whatthe test is going to do with a highdegree of integrity well in advance ofthe test. We have to understand andshare with our customers, exactlywhat the test results will be. If wedon’t match up with test results, allkinds of issues, problems andquestions will ensue. For example, weconducted a large solid rocket motorbooster ground test about a year agowhere we had some problems with atest controller. It took weeks tosimulate the issue, resolve thecontroller issues and reschedule thetest.
Our business has become extremelyrisk averse and simulation is a keytechnology. In a lot of our designs,we have to predict, within a verynarrow margin, what testing isneeded and what it is going happen.If we don’t, it’s back on us: what’swrong with the analysis, what wentwrong with the test, and what didn’tyou understand?
So what’s changed? Historicallytesting was the final word; nowtesting is just the final step in the partcertification process. ATK customersare very demanding. NASA isextremely demanding in that area,and if we don’t hit our predictionsright on, then there is a lot to explain.We’re very careful with our analyses,
and we do a lot of subscale testing tomake sure we correlate our models.We’ll conduct a static motor groundtest, sometimes recording 200-300channels of data. We’re actuallylooking at accelerometers, straingauges and pressure transducerstrying to match everything we’vealready predicted in simulations thencorrelate our models to make sure oursimulation is right.
We recently completed and test firedthe Orion Multi-Purpose Crew Vehiclelaunch abort motor. The reversethrust motor with nozzles at the headend of the motor was a concept firstdemonstrated by the Russians, butthis was the first time it’s beendemonstrated on a US space program.It is an interesting design aimed ataccomplishing two things: 1) re-locatethe pressure center and center ofmass in a manner that increasesaerodynamic stability and 2) move therocket motor exhaust and heat fromthe nozzle as far away from the crewcapsule as possible. This design is asubstantial variation from the Apollolaunch abort systems, which used aftthrust nozzles and producessubstantially less thermal load on thecrew capsule.
This first use on a US space programwas correct on the first test firing. Inthis very complex rocket firing, we hitall of our simulation predictions withina few percent. Our customersincluding NASA were very impressed.

rock
et s
cien
ce
19benchmark january12
So what software do youuse for this?
We typically use a combination ofcommercial off the shelf softwarecoupled with internal software. In theaforementioned bore chokingexample, SIMULIA’s Abaqus andAnsys’s Fluent commercial codes arecoupled with an ATK internallydeveloped FTSI (Fluid-Thermal-Structural Interaction) code calledFEMBuilder. We term this analysismethod “tightly coupled” eventhough the physics is not integratedinto a single solver, because thecomputational interactions are largely
handled automatically by the FTSIcode. We’re also using othercommercial codes like NX NASTRAN,NX Thermal, NX Simulation,Hypermesh, Optstruct, Ansys, iSight,ADAMS and MATLAB in multi-physicssimulations. We generally try to usecommercial software wherever we canand only develop internal code whenwe can’t find adequate or advancedcapabilities commercially. Since muchof our design and analysis work isexport controlled or restricted by ITAR(International Traffic in Arms)regulations, we use numerousgovernment and internally developedsoftware for multi-physics work.
Other ATK internally developed
software includes HERO(thermal/ablation solver) CaseBuilder(composite design/analysis), SHARP(fluid flow) and RECESS (propellantballistics).
We have benchmarked a fewcommercial integrated solver multi-physics packages in the past, but theydidn’t work out as well for us.Perhaps future versions will do better.I think these types of packages aregetting there, put I think it’s a little bitpremature for the level ofsophistication and complexity that weneed. Generally speaking, I think anintegrated solver is will be easiest touse, they just lack the sophisticationneeded for complex interactions.
What about datamanagement?
ATK is using Siemens TeamcenterEnterprise and Teamcenter Unifiedsuites for PLM. We’ve been usingPLM for nearly 30 years and have avery mature implementation. We arelong time Tc Enterprise customersmigrating to Tc Unified. Tc Unified isour 6th generation PLM system. ATKis an agglomeration of smalleraerospace companies which have
been united under the ATK brand.This legacy brings challenges inmanaging and uniting businessprocesses under a single PLM system.ATK PLM manages 5 CAD standardswith the Teamcenter suite – (NX,Catia, Pro/E, AutoCAD andSolidworks). PLM at ATK managesthe full gambit of product and processdata including procurement, design,simulation, manufacture, inspection,test and refurbishment.
PLM is implemented at more than halfof ATK’s 60 sites in the US. PLM is
administered through a corporateCenter of Excellence (COE). The COEmodel minimizes development timeand the necessary investment. ATKsites act as individual profit centersand are sometimes hesitant aboutmaking investments in PLM. We findthat when sites are hesitant toimplement PLM it’s because they don’tunderstand the business benefits.PLM is very complex. It takes time,but people get on-board once theyunderstand it and see the benefits.
David Quinn

www.nafems.org
DaCH
2012
20 benchmark january12
www.nafems.org/dach2012
Diese gravierenden Veränderungen führen auch zu neuenHerausforderungen im Ingenieurbereich und verlangennach Entwicklung und dem Einsatz neuer Technologien.Eine große Chance bieten Simulationsverfahren, die sichaufgrund der rasch fortschreitenden Leistungsfähigkeit vonComputern und dazugehörender.
Anwendungssoftware an vielen Stellen etabliert und denNutzeffekt überzeugend bewiesen haben. Der Fortschrittdieser Verfahren erlaubt es, immer genauere Ergebnisse zuliefern und immer stärker in Design-Entscheidungeneinzugreifen.
Die Finite-Element-Methode ermöglicht es, beispielsweisedie Lebensdauer dynamisch beanspruchter Bauteile zuprognostizieren, aber auch das Crashverhalten komplexerFahrzeugstrukturen. In Verbindung mit immer schnellerenRechnern können verlässliche Aussagen zu.
Strömungsphänomenen, z. B. für die Auslegung vonWindkraftanlagen, gewonnen werden.
Schwingungseigenschaften und akustische Effekte spielenbeim Betrieb von Maschinen eine wesentliche Rolle; mittelsdes Einsatzes von Finite-Element-Verfahren undMehrkörpersystemen können diese immer besser analysiertund beherrscht werden. Stark in den Vorder-grund gerücktsind infolge aktueller Anforderungen Simulationen vonelektromagnetischen Effekten. Die angeführten Methodenkönnen gekoppelt werden, um die Wechselwirkung zusimulieren, wodurch eine weiter verbesserte Aussagekrafterreicht wird.
Auch für die Fertigungsvorbereitung spielt die Computer-simulation eine bedeutende Rolle, z. B. für Ur- , Umform-und Fügeprozesse. Die Medizintechnik ist ein weiteresGebiet, in dem diese numerischen Verfahren in immerstärkerem Maße einsetzt werden.
Im industriellen Umfeld muss die Simulationstechnologie indie Arbeitsprozesse integriert werden. Die Arbeitsabläufemüssen so gestaltet sein, dass die für die Berechnungenbenötigten Informationen (Geometrie, Belastungen,Material usw.) aktuell und zeitgerecht verfügbar sind. Einewesentliche Voraussetzung dafür sind sorgfältig festgelegteProzesse, die die Schnittstellen zu CAD, zu den Analyse-bzw. Auswerteverfahren und den Testergebnissen berück-sichtigen. Eine besondere Bedeutung kommt dabei demDatenmanagement zu.
Mit der Konferenz bietet NAFEMS eine Plattform, auf derneuen Techniken und Tools präsentiert werden sollen undden Teilnehmern die Möglichkeit geboten wird, auf breiterBasis erfolgreiche Anwendungen und Trends mitSpezialisten aus Forschung und im besonderen Maße ausder Industrie zu diskutieren.
Erwünschte BeiträgeBeiträge, die interessante oder beachtenswerte industrielleAnwendungen, Weiterentwicklungen in der Technologieoder Theorie, zur Sicherung der Ergebnisqualität, zurVerbesserung des.
Datenmanagements und der Systemintegration sowie zurVerbesserung der Aus- und Weiterbildung auf diesemGebiet beinhalten, werden zu folgenden Themenkreisenerbeten:
� Strukturmechanik
� Strömungsmechanik
� Elektrotechnik
� Akustik
� Multiphysik
� Werkstoffe
� Stochastik
� Optimierung
� Schnittstellen im CAE-Prozess
� Simulation von Fertigungsprozessen(Urformen, Umformen, Verbinden, …)
� Aus- und Weiterbildung
� High Performance Computing (HPC)
Wir freuen uns auf Ihren 1/2-seitigen, deutschsprachigenTitel + Abstract per e-mail an [email protected] bis zum 1.Februar 2012
Nach Festlegung der Agenda erhalten Sie eineentsprechende Bestätigung. Für den Tagungsbandbenötigen wir ein "Extended Abstract" von typischerweise2 - 4 Seiten in deutscher Sprache.
Die Welt steht derzeit vor wahrhaft globalen Herausforderungen. Die ökologischen Wandlungen mit nichtabzusehenden Folgen, die Suche nach neuen Energiequellen und ein schier unbegrenztes Wachstum derErdbevölkerung erfordern auf allen Gebieten die Bereitschaft, neue Wege zu gehen.

nord
ic20
12
21benchmark january12
www.nafems.org/nordic2012
The NAFEMS NORDIC Conference 2012 will be held at the Radisson Blu Scandinavia Hotel in Gothenburgon 22-23 May 2012. Entitled “Engineering Simulation: Best Practices, New Developments, Future Trends”,the conference will give delegates an unrivalled independent insight into best practices and state-of-the-art technologies which consequently demonstrate upcoming trends, tendencies and the necessary futureneeds in FEA, CFD, MBS and associated technologies.
The two-day conference aims to increase awareness andprovide a discussion forum for topics that are importantand relevant to engineering industrialists and academics.
If you are an analyst, engineer, team leader or managerthat has a responsibility for ensuring that a fit-for-purposeengineering solution is obtained from the use of modernsimulation software, then you should attend.
The event is open to both members and non-members ofNAFEMS, with members with sufficient remaining creditsbeing able to attend the event for free, as part of theirmembership benefits package.
Call for PresentationsThe NAFEMS NORDIC conference will include keynotespeakers, exhibitions, and breakout sessions.
You are invited to submit an abstract (by e-mail [email protected]) exploring the following subjects:
� Structural mechanics
� Computational fluid dynamics (CFD)
� Electric / electronics
� Acoustics
� Heat transfer / thermal
� Multi-physics
� Materials
� Stochastics
� Optimization
� Robustness and confidence of analysis results
� Interfaces in CAE Processes
� Simulation of manufacturing processes
� Education and training
� High performance computing (HPC)
� Software development
Abstracts of 300-600 words should be submitted forconsideration by 13 February 2012
Abstracts must be marked with the author's name,organisation, address, fax, phone numbers and emailaddress. If you intend to submit an abstract, please send it by email to [email protected].
Authors whose abstracts are accepted will be asked toprepare an extended abstract (typically 1-2 pages) and aPowerPoint presentation. Full written papers will not berequired.
Sponsorship and Exhibition OpportunitiesWe would like to extend an invitation to yourcompany to be part of the NAFEMS NORDICConference 2012. There are several outstandingopportunities available for your company to sponsor orexhibit at the conference, giving you maximumexposure to a highly targeted audience of delegates,who are all directly involved in simulation, analysis,and design. Please request further information [email protected].

uk20
12
22 benchmark january12
CONFERENCENAFEMS UK
30 – 31 MAY I GRANTHAM, UKENGINEERING SIMULATION: REALISING THE POTENTIAL
Simulation has the potential to transform a company’s engineering processes –providing unprecedented insight into product performance and inspiring innovationby allowing novel concepts to be explored and evaluated.
NAFEMS, the independent association for the engineering analysis community, is holding its UK conference during 30-31May 2012 with the primary aim of helping attendees realise the full potential of their engineering simulation and analysis.The 2012 NAFEMS UK Conference will explore the extent to which this potential has now been realised, and what morecan be achieved.
The two day conference will focus on existing best practices as well as state-of-the-art FEA, CFD and associatedtechnologies – ensuring delegates receive a fully comprehensive overview of the technology available to them. Theconference intends to increase awareness and provide a discussion forum for topics that are important and relevant toengineering industrialists and academics, with an educational theme throughout.
Following on from the extremely successful 2010 conference, the 2012 event will certainly be the UK’s leading event onsimulation technology aimed at the engineering analysis community – bringing together leading industrial practitioners,consultancies, academic researchers and software developers in a neutral forum.
www.nafems.org/uk2012

uk20
12
23benchmark january12
Conference Themes� Design Driven by Simulation
� Pioneering Simulation Technology and Application
� Engineering Analysis, Verification and Validation
� Simulation Adding Value to Business
Why Should I Attend?The conference will be of interest to all analysts,engineers, team leaders and managers who have aresponsibility for ensuring that a fit-for-purposeengineering solution is obtained from the use of modernsimulation software. Those involved with themanufacturing and design process at any level will benefitfrom attendance.
The event is open to both members and non-members ofNAFEMS.
Attendance is free for NAFEMS members, subject tosufficient remaining seminar credits.
VenueThe 2012 UK Conference will be held at Belton Woods inGrantham. Being in the heart of the UK, the conference iseasily accessible from anywhere in within the UK andEurope.
Sponsorship & ExhibitionWe would like to extend an invitation to your company tobe part of the NAFEMS UK Conference 2012 –Engineering Simulation: Realising the Potential.
There are several outstanding opportunities available foryour company to sponsor or exhibit at the conference,giving you maximum exposure to a highly targetedaudience of delegates, who are all directly involved insimulation, analysis, and design.
As the only International Association for the EngineeringAnalysis Community, NAFEMS is the leading independent
source of information and training for engineeringanalysts and designers at all levels. Sponsors andexhibitors will have the chance to promote theirparticipation prior to the event through the varioussponsorship packages on offer. Your participation in thisconference will provide a positive impression of yourcompany’s commitment to best practices in the area ofengineering simulation. The NAFEMS UK Conferenceprovides an excellent opportunity for promotional andproduct/project awareness, and direct access totechnology leaders.
A Unique OpportunityThe NAFEMS UK Conference presents a uniqueopportunity by providing a forum where all individuals,worldwide, can represent their solutions in a singlelocation to a large number of potential clients, andcollaborate with other vendors in this field. What betterway to justify your support of this event?!
The exhibition area will be central to the conference itself,ensuring that there is a consistent level of traffic at alltimes, giving you the chance to meet as many of ourdelegates as possible.
In addition, this year we will be offering exhibition passeswhere delegates will not be required to pay for the fullconference and attend any presentations, and can registerto visit the exhibition area only.
To view all of the sponsorship and exhibition opportunitiesavailable, please visit www.nafems.org/uk2012
www.nafems.org/uk2012
PRINCIPAL SPONSOR
ADDITIONAL SPONSORS

fran
ce20
12
24 benchmark january12
www.nafems.org/fr2012
Appel à communicationsTechnologies I Méthodologies I Applications I Études de casLE Congrès de référence pour la communauté simulation numérique industrielle en France
Un évènement qui vous concerne Le Congrès NAFEMS s’adresse à tous les ingénieurs, concepteurs, scientifiques, managers et décideurs exerçant uneresponsabilité dans le choix, la mise en œuvre et l’utilisation performante des outils de simulation numérique dansl’entreprise.
Le congrès est centré sur vos besoins et s’attache à favoriser les échanges productifs industrie–recherche–offreurs.Une occasion unique de découvrir, approfondir, confronter et débattre de vos problématiques de simulationnumérique dans un contexte neutre et résolument professionnel.
Le programme et les thèmes du congrès traitent de l’état de l’art et des tendances en matière de technologies, deméthodologies et de bonnes pratiques de simulation numérique.
Études de cas, témoignages d’experts, débats et échanges informels permettront à chaque entreprise de mieuxcerner l’impact de la simulation numérique sur son innovation, sa performance et sa compétitivité
Une opportunité unique de contacts et de progrès pour chaque entreprise
Pour soumettre une proposition, merci d’envoyer un titre et un résumé de
300-600 mots avec vos coordonnées détaillées (auteur, société/organisation,
adresse, téléphone et email) à [email protected]
Merci de sélectionner également la ou les rubriques dans lesquelles votre présentation peut s’insérer.

fran
ce20
12
25benchmark january12
www.nafems.org/fr2012
Thèmes du CongrèsLe congrès NAFEMS offre à chaque ingénieur et chaque entreprise l’opportunité de valoriser ses travaux et sonsavoir-faire auprès de la communauté industrielle dans un contexte neutre et hautement professionnel.Toutes les propositions de communication sont bienvenues et seront étudiées avec soin.
Méthodologies et bonnes pratiques
� Conception pilotée par la simulation
� État de l’Art des Technologies et Applications
� Benchmarking, V&V, Confiance dans la Simulation Numérique
� Optimisation, Conception Robuste
� Éducation, Formation, Gestion des Compétences, Coopération Industrie Recherche
� Impact Industriel de la simulation numérique, Processus Qualité
Technologies et domaines d’étude� Matériaux (Composites, Matériaux hyperélastiques, Polymères, Métal/Plasticité, Viscoplasticité
/Fluage, Bétons, Matériaux fragiles (Céramiques, Verres), Géomatériaux, Biomatériaux, Nanomatériaux…)
� Calcul des Structures (statique linéaire et non linéaire, dynamique linéaire et non linéaire, Essaisphysiques/essais virtuels, V&V, Fatigue, Endommagement/Rupture/Durabilité, Contacts etfrottements, Flambement, Assurance qualité…)
� Dynamique et tests (Fréquences propres, Réponses (harmonique, aléatoire, sismique), Machinestournantes, MBS, Chocs, Impacts, Crash, Airbags, Explosion, Balistique …)
� Mécanique des Fluides (Incompressible and compressible, LES – DNS - RANS,Monophasique/Multiphasique, Thermo-hydraulique, Combustion, Turbomachines, Validation,Optimisation…)
� Optimisation / Robustesse (Plan d'Expériences Numériques, Surfaces de réponse, Optimisation Multi-objets/MDO, Optimisation topologique…)
� Électrique / Électronique / Électromagnétisme/ Piézoélectricité
� Thermique, Transferts thermiques
� Acoustique
� Multi-physique (Thermomécanique, Thermoélectrique, Vibro-acoustique, Multi-échelles, InteractionFluide-Structure (FSI), Couplages faibles/couplages forts…)
� Analyse Stochastique/Fiabilité
� Simulation de Process (Emboutissage, Forge, Injection, Fonderie, Moulage, Assemblage, Soudage…)
� Méthodes avancées, solveurs
� Sciences de la vie et de la terre
� Intégration CAD/CAM (applications métiers, Modeleurs intégrés, Plateformes d'intégration, Analyseréglementaire, Interfaces métiers…)
� SDM, Integration PLM, virtual testing
� Calcul Intensif (HPC, Parallélisation, Visualisation, GPU, Big data/Serveurs…)
� Outils Logiciels, Sciences de l’Ingénieur (Mailleurs/remailleurs, Open source, Pré-post processors,Librairies, Composants, Langages…)
Une attention particulière sera portée aux présentations à caractère industriel, qu’elles soient présentées par desutilisateurs eux-mêmes ou, si cela se justifie, par des chercheurs, des sociétés d’ingénierie ou des éditeurs de logiciels.Les auteurs sont invités à noter que NAFEMS est une association scientifique neutre et indépendante. Lesprésentations commerciales ne pourront être acceptées au Congrès.
Partenaires >Vous êtes éditeur de logiciels, revendeur, société d’ingénierie, laboratoire universitaire ? Devenez Partenaire de l’évènement et bénéficiez dès maintenant du programme de communication du Congrès !
Demandez le dossier Spécial « Partenaire du Congrès 2012 » à [email protected]

coni
cal j
oint
s
26 benchmark january12
Developing high-quality bolted joints is an integral part of vehicle chassis design. Robust joints
are critical to improving handling and longevity of vehicle performance. Joints that are loose
tend to exacerbate quality issues such as alignment, and ultimately the durability of the joined
components. A properly designed joint is more efficient and can support larger loads with
smaller size fasteners without loosening.
Engineers at Ford Motor Company were tasked to deliver a robust cantilevered conical joint
design for the rear suspension system of a midsize passenger car [Figure 1]. To minimize time
and cost while meeting functional targets, the team developed an automated Design of
Experiments (DOE) process using Abaqus for CATIA (AFC) for structural analysis and Isight for
process automation and optimization, both from the SIMULIA brand of Dassault Syste ̀mes.
“Our team chose to deploy standard stress modeling and simulation practices in the form of
templates to a broader group of engineers within the design organization,” says Satyendra
Savanur, chassis CAE engineer at Ford Motor Company. ”We used response surface model, one of
the approximation models, for finding optimal parameters to size the joint.”
coni
cal j
oint
s
27benchmark january12
Analyzing Conical JointPerformanceA bolted joint is the most commontype of attachment method used inthe suspension of a car. In thisapplication, a conical joint is used forconnecting the toe-link to the rearknuckle with a cantilevered typeconnection. The two mating parts ofthe conical joint—the bushing innersleeve and the knuckle—each haveunique manufacturing tolerances ofthe cone angle.
To develop a robust conical jointbetween a steel inner sleeve and analuminum knuckle the followingaspects were considered:
• manufacturing tolerances of eachcomponent
• contact area between the coneand seat
• angle of the cone
• torque loss after the service load isremoved.
To perform virtual tests of theirdesign, the Ford engineers created thefinite element model of the knuckleand the bushing inner sleeve with thegeometry input and materialproperties from their model created inCATIA. Associativity was maintainedto ensure that the model updateswere robust when the CAD model ischanged within the usable range ofdesign variables.
During the physical assembly process,a forged steel inner cone is forcedagainst an aluminum knuckle seat[Figure 2]. Due to the differentmanufacturing processes used tomake each part, the angulartolerances of the conical designfeatures are different on the innersleeve and the knuckle matingsurface.
“Because of the potential angularmismatch, there are variations incontact area when the twosurfaces mate together and thejoint is fully torqued,” says Savanur.Local yielding can occur in the matingmaterials, leading to changes incontact area and pressure distributionduring assembly of the joint. Whenthe service load is applied, furtherchanges to contact area and contactpressure can occur.
“It is therefore important tosimulate both the joint assembly,and the loading and unloading, of
service loads on the joint duringthe analysis,” he says. “Ourobjective was to deliver a robustconical joint design for the entirerange of conical mismatchbetween the cone and theknuckle.”
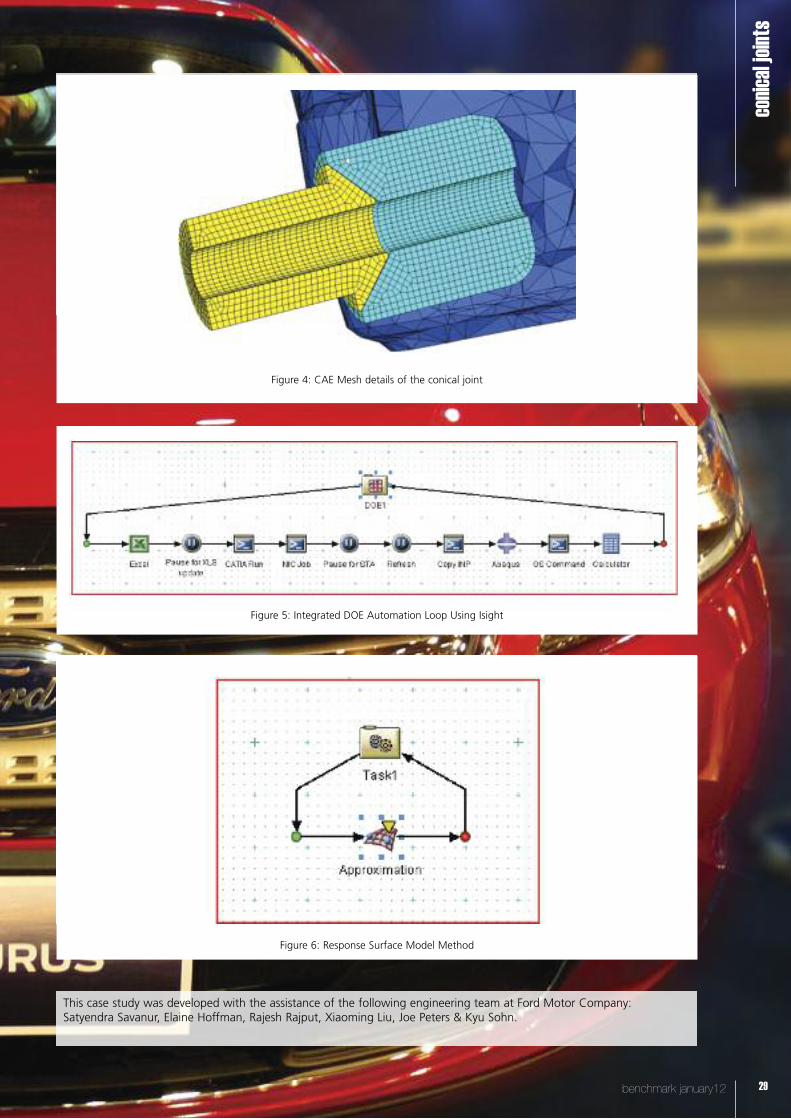
For a robust contact analysis and evencontact pressure distribution, themesh of the inner sleeve wasconstructed to align with the mesh ofthe knuckle seat. To facilitate meshalignment in the contact area, aseparate "domain" of the knuckleseat, shown in light blue in Figure 4,was created to simplify meshing. Thispart was connected to the rest of theknuckle body with a tied contact.
To simulate the bolt assembly process,a virtual bolt between the inner sleeveand the knuckle joint seat wascreated. External service loads wereapplied on the sleeve center. Non-linear stress-strain curves foraluminum and steel were imported tofacilitate the nonlinear analysis.Contact pairs and bolt tension werethen created. Output of contact areaand contact force magnitude wereused during post-processing. Finally,the analysis file was output andsubmitted to the High PerformanceComputing (HPC) cluster for runningthe analyses.
Managing the DOE ProcessFord‘s need to evaluate a largenumber of designs with differentcombinations of parameters promptedthe engineers to create an automated
DOE process. In this process, CADgeometry updates and FEA modelupdates are completed in the sameloop thus allowing a completelyautomated DOE approach.
At Ford, CAD startup is customizedwith an external product managementsystem. Scripting is used to strip awaythe linkages to the productmanagement system before initializingthe interface.
Design parameters are then fed inwith an external Excel file. The inputparameters from the Excel file aremapped to the DOE task of the Isightmanager. This enabled automaticupdates of the excel sheet for eachloop. Since Excel is synchronized withthe design table, this results inautomatic updates of the CADgeometry and FE.
“By developing a single integratedprocess, we were able to driveautomatic updates of thegeometry and mesh at the sametime,” says Savanur. The processautomation manager was used tomanage and control the DOE process.The resulting automation loop iscompletely integrated to run CADupdates, creating the FE models, andjob submission for analysis and post-process results.
The FE component inside the processmanagement loop was used to extractoutputs, including contact area andcontact force magnitude for each runof the DOE. The input parameters
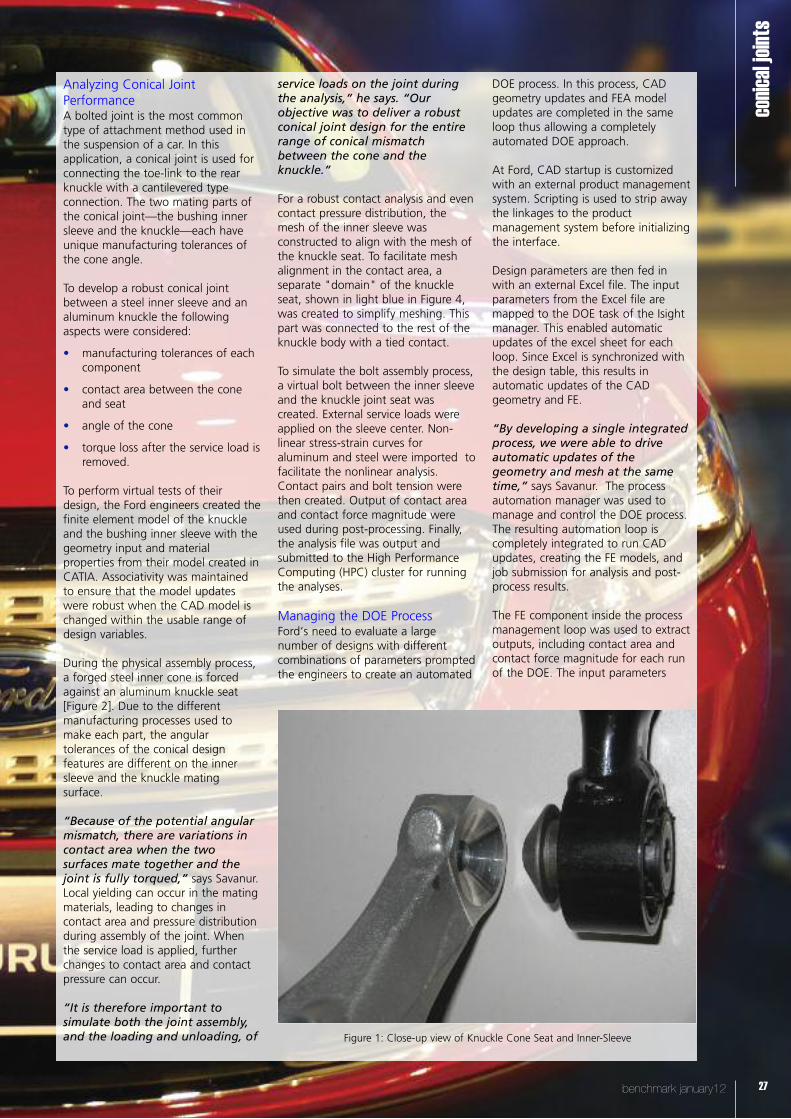
Figure 1: Close-up view of Knuckle Cone Seat and Inner-Sleeve

coni
cal j
oint
s
28 benchmark january12
from the Excel file are then mappedto these output parameters to createIsight approximation model.
“In our case, we used the responsesurface model method ofapproximation,” says Savanur, asseen in figure 6. This approximatemodel of conical joint behavior canthen be used to show how-inputaffects output and quickly optimizethe conical joint.
“This is the first application of anintegrated DOE automation loopto morph geometry using CATIAwith Abaqus at Ford,” says Savanur.
Isight Enables More EfficientProcessesThe set-up and validation of thescripts, HPC job submission batch file,and the windows batch command filetook time and resources to develop,but were well worth it as they are re-usable for subsequent projects withminor changes.
“Developing a comparable CADmodel with an associated Exceldesign table, and linked to anassociated FE model would takeapproximately three days toconstruct,” says Savanur.“Modifying and debugging thepreviously developed scripts to runwith these new models would takeanother day. Using this method, ittook about 3.5 hours for theprocess to complete 35 analysisruns.”
“Typically, the manual CAE processconsumes two days just tocomplete one run. Of course, thistiming can be reduced if theproject is critical, but this is thetypical day-to-day turn-aroundtime balancing several projects perengineer,” says Joe Peters, chassisCAE supervisor at Ford MotorCompany.
Time inefficiencies typically occur inthe transfer of data back and forthbetween CAE and CAD organizations,as people have multiple assignments
and do not immediately stop theircurrent work when new designiterations are requested; this isanalogous to CPU time verses wallclock time.
“It is estimated it would havetaken approximately 70 days tocomplete all 35 runs, whilemaintaining other day-to-daywork; whereas, our new processeliminates the inefficiencies thatwere part of the manual CAD/CAEprocedures,” says Savanur. “Bysetting up the integrated closed-loop automated DOE loop usingIsight, we achieved this task inabout four days. This was the onlyway to help achieve the programobjectives of cost and timing witha lean CAE organization”.
“Using the automated DOEprocess, we were able to drasticallycut down the time required todevelop a robust conical joint withminimal resources,” says Peters.
By creating an integrated closed-loopDOE process, Ford Motor Companywas able to deliver a robust conicaljoint design. This joint exhibits goodcontact area and retains clamp loadafter load removal, within thespecified manufacturing tolerances.
Conical Joint DescriptionFigure 1 shows a close-up view,before assembly, of the toe-link (black)and the rear knuckle (silver) using aconical joint.
Figure 2: Section of the conical joint
CAE Model DetailsThe CAE model, shown in Figure 3,has three distinct parts:
• bushing inner sleeve (yellow) madeof steel,
• knuckle seat (light blue) made ofaluminum
• And third is the knuckle body(dark blue) made of aluminum.
RSM approximation based on apolynomial fit via the least squaresregression of the output parametersto the input parameters. The R^2analysis is a measure of how well themodel polynomial approximates theactual function. When R^2=1.0, thepolynomial values and responsefunction values are identical (at alldesign points).
Figure 2: Section of the Conical Joint
Figure 3: Detailed CAE model
coni
cal j
oint
s
29benchmark january12
This case study was developed with the assistance of the following engineering team at Ford Motor Company:Satyendra Savanur, Elaine Hoffman, Rajesh Rajput, Xiaoming Liu, Joe Peters & Kyu Sohn.
Figure 5: Integrated DOE Automation Loop Using Isight
Figure 6: Response Surface Model Method
Figure 4: CAE Mesh details of the conical joint

stre
ss t
ime
sign
als
30 benchmark january12
The finite element model that was usedincludes nonlinear contact formulationsand friction between the specific parts ofthe railway ball joint connection. Theservice loads were represented by long 3-dimensional time signals, characterising atypical operating day of the railwayvehicle.
Due to the length of the time signals a fully transient FEcalculation was not an option. In addition, the commonlyused linear quasi-static superposition approach could notbe used due to the nonlinear contacts.
Within the project, ITWM developed a highly efficientmethod to compute the stress time signals of multi-bolted joints. The approach enhances the establishedmethod of the linear quasi-static superposition such thatnonlinear contact formulations can be covered. It isbased on the interpolation of suitably chosen staticcontact problems.
The new approach enables a profound comparison andimprovement - in the early stages of the developmentprocess - of different design variants undergoingcomplex varying service loads even in case of nonlinearphenomena such as contact.
Bolted joints are one of the most common detachableconnections in mechanical engineering. For thedesign of a single- or multi-bolted joint, the VDIguideline “Systematic calculation of high duty boltedjoints / Joints with one cylindrical bolt, VDI 2230, Feb.2003 [1]” has been used for many years. The guidelineprovides all the necessary calculation steps for a standardstress analysis of a bolted joint based on reduced andsimplified model assumptions.
Nevertheless, not all possible connection designs areincluded in the guideline. In particular, the calculation ofmulti-bolted joints is not fully described. FEA isincreasingly being used to assess these multi-bolted
joints. On the other hand, there is no common guidelinefor the usage of FEA regarding modelling, calculation,and durability behaviour of single or multi-bolted joints.Thus, FEA does not replace the VDI guideline, but offersreasonable extensions to those joints, which can’t becalculated with the reduced or simplified models of theguideline. Further details for single- and multi-boltedjoints see [4].
In the case described here, nonlinear FE analysis isneeded due to contact between different parts of thestructure. Thus, the well known quasi-staticsuperposition approach does not apply. A separate FEanalysis for each time sample would be required.However, this is not possible due to the length of theload signal. Instead, only a few suitably definedcombinations were calculated, building the basis for anew approach to obtain the stress results of the multi-bolted joint for the whole measured time series.Furthermore, a fatigue life analysis of the multi-boltedjoint under the service loads was performed.
Model DetailsIn order to obtain reasonable fatigue life estimations, therequirements on the accuracy of the stresses calculatedby FE models are high. Therefore the FE model has to bedetailed enough. On the other hand it is hardly possibleto include all the details of the bolted joint model (e.g.single thread turns) due to the increasing size of the FEmodel and the corresponding calculation time andhardware requirements. In the case described here, acompromise has been implemented to get reasonablestress results within the multi-bolted joints which areaccurate enough for a subsequent durability analysis.
In Figure 1, the FE model of the joint investigated in thispaper is shown.
The service load was given by measured time series(three forces Fx, Fy, Fz at 200 Hz sampling rate)representing the load of a typical day for this kind ofrailway vehicle. The time series were measured at the
This article, taken from the newly released NAFEMS publication “FEM Idealisation of Joints”,
takes a look at a project led by the department of “Mathematical Methods for Dynamics and
Durability” (MDF) at Fraunhofer ITWM in collaboration with a leading railway company, to analyse
multi-bolted joints and their durability behaviour under service loads.

stre
ss t
ime
sign
als
31benchmark january12
ball joint connecting two railway wagons.
Details of the bolt joint:• Type: M16 10.9, rolled before heat treatment, tapped
thread joint, thread insert • Tensile strength: 1000 MPa • Yield strength: 900 MPa
Overview of the FE model:• Elements: approx. 104.000 (predominantly
Hexahedron-Elements)• Material: Steel and Aluminium parts• Friction coefficient between the parts: = 0.3• Assembly preload at the bolts: FM = 41kN• Solver: ANSYS 10.0 (see [5] for further details)
Analysing the Nonlinear Behaviour of the StructureFor a first overview regarding the model behaviour underservice loads, the measured time series were analysed toidentify the load range. The time series contains threeforces Fx, Fy, Fz within the following range:
Fx acts along the longitudinal axis of the bolt. It mainlyrepresents the load acting on the bolt when thetrain accelerates (tensile stress) or due to braking events(compression stress).
Fy represents the load when the train is cornering.Depending on the curvature of the track, Fy createstensile stresses at the bolts located in the direction of theouter curve radius and compression stresses at the boltslocated in direction of the inner curve radius. It actsalong the lateral axis of the bolt.
Finally, Fz represents the part of the applied loads basedon outer loads (tare mass and payload). Fz also acts onthe lateral axis of the bolt. Depending on the drivingcondition of the railway vehicle, Fx and Fy may havenegative and positive signs while Fz only acts in thenegative direction.
To obtain an adequate resolution for the analysis, theload range was divided into 5kN steps and FEcomputations were performed on that grid. Fx wasassumed to act within -5kN to -45kN, Fy within -5kN to -60kN and Fz within -5kN to -40kN. Therefore the totalnumbers of calculations was 9 (Fx) + 12 (Fy) + 8 (Fx) = 29.For one single load step including the preceding loadstep ‘pretension’, the calculation time is up to two hours.So the overall used calculation time was 58 hours (nearly2 ½ days).
The equivalent stress results (von Mises) are plotted infigure 2. In each load direction the FEA model obviouslyshows nonlinear stress behaviour which is due to thenonlinear contact formulations.
Since linear superposition of these load cases is notallowed here, combinations of several loads had to becalculated in addition. For the combinations Fx/Fy, Fy/Fzand Fy/Fz. the same load step size of 5kN was used. Thus,we get 108 + 72 + 96 = 276 FE calculations, resulting in552 hours computation time (23 days).
As can be seen easily, the stress depends on the forcesagain in a nonlinear fashion.
Transferring this fine resolution of 5kN steps to thethree-dimensional load combinations, the overallcalculation time would add up to slightly more than 144days which of course was not executed. Nevertheless,the calculations performed so far clearly show thenonlinear behaviour of the stress as a function of theloads. Thus, linear quasi-static superposition is notapplicable and a new approach hadto be found.
Basic Idea of the Interpolation ApproachAs already mentioned, the current state of the artprocess for calculating the stress time histories due tolong load time series in combination with FEA models isthe so called “linear quasi-static superposition”approach. For this approach, static unit load cases si(x)
Figure 1: Finite element model of the railway ball jointconnected by a multi-bolted joint.
Figure 2: von Mises equivalent stress svunder single loads Fx, Fy and Fz.
Figure 3: von Mises equivalent stress sv under two-dimensional loads Fx and Fy for one selected FE node.
The legend refers to the value of Fx.
Fx [-45kN +45kN]; Fy [-60kN +60kN]; Fz [-5kN -40kN]
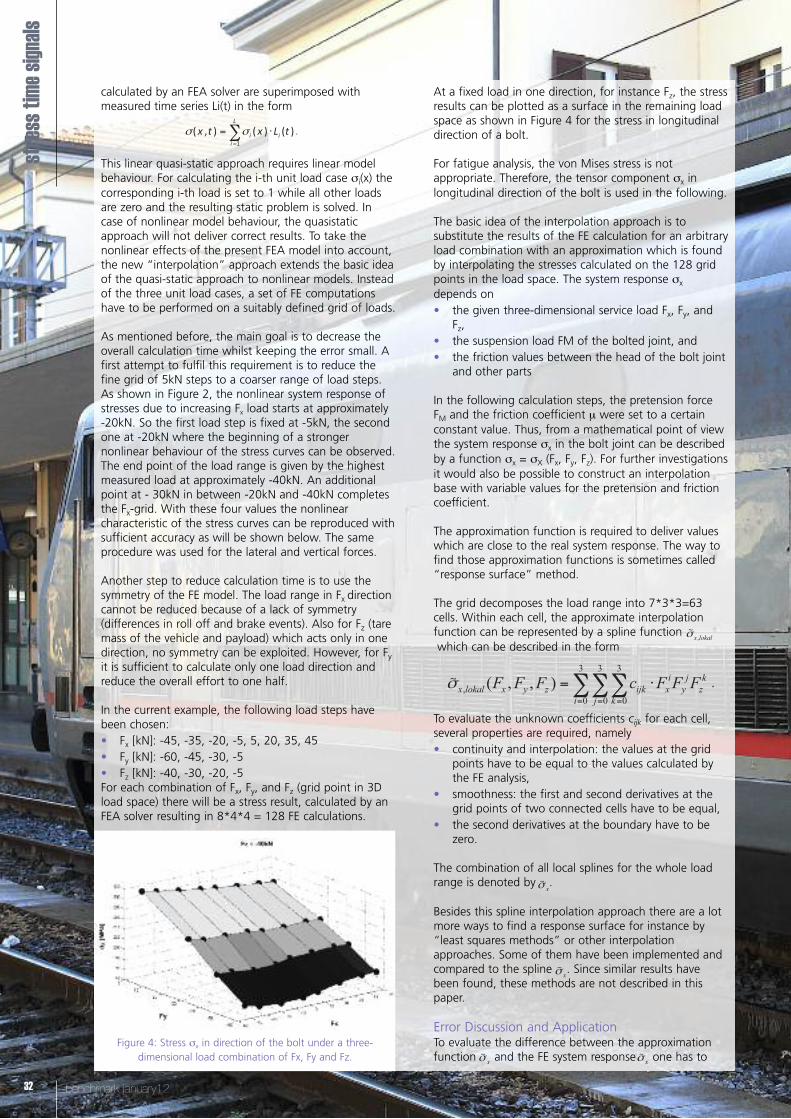
stre
ss t
ime
sign
als
benchmark january1232
calculated by an FEA solver are superimposed withmeasured time series Li(t) in the form
This linear quasi-static approach requires linear modelbehaviour. For calculating the i-th unit load case si(x) thecorresponding i-th load is set to 1 while all other loadsare zero and the resulting static problem is solved. Incase of nonlinear model behaviour, the quasistaticapproach will not deliver correct results. To take thenonlinear effects of the present FEA model into account,the new “interpolation” approach extends the basic ideaof the quasi-static approach to nonlinear models. Insteadof the three unit load cases, a set of FE computationshave to be performed on a suitably defined grid of loads.
As mentioned before, the main goal is to decrease theoverall calculation time whilst keeping the error small. Afirst attempt to fulfil this requirement is to reduce thefine grid of 5kN steps to a coarser range of load steps.As shown in Figure 2, the nonlinear system response ofstresses due to increasing Fx load starts at approximately-20kN. So the first load step is fixed at -5kN, the secondone at -20kN where the beginning of a strongernonlinear behaviour of the stress curves can be observed.The end point of the load range is given by the highestmeasured load at approximately -40kN. An additionalpoint at - 30kN in between -20kN and -40kN completesthe Fx-grid. With these four values the nonlinearcharacteristic of the stress curves can be reproduced withsufficient accuracy as will be shown below. The sameprocedure was used for the lateral and vertical forces.
Another step to reduce calculation time is to use thesymmetry of the FE model. The load range in Fx directioncannot be reduced because of a lack of symmetry(differences in roll off and brake events). Also for Fz (taremass of the vehicle and payload) which acts only in onedirection, no symmetry can be exploited. However, for Fyit is sufficient to calculate only one load direction andreduce the overall effort to one half.
In the current example, the following load steps havebeen chosen:• Fx [kN]: -45, -35, -20, -5, 5, 20, 35, 45• Fy [kN]: -60, -45, -30, -5• Fz [kN]: -40, -30, -20, -5For each combination of Fx, Fy, and Fz (grid point in 3Dload space) there will be a stress result, calculated by anFEA solver resulting in 8*4*4 = 128 FE calculations.
At a fixed load in one direction, for instance Fz, the stressresults can be plotted as a surface in the remaining loadspace as shown in Figure 4 for the stress in longitudinaldirection of a bolt.
For fatigue analysis, the von Mises stress is notappropriate. Therefore, the tensor component sx inlongitudinal direction of the bolt is used in the following.
The basic idea of the interpolation approach is tosubstitute the results of the FE calculation for an arbitraryload combination with an approximation which is foundby interpolating the stresses calculated on the 128 gridpoints in the load space. The system response sxdepends on• the given three-dimensional service load Fx, Fy, and
Fz,• the suspension load FM of the bolted joint, and• the friction values between the head of the bolt joint
and other parts
In the following calculation steps, the pretension forceFM and the friction coefficient μ were set to a certainconstant value. Thus, from a mathematical point of viewthe system response sx in the bolt joint can be describedby a function sx = sX (Fx, Fy, Fz). For further investigationsit would also be possible to construct an interpolationbase with variable values for the pretension and frictioncoefficient.
The approximation function is required to deliver valueswhich are close to the real system response. The way tofind those approximation functions is sometimes called“response surface” method.
The grid decomposes the load range into 7*3*3=63cells. Within each cell, the approximate interpolationfunction can be represented by a spline function which can be described in the form
To evaluate the unknown coefficients cijk for each cell,several properties are required, namely• continuity and interpolation: the values at the grid
points have to be equal to the values calculated bythe FE analysis,
• smoothness: the first and second derivatives at thegrid points of two connected cells have to be equal,
• the second derivatives at the boundary have to bezero.
The combination of all local splines for the whole loadrange is denoted by .
Besides this spline interpolation approach there are a lotmore ways to find a response surface for instance by“least squares methods” or other interpolationapproaches. Some of them have been implemented andcompared to the spline . Since similar results havebeen found, these methods are not described in thispaper.
Error Discussion and ApplicationTo evaluate the difference between the approximationfunction and the FE system response one has to
Figure 4: Stress sx in direction of the bolt under a three-dimensional load combination of Fx, Fy and Fz.
=
= .
3 3 3
,0 0 0
( , , ) i j kx lokal x y z ijk x y z
i j kF F F c F F F
= = =
= . ~
,x lokal ~
x~
x~
x~
x~

stre
ss t
ime
sign
als
33benchmark january12
find suitable deviation measures either based on theabsolute error rabsolute=sx -sx or the relative error
. Here, the maximum error, the meanabsolute error, or the mean relative squared error at acertain set of test points (Fx,i,Fy,i,Fzi,),i=1,...,L can be used.As mentioned by Schumacher [2] another qualitymeasure is the so called regression parameter R2 which isdefined by
where L is the number of test points, the valuecalculated by FE analysis, sx,i the response surface valueand
the mean value of the highest and lowest stress. Thismeasure is quite similar to the variance reductionmentioned in [3] for which is the mean value of allinspected stress values.
To evaluate the error of the approximation function, thegrid points can only be used in the case of the leastsquares approach. For the interpolation approach theerror on the grid points is zero by definition.
Therefore, new combinations besides the grid pointshave to be calculated by FE analysis. The following tablegives an overview of the error between interpolated andFE results for 8 chosen test points.
Table 1: Error between interpolated results and FEA results.
In all of these 8 test points, the relative error is at most1%, the absolute error at most 3 MPa. Thus, theinterpolation approach was judged to be accurateenough to calculate the stress results for the multi-boltedjoint.
By evaluation of for all timesamples t of the measured loads Fx(t), Fy(t), Fz(t) theinterpolation approach delivers time series ofinterpolated stress results for all interesting positions ofeach bolted joint.
For each bolt 48 spots have been selected which gives intotal 192 time series. Once the interpolation function hasbeen obtained, the effort to calculate these stress timeseries is only several minutes, even for the longmeasured time series with over 3 mill. sampling points.
Based on these results, it is a straightforward task toperform fatigue life estimations for the bolts of thestructure under investigation. This step is not describedhere.
ConclusionIn this paper, an extension of the well established linearquasi-static approach was introduced. It could be shownthat the interpolation approach can take nonlineareffects into account, in contrast to the linear quasi-staticapproach.
It was also shown that the error of the interpolationapproach was small enough for the bolted joint structuredescribed here.
The overall time spent to obtain fatigue life estimationsof the multi-bolted joint could be limited to a couple ofdays for the structure under investigation.
The time spent for the FE calculations to build up theinterpolation basis took nearly 10 days on a single CPUmachine. The calculation of the interpolation functiontook only several minutes. Also the calculation of theinterpolated stress time signals at the spots of interestand the subsequent fatigue life estimation can be donevery quickly.
Compared to the standard way of performing an FEanalysis for each sample point of the measured load timesignals, the interpolation approach decreases thecalculation time in a tremendous way.
However, the approach described in this article appliesonly to loads and structures where a quasi- staticbehaviour can be assumed. Thus, the loads have to beslowly varying compared to the eigen- frequencies of thestructure.
References[1] Verein Deutscher Ingenieure e.V.: „Systematic calculation of high
duty bolted joints / Joints with one cylindrical bolt”, VDI 2230 Part 1,Feb. 2003, 171 Pages
[2] Schumacher, A.: “Optimierung mechanischer Strukturen:Grundlagen und industrielle Anwen- dungen”, Springer, 2005, 308Pages
[3] Wolberg, J.: “Data analysis using the method of least squares”,Springer, 2006, 250 Pages
[4] Wiegand, H., Kloos, K.-H., Thomala, W.: „Schraubenverbindungen“,Springer, 2007, 428 Pages
[5] ANSYS 10.0 Online help
x xrelative
x
r =~
2, ,2 1
2,1
( )1
ˆ( )
Lx i x ii
Lx i xi
R =
=
= , ~
,i ,min( , 1,..., ) max( , 1,..., )ˆ
2x x i
x
i L i L= + ==
( ) ( ( ), ( ), ( ))x x x y zt F t F t F t= ~ ~
Load combination Error Fx, Fy, Fz [kN] Absolute [MPa] Relative [%] -27.5, -50, -30 -1.3 -0.6 -27.5, -50, -15 0.9 0.3 -27.5, -15, -30 -2.7 -0.9 -27.5, -15, -15 2.8 0.8 12.5, -50, -30 0.9 0.4 12.5, -50, -15 -3.1 -1.1 12.5, -15, -30 1.5 0.5 12.5, -15, -15 2.7 0.8
,x i~
ˆ x

Albrecht Pfaff brings more than 25 years of CAEindustry experience in Management, Sales &Marketing to MSC. He joined MSC in 1990 anddeveloped MSC's business and market position inEurope – during this time he strongly focused onthe EMEA Aerospace Industry – the largest
industry segment in MSC. Albrecht has drivenoperational excellence, achieved continuedrevenue growth and developed close strategicrelationship with key Aerospace customers.
>>>>>>>>>>
albrecht Pfaff Vice President simmanager Business Unit, msC software
Albrecht Pfaff, heading up the SimManager Business Unit, EMEA in MSC Software, discusses developments inSimulation Data and Process Management, current achievements and the future potential of SDM.
Indeed, MSC`s first customer BMW started over 10 yearsago with a production environment to manage theirsimulation data, primarily in NVH and Crash. The firstdeployment - called CAE-Bench - already supported theHPC integration and, to a large extent, automated themanual process of job submission to number crunchers orcluster computing.
In the early 2000s, a significant portion of the deploymentwas based on custom-development. The underlyingsoftware was a framework, which was tuned andcustomized by local software consultants.
In 2005, MSC introduced the first release of SimManager– a standard product to manage CAE and simulation dataand processes. Since then a great number of leadingmanufacturing companies have invested in SDM anddeployed SimManager to improve their PLM process andinclude Simulation Data and Process Management in theircompany PLM strategy.
Today, we have customers with more than 400-500 CAEusers simulating 1500 – 2000 simulations a day (!) withSimManager. For these deployments, automation is a verycritical and important criterion. Only with a highlyautomated process, such an incredible volume ofsimulation can be performed. SimManager supports thisvia its newly developed Simulation Generator and theencapsulation of the End-to- End simulation processautomation. SimManager can be seen as a “SimulationMachine” - allowing our customers to run simulation in aconsistent standard manner, avoiding the very individual“handmade” pattern where each simulation is one of akind and difficult to compare simulations performed bydifferent analysts of the past. SimManager has proven inall industries (Automotive, Aerospace & Defense,Electronics, Packaging, Shipbuilding, Machinery, etc.) tosupport the transition of their processes to a morerepeatable, reliant and consistent pattern.
MSC was one of the first companies with a SDM solution on the market – what hasbeen achieved in the industry so far?
Absolutely. Many companies around the world haveinvested multi-millions in PLM and PDM - however withvery few (below 5%) including simulation processes anddata in a comprehensive manner. CAE data and simulationprocesses do not lend themselves to being included in theoverall pattern of the PLM process. This is very surprisingin the light of simulation having become a criticalcomponent of the overall development process. In fact,most CAE departments are still not fully integrated in thePLM process.
Only very few thought-leaders and early-adopters havebeen able to integrate their simulation processes and datainto a PLM solution, establishing a Virtual Engineering &Development process. In our eyes, one of the key successfactors is establishing a separate SDM solution for thesimulation environment, which can then be integrated asa component in the overall PLM. Consistent interfaces
between the SDM solution and the PLM, particularly thePDM, allow for the exchange of data between both. CAEanalysts can pull product data from the PDM system, canretrieve the actual CAD models and will automatically beinformed, if newer design changes are already available.In return, Project Managers can retrieve the latestsimulation results from the PDM system and discuss thoseresults in the project team meeting without beingdependent on the individual CAE analyst.
For compliance reasons it is important to track relevantsimulation results - even many years after the work hasbeen finalized – to easily understand the completedecision chain of a simulation process.
When physical tests are replaced by virtual testing, it is“mission-critical” to have the complete audit trail of thesimulation chain.
Are we close to closing the simulation gap in PLM?
vend
or v
iew
34 benchmark january12

This question is usually raised by the IT-department. Forthe CIO, it is just another system with more hardware,support, infrastructure and life-time cost. However, aregular PDM System does not meet the requirements ofthe simulation department. Actually, CAE analysts are notwilling to use a PDM system as it does not reflect theirbusiness process. Simulation engineers have specificrequirements, which today’s PDM systems are notdesigned for and will have a hard time supporting for theforeseeable future.
One of the most important key technologies of an SDMsystem is the “Audit trail”. As engineers usually share lotsof data across the enterprise, it is very important to trackwhere the data came from and where the data has beenused elsewhere.
First, simulation data follows different life-cycles and thereare huge amounts of design variants with multiple
simulation disciplines to be managed, which contradictthe goal of a PDM system to manage and contain variantsand alternatives and drive the design to a conclusive endresult. So, simulation data cannot be managed as purelyextending a PDM-instance, instead a separate instanceneeds to be established. This allows the PDM system toevolve at their rate of speed, which is substantiallydifferent, as evolutions of methods and approaches in thesimulation environment are quite fast requiring constantadoptions.
Particularly, there are many unique requirements in thesimulation process, for which PDM systems are notdesigned in the first place and have a hard time to cover.This relates to the higher level of process automation (e.g.utilizing HPC environments) and the consistent auditing ofthe simulation process needing to be more integral.
Why not include SDM in the PDM System? Why should companies buy and installanother IT-System which needs to be maintained and integrated in the existing ITworld?
Yes – we have several customers who have linked theirSimManager with their PDM System (e.g. TeamCenter,VPM, Windchill, SmartTeam or inhouse-PDM). Today, wehave two different approaches:• Native – links both systems via a connector based on
XML• OpenPDM – uses the OpenPDM technology and runs a
broker on a neutral layer
Both technologies have been proven in productionenvironments and support the overall PLM process.
With those integration techniques, we meet the PLMneeds and have SDM systems which fulfil therequirements of the CAE engineers.
So how do you connect PDM and SDM? Has MSC already made some real lifedeployments?
Before joining MSC, he was six years with GeneralElectric, and managed an international teamresponsible for CAD/CAM-Applications. In the late80s, he developed and pioneered the mostinnovative European Automation Center at GEAutomation to integrate CAD/CAM technologies
into the wide range of CIM capabilities.
Albrecht holds a graduate mechanical engineeringdegree from Polytechnikum Giessen and is amember of the NAFEMS DACH steeringcommittee.
SDM is required by all companies independent ofcompany size sooner or later. The real question is howcritical are simulations for their virtual developmentprocess and can the current CAE team deliver theexpectations of the companies vision. Many companieshave a vision towards a Virtual Product Development –some industry leaders already have this VPD process inplace today. Actually we have examples of companies withsmall CAE-departments, which use SDM to “democratize”
simulation throughout their organization, exposingstandard processes to the broader community andincrease the use of simulation without having to grow theCAE-departments (Front loading simulation).
Clearly an OEM with several hundred CAE analysts andchallenging problems handling consistently simulationdata across multiple disciplines almost mandates theintroduction of a SDM solution.
Is SDM only for large OEMs with several hundred CAE users?
We see today investments in SDM as a “strategicdecision”, although all of our customers who havecompleted this step as an early-adopter report greatreturns. Some of them confirm that they could not dotheir job without a system like SimManager. One customerrates a 35% engineering productivity increase andanother has significantly reduced their lead time ofsubmitting technical proposals to customer inquiries from30 days down to 3 days. Another customer has tightlyintegrated their physical testing with the virtual testingworld to save millions in very expensive prototypes. Someglobal companies use SimManager to manage theirworldwide supply chain and engineering partners. In
summary, we do have many examples where our earlyadopters have been able to materialize their investmentsin SDM with great returns – both tangible and non-tangible.
SDM is perceived as a “Force-Multiplier” in Engineeringand Simulation. Companies who have adopted SDM havebeen able to perform many more simulations (moredisciplines, more design variants, more innovation). Manyexperienced engineers may be close to retirement and it isoften difficult to find new CAE analysts - the gap of fillingthose additional resource requirements can now be solvedmuch more efficiently and effectively.
What will customers gain from such an investment – can you measure the ROI?ve
ndor
vie
w
35benchmark january12

Lewis Fry Richardson “The father of Weather forecasting”
It seems almostinconceivable that LewisFry Richardson (1881 –1953) could have computed
the first numerical solution ofthe partial differentialequations governing theweather1, by hand, and whilstserving as an ambulancedriver at the French front inthe 1914-1918 war. Yet that isthe truth of the matter, for hewas an extraordinary man.
Born in Newcastle upon Tyne inthe north-east of England, he wasthe youngest of seven childrenfrom Quaker parents. Followingearly education at Bootham’sQuaker school, York, and twoyears at Durham College ofScience (eventually becoming theUniversity of Newcastle uponTyne), he studied physics atKing’s College, Cambridge,graduating with a first, in 1903.He remained at Cambridge forten years, holding a number ofresearch posts and positions inindustry. It was while working asa chemist with the National PeatIndustry Limited, 1906 -1907,that he was faced with the taskof calculating the percolation ofwater through peat. This is adiffusion problem and so isgoverned by the Laplaceequation, but the difficulty hefound was that the boundary ofthe region had a complextopography, meaning that exactsolutions could not be found. Inanticipation of his later work inthe numerical modelling ofweather, he based his solution ona finite difference methodology.Following publication of hismethodology2 he submitted it as
a dissertation in a competition fora Fellowship at King’s College,but apparently mathematiciansfrom Trinity College were of theopinion that this was“approximate mathematics andwere not impressed”3. Richardsonnever returned to Cambridge.
Instead, in 1913, he joined theMeteorological Office, asSuperintendent of theEskdalemuir Observatory,Scotland. It was here that heworked on numerical methods forforecasting the weather, writing afirst draft of the book1 which waseventually to be published in1922. He resigned in May 1916and joined the Friends AmbulanceUnit in France, working alongsideFrench military ambulances,transporting wounded soldiers,often under shell fire. Over thenext two years he refined hisnumerical methods and carriedout the forecast described in his1922 book, essentially providingthe first ‘CFD’ solution of theNavier-Stokes equations whichgovern fluid flow. Let us readwhat Richardson has to say abouthis computations and in particularhis imaginings of a “forecast-factory”:
The Speed and Organizationof Computing1
“It took me the best part of sixweeks to draw up thecomputing forms and to workout the new distribution intwo vertical columns for thefirst time. My office was aheap of hay in a cold restbillet. With practice the workof an average computer mightgo perhaps ten times faster. If
the time-step were 3 hours,then 32 individuals could justcompute two points so as tokeep pace with the weather, ifwe allow nothing for the verygreat gain in speed which isinvariably noticed when acomplicated operation isdivided up into simpler parts,upon which individualsspecialize.
If the co-ordinate chequerwere 200 km square in plan,there would be 3200 columnson the complete map of theglobe. In the tropics theweather is often foreknown,so that we may say 2000 activecolumns. So that 32 x 2000 =64,000 computers would beneeded to race the weatherfor the whole globe. That is astaggering figure.
Perhaps in some years' time itmay be possible to report asimplification of the process.But in any case, theorganization indicated is acentral forecast-factory for thewhole globe, or for portionsextending to boundarieswhere the weather is steady,with individual computersspecializing on the separateequations. Let us hope fortheir sakes that they aremoved on from time to timeto new operations.
After so much hard reasoning,may one play with a fantasy ?Imagine a large hall like atheatre, except that the circlesand galleries go right roundthrough the space usuallyoccupied by the stage. The
icon
s of
CfD
36 benchmark january12

icon
s of
CfD
37benchmark january12
walls of this chamber are paintedto form a map of the globe. Theceiling represents the north polarregions, England is in the gallery,the tropics in the upper circle,Australia on the dress circle andthe antarctic in the pit.
A myriad computers are at workupon the weather of the part ofthe map where each sits, buteach computer attends only toone equation or part of anequation. The work of eachregion is coordinated by anofficial of higher rank. Numerouslittle "night signs" display theinstantaneous values so thatneighbouring computers canread them. Each number is thusdisplayed in three adjacent zonesso as to maintain communicationto the North and South on themap. From the floor of the pit atall pillar rises to half the heightof the hall. It carries a largepulpit on its top. In this sits theman in charge of the wholetheatre; he is surrounded byseveral assistants andmessengers. One of his duties is
to maintain a uniform speed ofprogress in all parts of the globe.In this respect he is like theconductor of an orchestra inwhich the instruments are slide-rules and calculating machines.But instead of waving a baton heturns a beam of rosy light uponany region that is running aheadof the rest, and a beam of bluelight upon those who arebehindhand.
Four senior clerks in the centralpulpit are collecting the futureweather as fast as it is beingcomputed, and despatching it bypneumatic carrier to a quietroom. There it will be coded andtelephoned to the radiotransmitting station.
Messengers carry piles of usedcomputing forms down to astorehouse in the cellar.In a neighbouring building thereis a research department, wherethey invent improvements. Butthere is much experimenting ona small scale before any changeis made in the complex routine
of the computing theatre.
In a basement an enthusiast isobserving eddies in the liquidlining of a huge spinning bowl,but so far the arithmetic provesthe better way. In anotherbuilding are all the usualfinancial, correspondence andadministrative offices. Outsideare playing fields, houses,mountains and lakes, for it wasthought that those who computethe weather should breathe of itfreely.”
This is a remarkable vision, in which‘computer’ means only one thing: ahuman calculator.
During his time in France,Richardson had calculated theweather for a six hour period overGermany, applying a precise anddetailed implementation of analgorithm outlined by theNorwegian scientist VilhelmBjerknes. It was a spectacularfailure, greatly over-predicting therate of pressure rise. Themathematical techniques were
icon
s of
CfD
38 benchmark january12
AcknowledgementMuch of the material for this article is gratefully drawn from Prof. Julian Hunt’s excellent review3 of the life and contributionsof Lewis Fry Richardson.
References[1] 1. Richardson L F, 1922, “Weather prediction by numerical process”, Cambridge University Press.
[2] Richardson L F, 1910, “The approximate arithmetical solution by finite differences of physical problems involving differential equations,with an application to the stresses in a masonry dam”, Phil. Trans. Roy. Soc. London, Ser. A, Vol. 210: pp 307 – 357.
[3] Hunt J C R, 1998, “Lewis Fry Richardson and his contributions to mathematics, meteorology, and models of conflict”, Annual Review ofFluid Mechanics, Vol. 30, pp xiii – xxxvi.
[4] Lynch P, 2004, “Richardson’s Forecast: What went wrong?”, Symposium on the 50th Anniversary of Operational Numerical WeatherPrediction, University of Maryland, College Park, MD, 14 – 17 June,www.ncep.noaa.gov/nwp50/Presentations/Tue_06_15_04/Session_1/Lynch_NWP50.pdf
[5] Richardson L F and Stommel H, 1948, “Note on eddy diffusion in the sea”, J. Meteorology, Vol. 5, pp 238 – 240.
[6] Richardson L F, 1927, “The deferred approach to the limit”, Phil. Trans. Roy. Soc. London, Ser. A, Vol. 226, pp 299 – 361. “Part I. SingleLattice.” “Part II. Interpenetrating Lattices” by J A Gaunt.
correct, but we now know thatthe initial conditions whichRichardson used were ‘noisy’ andneeded to be ‘smoothed’. Inaddition, Richardson’scomputational time-step was toolarge. Peter Lynch4 provides aninteresting analysis ofRichardson’s prediction.
Nevertheless, through hisaudacious calculations Richardsonhad shown that numericaltechniques could be applied tosolve what appeared to beintractable physical problems.
Richardson rejoined the Met.Office upon his return fromFrance in 1919. However, whenthe Met. Office was brought intothe Air Ministry at the insistenceof Winston Churchill – and theAir Ministry controlled the RAF -Richardson’s pacifist convictionsmeant that he had no option butto resign. He continued hisresearch whilst lecturing atWestminster Training College,where he taught physics andmathematics to prospectiveschool teachers, publishingnumerous papers and makingoutstanding contributions in themeteorological field. He gives hisname to the Richardson number;a key non-dimensional parameterfor turbulent flows affected bystratification caused by buoyancy.In a meteorological context, theRichardson number represents aratio of thestabilizing/destabilizing effects ofvertical density gradients onturbulent mixing, compared toshear-generated turbulent mixing.
The Richardson number is acrucial parameter in the field ofatmospheric dispersion. For hiscontributions to the field ofmeteorology, he was elected as aFellow of the Royal Society ofLondon, in 1926.
It was in 1926 that Richardsoncompletely changed his field ofresearch, to psychology, againmaking important contributions –in particular in experimental andmathematical modelling methodsin the field of sensory perception.In 1929 he moved to theTechnical College in Paisley, butfrom 1935 his research shifted toyet another field; mathematicaltheories of human conflict andthe causes of war. He pursuedthese studies until his retirement,in 1943, and in the process wasfirst to characterise the irregularityof borders between countries byan index which we now recogniseto be a fractal dimension.However, his research efforts didnot end upon retirement, as in1948 he published a key paper5
on the diffusion of particles inturbulent flow, apparently basedon experiments in which he andHenry Stommel threw parsnipsinto Loch Long – close to his lasthome. Richardson was a bold visionarywhose work has had a lastingimpact. For instance, he devised amethod2,6 for the extrapolation ofnumerical solutions which iswidely used today. However, wefinish with a rhyme which hewrote to illustrate the cascade ofenergy from the large to smallscales in turbulent flows, to be
found on page 66 of his 1922book, which incidentally is still inprint - as a 2007 second editionwith foreword by Peter Lynch.
“Big whirls have little whirlsthat feed on their velocity, andlittle whirls have lesser whirlsand so on to viscosity”
Lewis Fry Richardson is mostcertainly an ‘Icon of CFD’, fromthe days of ‘human computers’.
AUTHOR INFORMATIONChris Lea I Lea CFD [email protected]

john
elli
son
hors
pool
39benchmark january12
It is with much regret that wereport the death of John Horspool.John died on the 23rd November2011 after a year-long battle withcancer. He was a major
contributor to the movement forhighly-realistic, accurate andmeaningful Finite Element Analysis(FEA). He was passionate aboutgenuine quality in FEA and theanalysis community has lost a keyplayer who can never be replaced.
John was born on the 25th Janauary1957 and attended the LydneyGrammar School. He then attendedthe University of Southampton andgained an honours degree inAcoustical Engineering (1975-1978).He then joined British Leyland Cars asa Stress Engineer.
In 1980 John joined Dowty Aerospace(now Messier-Buggati-Dowty) inGloucester and remained at thatcompany until the time of his death.John therefore spent most of his
working life in the aviation andaerospace industry. John waspromoted to Principal Engineerresponsible for the detailed FEA stressanalysis of a wide selection ofundercarriage components such asmain / nose leg fittings for a varietyof aircraft including Airbus A320,A340, A350, BAe 146, SD360etcetera.
John expressed his passion for qualitythrough his excellent work forMessier-Bugatti-Dowty and throughthe secondary channel of the“Roshaz” program. In “Roshaz” Johndeveloped a superb geometry pre-processing and results-viewing systemthat was more advanced than many(he would say most!) of theestablished systems that we see inwidespread use around the worldtoday. John ensured that the“Roshaz” program embodied thebest-practice methods that he stoodfor in the entirety of his working life.John paid little attention to pretty
pictures but took the time andtrouble to see that the loads weresensible and that they were applied ina realistic fashion. Many systems arenow beginning to follow his lead andthis is credit to John’s first-rate work.
John leaves a devoted wife, Teresa,and two children, Ross and Hazel (towhich the program “Roshaz” wasdedicated). Should readers wish tocontribute to a fund set-up in John’sname then they can send donationsmade payable to “Cancer ResearchUK” care of Philip Blatchly & Son,Regents Court, Regents Street,LYDNEY, Gloucester, GL15 5RL, UK.
If the “Pearly Gates” need anystressing work doing then we can besure that John will oblige with hisusual dedication and accuracy!
Compiled by friends andcolleagues of John Horspool
save 20% with NafEms Publication Collections
www.nafems.org/publications
How to-How to-Ensure that CFD for Industrial
Applications is ‘Fit for Purpose’
How to-How to-Get Strated with
Computaional Fluid Dymanics
Collections available:
� Contact
� FE Introduction
� Introduction to CFD
� Quality Assurance

indu
stry
eve
nts
40 benchmark january12
50th AIAA Aerospace Sciences MeetingNashvilleUSA
Jan
92012
SydneyAustralia
TampereFinland
MumbaiIndia
San DiegoUSA
MunichGermany
AmsterdamNetherlands
OrlandoUSA
NoordwijkThe Netherlands
OrlandoUSA
www.nafems.org/industryevents
International Computational ModelingValidation Conference
Jan
142012
Ideal PLM Technology Day
Jan
262012
International Simulation Conference of India 2012
Feb
22012
SolidWorks World 2012
Feb
122012
PLM Innovation 2012
Feb
222012
GothenburgSwedenLMS Nordic User Conference
Mar
82012
STAR Global Conference 2012
Mar
192012
PLM 2012
Mar
192012
European Conference on SpacecraftStructures, Materials & Environmental Testing
Mar
202012
SpringSim '12
Mar
262012

