benchmark electronics, inc. · pdf filebenchmark electronics, inc. (exact name of registrant...
TRANSCRIPT

UNITED STATES SECURITIES AND EXCHANGE COMMISSION
Washington, D.C. 20549 _______________
FORM 10-Q _______________
X QUARTERLY REPORT PURSUANT TO SECTION 13 OR 15(d) OF THE SECURITIES EXCHANGE ACT OF 1934
For the quarterly period ended September 30, 2017 __ TRANSITION REPORT PURSUANT TO SECTION 13 OR 15(d) OF THE SECURITIES EXCHANGE ACT OF 1934
For the transition period from _________________ to________________
Commission File Number: 1-10560
BENCHMARK ELECTRONICS, INC. (Exact name of registrant as specified in its charter)
Texas 74-2211011 (State or other jurisdiction (I.R.S. Employer
of incorporation or organization)
Identification No.)
4141 N. Scottsdale Road 85251 Scottsdale, Arizona (Zip Code)
(Address of principal executive offices)(623) 300-7000
(Registrant’s telephone number, including area code)
Indicate by check mark whether the registrant (1) has filed all reports required to be filed by Section 13 or 15(d) of the Securities Exchange Act of 1934 during the preceding 12 months (or for such shorter period that the registrant was required to file such reports), and (2) has been subject to such filing requirements for the past 90 days. Yes [] No [ ]
Indicate by check mark whether the registrant has submitted electronically and posted on its corporate Web site, if any, every Interactive Data File required to be submitted and posted pursuant to Rule 405 of Regulation S-T (§232.405 of this chapter) during the preceding 12 months (or for such shorter period that the registrant was required to submit and post such files). Yes [] No [ ]
Indicate by check mark whether the registrant is a large accelerated filer, an accelerated filer, a non-accelerated filer, or a smaller reporting company. See the definitions of “large accelerated filer,” “accelerated filer,” “smaller reporting company” and “emerging growth company” in Rule 12b–2 of the Exchange Act.
Large accelerated filer [] Accelerated filer [ ] Non-accelerated filer [ ] (Do not check if a smaller reporting company) Smaller reporting company [ ] Emerging growth company [ ]
If an emerging growth company, indicate by check mark if the registrant has elected not to use the extended transition period for complying with any new or revised financial accounting standards provided pursuant to Section 13(a) of the Exchange Act. [ ]
Indicate by check mark whether the registrant is a shell company (as defined in Rule 12b–2 of the Act). Yes [ ] No []
As of November 7, 2017, there were 49,723,053 shares of Common Stock of Benchmark Electronics, Inc., par value $0.10 per share, outstanding.
TABLE OF CONTENTS
PART I
Page PART I—FINANCIAL INFORMATION Item 1. Financial Statements (Unaudited) 1 Condensed Consolidated Balance Sheets 1 Condensed Consolidated Statements of Income 2 Condensed Consolidated Statements of Comprehensive Income 3 Condensed Consolidated Statement of Shareholders’ Equity 4 Condensed Consolidated Statements of Cash Flows 5 Notes to Condensed Consolidated Financial Statements 6 Item 2. Management’s Discussion and Analysis of Financial Condition and 20 Results of Operations Item 3. Quantitative and Qualitative Disclosures About Market Risk 27 Item 4. Controls and Procedures 28 PART II—OTHER INFORMATION Item 1. Legal Proceedings 29 Item 1A. Risk Factors 29 Item 2. Unregistered Sales of Equity Securities and Use of Proceeds 29 Item 6. Exhibits 30 SIGNATURES 31

See accompanying notes to condensed consolidated financial statements. 1
PART I - FINANCIAL INFORMATION Item 1. Financial Statements.
BENCHMARK ELECTRONICS, INC. AND SUBSIDIARIES Condensed Consolidated Balance Sheets
September 30, December 31,
(in thousands, except par value) 2017 2016
(unaudited)
Assets Current assets: Cash and cash equivalents $ 730,146 $ 681,433 Accounts receivable, net of allowance for doubtful accounts of $1,802 and $2,838, respectively 411,550 440,692 Inventories 421,858 381,334 Prepaid expenses and other assets 42,150 28,057 Income taxes receivable 199 146 Total current assets 1,605,903 1,531,662 Property, plant and equipment, net of accumulated depreciation of $423,520 and $406,375, respectively 178,122 166,148 Goodwill 191,616 191,616 Deferred income taxes 4,908 6,572 Other, net 96,157 102,670 $ 2,076,706 $ 1,998,668 Liabilities and Shareholders’ Equity Current liabilities: Current installments of long-term debt and capital lease obligations $ 16,804 $ 12,396 Accounts payable 335,315 326,249 Income taxes payable 3,629 3,534 Accrued liabilities 90,045 70,202 Total current liabilities 445,793 412,381 Long-term debt and capital lease obligations, less current installments 197,766 211,252 Other long-term liabilities 8,236 9,570 Shareholders’ equity: Preferred stock, $0.10 par value; 5,000 shares authorized, none issued — — Common stock, $0.10 par value; 145,000 shares authorized; issued and outstanding – 49,822 and 49,330, respectively 4,982 4,933 Additional paid-in capital 640,472 626,306 Retained earnings 788,939 748,402 Accumulated other comprehensive loss (9,482) (14,176) Total shareholders’ equity 1,424,911 1,365,465 Commitments and contingencies $ 2,076,706 $ 1,998,668

See accompanying notes to condensed consolidated financial statements. 2
BENCHMARK ELECTRONICS, INC. AND SUBSIDIARIES Condensed Consolidated Statements of Income
(unaudited) Three Months Ended Nine Months Ended September 30, September 30, (in thousands, except per share data) 2017 2016 2017 2016 Sales $ 603,550 $ 574,341 $ 1,786,955 $ 1,702,908Cost of sales 545,395 521,519 1,621,153 1,546,915 Gross profit 58,155 52,822 165,802 155,993Selling, general and administrative expenses 32,093 28,085 97,079 85,082Amortization of intangible assets 2,736 3,170 7,698 8,945Restructuring charges and other costs 2,511 3,485 5,566 9,876 Income from operations 20,815 18,082 55,459 52,090Interest expense (2,324) (2,302) (6,861) (6,935)Interest income 1,334 577 3,621 1,170Other expense (394) (383) (1,305) (535) Income before income taxes 19,431 15,974 50,914 45,790Income tax expense (benefit) 1,919 (5,768) 6,539 311 Net income $ 17,512 $ 21,742 $ 44,375 $ 45,479
Earnings per share: Basic $ 0.35 $ 0.44 $ 0.89 $ 0.92
Diluted $ 0.35 $ 0.44 $ 0.88 $ 0.91
Weighted-average number of shares outstanding: Basic 49,865 48,965 49,716 49,377
Diluted 50,330 49,414 50,292 49,878

See accompanying notes to condensed consolidated financial statements. 3
BENCHMARK ELECTRONICS, INC. AND SUBSIDIARIES Condensed Consolidated Statements of Comprehensive Income
(unaudited) Three Months Ended Nine Months Ended September 30, September 30, (in thousands) 2017 2016 2017 2016 Net income $ 17,512 $ 21,742 $ 44,375 $ 45,479Other comprehensive income (loss): Foreign currency translation adjustments 1,313 299 4,434 815 Unrealized gain on investments, net of tax 3 1 19 17 Unrealized gain (loss) on derivative, net of tax 89 765 254 (2,134) Other - (1) (13) (1)Other comprehensive income (loss) 1,405 1,064 4,694 (1,303) Comprehensive income $ 18,917 $ 22,806 $ 49,069 $ 44,176

See accompanying notes to condensed consolidated financial statements. 4
BENCHMARK ELECTRONICS, INC. AND SUBSIDIARIES Condensed Consolidated Statement of Shareholders’ Equity
(unaudited) Accumulated
Common Stock Additional Other Total
Shares Par Paid-in Retained Comprehensive Shareholders’
(in thousands) Outstanding Value Capital Earnings Loss Equity
Balances, December 31, 2016 49,330 $ 4,933 $ 626,306 $ 748,402 $ (14,176) $ 1,365,465Stock-based compensation expense - - 6,819 - - 6,819Shares repurchased and retired (183) (18) (2,031) (3,838) - (5,887)Stock options exercised 502 50 9,778 - - 9,828Vesting of restricted stock units 185 18 (18) - - -Shares withheld for taxes (12) (1) (382) - - (383)Net income - - - 44,375 - 44,375Other comprehensive income - - - - 4,694 4,694Balances, September 30, 2017 49,822 $ 4,982 $ 640,472 $ 788,939 $ (9,482) $ 1,424,911

See accompanying notes to condensed consolidated financial statements. 5
BENCHMARK ELECTRONICS, INC. AND SUBSIDIARIES Condensed Consolidated Statements of Cash Flows
(unaudited) Nine Months Ended
September 30,
(in thousands) 2017 2016
Cash flows from operating activities: Net income $ 44,375 $ 45,479 Adjustments to reconcile net income to net cash provided by operating activities: Depreciation 27,452 31,623 Amortization 9,139 10,379 Deferred income taxes 1,505 2,577 Gain on the sale of property, plant and equipment (194) (119) Asset impairments 42 121 Stock-based compensation expense 6,819 4,302 Excess tax benefits from stock-based compensation - (299) Changes in operating assets and liabilities, net of effects from business acquisition: Accounts receivable 30,926 61,776 Inventories (38,778) 13,991 Prepaid expenses and other assets (12,066) (302) Accounts payable 3,922 59,183 Accrued liabilities 15,637 19 Income taxes 1,111 (146) Net cash provided by operations 89,890 228,584Cash flows from investing activities: Proceeds from sales of investments at par 250 200 Additions to property, plant and equipment (35,033) (24,126) Proceeds from the sale of property, plant and equipment 270 237 Additions to purchased software (2,703) (1,272) Business acquisition, net of cash acquired - 10,750 Other (156) (224) Net cash used in investing activities (37,372) (14,435)Cash flows from financing activities: Proceeds from stock options exercised 9,828 5,544 Employee taxes paid for shares withheld (383) (554) Excess tax benefits from stock-based compensation - 299 Principal payments on long-term debt and capital lease obligations (9,288) (9,224) Share repurchases (5,887) (40,862) Debt issuance costs (433) - Net cash used in financing activities (6,163) (44,797)Effect of exchange rate changes 2,358 336Net increase in cash and cash equivalents 48,713 169,688 Cash and cash equivalents at beginning of year 681,433 465,995 Cash and cash equivalents at end of period $ 730,146 $ 635,683

6
BENCHMARK ELECTRONICS, INC. AND SUBSIDIARIES Notes to Condensed Consolidated Financial Statements
(amounts in thousands, except per share data, unless otherwise noted) (unaudited)
Note 1 – Basis of Presentation Benchmark Electronics, Inc. (the Company) is a Texas corporation that provides worldwide integrated electronic manufacturing services (EMS), engineering and design services, and precision machining services. The Company provides services to original equipment manufacturers (OEMs) in the following industries: industrial controls, aerospace and defense (A&D), telecommunications, computers and related products for business enterprises, medical devices, and test and instrumentation. The Company has manufacturing operations located in the United States and Mexico (the Americas), Asia and Europe. The unaudited condensed consolidated financial statements included herein have been prepared by the Company pursuant to the rules and regulations of the Securities and Exchange Commission (the SEC). The financial statements reflect all normal and recurring adjustments necessary in the opinion of management for a fair presentation of the financial position, results of operations and cash flows for the interim periods presented. The results of operations for the periods presented are not necessarily indicative of the results to be expected for the full year. The accompanying unaudited condensed consolidated financial statements should be read in conjunction with the financial statements and notes included in the Company’s annual report on Form 10-K for the year ended December 31, 2016 (the 2016 10-K). Management has made a number of estimates and assumptions relating to the reporting of assets and liabilities and the disclosure of contingent assets and liabilities to prepare these financial statements in accordance with generally accepted accounting principles in the United States (U.S. GAAP). Actual results could differ from those estimates and assumptions. Effective January 1, 2017, the Company adopted a new accounting standard update that simplifies several aspects of the accounting for employee share-based payment transactions, including accounting for income taxes, forfeitures, and statutory withholding requirements, as well as classification in the Condensed Consolidated Statements of Cash Flows. As required by this standard, excess tax benefits recognized on stock-based compensation expense are reflected in the accompanying Condensed Consolidated Income Statement as a component of the provision for income taxes on a prospective basis (See Note 8). As a result of including the income tax effects from excess tax benefits in income tax expense, the effects of the excess tax benefits are no longer included in the calculation of diluted shares outstanding, resulting in an increase in the number of diluted shares outstanding. The Company adopted this change in the method of calculating diluted shares outstanding on a prospective basis. Additionally, excess tax benefits or deficiencies recognized on stock-based compensation expense are classified as an operating activity in the accompanying Condensed Consolidated Statements of Cash Flows. The Company has applied this provision prospectively. Additionally, the Company is now required to present the cost of shares withheld from the employee to satisfy the employees’ income tax liability as a financing activity on the statement of cash flows rather than as an operating cash flow. The Company adopted this change retrospectively. As a result, for the nine months ended September 30, 2016, net cash provided by operations increased by $0.6 million with a corresponding offset to net cash used in financing activities. The standard also allows for the option to account for forfeitures as they occur when determining the amount of compensation cost to be recognized, rather than estimating expected forfeitures over the course of a vesting period. The Company elected to account for forfeitures as they occur. The net cumulative effect to the Company from the adoption of this accounting standard update was an increase to paid-in capital of $0.2 million and a reduction to retained earnings of $0.2 million as of January 1, 2017.

7
Note 2 – Stock-Based Compensation The Company’s 2010 Omnibus Incentive Compensation Plan (the 2010 Plan) authorizes the Company, upon approval of the Compensation Committee of the Board of Directors, to grant a variety of awards, including stock options, restricted shares and restricted stock units (both time-based and performance-based) and other forms of equity awards, or any combination thereof, to any director, officer, employee or consultant (including any prospective director, officer, employee or consultant) of the Company. Stock options (which have not been awarded since 2015) are granted to employees with an exercise price equal to the market price of the Company’s common shares on the date of grant, generally vest over a four-year period from the date of grant and have a term of ten years. Time-based restricted stock units granted to employees generally vest over a four-year period from the date of grant, subject to the continued employment of the employee by the Company. Performance-based restricted stock unit awards generally vest over a three-year performance cycle, which includes the year of the grant, and are based upon the Company’s achievement of specified performance metrics. Awards under the 2010 Plan to non-employee directors have been in the form of restricted stock units, which vest in equal quarterly installments over a one-year period, starting on the grant date. As of September 30, 2017, 3.1 million additional common shares were available for issuance under the Company’s 2010 Plan. All share-based payments to employees, including grants of employee stock options, are recognized in the financial statements based on their grant date fair values. The total compensation cost recognized for stock-based awards was $2.3 million and $6.8 million for the three and nine months ended September 30, 2017, respectively, and $0.3 million and $4.3 million for the three and nine months ended September 30, 2016, respectively. The total income tax benefit recognized in the condensed income statements for stock-based awards was $0.8 million and $2.5 million for the three and nine months ended September 30, 2017, respectively, and $0.1 million and $1.5 million for the three and nine months ended September 30, 2016, respectively. Awards of restricted shares, restricted stock units, and performance-based restricted stock units are valued at the closing market price of the Company’s common shares on the date of grant. For performance-based restricted stock units, compensation expense is based on the probability that the performance goals will be achieved, which is monitored by management throughout the requisite service period. When it becomes probable, based on the Company’s expectation of performance during the measurement period, that more or less than the previous estimate of the awarded shares will vest, an adjustment to stock-based compensation expense is recognized as a change in accounting estimate. As of September 30, 2017, the unrecognized compensation cost and remaining weighted-average amortization related to stock-based awards were as follows: Performance-
based
Restricted Restricted
Stock Stock Stock
(in thousands) Options Units Units(1)
Unrecognized compensation cost $ 938 $ 13,111 $ 5,328
Remaining weighted-average
amortization period 0.9 years 2.4 years 1.8 years
(1) Based on the probable achievement of the performance goals identified in each award.

8
The fair value of each option grant is estimated on the date of grant using the Black-Scholes option pricing model. No options were granted during the nine months ended September 30, 2017 and 2016. The total cash received by the Company as a result of stock option exercises for the nine months ended September 30, 2017 and 2016 was approximately $9.8 million and $5.5 million, respectively. The actual tax benefit realized as a result of stock option exercises and the vesting of other share-based awards during the nine months ended September 30, 2017 and 2016 was $4.4 million and $2.6 million, respectively. For the nine months ended September 30, 2017 and 2016, the total intrinsic value of stock options exercised was $6.5 million and $2.2 million, respectively. The Company awarded performance-based restricted stock units to employees during the nine months ended September 30, 2017 and 2016. The number of performance-based restricted stock units that may ultimately be earned will not be determined until the end of the corresponding performance periods, and may vary from as low as zero to as high as 2.5 times the target number depending on the level of achievement of certain performance goals. The level of achievement of these goals is based upon the audited financial results of the Company for the last full calendar year within the performance period. The performance goals consist of certain levels of achievement using the following financial metrics: revenue growth, operating margin expansion, and return on invested capital. If the performance goals are not met based on the Company’s financial results, the applicable performance-based restricted stock units will not vest and will be forfeited. Shares subject to forfeited performance-based restricted stock units will be available for issuance under the 2010 Plan. The following table summarizes activities relating to the Company’s stock options: Weighted-
Weighted- Average
Average Remaining Aggregate
Number of Exercise Contractual Intrinsic
(in thousands, except per share data) Options Price Term (Years) Value
Outstanding as of December 31, 2016 1,197 $19.51
Exercised (502) 19.56
Forfeited or expired (14) 20.51
Outstanding as of September 30, 2017 681 $19.45 5.31 $ 10,015
Exercisable as of September 30, 2017 527 $18.39 3.54 $ 8,304 The aggregate intrinsic value in the table above is before income taxes and is calculated as the difference between the exercise price of the underlying options and the Company’s closing stock price as of the last business day of the period ended September 30, 2017 for options that had exercise prices that were below the closing price. The following table summarizes the activities related to the Company’s time-based restricted stock units: Weighted-
Average
Number of Grant Date
(in thousands, except per share data) Units Fair Value
Non-vested awards outstanding as of December 31, 2016 525 $22.57
Granted 302 31.64
Vested (185) 21.43
Forfeited (34) 23.96
Non-vested awards outstanding as of September 30, 2017 608 $27.34
9
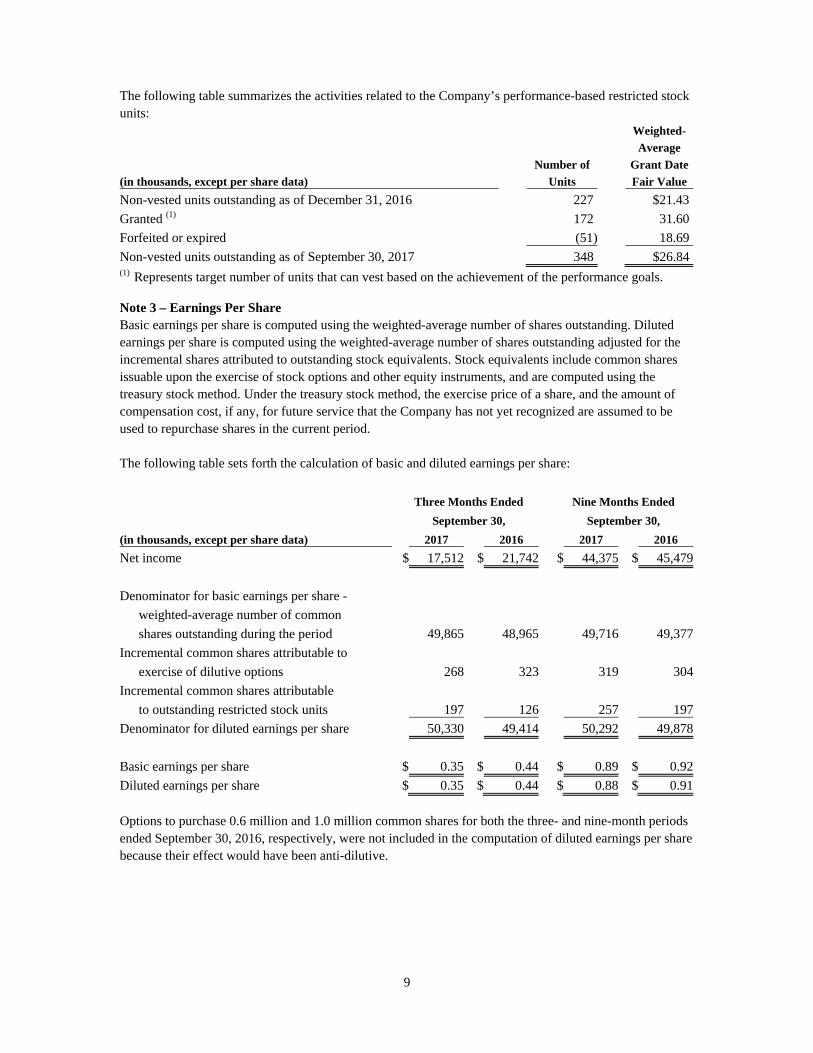
The following table summarizes the activities related to the Company’s performance-based restricted stock units: Weighted-
Average
Number of Grant Date
(in thousands, except per share data) Units Fair Value
Non-vested units outstanding as of December 31, 2016 227 $21.43
Granted (1) 172 31.60
Forfeited or expired (51) 18.69
Non-vested units outstanding as of September 30, 2017 348 $26.84(1) Represents target number of units that can vest based on the achievement of the performance goals. Note 3 – Earnings Per Share Basic earnings per share is computed using the weighted-average number of shares outstanding. Diluted earnings per share is computed using the weighted-average number of shares outstanding adjusted for the incremental shares attributed to outstanding stock equivalents. Stock equivalents include common shares issuable upon the exercise of stock options and other equity instruments, and are computed using the treasury stock method. Under the treasury stock method, the exercise price of a share, and the amount of compensation cost, if any, for future service that the Company has not yet recognized are assumed to be used to repurchase shares in the current period. The following table sets forth the calculation of basic and diluted earnings per share:
Three Months Ended Nine Months Ended
September 30, September 30,
(in thousands, except per share data) 2017 2016 2017 2016
Net income $ 17,512 $ 21,742 $ 44,375 $ 45,479
Denominator for basic earnings per share -
weighted-average number of common
shares outstanding during the period 49,865 48,965 49,716 49,377
Incremental common shares attributable to
exercise of dilutive options 268 323 319 304
Incremental common shares attributable
to outstanding restricted stock units 197 126 257 197
Denominator for diluted earnings per share 50,330 49,414 50,292 49,878
Basic earnings per share $ 0.35 $ 0.44 $ 0.89 $ 0.92
Diluted earnings per share $ 0.35 $ 0.44 $ 0.88 $ 0.91 Options to purchase 0.6 million and 1.0 million common shares for both the three- and nine-month periods ended September 30, 2016, respectively, were not included in the computation of diluted earnings per share because their effect would have been anti-dilutive.

10
Note 4 – Goodwill and Other Intangible Assets Goodwill allocated to the Company’s reportable segments was as follows:
(in thousands) Americas Asia Total
Goodwill as of December 31, 2016 and September 30, 2017 $ 153,514 $ 38,102 $ 191,616
Other assets consist primarily of acquired identifiable intangible assets and capitalized purchased software costs. Intangible assets as of September 30, 2017 and December 31, 2016 were as follows:
As of September 30, 2017
Gross Net
Carrying Accumulated Carrying
(in thousands) Amount Amortization Amount
Customer relationships $ 100,183 $ (32,770) $ 67,413
Purchased software costs 34,307 (29,327) 4,980
Technology licenses 26,800 (17,112) 9,688
Trade names and trademarks 7,800 - 7,800
Other 868 (255) 613
Total $ 169,958 $ (79,464) $ 90,494
As of December 31, 2016
Gross Net
Carrying Accumulated Carrying
(in thousands) Amount Amortization Amount
Customer relationships $ 100,053 $ (27,883) $ 72,170
Purchased software costs 31,582 (28,508) 3,074
Technology licenses 26,800 (14,189) 12,611
Trade names and trademarks 7,800 - 7,800
Other 868 (237) 631
Total $ 167,103 $ (70,817) $ 96,286 Customer relationships are being amortized on a straight-line basis over a period of 10 to 14 years. Capitalized purchased software costs are being amortized on a straight-line basis over the estimated useful life of the related software, which ranges from 2 to 10 years. Technology licenses are being amortized over their estimated useful lives in proportion to the economic benefits consumed. The Company’s acquired trade names and trademarks have been determined to have an indefinite life. Amortization for the nine months ended September 30, 2017 and 2016 was as follows: Nine Months Ended
September 30,
(in thousands) 2017 2016 Amortization of intangible assets $ 7,698 $ 8,945Amortization of capitalized purchased software costs 798 867Amortization of debt costs 643 567 $ 9,139 $ 10,379

11
The estimated future amortization expense of acquired intangible assets for each of the next five years is as follows (in thousands):
Year ending December 31, Amount
2017 (remaining three months) $ 2,624
2018 10,252
2019 10,091
2020 9,319
2021 6,389 Note 5 – Borrowing Facilities The Company has a $430 million Credit Agreement (the Credit Agreement) with JPMorgan Chase Bank, N.A. as administrative agent and collateral agent (the Administrative Agent), and the financial institutions acting as lenders thereunder from time to time. This Credit Agreement provides for a five-year $200 million revolving credit facility and a five-year $230 million term loan facility (the Term Loan), both with a maturity date of November 12, 2020. The revolving credit facility is available for general corporate purposes, may be drawn in foreign currencies up to an amount equivalent to $20 million, and may be used for letters of credit up to $20 million. The Credit Agreement includes an accordion feature, pursuant to which total commitments under the facility may be increased by an additional $150 million, subject to the satisfaction of certain conditions. The Term Loan is payable in minimum quarterly principal installments of $2.9 million in 2017, $4.3 million in 2018, $5.8 million in 2019, and $8.6 million in 2020, with the balance payable on the maturity date. Interest on outstanding borrowings under the Credit Agreement accrues, at our option, at (a) the adjusted London interbank offered rate (LIBOR) plus 1.25% to 2.25%, or (b) the alternative base rate plus 0.25% to 1.25%, and is payable quarterly in arrears. The alternative base rate is equal to the highest of (i) the Administrative Agent’s prime rate, (ii) the federal funds rate plus 0.50% and (iii) the adjusted LIBOR rate plus 1.00%. The margin on the interest rates fluctuates based upon the ratio of the Company’s debt to its consolidated EBITDA. As of September 30, 2017, $157.4 million of the outstanding debt under the Credit Agreement was effectively at a fixed interest rate as a result of a $157.4 million notional interest rate swap contract discussed in Note 14. A commitment fee of 0.30% to 0.40% per annum (based on the debt to EBITDA ratio) on the unused portion of the revolving credit line is payable quarterly in arrears. The Credit Agreement is generally secured by a pledge of (a) all the capital stock of the Company’s domestic subsidiaries and 65% of the capital stock of its directly owned foreign subsidiaries, (b) any indebtedness owed to Benchmark and its subsidiaries and (c) all or substantially all other personal property of Benchmark and its domestic subsidiaries (including, accounts receivable, inventory and fixed assets of Benchmark and its domestic subsidiaries), in each case, subject to customary exceptions and limitations. The Credit Agreement contains financial covenants as to debt leverage and interest coverage, and certain customary affirmative and negative covenants, including restrictions on our ability to incur additional debt and liens, pay dividends, repurchase shares, sell assets and merge or consolidate with other persons. Amounts due under the Credit Agreement may be accelerated upon specified events of default, including a failure to pay amounts due, breach of a covenant, material inaccuracy of a representation, or occurrence of bankruptcy or insolvency, subject, in some cases, to cure periods. As of September 30, 2017 and December 31, 2016, the Company was in compliance with all of these covenants and restrictions. As of September 30, 2017, the Company had $209.9 million in borrowings outstanding under the Term Loan facility and $2.6 million in letters of credit outstanding under the revolving credit facility. The

12
Company has $197.4 million available for future borrowings under the revolving credit facility. The Company’s Thailand subsidiary has a multi-purpose credit facility with Kasikornbank Public Company Limited (the Thai Credit Facility) that provides for 350 million Thai baht working capital availability. The Thai Credit Facility is secured by land and buildings in Thailand owned by the Company’s Thailand subsidiary. Availability of funds under the Thai Credit Facility is reviewed annually and is currently accessible through October 2018. As of both September 30, 2017 and 2016, there were no working capital borrowings outstanding under the facility.
Note 6 – Inventories
Inventory costs are summarized as follows: September 30, December 31,
(in thousands) 2017 2016
Raw materials $ 269,847 $ 233,111
Work in process 115,054 113,496
Finished goods 36,957 34,727
$ 421,858 $ 381,334 Note 7 – Accounts Receivable Sale Program In connection with a trade accounts receivable sale program with an unaffiliated financial institution, the Company may elect to sell, at a discount, on an ongoing basis, up to a maximum of $40.0 million, of specific accounts receivable at any one time. The program was executed on March 29, 2017, is an uncommitted facility and is scheduled to expire in one year with options to automatically extend the agreement, although any party may elect to terminate the agreement upon 60 days prior notice. During the three months ended September 30, 2017, the Company sold $40.0 million of accounts receivable under this program, and in exchange, the Company received cash proceeds of $39.9 million, net of the discount. During the nine months ended September 30, 2017, the Company sold $105.0 million of accounts receivable under this program, and in exchange, the Company received cash proceeds of $104.8 million, net of the discount. The loss on the sale resulting from the discount during the three and nine months ended September 30, 2017 was $0.1 million and $0.2 million, respectively, and was recorded to other expense within the Condensed Consolidated Statements of Income.

13
Note 8 – Income Taxes
Income tax expense consists of the following: Nine Months Ended
September 30,
(in thousands) 2017 2016
Federal – current $ (1,280) $ (164)
Foreign – current 6,039 (2,340)
State – current 275 238
Deferred 1,505 2,577
$ 6,539 $ 311 Income tax expense differs from the amount computed by applying the U.S. federal statutory income tax rate to income before income tax primarily due to the mix of taxable income by taxing jurisdiction, the impact of tax incentives and tax holidays in foreign locations, and state income taxes (net of federal benefit). The increase in income tax expense during 2017 is primarily the result of an $8.3 million decrease in the reserve for uncertain tax benefits in 2016. Excluding this item from 2016, the decrease in income tax expense during 2017 is primarily the result of a tax incentive in China and the recognition of excess tax benefits in the U.S. attributable to the adoption of an accounting standard effective January 1, 2017. See Note 1. Under this standard, the excess tax benefits or deficiencies resulting from the exercise or vesting of awards are included in income tax expense in the reporting period in which they occur. Therefore, the tax effect of stock option exercises and RSU vesting is not spread over the entire year through the use of the annual effective tax rate, but instead is recorded entirely in the period in which the tax deduction arises. Accordingly, the Company recorded the income tax benefit as a discrete item for the nine months ended September 30, 2017. The Company’s effective tax rate could fluctuate significantly on a quarterly basis due to the tax effects of stock-based compensation. The Company considers earnings from foreign subsidiaries to be indefinitely reinvested and, accordingly, no provision for U.S. federal and state income taxes has been made for these earnings. Upon distribution of foreign subsidiary earnings in the form of dividends or otherwise, such distributed earnings would be subject to U.S. income taxes and foreign withholding taxes, reduced by any applicable foreign tax credits. Determination of the amount of any unrecognized deferred tax liability on these undistributed earnings is not practicable. The Company has been granted certain tax incentives, including tax holidays, for its subsidiaries in China, Malaysia and Thailand that will expire at various dates, unless extended or otherwise renegotiated, through 2018 in China, 2021 in Malaysia and 2028 in Thailand, and are subject to certain conditions with which the Company expects to comply. The net impact of these tax incentives was to lower income tax expense for the nine months ended September 30, 2017 and 2016 by approximately $7.3 million (approximately 0.15 per diluted share) and $3.5 million (approximately $0.07 per diluted share), respectively, as follows: Nine Months Ended
September 30,
(in thousands) 2017 2016
China $ 888 $ -
Malaysia 3,151 1,594
Thailand 3,294 1,953
$ 7,333 $ 3,547

14
As of September 30, 2017, the total amount of the reserve for uncertain tax benefits including interest was $0.5 million. The reserve is classified as a current or long-term liability in the condensed consolidated balance sheets based on the Company’s expectation of when the items will be settled. The amount of accrued potential interest on unrecognized tax benefits included in the reserve as of September 30, 2017, was $17.0 thousand. There was no reserve for potential penalties. During the nine months ended September 30, 2017, the Company released $0.9 million of uncertain tax benefits related to the liquidation of a foreign subsidiary company. Also during 2017, the Company received a denial of its appeal to the local tax authorities related to an examination for a subsidiary in Thailand for the years 2004 to 2005. Consequently, the Company recorded $0.9 million of additional accruals for uncertain tax benefits. The Company has decided not to challenge this decision, therefore, the $7.3 million reserve for unrecognized tax benefits was written off. This decrease in the unrecognized tax benefit reserve as of September 30, 2017 did not impact the Company’s effective tax rate. The Company and its subsidiaries in Brazil, China, Ireland, Luxembourg, Malaysia, Mexico, The Netherlands, Romania, Singapore, Thailand and the United States remain open to examination by the various local taxing authorities, in total or in part, for fiscal years 2011 to 2016. The Company is currently under examination by the U.S. Internal Revenue Service for 2014. In addition, Secure Communication Systems, Inc. and its subsidiaries (the Secure Group), companies that the Company acquired on November 11, 2015, are under a U.S. income tax audit for calendar years 2013, 2014 and through November 11, 2015. Since this audit is for the period of time prior to the acquisition of the Secure Group by the Company, any resulting tax liabilities are the responsibility of the seller. The Company does not expect to incur any income tax costs with respect to this audit. During the course of such examinations, disputes may occur as to matters of fact or law. Also, in most tax jurisdictions, the passage of time without examination will result in the expiration of applicable statutes of limitations thereby precluding examination of the tax period(s) for which such statute of limitation has expired. The Company believes that it has adequately provided for its tax liabilities.

15
Note 9 – Segment and Geographic Information The Company currently has manufacturing facilities in the Americas, Asia and Europe to serve its customers. The Company is operated and managed geographically, and management evaluates performance and allocates the Company’s resources on a geographic basis. Intersegment sales are generally recorded at prices that approximate arm’s length transactions. Operating segments’ measure of profitability is based on income from operations. The accounting policies for the reportable operating segments are the same as for the Company taken as a whole. The Company has three reportable operating segments: Americas, Asia and Europe. Information about operating segments is as follows: Three Months Ended Nine Months Ended
September 30, September 30,
(in thousands) 2017 2016 2017 2016
Net sales: Americas $ 378,129 $ 387,827 $ 1,158,290 $ 1,135,995 Asia 202,149 169,215 568,247 505,410 Europe 43,793 37,113 127,617 119,633 Elimination of intersegment sales (20,521) (19,814) (67,199) (58,130) $ 603,550 $ 574,341 $ 1,786,955 $ 1,702,908
Depreciation and amortization: Americas $ 5,679 $ 6,031 $ 16,599 $ 17,639 Asia 2,882 4,055 9,021 12,304 Europe 705 702 2,041 2,098 Corporate 3,008 3,314 8,930 9,961 $ 12,274 $ 14,102 $ 36,591 $ 42,002
Income from operations: Americas $ 15,463 $ 21,481 $ 49,270 $ 60,960 Asia 20,963 12,337 53,328 34,894 Europe 2,560 2,390 7,512 7,878 Corporate and intersegment eliminations (18,171) (18,126) (54,651) (51,642) $ 20,815 $ 18,082 $ 55,459 $ 52,090
Capital expenditures: Americas $ 8,548 $ 7,102 $ 17,584 $ 16,698 Asia 1,696 1,372 12,820 5,945 Europe 638 532 4,018 1,204 Corporate 475 189 3,314 1,551 $ 11,357 $ 9,195 $ 37,736 $ 25,398 September 30, December 31,
2017 2016
Total assets: Americas $ 832,024 $ 864,388 Asia 689,571 634,838 Europe 452,015 393,443 Corporate and other 103,096 105,999 $ 2,076,706 $ 1,998,668

16
Geographic net sales information reflects the destination of the product shipped. Long-lived assets information is based upon the physical location of the asset.
Three Months Ended Nine Months Ended
September 30, September 30,
(in thousands) 2017 2016 2017 2016
Geographic net sales:
United States $ 398,363 $ 403,561 $ 1,186,330 $ 1,200,752
Singapore 59,594 48,057 179,158 134,635
Other Asia 53,327 37,770 144,620 104,911
Europe 70,852 57,835 218,314 180,362
Other Foreign 21,414 27,118 58,533 82,248
$ 603,550 $ 574,341 $ 1,786,955 $ 1,702,908
September 30, December 31,
2017 2016
Long-lived assets:
United States $ 163,325 $ 167,367
Asia 73,418 67,998
Europe 10,967 8,415
Other 26,052 24,290
$ 273,762 $ 268,070
Note 10 – Supplemental Cash Flow and Non-Cash Information
The following information concerns supplemental disclosures of cash payments.
Three Months Ended Nine Months Ended
September 30, September 30,
(in thousands) 2017 2016 2017 2016
Income taxes paid, net $ 2,524 $ 1,674 $ 5,049 $ 6,494
Interest paid 2,089 2,114 6,385 6,296
Non-cash investing activity:
Additions to property, plant and equipment
in accounts payable $ 6,024 $ 1,004 Note 11 – Contingencies The Company is involved in various legal actions arising in the ordinary course of business. In the opinion of management, the ultimate disposition of these matters will not have a material adverse effect on the Company’s consolidated financial position or results of operations. Note 12 – Impact of Recently Enacted Accounting Standards In May 2017, the Financial Accounting Standards Board (FASB) issued a new accounting standards update that provides guidance about which changes to the terms or conditions of a share-based payment award require an entity to apply modification accounting. This update is effective for annual periods, and interim periods within those annual periods, beginning after December 15, 2017, with early adoption permitted. The Company is evaluating the impact of the adoption of this guidance on its consolidated financial

17
statements and related disclosures but does not expect it to have a material impact. The Company plans to adopt the new guidance effective January 1, 2018. In August 2016, the FASB issued a new accounting standards update, which seeks to reduce the existing diversity in how certain cash receipts and cash payments are presented and classified in the statement of cash flows. This update is effective for fiscal years and interim periods beginning after December 15, 2017, with early adoption permitted. The Company is currently evaluating the impact that the adoption of this update will have on its consolidated financial statements. In June 2016, the FASB issued a new accounting standards update, which replaces the current incurred loss impairment methodology with a methodology that reflects expected credit losses and requires consideration of a broader range of reasonable and supportable information to inform credit loss estimates. This update is effective for annual reporting periods beginning after December 15, 2019. The Company does not expect the implementation of this update to have a material impact on its consolidated financial position, results of operations or cash flows. In February 2016, the FASB issued a new accounting standards update changing the accounting for leases and including a requirement to record all leases on the consolidated balance sheets as assets and liabilities. This update is effective for fiscal years beginning after December 15, 2018. The Company will adopt this update effective January 1, 2019, which will impact its consolidated balance sheet. The Company is currently evaluating the impact this standard will have on its consolidated financial statements. In May 2014, the FASB issued a new standard that will supersede most of the existing revenue recognition requirements in current U.S. GAAP. The new standard will require companies to recognize revenue in an amount reflecting the consideration to which they expect to be entitled in exchange for transferring goods or services to a customer. It will also require significantly expanded disclosures, and will be effective for the Company January 1, 2018. The new standard will permit the use of either the retrospective or cumulative effect transition method. Under the new standard, the Company anticipates that a majority of its sales from manufacturing activities will change to an over-time model; currently the Company accounts for these under a point-in-time recognition model. Based on its analysis to date, the Company expects to adopt the new guidance under the retrospective approach. The Company has reviewed its significant customer contracts and is in the process of quantifying the potential effects the new standard will have on its consolidated financial statements and is working on the design and implementation of the related internal controls. The Company believes it is likely to have a material impact on the timing of revenue recognition and on the Company’s balance sheet, primarily related to a reduction in finished goods and work in process inventories and a corresponding increase in contract assets for unbilled receivables. The Company has determined that other recently issued accounting standards will either have no material impact on its consolidated financial position, results of operations or cash flows, or will not apply to its operations. Note 13 – Restructuring Charges The Company has undertaken initiatives to restructure its business operations to improve utilization and realize cost savings. These initiatives have included changing the number and location of production facilities, largely to align capacity and infrastructure with current and anticipated customer demand. This alignment includes transferring programs from higher cost geographies to lower cost geographies. The process of restructuring entails moving production between facilities, reducing staff levels, realigning our business processes, reorganizing our management and other activities.

18
The Company recognized restructuring charges during 2017 and 2016 primarily related to the closure of facilities in the Americas, capacity reduction and reductions in workforce in certain facilities across various regions. The following table summarizes the 2017 activity in the accrued restructuring balances related to the restructuring activities initiated prior to September 30, 2017:
Balance as of Foreign Balance as of
December 31, Restructuring Cash Non-Cash Exchange September 30,
(in thousands) 2016 Charges Payment Activity Adjustments 2017
2017 Restructuring:
Severance $ - $ 1,903 $ (1,561) $ (125) $ - $ 217
Leased facilities and equipment - 105 (105) - - -
Other exit costs - 334 (149) - 9 194
- 2,342 (1,815) (125) 9 411
2016 Restructuring:
Severance 738 (44) (626) - - 68
Leased facilities and equipment - 58 (58) - - -
Other exit costs 545 1,616 (2,061) (42) 2 60
1,283 1,630 (2,745) (42) 2 128
Total $ 1,283 $ 3,972 $ (4,560) $ (167) $ 11 $ 539
Note 14 – Fair Value Fair value is defined as the exchange price that would be received for an asset or paid to transfer a liability (an exit price) in the principal or most advantageous market for the asset or liability in an orderly transaction between market participants on the measurement date. A three-tier fair value hierarchy of inputs is employed to determine fair value measurements.
Level 1 inputs are quoted prices (unadjusted) in active markets for identical assets and liabilities. Level 2 inputs are observable prices that are not quoted on active exchanges, such as quoted prices
for similar assets or liabilities; quoted prices in markets that are not active; and model-derived valuations whose inputs are observable or whose significant value drivers are observable.
Level 3 inputs are unobservable inputs employed for measuring the fair value of assets or liabilities.
This hierarchy requires the Company to use observable market data, when available, and to minimize the use of unobservable inputs when determining fair value. The Company’s financial instruments include cash equivalents, accounts and other receivables, accounts payable, accrued liabilities and long-term debt and capital lease obligations. The Company believes that the carrying values of these instruments approximate fair value. As of September 30, 2017, the Company’s long-term investments and derivative instruments were recorded at fair value using Level 3 inputs. The Company uses derivative instruments to manage the variability of foreign currency obligations and interest rates. The Company does not enter into derivatives for speculative purposes. The forward currency exchange contracts in place as of September 30, 2017 have not been designated as accounting hedges and, therefore, changes in fair value are recorded within the Condensed Consolidated Statements of Income.

19
The Company has an interest rate swap agreement, which had a notional amount of $157.4 million and $163.9 million as of September 30, 2017 and December 31, 2016, respectively, to hedge a portion of its interest rate exposure on outstanding borrowings under the Credit Agreement. Under this interest rate swap agreement, the Company receives variable rate interest payments based on the one-month LIBOR rate and pays fixed rate interest payments. The fixed interest rate for the contract is 1.4935%. The effect of this swap is to convert a portion of the floating rate interest expense to fixed interest rate expense. Based on the terms of the interest rate swap contract and the underlying borrowings outstanding under the Credit Agreement, the interest rate contract was determined to be effective, and thus qualifies and has been designated as a cash flow hedge. As such, changes in the fair value of the interest rate swap are recorded in other comprehensive income on the accompanying Condensed Consolidated Balance Sheets until earnings are affected by the variability of cash flows. The fair value of the interest rate swap was a $0.9 million asset as of September 30, 2017 and a $0.5 million asset as of December 31, 2016. During the nine months ended September 30, 2017, the Company recorded unrealized gain of $0.4 million ($0.3 million net of tax) on the swap in other comprehensive income. See Note 15. Note 15 – Accumulated Other Comprehensive Loss The changes in accumulated other comprehensive loss by component were as follows: Foreign Unrealized
currency Derivative gain (loss) on
translation instruments, investments,
(in thousands) adjustments net of tax net of tax Other Total
Balances, December 31, 2016 $ (14,544) $ 286 $ (74) $ 156 $ (14,176)
Other comprehensive gain (loss)
before reclassifications 4,434 254 19 (13) 4,694
Net current period other comprehensive gain (loss) 4,434 254 19 (13) 4,694
Balances, September 30, 2017 $ (10,110) $ 540 $ (55) $ 143 $ (9,482) See Note 14 for further explanation of the change in derivative instruments that is recorded to Accumulated Other Comprehensive Loss.

20
Item 2. Management’s Discussion and Analysis of Financial Condition and Results of Operations This quarterly report (this Report) contains forward-looking statements within the meaning of Section 27A of the Securities Act of 1933, as amended, and Section 21E of the Securities Exchange Act of 1934, as amended (the Exchange Act). These forward-looking statements are identified as any statement that does not relate strictly to historical or current facts and may include words such as “anticipate,” “believe,” “intend,” “plan,” “projection,” “forecast,” “strategy,” “position,” “continue,” “estimate,” “expect,” “may,” “will,” or the negative or other variations thereof. In particular, statements, whether express or implied, concerning future operating results or the ability to generate sales, income or cash flow are forward-looking statements. Undue reliance should not be placed on any forward-looking statements. Forward-looking statements are not guarantees of performance. They involve risks, uncertainties and assumptions that are beyond our ability to control or predict, including those discussed in Part I, Item 1A of the 2016 10-K and any added under Part II, Item 1A of this Report. Should one or more of these risks or uncertainties materialize, or should underlying assumptions prove incorrect, actual outcomes, including the future results of our operations, may vary materially from those indicated. The following discussion should be read in conjunction with the Condensed Consolidated Financial Statements and accompanying notes, and the 2016 10-K. OVERVIEW We are a worldwide provider of integrated electronics manufacturing services (EMS), engineering and design services, and precision machining services. We provide our services to original equipment manufacturers (OEMs) in the following industries: industrial controls, aerospace and defense (A&D), telecommunications, computers and related products for business enterprises, medical devices, and test and instrumentation. Our services include comprehensive and integrated design and manufacturing services and solutions—from initial product concept to volume production, including direct order fulfillment and aftermarket services. In this Report, references to Benchmark or the Company or use of the words “we”, “our” and “us” include the subsidiaries of Benchmark unless otherwise noted. Our primary goal is to drive revenue growth at the right balance of mix and profitability as we continue transitioning our portfolio to the higher-value markets of A&D, Industrials, Medical, and Test & Instrumentation. These higher-value markets offer greater outsourcing opportunities, longer lifecycle products and extended manufacturing contracts with customers who have greater outsourcing needs and require higher value-added and engineering-led solutions than customers in our traditional markets. We remain focused on key initiatives critical to our success, including the optimization of our global network; the implementation of our market-sector sales organization; and the expansion of our engineering solutions capabilities. Our operations comprise three principal areas:
Manufacturing and assembly operations, which includes printed circuit board assemblies (PCBAs) and subsystem assembly, box build and systems integration. Systems integration is often building a finished assembly that includes PCBAs, complex subsystem assemblies, mechatronics, displays, optics, and other components. These final products may be configured to order and delivered directly to the end customer across all the industries we serve.
Precision technology manufacturing, which complements our electronic manufacturing expertise by providing further vertical integration of critical mechanical components. These capabilities include precision machining, advanced metal joining, assembly and functional testing primarily for customers in the test & instrumentation market (which includes semiconductor capital equipment) as well as the medical and aerospace markets.
Specialized engineering services and solutions, which includes new product concept development, design for systems, sub-systems, and components, printed circuit board layout, prototyping,

21
automation and test development. We provide these services across all the industries we serve, but lead with engineering to manufacturing solutions primarily in regulated industries such as medical, complex industrials, aerospace and defense.
Our core strength lies in our ability to provide concept-to-production solutions in support of our customers. Our global manufacturing presence increases our ability to respond to our customers’ needs by providing accelerated time-to-market and time-to-volume production of high-quality products – especially for complex products with lower volume and higher mix in regulated markets. These capabilities enable us to build strong strategic relationships with our customers and to become an integral part of their operations. Our customers often face challenges in designing supply chains, planning demand, procuring materials and managing their inventories efficiently due to fluctuations in their customer demand, product design changes, short product life cycles and component price fluctuations. We seek to employ enterprise resource planning (ERP) systems and lean manufacturing principles to manage the procurement and manufacturing processes in an efficient and cost-effective manner so that, where possible, components arrive on a just-in-time, as-and-when-needed basis. We are a significant purchaser of electronic components and other raw materials and can capitalize on the economies of scale associated with our relationships with suppliers to negotiate price discounts, obtain components and other raw materials that are in short supply, and return excess components. Our agility and expertise in supply chain management and our relationships with suppliers across the supply chain help enable us to reduce our customers’ cost of goods sold and inventory exposure. We recognize revenue from the sale of manufactured products built to customer specifications and excess inventory when title and risk of ownership have passed, the price to the buyer is fixed or determinable and recoverability is reasonably assured, which generally is when the goods are shipped. Revenue from design, development and engineering services is recognized when the services are performed and collectibility is reasonably certain. Such services provided under fixed price contracts are generally accounted for using the percentage-of-completion method. We generally assume no significant obligations after shipment as we typically warrant workmanship only; accordingly, our warranty provisions are generally not significant. 2017 Highlights Sales for the three months ended September 30, 2017 increased 5% to $603.6 million compared to $574.3 million for 2016. During the third quarter of 2017, sales to customers in our various industry sectors fluctuated from the comparable 2016 period as follows:
Industrials decreased by 12%, A&D increased by 16%, Medical increased by 17%, Test & Instrumentation increased by 34%, Computing increased by 16%, and Telecommunications decreased by 23%.
The overall revenue increase was driven by strong Test & Instrumentation growth in our precision machining serving the semi-capital equipment market, Medical growth from higher demand and program ramps from new and existing customers, A&D growth primarily from defense programs, and Computing strength from existing storage customers and new security customers. Our sales depend on the success of our customers, some of which operate in businesses associated with rapid technological change and consequent product obsolescence. Developments adverse to our major customers or their products, or the failure of a major customer to pay for components or services, can

22
adversely affect us. A substantial percentage of our sales is made to a small number of customers, and the loss of a major customer, if not replaced, would adversely affect us. Sales to our 10 largest customers represented 44% of our sales in both the nine months ended September 30, 2017 and 2016. During the three months ended March 31, 2017, we incurred a $5.1 million charge for the write-down of inventory and a provision to accounts receivable associated with the insolvency of a customer. In subsequent quarters, we recorded partial recoveries of inventory charges totaling $2.2 million. During the nine months ended September 30, 2017, these net charges increased cost of sales by $1.2 million and SG&A by $1.7 million. We experience fluctuations in gross profit from period to period. Different programs contribute different gross profits depending on factors such as the type of services involved, location of production, size of the program, complexity of the product and level of material costs associated with the various products. Moreover, new programs can contribute relatively less to our gross profit in their early stages when manufacturing volumes are usually lower, resulting in inefficiencies and unabsorbed manufacturing overhead costs. In addition, a number of our new and higher-volume programs remain subject to competitive constraints that can exert downward pressure on our margins. During periods of low production volume, we generally have idle capacity and reduced gross profit. We have undertaken initiatives to restructure our business operations with the intention of improving utilization and reducing costs. During the first nine months of 2017, we recognized $4.0 million of restructuring charges, primarily related to reductions in workforce in certain facilities across various regions. In addition, we incurred $1.6 million in costs related to the relocation of our corporate headquarters to Arizona. RESULTS OF OPERATIONS The following table presents the percentage relationship that certain items in our Condensed Consolidated Statements of Income bear to sales for the periods indicated. The financial information and the discussion below should be read in conjunction with the Condensed Consolidated Financial Statements and Notes thereto in Item 1 of this Report.
Three Months Ended Nine Months Ended
September 30, September 30,
2017 2016 2017 2016
Sales 100.0 % 100.0 % 100.0 % 100.0 %
Cost of sales 90.4 90.8 90.7 90.8
Gross profit 9.6 9.2 9.3 9.2
Selling, general and administrative expenses 5.3 4.9 5.4 5.0
Amortization of intangible assets 0.5 0.6 0.4 0.5
Restructuring charges and other costs 0.4 0.6 0.3 0.6
Income from operations 3.4 3.1 3.1 3.1
Other expenses, net (0.2) (0.4) (0.3) (0.4)
Income before income taxes 3.2 2.8 2.8 2.7
Income tax expense (benefit) 0.3 (1.0) 0.4 -
Net income 2.9 % 3.8 % 2.5 % 2.7 %

23
Sales Sales for the third quarter of 2017 were $603.6 million, a 5% increase from sales of $574.3 million for the same quarter in 2016. Sales for the first nine months of 2017 were $1.8 billion, a 5% increase from sales of $1.7 billion for the same period in 2016. The following table sets forth, for the periods indicated, the percentages of our sales by industry sector.
Three Months Ended Nine Months Ended
September 30, September 30,
2017 2016 2017 2016
Higher-Value Markets
Industrials 20 % 25 % 20 % 24 %
A&D 16 14 17 15
Medical 17 15 15 15
Test & Instrumentation 15 11 14 11
68 65 66 65
Traditional Markets
Computing 20 19 21 19
Telecommunications 12 16 13 16
32 35 34 35
Total 100 % 100 % 100 % 100 %
Industrials. Third quarter sales decreased 12% to $124.0 million from $141.1 million in 2016, and decreased 10% to $366.1 million during the first nine months of 2017 from $406.1 million in the same period of 2016 primarily as a result of softness across several of our top customers. Aerospace and Defense. Third quarter sales increased 16% to $95.9 million from $82.6 million in 2016, and increased 16% to $300.0 million during the first nine months of 2017 primarily due to increased demand from our defense customers. Medical. Third quarter sales increased 17% to $100.4 million from $85.9 million in 2016, and increased 15% to $272.8 million during the first nine months of 2017 from $260.3 million in the same period of 2016 from higher demand and program ramps from new and existing customers. Test & Instrumentation. Third quarter sales increased 34% to $87.9 million from $65.6 million in 2016 and increased 41% to $252.4 million during the first nine months of 2017 from $179.0 million in the same period of 2016. The increase reflected strong growth in our precision machining serving the semi-capital equipment market. Computing. Third quarter sales increased 16% to $124.4 million from $107.4 million in 2016, and increased 13% to $367.2 million during the first nine months of 2017 from $326.1 million in the same period of 2016. The increase is primarily due to increased strength from our existing storage customers and new security customers. Telecommunications. Third quarter sales decreased 23% to $71.0 million from $91.7 million in 2016, and decreased 16% to $228.5 million during the first nine months of 2017 from $271.9 million in the same period of 2016. The decrease is primarily due to new programs not offsetting lower demand from our existing customer base.

24
Our international operations are subject to the risks of doing business abroad. See Part I, Item 1A of our 2016 10-K for factors pertaining to our international sales and fluctuations in the exchange rates of foreign currency and for further discussion of potential adverse effects in operating results associated with the risks of doing business abroad. During the first nine months of 2017 and 2016, 47% and 48%, respectively, of our sales were from our international operations. Gross Profit Gross profit increased 10% to $58.2 million for the three months ended September 30, 2017 from $52.8 million in the same quarter of 2016, and increased 6% to $165.8 million for the nine months ended September 30, 2017 from $156.0 million in the same period of 2016. For the nine months ended September 30, 2017, we incurred a $1.2 million net charge for the write-down of inventory associated with the insolvency of a customer. Including the inventory charge in the first quarter and partial recoveries in the second and third quarters, gross profit as a percentage of sales was 9.6% and 9.3%, respectively for the three and nine months ended September 30, 2017. Excluding these items, gross profit as a percentage of sales increased to 9.4% and 9.3%, respectively, for the three and nine months ended September 30, 2017 from 9.2% and 9.2%, respectively, in the same periods of 2016 primarily due to higher sales and a better mix of higher-value sales. Selling, General and Administrative Expenses SG&A increased by 14% to $32.1 million in the third quarter of 2017 compared to $28.1 million in 2016, and increased by 14% to $97.1 million in the first nine months of 2017 compared to $85.1 million in 2016. The increase was primarily a result of increased variable compensation, investments in our sales and marketing organization and a $1.7 million charge for a provision to accounts receivable associated with the insolvency of a customer. Including this provision to accounts receivable, SG&A, as a percentage of sales, increased to 5.3% for the third quarter of 2017 from 4.9% in 2016. SG&A, as a percentage of sales, increased to 5.4% for the first nine months of 2017 from 5.0% in 2016. Excluding this provision to accounts receivable, SG&A, as a percentage of sales, increased to 5.3% for the third quarter of 2017 from 4.9% in 2016. SG&A, as a percentage of sales, increased to 5.3% for the first nine months of 2017 from 5.0% in 2016 primarily due to increased variable compensation and the investment in our sales and marketing organization. Amortization of Intangible Assets Amortization of intangible assets decreased to $7.7 million in 2017 from $8.9 million in 2016 due primarily to certain customer relationship intangible assets that became fully amortized as of December 31, 2016. Restructuring Charges and Other Costs During 2017, we recognized $5.6 million of restructuring charges and other costs, primarily related to reductions in workforce in certain facilities across various regions and costs associated with the move of our corporate headquarters. We expect costs of additional efforts to align capacity in the Americas to approximate $1.5 million in the fourth quarter of 2017. In 2016, we recognized $9.9 million of restructuring charges and other costs, primarily related to reductions in workforce in certain facilities across various regions, costs associated with a proxy contest relating to our 2016 annual meeting of shareholders and costs associated with the separation of our former Chief Executive Officer. See Note 13 to the Condensed Consolidated Financial Statements in Item 1 of this Report. Interest Income Interest income increased to $3.6 million in 2017 from $1.2 million in 2016 due to investment of higher levels of available cash in interest bearing cash equivalents at higher interest rates.

25
Income Tax Expense Income tax expense of $6.5 million represented an effective tax rate of 12.8% for 2017, compared with $0.3 million for 2016, which represented an effective tax rate of 0.7%. The 0.7% effective tax rate in 2016 stemmed primarily from the reversal of uncertain tax benefits of $8.3 million relating to the expiration of the statute of limitations for a liquidated subsidiary that reduced the income tax expense. Without the reversal, the effective tax rate in 2016 would have been 18.7%. The decrease in the effective rate for 2017 is primarily a result of a $1.4 million discrete tax benefit for stock based compensation in 2017. Excluding this tax item, the effective tax rate would have been 15.6%. The decrease in the effective tax rate results primarily from a tax incentive in China and taxable income in geographies with lower tax rates. We have been granted certain tax incentives, including tax holidays, for our subsidiaries in China, Malaysia and Thailand that will expire at various dates, unless extended or otherwise renegotiated, through 2018 in China, 2021 in Malaysia, and 2028 in Thailand. See Note 8 to the Condensed Consolidated Financial Statements in Item 1 of this report. Net Income We reported net income of $44.4 million, or diluted earnings per share of $0.88 for the first nine months of 2017, compared with net income of $45.5 million, or diluted earnings per share of $0.91 for 2016. The net decrease of $1.1 million from 2016 was due to the factors discussed above. LIQUIDITY AND CAPITAL RESOURCES We have historically financed our organic growth and operations through funds generated from operations. In connection with the Secure Acquisition in 2015, we borrowed $230.0 million under the Term Loan facility to finance the purchase price of the acquisition. Cash and cash equivalents totaled $730.1 million at September 30, 2017 and $681.4 million at December 31, 2016, of which $75.0 million and $55.2 million, were available in the U.S. at September 30, 2017 and December 31, 2016, respectively. Substantially all of the amounts held outside of the U.S. are intended to be permanently reinvested in foreign operations. Under current tax laws and regulations, if cash and cash equivalents held outside the U.S. were to be distributed to the U.S. in the form of dividends or otherwise, we would be subject to additional U.S. income taxes and foreign withholding taxes, reduced by any applicable foreign tax credits. Cash provided by operating activities during the first nine months was $89.9 million for 2017 and consisted primarily of $44.4 million of net income adjusted for $36.6 million of depreciation and amortization, a $30.9 million decrease in accounts receivable, a $38.8 million increase in inventories and a $3.9 million increase in accounts payable over 2016. The decrease in accounts receivable was primarily driven by the sale of $40.0 million of accounts receivable under an accounts receivable sales program implemented on March 29, 2017. Working capital was $1.2 billion at September 30, 2017 and $1.1 billion at December 31, 2016. We purchase components only after customer orders or forecasts are received, which mitigates, but does not eliminate, the risk of loss on inventories. Supplies of electronic components and other materials used in operations are subject to industry-wide shortages. In certain instances, suppliers may allocate available quantities to us. If shortages of these components and other material supplies used in operations occur, vendors may not ship the quantities we need for production, and we may be forced to delay shipments, which can increase backorders and impact cash flows. Cash used in investing activities was $37.4 million for 2017, primarily due to purchases of additional property, plant and equipment totaling $35.0 million. The purchases of property, plant and equipment were primarily for machinery and equipment in the Americas and Asia.

26
Cash used in financing activities was $6.2 million for 2017. Share repurchases totaled $5.9 million, principal payments on long-term debt totaled $9.3 million, and we received $9.8 million from the exercise of stock options. Under the terms of our $430.0 million Credit Agreement, in addition to the Term Loan facility, we have a $200.0 million five-year revolving credit facility to be used for general corporate purposes with a maturity date of November 12, 2020. The Credit Agreement includes an accordion feature pursuant to which total commitments under the facility may be increased by an additional $150.0 million, subject to satisfaction of certain conditions. As of September 30, 2017, we had $209.9 million in borrowings outstanding under the Term Loan facility and $2.6 million in letters of credit outstanding under the revolving credit facility. $197.4 million remains available for future borrowings under the revolving credit facility. See Note 5 to the Condensed Consolidated Financial Statements included in Item 1 of this Report for more information regarding the terms of the Credit Agreement. Our operations, and the operations of businesses we acquire, are subject to certain foreign, federal, state and local regulatory requirements relating to environmental, waste management, health and safety matters. We believe we operate in substantial compliance with all applicable requirements and we seek to ensure that newly acquired businesses comply or will comply substantially with applicable requirements. To date, the costs of compliance and workplace and environmental remediation have not been material to us. However, material costs and liabilities may arise from these requirements or from new, modified or more stringent requirements in the future. In addition, our past, current and future operations, and the operations of businesses we have or may acquire, may give rise to claims of exposure by employees or the public, or to other claims or liabilities relating to environmental, waste management or health and safety concerns. As of September 30, 2017, we had cash and cash equivalents totaling $730.1 million and had $197.4 million available for borrowings under the Credit Agreement. During the next 12 months, we believe our capital expenditures will approximate $50 to $55 million, principally for machinery and equipment as well as expansion investments to support our ongoing business around the globe. In December 2015, our Board of Directors approved the repurchase of up to $100.0 million of our outstanding common shares. As of September 30, 2017, we had $86.9 million remaining under the repurchase program to purchase additional shares. We are under no commitment or obligation to repurchase any particular amount of common shares. Management believes that our existing cash balances and funds generated from operations will be sufficient to permit us to meet our liquidity requirements over the next 12 months. Management further believes that our ongoing cash flows from operations and any borrowings we may incur under our revolving credit facility will enable us to meet operating cash requirements in future years. If we consummated significant acquisitions in the future, our capital needs would increase and could possibly result in our need to increase available borrowings under our Credit Agreement or access public or private debt and equity markets. There can be no assurance, however, that we would be successful in raising additional debt or equity on acceptable terms. CONTRACTUAL OBLIGATIONS We have certain contractual obligations for operating and capital leases that were summarized in a table of Contractual Obligations in our 2016 10-K. There have been no material changes to our contractual obligations, outside of the ordinary course of our business, since December 31, 2016.

27
OFF-BALANCE SHEET ARRANGEMENTS As of September 30, 2017, we did not have any significant off-balance sheet arrangements. See Note 14 to the Condensed Consolidated Financial Statements. CRITICAL ACCOUNTING POLICIES AND ESTIMATES Management’s discussion and analysis is based upon our condensed consolidated financial statements, which have been prepared in accordance with U.S. GAAP. Our significant accounting policies are summarized in Note 1 to the Consolidated Financial Statements included in our 2016 10-K. See Note 12 to the Condensed Consolidated Financial Statements for a discussion of recently enacted accounting principles. Item 3 – Quantitative and Qualitative Disclosures About Market Risk Our international sales comprise a significant portion of our net sales. We are exposed to risks associated with operating internationally, including:
• Foreign currency exchange risk; • Import and export duties, taxes and regulatory changes; • Inflationary economies or currencies; and • Economic and political instability.
Additionally, some of our operations are in developing countries. Certain events, including natural disasters, can impact the infrastructure of a developing country more severely than they would impact the infrastructure of a developed country. A developing country can also take longer to recover from such events, which could lead to delays in our ability to resume full operations. We transact business in various foreign countries and are subject to foreign currency fluctuation risks. We use natural hedging and forward contracts to economically hedge transactional exposure primarily associated with trade accounts receivable, other receivables and trade accounts payable that are denominated in a currency other than the functional currency of the respective operating entity. We do not use derivative financial instruments for speculative purposes. The forward contracts in place as of September 30, 2017 have not been designated as accounting hedges and, therefore, changes in fair value are recorded within our Consolidated Statements of Income. Our sales are substantially denominated in U.S. dollars. Our foreign currency cash flows are generated in certain European and Asian countries and Mexico. We are also exposed to market risk for changes in interest rates on our financial instruments, a portion of which relates to our invested cash balances. We do not use derivative financial instruments in our investing activities. We place cash and cash equivalents and investments with various major financial institutions. We protect our invested principal funds by limiting default risk, market risk and reinvestment risk. We mitigate default risk by generally investing in investment-grade securities. We are also exposed to interest rate risk on borrowings under our Credit Agreement. As of September 30, 2017, we had $209.9 million outstanding on the floating rate Term Loan facility, and we have an interest rate swap agreement with a notional amount of $157.4 million. Under this swap agreement, we receive variable rate interest payments and pay fixed rate interest payments. The effect of this swap is to convert a portion of our floating rate interest expense to fixed interest rate expense. The interest rate swap is designated as a cash flow hedge.

28
Item 4 – Controls and Procedures
As of the end of the period covered by this Report, the Company’s management (with the participation of our Chief Executive Officer (CEO) and Chief Financial Officer (CFO)) conducted an evaluation pursuant to Rule 13a-15 under the Exchange Act, of the effectiveness of the design and operation of the Company’s disclosure controls and procedures. Based on this evaluation, the CEO and CFO concluded that as of the end of the period covered by this Report such disclosure controls and procedures were effective to provide reasonable assurance that information required to be disclosed by the Company in reports it files or submits under the Exchange Act is recorded, processed, summarized and reported within the time periods specified in the rules and forms of the SEC, and include controls and procedures designed to ensure that information required to be disclosed by the Company in such reports is accumulated and communicated to our management, including the CEO and CFO, as appropriate to allow timely decisions regarding required disclosure. There has been no change in our internal control over financial reporting that occurred during the last fiscal quarter covered by this Report that has materially affected, or is reasonably likely to materially affect, our internal control over financial reporting. Our management, including our CEO and CFO, does not expect that our disclosure controls and internal controls will prevent all errors and all fraud. A control system, no matter how well conceived and operated, can provide only reasonable, not absolute, assurance that the objectives of the control system are met. Further, the design of a control system must reflect the fact that there are resource constraints, and the benefits of controls must be considered relative to their costs. Because of the inherent limitations in all control systems, no evaluation of controls can provide absolute assurance that all control issues and instances of fraud, if any, within a company have been detected. These inherent limitations include the realities that judgments in decision-making can be faulty, and that breakdowns can occur because of simple errors or mistakes. Additionally, controls can be circumvented by individuals’ acts, by collusion of two or more people, or by management overriding the control. The design of any system of controls also is based in part upon certain assumptions about the likelihood of future events, and there can be no assurance that any design will succeed in achieving its stated goals under all potential future conditions; over time, a control may become inadequate because of changes in conditions, or the degree of compliance with the policies or procedures may deteriorate. Because of the inherent limitations in a cost-effective control system, misstatements due to error or fraud may occur and not be detected.

29
PART II—OTHER INFORMATION Item 1. Legal Proceedings
We are involved in various legal actions arising in the ordinary course of business. In the opinion of management, the ultimate disposition of these matters will not have a material adverse effect on our consolidated financial position or results of operations. Item 1A. Risk Factors
There are no material changes to the risk factors set forth in Part I, Item 1A of our 2016 10-K. Item 2. Unregistered Sales of Equity Securities and Use of Proceeds
(c) The following table provides information for the quarter ended September 30, 2017 about the Company’s repurchases of its equity securities registered pursuant to Section 12 of the Exchange Act, at a total cost of $3.9 million:
ISSUER PURCHASES OF EQUITY SECURITIES (d) Maximum
(c) Total Number (or
Number of Approximate
Shares Dollar Value)
(or Units) of Shares
Purchased as (or Units) that
(a) Total Part of May Yet Be
Number of Publicly Purchased
Shares (or (b) Average Announced Under the
Units) Price Paid per Sh
Plans or Plans or
Period Purchased(1) (or Unit)(2) Programs Programs(3)
August 1 to 31, 2017 100,794 $31.64 100,794 $87.6 million
September 1 to 30, 2017 21,819 $31.88 21,819 $86.9 million
Total 122,613 $31.68 122,613 (1) All share repurchases were made on the open market. (2) Average price paid per share is calculated on a settlement basis and excludes commission. (3) In December 2015, the Board of Directors approved the repurchase of up to $100 million of the Company’s outstanding common shares. Share purchases may be made in the open market, in privately negotiated transactions or block transactions, at the discretion of the Company’s management and as market conditions warrant. Purchases are funded from available cash and may be commenced, suspended or discontinued at any time without prior notice. Shares repurchased under the program are retired.
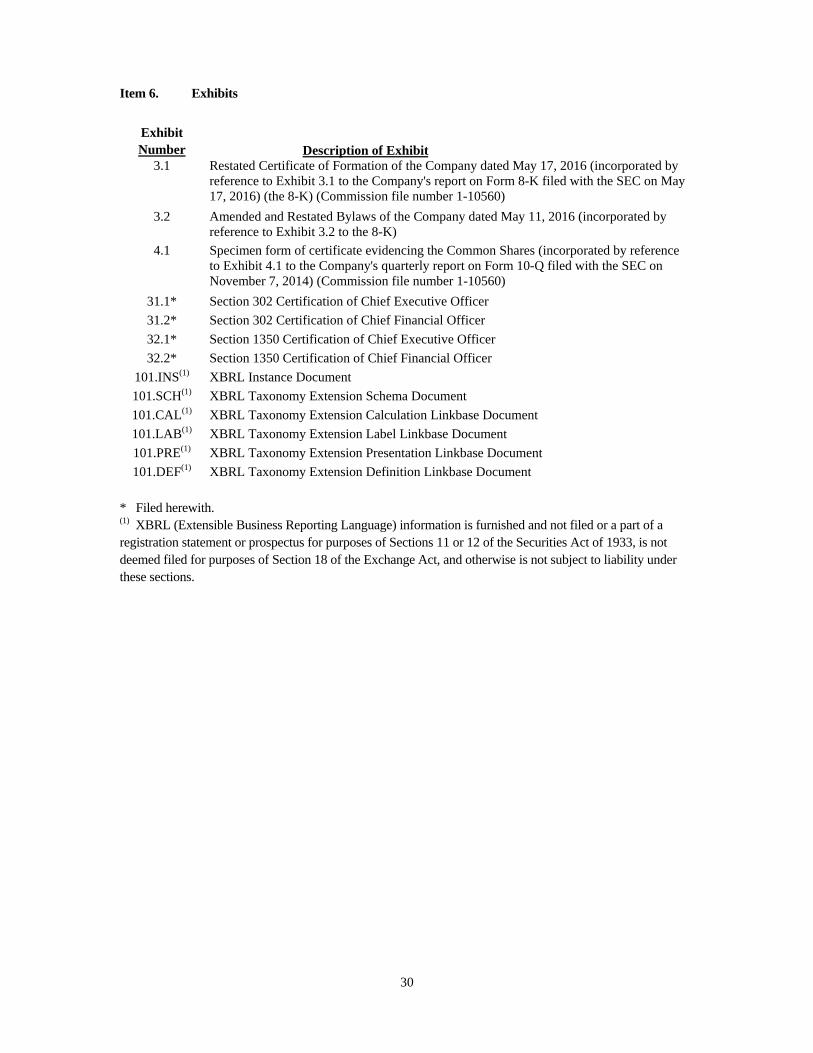
30
Item 6. Exhibits
Exhibit Number Description of Exhibit
3.1 Restated Certificate of Formation of the Company dated May 17, 2016 (incorporated by reference to Exhibit 3.1 to the Company's report on Form 8-K filed with the SEC on May 17, 2016) (the 8-K) (Commission file number 1-10560)
3.2 Amended and Restated Bylaws of the Company dated May 11, 2016 (incorporated by reference to Exhibit 3.2 to the 8-K)
4.1 Specimen form of certificate evidencing the Common Shares (incorporated by reference to Exhibit 4.1 to the Company's quarterly report on Form 10-Q filed with the SEC on November 7, 2014) (Commission file number 1-10560)
31.1* Section 302 Certification of Chief Executive Officer
31.2* Section 302 Certification of Chief Financial Officer
32.1* Section 1350 Certification of Chief Executive Officer
32.2* Section 1350 Certification of Chief Financial Officer
101.INS(1) XBRL Instance Document
101.SCH(1) XBRL Taxonomy Extension Schema Document
101.CAL(1) XBRL Taxonomy Extension Calculation Linkbase Document
101.LAB(1) XBRL Taxonomy Extension Label Linkbase Document
101.PRE(1) XBRL Taxonomy Extension Presentation Linkbase Document
101.DEF(1) XBRL Taxonomy Extension Definition Linkbase Document
* Filed herewith. (1) XBRL (Extensible Business Reporting Language) information is furnished and not filed or a part of a registration statement or prospectus for purposes of Sections 11 or 12 of the Securities Act of 1933, is not deemed filed for purposes of Section 18 of the Exchange Act, and otherwise is not subject to liability under these sections.

31
SIGNATURES
Pursuant to the requirements of the Securities Exchange Act of 1934, the registrant has duly caused this report to be signed on its behalf by the undersigned thereunto duly authorized on November 8, 2017. BENCHMARK ELECTRONICS, INC.
(Registrant)
By: /s/ Paul J. Tufano
Paul J. Tufano
President and Chief Executive Officer (Principal Executive Officer)
By: /s/ Donald F. Adam
Donald F. Adam
Chief Financial Officer
(Principal Financial Officer)