bench-to-bedside translation of adcs using pk/pd m&s · bench-to-bedside translation of adcs...
TRANSCRIPT


Outline
Overview: ADCs
Prediction of Clinical Efficacy using a Multi-Scale Mechanistic PK/PD Model
Prediction of Clinical PK using a Platform PBPK Model for ADCs
Summary

Antibody-Drug Conjugate (ADCs)
Deliver cytotoxic agents to the tumor via tumor specific, over expressed, cell surface antigens
Improved efficacy Improved selectivity
Minimizes normal tissue exposure to the cytotoxic agent Decreased toxicity Improved therapeutic index (TI)
>60 in the Clinic

Preclinical-to-Clinical Translation: Oncology
One should not take the lack of IVIVC and the lack of preclinical-to-clinical translation
for granted, but try to understand the mechanistic reasons behind it
Cell Human BodySeconds Years
Multi-Scale System for Oncology

Outline
Overview: ADCs
Prediction of Clinical Efficacy using a Multi-Scale Mechanistic PK/PD Model
Prediction of Clinical PK using a Platform PBPK Model for ADCs
Summary

Strategy: Translation of ADC Efficacy
(1) In Vitro: Characterization of ADC & drug PK at cellular level
(2) Drug PK in Mouse: Characterization of drug PK in plasma & tumor tissue, after administration of the drug alone
(3) Characterization of ADC PK in Mouse Plasma
(4) Predicting tumor ADC and drug concentrations afterADC administration in xenograft mouse
(5) Estimation of Drug Efficacy in Mouse: Characterization of ADC induced preclinical TGI data using the PK/PD model
(6) Prediction of ADC and drug plasma PK in the clinical
(7) Preclinical-to-clinical translation of system and efficacy parameters, and clinical trial simulations
Brentuximab vedotin(SGN-35, Adcetris®)
anti-CD30 vc-MMAE (DAR ~4)JPKPD. 2012 Dec;39(6):643-59.

Adcetris® Case Study0
0.5
1
1.5
2
2.5
3
0 20 40 60 80
pm
ole
MM
E/1
0^
6 K
arp
as
2
99
ce
lls
Time (h)
Observed (Total)Model Predicted (Total)Observed (Intracellular)Model Predicted (Intracellular)
0
100
200
300
400
500
600
700
800
0 20 40 60 80
Intr
ac
ellu
lar
MM
AE
(n
M)
Time (h)
Observed
Model Predicted
0
0.5
1
1.5
2
0 20 40 60 80
Ex
tra
ce
llu
lar
MM
AE
(n
M)
Time (h)
Observed
Model Predicted
0
1
2
3
4
5
6
0 20 40 60 80pm
ole
MM
E/1
0^
6 L
54
0c
y
ce
lls
Time (h)
Observed (Total)Model Predicted (Total)Observed (Intracellular)Model Predicted (Intracellular)
0
0.5
1
1.5
2
2.5
3
3.5
4
4.5
0 20 40 60 80
Ex
tra
ce
llu
lar
MM
AE
(n
M)
Time (h)
Observed
Model Predicted
0
200
400
600
800
1000
1200
0 20 40 60 80
Intr
ac
ellu
lar
MM
AE
(n
M)
Time (h)
Observed
Model Predicted
• The model predicted concentration vs. time profiles of intracellular and extracellular MMAE, reasonably well.
•Consistent with experimental results, the model predicted that intracellular MMAE concentrations would be more than 100 times MMAE concentration in media.
CD30 Receptor# / cell (Okeley et al.)Binding affinities (Nagata et al.)Internalization rate (Sutherland et al.)Payload efflux (Okeley et al.)
• The model was able to characterize both the profiles well with reasonable confidence in the parameter estimates.
• Incorporation of intracellular tubulin binding was necessary to characterize tumor MMAE concentrations.
koffADC
konADCADCFree ADCBound kintAg
PLFree
PLFreekoutPL
(1) In vitro PK of ADC & drug
(2) Drug PK in mouse after administration of the drug alone
Step-2: Characterization of MMAE PK in plasma & tumor tissue of xenograft mouse, after IV administration of MMAE
CLDPL X1PL
V1PL
X2PL
V2PL
CLPL
Vascular Exchange
Surface Exchange
PayloadPLFree
PLFree PLBound
koffPL
konPL
koutPL
kinPL
Bolus Dose MMAE

CLDADC X1ADC
V1ADC
X2ADC
V2ADC
CLADC kdis
Bolus Dose ADC
• SGN-35 plasma PK in mouse, characterized well with a two compartment model
• Exponential decay well characterized the average DAR vs. time profile in mouse
• Dissociation half life of MMAE was ~6 days
• The model did a very good job in predicting all the profiles using a predefined set of parameters, without estimating any parameter.
• This increases confidence in the ability of the novel ADC tumor disposition model to predict payload concentration at site-of-action.
0.01
0.1
1
10
100
1000
10000
0 2 4 6 8 10
Co
nc
. (n
M)
Time (Day)
Plasma Conjugated MMAE
Tumor MMAE
Plasma Free MMAE
Adcetris® Case Study(3) Characterization of ADC PK in Mouse Plasma
(4) Predicting tumor ADC and drug concentrations
TauV4
koffADC
konADC
CLDPL
CLDADC X1ADC
V1ADC
X2ADC
V2ADC
CLADC
X1PL
V1PL
X2PL
V2PL
CLPL
kdisDAR
Vascular Exchange
Vascular Exchange
Surface Exchange
Surface Exchange
ADC
Payload
ADCFree ADCBound
kintAg
PLFree
PLFree
PLBound
koffPL
konPL
koutPL
kinPL
kdis
Cell Death
Tau TauV1 V2 V3
TumorPL
50kc
Tumor
PLMax
kkill
ψ1
ψ
TV
Lkg
Exkg
1
V1
MaxV
TV1
Exkg
PK
PD
Tumor
Cell
Bolus Dose ADC

• TGI data from two different xenograft (L540cy and Karpas299), treated with various dosing regimens.
• Modeled using the mechanistic population PK/PD model, where MMAE conc. in tumor was driving the efficacy.
TauV4
koffADC
konADC
CLDPL
CLDADC X1ADC
V1ADC
X2ADC
V2ADC
CLADC
X1PL
V1PL
X2PL
V2PL
CLPL
kdisDAR
Vascular Exchange
Vascular Exchange
Surface Exchange
Surface Exchange
ADC
Payload
ADCFree ADCBound
kintAg
PLFree
PLFree
PLBound
koffPL
konPL
koutPL
kinPL
kdis
Cell Death
Tau TauV1 V2 V3
TumorPL
50kc
Tumor
PLMax
kkill
ψ1
ψ
TV
Lkg
Exkg
1
V1
MaxV
TV1
Exkg
PK
PD
Tumor
Cell
Bolus Dose ADC
L540cy Karpas299
SGN-35
MMAE
PK from two different trials with different regimens
• Two compartment model was able to characterize the multiple dose clinical PK of SGN-35 and MMAE reasonably well. • The parameter estimates for SGN-35 and MMAE
clinical PK were utilized for clinical trial simulations.•Payload dissociation half-life ~9 days, monkey.
Adcetris® Case Study(5) Estimation of Drug Efficacy in Mouse (6) Prediction of ADC and drug plasma PK in clinical

(a) The growth rate of the tumor was set to match clinically observed values (doubling time 20-140 days)(b) The initial tumor burden and maximum possible tumor burden were set to clinically relevant values(c) The number of CD30 receptors on cancer cells were changed to the value obtained from a cancer
patient (more than 5 times less than xenograft cell line)
Adcetris® Case Study(7) Translation of parameters and clinical trial simulations
9/17/08 - Baseline
Complete resolution of nodal and subcutaneous involvement
Top image: L hilar LN, 1.9 x 1.6 cm
Bottom image: subQ scalp nodule, 2.5 x 2 cm
TIME
w

Application to Other ADCs: Kadcyla®Trastuzumab Emtansine, T-DM1

Application to Other ADCs: Mylotarg®Inotuzumab Ozogamicin

Application for MID3: Adcetris®Dose vs. Antigen Conc. Dose vs. MAb Affinity
Dose vs. Payload Efflux Rate Dose vs. Tumor Growth Rate
Antigen Conc. vs. MAb Affinity (1.5 mpk)

Outline
Overview: ADCs
Prediction of Clinical Efficacy using a Multi-Scale Mechanistic PK/PD Model
Prediction of Clinical PK using a Platform PBPK Model for ADCs
Summary

Platform PBPK Model for ADCs: Motivation
Understanding Differential
Target Expression
Develop BetterExposure-Response
Relationships
Prediction of Clinical PK ad DDI
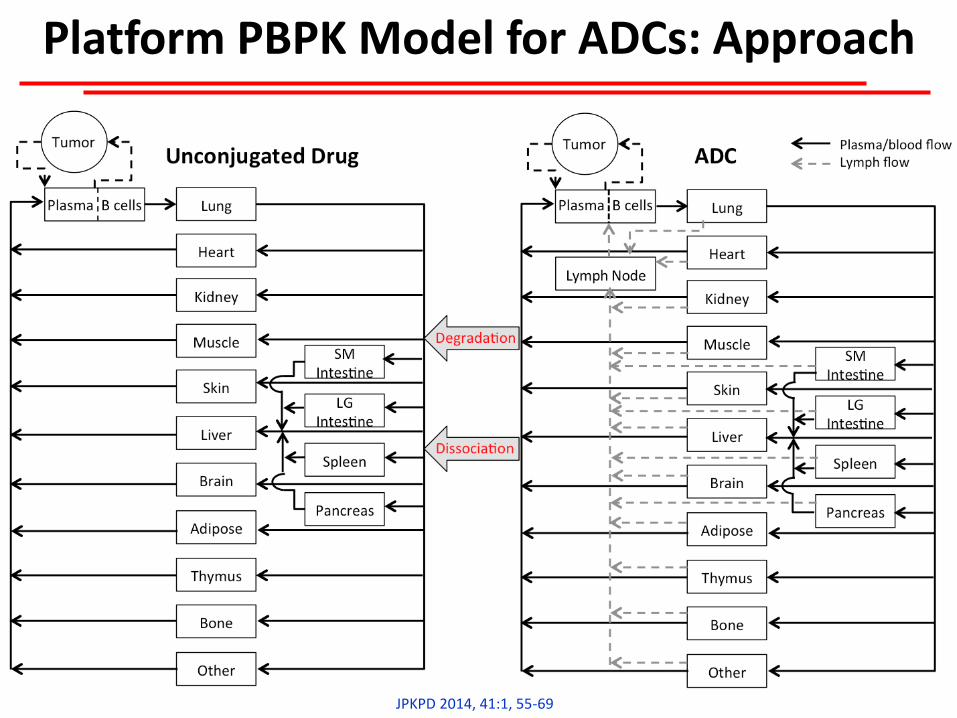
Platform PBPK Model for ADCs: Approach
JPKPD 2014, 41:1, 55-69

Platform PBPK Model for ADCs: Approach
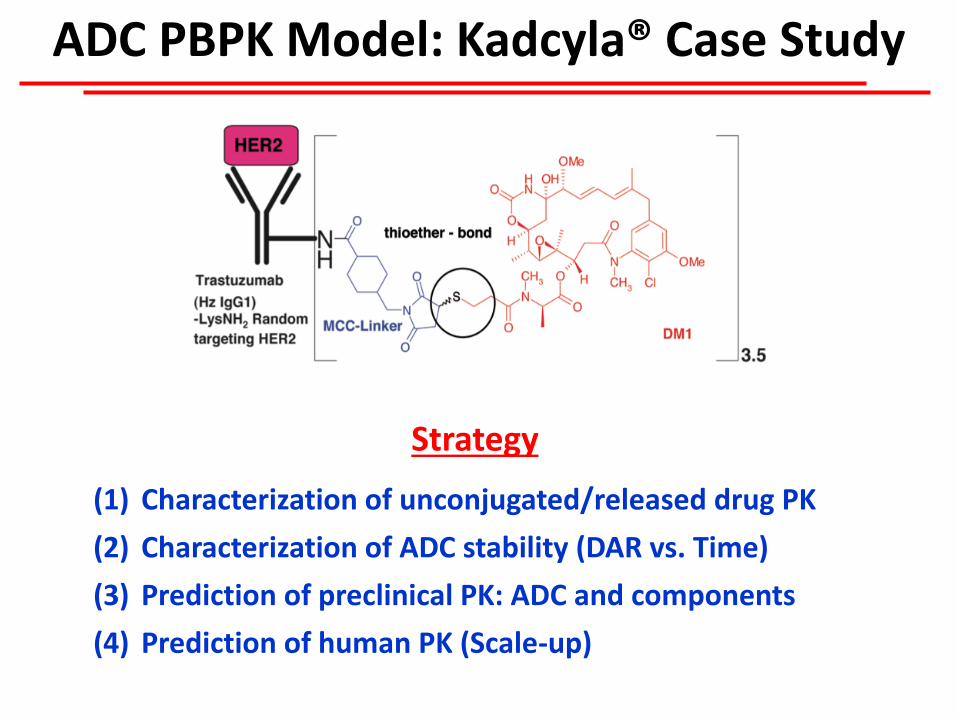
ADC PBPK Model: Kadcyla® Case Study
Strategy
(1) Characterization of unconjugated/released drug PK
(2) Characterization of ADC stability (DAR vs. Time)
(3) Prediction of preclinical PK: ADC and components
(4) Prediction of human PK (Scale-up)

ADC PBPK Model: Kadcyla® Case Study(1) Characterization of unconjugated/released drug PK
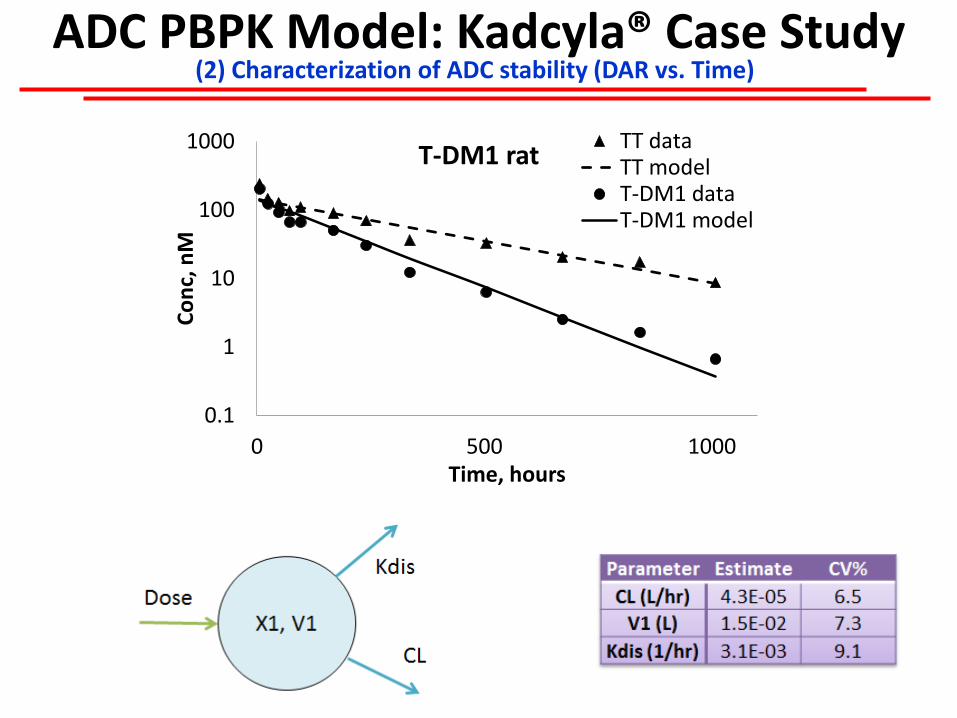
ADC PBPK Model: Kadcyla® Case Study(2) Characterization of ADC stability (DAR vs. Time)
0.1
1
10
100
1000
0 500 1000
Co
nc,
nM
Time, hours
T-DM1 ratTT dataTT modelT-DM1 dataT-DM1 model

ADC PBPK Model: Kadcyla® Case Study(3) Prediction of preclinical PK: ADC
Note: Observed ADC concentrations were measured as total tissue radioactivity

ADC PBPK Model: Kadcyla® Case Study(3) Prediction of preclinical PK: components
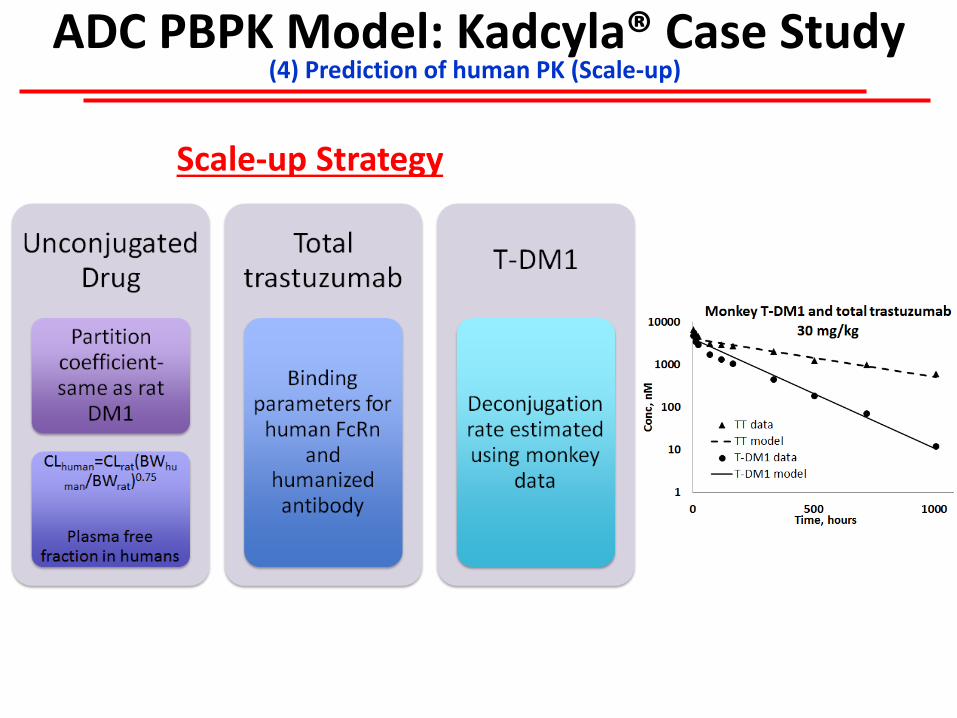
ADC PBPK Model: Kadcyla® Case Study(4) Prediction of human PK (Scale-up)
Scale-up Strategy

ADC PBPK Model: Kadcyla® Case Study(4) Prediction of human PK (Scale-up)

Application to Other ADCs: SGN-75

Application to Other ADCs: A1mcMMAF

Application to Other ADCs: HuC242-DM1

Application to Other ADCs: Anti-STEAP1-vcMMAE
Measurement error due to the use of residualizing isotope.

Application to Other ADCs: Anti-TENB2-vc-MMAE

Outline
Overview: ADCs
Prediction of Clinical Efficacy using a Multi-Scale Mechanistic PK/PD Model
Prediction of Clinical PK using a Platform PBPK Model for ADCs
Summary

Summary• Quantitative characterization and integration of
preclinical PK & PD data is essential for successful preclinical-to-clinical translation of ADCs
• PK/PD M&S is a very useful tool to aid rational discovery and development (MID3) of ADCs
• There is a need to conduct novel experiments, to better understand cellular and whole body disposition of ADCs and their components
• Understanding preclinical and clinical PK behavior of the released drug is equally important

Alison, Nahor (Pfizer)
Roche
NIGMS (NIH)
Acknowledgements
1R01GM114179-01
Center for Protein Therapeutics