beluga coal gasification feasibility study - beluga... · 1 beluga coal gasification feasibility...
TRANSCRIPT

Beluga Coal Gasification Feasibility Study
DOE/NETL-2006/1248
Phase I Final Report
July 2006

Disclaimer
This report was prepared as an account of work sponsored by an agency of the United States Government. Neither the United States Government nor any agency thereof, nor any of their employees, makes any warranty, express or implied, or assumes any legal liability or responsibility for the accuracy, completeness, or usefulness of any information, apparatus, product, or process disclosed, or represents that its use would not infringe privately owned rights. Reference therein to any specific commercial product, process, or service by trade name, trademark, manufacturer, or otherwise does not necessarily constitute or imply its endorsement, recommendation, or favoring by the United States Government or any agency thereof. The views and opinions of authors expressed therein do not necessarily state or reflect those of the United States Government or any agency thereof.

Beluga Coal Gasification Feasibility Study
DOE/NETL-2006/1248
Phase I Final Report for Subtask 41817.333.01.01 July 2006
NETL Contact:
Brent Sheets Manager
Artic Energy Office
Prepared by:
Robert Chaney Research & Development Solutions, LLC (RDS)/ Science Applications International Corp. (SAIC)
Lawrence Van Bibber
Research & Development Solutions, LLC/ Science Applications International Corp.
National Energy Technology Laboratory www.netl.doe.gov

Agrium Kenai Nitrogen Operations Plant Nikiski, Alaska
The Agrium fertilizer plant has been experiencing shortages of natural gas for
feedstock and winter shutdowns have occurred. This study focused on evaluating the feasibility of the gasification of Beluga coal, shipped from the Chuitna Mine
located across the Cook Inlet, to produce synthetic gas to be used by Agrium. The coal gasification facility would be located at the Agrium site.

1
BELUGA COAL GASIFICATION FEASIBILITY STUDY
Executive Summary
The objective of the Beluga Coal Gasification Feasibility Study was to determine the economic feasibility of developing and siting a coal-based integrated gasification combined-cycle (IGCC) plant in the Cook Inlet region of Alaska for the co-production of electric power and marketable by-products. The by-products, which may include synthesis gas, Fischer-Tropsch (F-T) liquids, fertilizers such as ammonia and urea, alcohols, hydrogen, nitrogen and carbon dioxide, would be manufactured for local use or for sale in domestic and foreign markets.
This report for Phase 1 summarizes the investigation of an IGCC system for a specific industrial setting on the Cook Inlet, the Agrium U.S. Inc. (“Agrium”) fertilizer plant in Nikiski, Alaska. Faced with an increase in natural gas price and a decrease in supply, the Agrium is investigating alternatives to gas as feed stock for their plant. This study considered all aspects of the installation and infrastructure, including: coal supply and cost, coal transport costs, delivery routes, feedstock production for fertilizer manufacture, plant steam and power, carbon dioxide (CO2) uses, markets for possible additional products, and environmental permit requirements.
Phase 2 of the project was initially planned to entail a generalized assessment of locating an IGCC plant at an alternative location in the Cook Inlet region, with plant size and design based on local and export markets for the suite of potential products. The Cook Inlet-specific Phase 1 results, reported here, provided insight and information that led to the conclusion that the second study should be for an F-T plant sited at the Usibelli Coal Mine near Healy, Alaska.
This Phase 1 case study is for a very specific IGCC system tailored to fit the chemical and energy needs of the fertilizer manufacturing plant. It demonstrates the flexibility of IGCC for a variety of fuel feedstocks depending on plant location and fuel availability, as well as the available variety of gas separation, gas cleanup, and power and steam generation technologies to fit specific site needs.
Background
Natural gas production from the major Cook Inlet fields is declining and known reserves are not sufficient to meet current demand beyond 2012. South Central Alaska natural gas prices have already risen and even in the best scenario, this upward trend will continue. The critical question is where South Central Alaska’s future energy supplies will come from and at what price. Because of the declining natural gas supplies, the Agrium plant is scheduled to shut down in the fall of 2006.
The Cook Inlet/Susitna Basin coal fields contain 1.4 billion short tons of measured reserves (10.5 billion short tons of identified reserves). The measured reserves are equivalent to 21.4 trillion cubic feet of natural gas or 3.7 billion barrels of North Slope crude oil on a Btu content basis. This resource is the last undeveloped coal field in the United States that is on tidewater open to year-round shipping. It could be used for electric power production, export, converted to high value products, or a combination of these.

2
There is renewed interest in the Beluga coal field, part of the Cook Inlet/Susitna Basin, to meet industrial and power requirements in the region. The increasing population in the area will require additional electric power generation. New developments, such as the Pebble Project, a proposed gold-copper mine, will also require additional power. Beluga coal, however, will potentially compete with other energy sources. For example, a spur line to transport North Slope gas is currently being investigated. There is a need, therefore, to technically and economically evaluate the Beluga coal option on a similar timeline. Having a completed study available will provide a base case for making project selections.
Faced with the increasing cost and reduced availability of natural gas, Agrium, which owns and operates a fertilizer plant at Nikiski on the Cook Inlet, is investigating the use of coal feedstock as a replacement for natural gas. The Agrium “Blue Sky Project” will assess the value of coal gasification in this specific industrial setting. Their concept includes gasification and a separate power plant, but is not an IGCC design.
The sections below summarize the study’s assumptions, project scope and results, key findings, conclusions/recommendations, and plans for Phase 2.
Project Scope and Results In this investigation, two plant configurations were considered for comparison. Case 1 is a system designed entirely as an IGCC. The IGCC plant would satisfy the Agrium facility’s entire feedstock and electric power needs. Because of the size of available components, the final design will have the capacity to produce excess electrical power that can be sold to the local grid.
The Case 2 design retains the gasification trains from Case 1 to produce the fertilizer feedstocks, but replaces the combined-cycle equipment with a conventional fluidized bed combustion system to produce steam for the plant and for power production.
The results of the investigation are summarized below under major topic areas.
Coal & Limestone – Beluga coal from an undeveloped mine approximately 30 miles across the Cook Inlet from Agrium’s plant is likely the most economic source of coal for the Cook Inlet region. The proven reserves are more than sufficient to supply the plant for the life of the project. Developers are actively pursuing permitting for the Chuitna Mine and plan to begin exporting to Pacific Rim countries by 2010. A second option is to transport coal from the currently operating Usibelli Coal Mine near Healy, AK. Both mines would produce sub-bituminous coal with nearly identical properties. Usibelli coal must be shipped by rail to either Anchorage or Seward. The final leg of the delivery chain for Chuitna or Usibelli coal is a barge trip across the Cook Inlet. The provisions of the Jones Act require that all shipping between U.S. ports must be on U.S. made, owned, and manned vessels. The Chuitna coal could be delivered to the Agrium plant at $1.84 to $1.99/MMBtu ($31.00.98 to $33.51/tonne); Usibelli coal could be delivered at $1.96 to $2.11/MMBtu ($33.10 to $35.63/tonne).
Limestone will be required in the design Case 2. The Alaska Lime Company mine near Cantwell could supply limestone to Agrium for an estimated $115/tonne, in sufficient quantity to meet plant demands.
Value Added Products – The demand for the coal gasification by-products of the Beluga Coal Gasification Project have been investigated as part of this evaluation. The areas considered include international, domestic, regional and local markets. Typical gasification products and by-products assessed in Phase 1 include elemental sulfur, sulfuric acid, slag (as an aggregate or
3
replacement), carbon dioxide (CO2), and Fischer-Tropsch diesel. The Phase 1 plant design does not include provisions for products other than fertilizer; however, the Phase 2 plant will be designed to produce Fischer-Tropsch fuels and other products. In Phase 2 the F-T analysis will be expanded. Phase 2 by-products may include nitrogen, carbon dioxide (for other than enhanced oil recovery), argon, and secondary value added by-products (naphtha, kerosene, etc.).
Carbon Dioxide – A coal gasification plant at the Agrium site would produce a significant quantity of CO2. The carbon to hydrogen ratio for coal is much higher than for natural gas. Therefore, a coal gasification plant sized to meet the hydrogen requirements of fertilizer production produces more CO2 than a plant fed with natural gas. The current natural gas fed plant emits about 114 MMscfd of CO2 in both concentrated AGR (acid gas removal) and dilute flue gas streams. A gasification plant, of a size to produce an equivalent amount of hydrogen (the current study’s Case 1 design) will emit about 280 MMscfd of CO2. Of that 280 MMscfd, 91 MMscfd will be in a concentrated CO2 gas stream from the acid gas processing section and 189 MMscfd will be in the form of dilute flue gas from the gas turbine stack. The desirability of developing a plant of this nature may hinge in part on the disposal or beneficial use of this CO2. For that reason, this study assessed the potential of CO2 for use in enhanced oil recovery (EOR) and for sequestration in underground reservoirs. There are more than a dozen reservoirs in the five major fields of Cook Inlet, within a 20-mile radius of the Agrium plant, that pass the screening criteria for miscible CO2 floods.
• Using the average range of incremental increase in production (8 to 11%) via CO2 flooding, the five major Cook Inlet oil fields have the potential to produce an incremental 290 to 400 million barrels of oil (MMbo). Using only the five major reservoirs and a 25% of cumulative production estimate, the incremental production would be approximately 300 MMbo.
• Screening level economics performed for the McArthur River field, the largest field in the Cook Inlet, suggest that an economic CO2 flooding program in Cook Inlet’s oil fields might be possible at oil prices greater than $35 to $40 per barrel, with the cost of CO2 ranging from $0.50/Mcf to $1.20/Mcf. After the EOR assessment was completed, a preliminary economic analysis showed that the capital equipment cost for capturing and handling the CO2 was not economically feasible, thus the CO2 capture segment of the Case 1 and 2 designs was drooped and it was assumes that the gas would be vented. Refined analyses may show ways of using the CO2 for EOR that are feasible.
• The results of a successful flooding program could extend the life of the oil fields for 20 or more years and yield as much incremental oil as has been produced from these fields in the last quarter century.
Natural Gas Market – Agrium currently relies on scarce Cook Inlet natural gas as the chief feedstock for manufacturing fertilizer. Switching to synthesis gas from coal will increase the amount of natural gas available for other uses such as home heating and electric power generation in the Cook Inlet area. The impact on natural gas demand by eliminating Agrium as a natural gas customer was evaluated in another DOE/RDS study (“Gas Needs and Market Assessment - Alaskan Spur Pipeline Project” Contract No. DE-AM26-04NT41817, Task 211.01.06, completed in June, 2006). In that assessment, it was assumed that unless low cost natural gas is obtained the fertilizer plant will suspend operations in the fall of 2006. If the Agrium plant converts to coal as feedstock, effectively removing it from the regional gas market,

4
no effect on that assessment was found, because conversion to coal will have the same effect as a plant shut-down.
Electric Power Market – The impact of Agrium switching from natural gas to coal would have a small impact on the local power market. The most effective design of the gasification system includes electrical generation capacity sufficient to completely power the Agrium facility and provide 70 MW of power for sale to the grid. Under the current grid configuration and markets, the impact of this increment on local power generation and transmission needs would be minimal. The grid infrastructure could handle the power without significant upgrades and the market would be able to absorb it. Incremental revenue from the 70 MW of power capacity would be about $45.94/MWh in 2010.
Gasification Plant Design – The coal gasification plant investigated in this study is designed to provide Agrium’s Kenai Nitrogen Operations (KNO) plant with the following suite of required products:
• 282 million standard cubic feet per day (MMSCFD) of hydrogen at 400 psig and of suitable quality for ammonia production.
• Stoichiometric quantity of nitrogen (approximately 100 MMSCFD) at 400 psig and 99.99% purity.
• 1,500,000 lb/hr steam at 1500 psig and a minimum temperature of 825°F.
• 300,000 lb/hr steam at 600 psig and 625°F.
• 5,000 TPD CO2 suitable for urea production (25 psig)
• Electric power to satisfy the auxiliary power requirements for the gasification plant and the KNO facility, to make the entire facility electric power independent.
In addition to the products provided from the IGCC plant to the fertilizer plant, the fertilizer plant will return 1,200,000 lb/hr of high-pressure condensate at 1200 psig and 450°F to the IGCC facility.
Phase 1 assessed two alternative design configurations for meeting the KNO requirements:
Case 1: Process the syngas from the gasification plant to supply required hydrogen and nitrogen to the KNO ammonia synthesis loop compressor and produce sufficient steam and power for internal KNO consumption. This case employs a gas turbine for power production.
Case 2: Process the syngas from the gasification plant to supply required hydrogen and nitrogen to the KNO ammonia synthesis loop compressor, but do not produce power from a gas turbine. Rather, it would employ a fluidized bed coal combustion power plant to independently produce the required power and steam for the KNO facility.
Six gasification technologies were considered for this study, and the ConocoPhillips E-Gas technology was ultimately selected. The criteria considered included commercial status, ability to gasify the proposed feedstock, type of solid waste produced, oxygen/coal ratio, modular capacity of the gasifier, syngas composition, operating pressure and other byproduct potential.
Preliminary results from Case 1 indicated that the syngas availability from the gasification plant could be improved by replacing the 7FA gas turbine combined cycle with a CFB coal-fired boiler. Initial analysis also indicated that capital cost savings could be realized through this

5
change in plant configuration. However, to produce sufficient steam and power to satisfy KNO operations, the CFB boiler and associated steam turbine would have to be larger and less efficient, resulting in a higher capital cost per unit of output. Table ES.1 summarizes the performance characteristics and capital costs for Case 1 and Case 2.

6
Table ES.1 Case-by-Case Comparison of Performance and Capital Costs
Case 1 Case 2
Power Production
Gas Turbine 197 MW GE 7FA N/A
Steam Turbine 36 MW 156 MW
Syngas Expander N/A 16 MW
Net Plant Power 70 MW1 12 MW
Coal Feed
To Gasifiers 11,700 TPD 10,680 TPD
To CFB Boiler N/A 1,800 TPD
Overall Plant Efficiency, HHV2
54.8% 48.4%
Condenser Duty 270 MMBtu/hr 729 MMBtu/hr
Capital Cost Area ($1,000’s)
Gasification Island $569,500 $567,900
Gas Cleanup $261,600 $263,900
Gas Turbine and HRSG $153,000 N/A
CFB Boiler N/A $254,700
Syngas Expander-Generator N/A $8,100
Steam Turbine-Generator $12,600 $47,200
Cooling Water System $9,400 $19,800
Feedwater System $8,000 $26,100
Balance of Plant $625,900 $682,300
Total Plant Cost $1,640,000 $1,870,000
Financial Analysis
Financial analyses for both cases were performed using the Power Systems Financial Model Version 5.0 (developed by Nexant for DOE) and the case-specific design and project cost estimates. The Power Systems Financial Model has been used in numerous gasification studies, and is now the NETL standard for IGCC systems analysis. The key results desired from the analysis were the project return on equity investment, discounted cash flow, and identification of 1 The Case 1 design will provide a Net Plant Power of 81 MW. However, due to the potential sale price for power at various levels, the economic analyses assumed 70 MW of power available for sale to the grid. 2 In this case, Overall Plant Efficiency equals the power generated plus chemical value of the hydrogen generated divided by the thermal input to the plant. It does not take into account the efficiency of the down-stream process in which the hydrogen is used.

7
key model sensitivities. The amounts of hydrogen, nitrogen, CO2, power, and steam exported to the Agrium facility were held constant. Table ES.2 shows the key model input differences and financial results for each case.
Table ES.2 Financial Cost Summary
Case 1 Case 2
Plant EPC3 Cost ($MM)4 1312 1498
Power Export to Grid (MW) 70 12
ROI (%) 11.1 6.0
Payback Year (2011 Start) 12 yrs. 20 yrs.
Case 1 clearly possesses superior financial potential relative to Case 2. While both cases produce enough raw materials necessary for ammonia and urea production at the Agrium facility, Case 2 is more expensive, produces less export power, and requires slightly more coal feed. Removal of the gas turbine from Case 1 and replacement in Case 2 with a CFB and a larger steam turbine to supply the necessary feedstocks to the Agrium plant does not appear to be economically justified.
Sensitivity analyses were performed on all model inputs in both cases. The items found to have the greatest impact on the financial results are the plant system availability, EPC cost, ammonia/urea prices, and delivered coal cost. None of the other model inputs impacted the ROI by more than 3 percentage points for the range of variables tested. Events that increase product prices and/or reduce capital or delivered coal costs will have a large positive influence on the project economics. The equity ROI remained positive after examining a wide range of potential conditions for EPC cost, availability, and coal price. For these inputs, the model results should be considered robust for this stage of the project analysis.
Because of the very wide range of potential values, the model input with the largest potential impact on project economics is the ammonia/urea price. In the last eight years, ammonia prices have ranged between $100 and $275/metric ton, with considerable volatility. Since this project has an estimated 30-year project life, the sensitivity analysis examined this entire price range. At ammonia prices at or below ~$150/metric ton, the project will have difficulty producing positive equity returns. None of the other financial model inputs impacted the results as strongly over the range of possible inputs considered. While this is not an issue that is unique to the development of a gasification facility at the Agrium site, it should have the greatest focus when making future capital investment decisions at the site.
The CO2 produced from the proposed gasification plant has potential economic value for enhanced oil recovery operations in the region. An initial value of $0.50/MSCF of carbon dioxide was used after discussions with local oil and gas producers. Designing the plant to
3 Engineering, Procurement, and Construction 4 This value is the same as the “Total Plant Cost” from Table ES.1 less the 25% contingency

8
capture and sell the CO2 under those conditions yielded an IRR that was ~1 percentage point lower than the final Case 1 design. A sensitivity analysis on carbon dioxide showed that a value of nearly $1.00/MSCF would be necessary to make the increased capital expenditure a break-even proposition with Case 1. Since it was estimated that this value is higher than what could be obtained in the Alaskan market, equipment for carbon dioxide capture and storage was removed from the base case designs.
Environmental Issues – Construction and operation of an IGCC facility at the existing Agrium Kenai Plant would require a number of federal, state and borough environmental permits. Environmental issues pertaining to air emissions, water supply, wastewater discharges, management of solid and hazardous wastes, and marine ecological impacts would need to be addressed in the project planning and design process to ensure compliance with existing regulatory requirements. In addition, one or more of the federal agencies with permitting jurisdiction could require an Environmental Assessment or an Environmental Impact Statement in accordance with the National Environmental Policy Act (42 U.S.C. § 4321 et seq.).
Phase 1 Conclusions: The analyses showed that:
• The conversion of the Agrium plant is technically and economically feasible under the assumptions made. In the most financially attractive feasible case, Case 1 had an internal rate of return of 11.1%; Case 2 had an IRR of only 6.0%. Developers and investors use economic hurdles to judge investments and risk. Each case is different, so whether this yield is sufficiently high to secure financial commitments is a decision that can only be made by developers.
• There are sufficient coal resources to supply the plant at an economic delivered price.
• CO2 will be produced in sufficient quantity and at a cost that may permit enhanced oil recovery in the Cook Inlet. The potential exists to recover as much as 300 MMbo – equaling the last 25 years of production. However, the CO2 sales price will have to be greater than currently projected for this to be economically feasible.
• Large domestic and export markets exist for many by-products.
o The developing Fischer-Tropsch diesel market has potentially the best return, but is also the one that is the least understood at this time.
o Elemental sulfur and sulfuric acid have good and well understood world-wide markets.
o Slag will need to be marketed locally as low-density aggregate, road building material, or sand blasting grit.
• Natural Gas - No change to the predictions described in “Gas Needs and Market Assessment - Alaskan Spur Pipeline Project”5 was found.
5 Thomas, C.P. and C. Ellsworth, et al, (RDS), “Gas Needs and Market Assessment - Alaskan Spur Pipeline Project” Contract No. DE-AM26-04NT41817, Task 211.01.06, completed in June, 2006.

9
• Electric power - The 70 MW of export power will bring a sales price of about $45.95/MWh in 2010. This excess power will not result in major impacts on the generation or transmission systems in the region over the time period evaluated.
• An analysis of the current design basis indicates that a proposed IGCC facility at the Agrium Kenai Plant is feasible in terms of current environmental permitting and compliance requirements imposed by federal, state and local regulations. Detailed environmental compliance strategies and mitigation measures would need to be developed in concert with design details and operational plans.
Phase 2 Project Plan: The Phase 1 plant was designed for a very specific size, optimized for the level of production at the Agrium plant. In Phase 2, a plant based on the Phase 1 design will be considered for location at the Usibelli Coal Mine, near Healy. An NETL project6 has determined that Healy would be the third most likely coal-to-liquids plant site in Alaska, after Nikiski and Beluga. Alaska Natural Resources to Liquids Company is pursuing a private sector initiative to develop the Alaska Beluga Coal-to-Liquids Project (AK Beluga CTL) on the west side of Cook Inlet. Since the Nikiski site was used in Phase 1 and AK Beluga CTL is underway, the Healy site was selected for Phase 2. The Healy plant will be optimized for commodity production levels consistent with expected local and export market demand and for electric power output levels consistent with growth projections and infrastructure capabilities. The conceptual design of this plant will be based on the design of the Phase 1.
Alaska Natural Resources to Liquids Company is pursuing a private sector initiative to develop the Alaska Beluga Coal-to-Liquids Project (AK Beluga CTL) on the west side of Cook Inlet. The AK Beluga CTL plant is also a gasification based facility and is on much scale larger (80,000 barrels per day) than that considered in Phase 1 of this study. As part of Phase 2, an investigation of the feasibility of piping synthesis gas from the proposed CTL plant to the Agrium plant will be undertaken.
6 Integrated Concepts and Research Corporation (ICRC), “Production and Demonstration of Synthesis Gas-Derived Fuels” NETL Contract DE-FC26-01NT41099

10
Contributors and Acknowledgements This work was funded by the U.S. Department of Energy's National Energy Technology Laboratory (U.S. DOE-NETL). Brent Sheets and James Hemsath of the NETL Arctic Energy Office (AEO) were the contract monitors and the authors would like to acknowledge the significant role played by U.S. DOE/NETL/AEO in providing programmatic guidance and review of this report. The analytical portion of this study was conducted over a five month period beginning in October 2005. Assistance and support was received from many agencies and industry. Specifically, the authors thank members of the Advisory Committee for input and guidance, and for providing assistance in obtaining publicly available data in a timely and efficient manner.
Advisory Committee An Advisory Committee was formed to review the scope of work, monitor progress, and make suggestions for further work. The primary function of the committee was to make sure the most critical issues were addressed and to assist in obtaining critical data. The Advisory Committee met on December 1, 2005 and February 17, 2006. The committee members are listed below.
• Agrium U.S. Inc: Lisa Parker, Corporate Relations; Tim Johnson, Technical Services • Alaska Department of Natural Resources: Rick Fredericksen, Mining Section Chief,
Division of Mining, Land, and Water • Alaska Governors Office: Linda Hay, Special Staff Asst. - Resources • Alaska Industrial Development and Export Authority: Ron Miller, Executive
Director • Alaska Power Association: Brad Janorschke, General Manager Homer Electric
Association • DRven: Robert Stiles, President, Mine Owner Representative • Usibelli Coal Mine: Steve Denton, V.P. Business Development • At-Large: Eric Yould • In addition to their participation in the Advisory Committee, several members were
interviewed by phone and in person, in some cases multiple times, regarding select opportunities. They graciously shared materials and estimates, and directed us to visit web sites and interview other agencies and developers involved in the industrial opportunities.

11
Contributors
Technical Brent Sheets, Manager, AEO, NETL
James Hemsath, AEO, NETL
Michael Eastman, SMTA, SCC, NETL
Larry Van Bibber, Subtask Manager, RDS/SAIC
Robert Chaney, Technical Project Manager, RDS/SAIC
Robert Dolence, RDS/Leonardo Technologies, Inc. (LTI)
David D. Faulder, RDS/SAIC
Robert Gentile, RDS/LTI
David Hite, RDS/SAIC
Avanalist Jackson, RDS/LTI
Sheldon Kramer, RDS/Nexant
Robert Lenhart, RDS/Parsons
Chris Munson, RDS/LTI
Michael Nagy, RDS/Entrix
Scott Olson, RDS/Nexant
Mike Rutkowski, RDS/Parsons
Ronald Schoff, RDS/Parsons
Charles Thomas, RDS/SAIC
Ralph Zarumba, RDS/SAIC
Steering Committee
Lisa Parker, Corporate Relations, Agrium U.S., Inc.
Tim Johnson, Technical Services, Agrium U.S., Inc.
Ron Miller, Executive Director, Alaska Industrial Development and Export Authority
Rick Fredericksen, Mining Section Chief, Alaska Department of Natural Resources
Linda Hay, Special Staff Assistant-Resources, Alaska Governors Office
Brad Janorschke, General Manager Homer Electric Assoc., Alaska Power Association
Robert Stiles, Mine Owner Representative, DRven
Steve Denton, V.P. Business Development, Usibelli Coal Mine
Eric Yould, At-Large

12
Contents
Executive Summary ....................................................................................................................... 1
Contributors and Acknowledgements ......................................................................................... 10 Advisory Committee............................................................................................................................. 10 Technical Contributors ........................................................................................................................ 11
Contents........................................................................................................................................ 12
Figures.......................................................................................................................................... 14
Tables............................................................................................................................................ 14
Acronyms and Abbreviations....................................................................................................... 16
1. INTRODUCTION.................................................................................................................... 21
2. COAL SUPPLY AND PRODUCT MARKETS....................................................................... 23 2.1 Coal Supply Options....................................................................................................................... 23
2.1.1 Alaskan Coal Fields.................................................................................................................................23 2.1.2 Chuitna Mine...........................................................................................................................................25 2.1.3 Usibelli Mine ............................................................................................................................................27 2.1.4 Coal Properties ..........................................................................................................................................29 2.1.5 Coal Barging Options .............................................................................................................................29 2.1.6 Delivered Cost of Coal ............................................................................................................................31 2.1.7 Section 27, Merchant Marine Act, 1920 – The Jones Act.........................................................................32
2.2 Limestone ........................................................................................................................................ 33 2.2.1 Limestone Supply ....................................................................................................................................33 2.2.2 Limestone Delivered Cost Estimates .....................................................................................................33
2.3 By-Product Markets ....................................................................................................................... 34 2.3.1 Slag ...........................................................................................................................................................34 2.3.2 Fischer-Tropsch Diesel Fuel .....................................................................................................................35 2.3.3 Sulfur........................................................................................................................................................37
2.4 CO2 Use in Cook Inlet Region ....................................................................................................... 40 2.4.1 Methods of CO2 Sequestration ...............................................................................................................41 2.4.2 Potential Geological Sequestration Sites – Cook Inlet .........................................................................47 2.4.3 Examples -Carbon Dioxide Flooding of Oil Reservoirs .......................................................................53 2.4.4 Examples of Carbon Dioxide Sequestration in Saline Aquifers ..........................................................56 2.4.5 Cook Inlet Oil Fields and CO2 Flood Potential.....................................................................................57 2.4.6 Injection in Saline Aquifers ....................................................................................................................69 2.4.7 Conclusions ..............................................................................................................................................70
2.5 Impact on Cook Inlet Region Natural Gas Markets ................................................................... 71 2.6 Impact on Regional Power Grid.................................................................................................... 71
2.6.1 Wholesale Market Price Forecast ..........................................................................................................72 3. GASIFICATION PLANT TECHNOLOGY AND PLANT DESIGN .................................... 73
3.1 Design Basis..................................................................................................................................... 73 3.1.1 Project Background...................................................................................................................................73 3.1.2 Site Description.........................................................................................................................................74
13
3.1.3 Design Coal...............................................................................................................................................75 * As Received ....................................................................................................................................................76 3.1.4 Environmental Requirements....................................................................................................................76 3.1.5 Balance of Plant ........................................................................................................................................77
3.2 Plant Design..................................................................................................................................... 79 3.2.1 Plant Configuration ...................................................................................................................................79 3.2.2 Approach to Meeting the Design Goals ....................................................................................................79
3.3 Case 1 – Based on IGCC Concept ................................................................................................. 81 3.3.1 Plant Design ..............................................................................................................................................81 3.3.2 Process Description...................................................................................................................................87
3.4 Case 2- Hydrogen and CO2 Production Without Sequestration or Power Production............ 93 3.4.1 Plant Design ..............................................................................................................................................93
3.5 Major Equipment List for Case 1 and Case 2.............................................................................. 99 3.6 Economic Parameters..................................................................................................................... 99
3.6.1 Capital Costs .............................................................................................................................................99 3.6.2 Production Costs and Expenses...............................................................................................................100
4. FINANCIAL ANALYSIS ...................................................................................................... 101 4.1 Methodology.................................................................................................................................. 102 4.2 Results and Sensitivities ............................................................................................................... 103
4.2.1 Case 1 .....................................................................................................................................................103 4.2.2 Case 2 .....................................................................................................................................................109
5. ENVIRONMENTAL PERMITTING AND ISSUES ........................................................... 115 5.1 Air Emissions ................................................................................................................................ 115
5.1.1 Emissions................................................................................................................................................115 5.1.2 Permitting ..............................................................................................................................................116 5.1.3 Applicable Limits ..................................................................................................................................118 5.1.4 Air Emissions Conclusion .....................................................................................................................120 5.1.5 Case 2 – Addition of Coal Fired Boiler...................................................................................................121
5.2 Solid and Hazardous Waste......................................................................................................... 122 5.3 Water and Wastewater ................................................................................................................ 123 5.4 Site and Dock Modifications........................................................................................................ 124 5.5 Coal Marine Transport ................................................................................................................ 124
5.5.1 Transport Across Cook Inlet................................................................................................................124 5.5.2 Transport From Seward .......................................................................................................................125
5.6 National Environmental Policy Act (NEPA) Compliance......................................................... 125 5.7 Summary ....................................................................................................................................... 127
6. SUMMARY AND CONCLUSIONS...................................................................................... 128 6.1 Coal and Limestone Supply ......................................................................................................... 128 6.2 Product Markets ........................................................................................................................... 128
6.2.1 By-Product Markets..............................................................................................................................128 6.2.2 Impact on Natural Gas Markets ..........................................................................................................128 6.2.3 Impact on Power Markets ....................................................................................................................128
6.3 CO2 EOR and Sequestration ....................................................................................................... 128

14
6.4 Plant Design................................................................................................................................... 130 6.5 Economic evaluation..................................................................................................................... 130 6.6 Environmental Permitting ........................................................................................................... 130
Appendix A: Project Blue Sky ................................................................................................... 136
Appendix B: Chuitna Mine Development Plan Executive Summary...................................... 137
Appendix C: Barge Cost Estimates ........................................................................................... 138
Appendix D: Case 1 and Case 2 Equipment lists...................................................................... 142
Appendix E: Financial Model Entries ...................................................................................... 161
Appendix F. Applicable Federal State and Local Permitting Activities. ................................. 165
FIGURES Figure 2-1 Map showing location of the Chuitna Project relative to the Agrium plant, Anchorage
and Seward............................................................................................................................ 26 Figure 2-2 Map of the Cook Inlet Region showing potential barge routes. ................................ 30 Figure 2-3 The effects of pressure, temperature and salinity on the solubility of CO2 in a saline
aquifer ................................................................................................................................... 47 Figure 2-4 Tertiary Stratigraphy (Kenai Group) of Upper Cook Inlet Bbasin ............................ 49 Figure 2-5 McArthur River Field Historical Production (AOGCC database)............................ 65 Figure 2-6 Case 1 (40 MMcf/d CO2) - McArthur River field estimated cumulative present worth
total cash flow versus oil price and CO2 cost at 12% discount rate (2005$) ........................ 66 Figure 2-7 Average Revenue per MWH Generated and Sold into the Railbelt Market for a 70
MW Plant .............................................................................................................................. 73 Figure 3-1 Case 1 Process Block Flow Diagram E-Gas™ Gasifier-Based Hydrogen Production
Plant ...................................................................................................................................... 84 Figure 3-2 Case 2 Process Block Flow Diagram E-Gas™ Gasifier-Based Hydrogen Production
Plant ...................................................................................................................................... 96 Figure 4-1 Key Plant Inputs/Outputs, Case 1 Financial Model .................................................. 101 Figure 4-2 Case 1 Change in IRR, +/- 25% Model Inputs ......................................................... 106 Figure 4-3 Effect of Availability on Case 1 Project IRR............................................................ 107 Figure 4-4 Effect of Ammonia/Urea Sales Price on Case 1 Project IRR ................................... 108 Figure 4-5 Effect of Delivered Coal Price on Case 1 Project IRR ............................................. 109 Figure 4-6 Key Plant Inputs/Outputs, Case 2 Economic Model................................................. 110 Figure 4-7 Effect of Availability on Case 2 Project IRR............................................................ 113 Figure 4-8 Effect of Ammonia/Urea Sales Price on Case 2 Project IRR ................................... 113 Figure 4-9 Effect of Delivered Coal Price on Case 2 Project IRR ............................................. 114
TABLES Table ES.1 Case-by-Case Comparison of Performance and Capital Costs ................................... 6 Table ES.2 Financial Cost Summary ............................................................................................. 7

15
Table 2.1 Alaska Coal Resources ................................................................................................ 24 Table 2.2 Coal Reserves at the Chuitna Mine.............................................................................. 24 Table 2.3 Coal Reserves at the Usibelli Mine............................................................................... 25 Table 2.4 Comparison of the Properties of Chuitna and Usibelli Coals .................................... 29 Table 2.5 Barge Costs for Transport of Coal to Agrium Plant .................................................... 31 Table 2.6 Summary of Cost Estimates for Cost of Coal Delivered to Agrium Plant .................. 32 Table 2.7 Estimates of the Cost of Limestone Delivered to Agrium from Cantwell................... 34 Table 2.8 Global Gasoline / Diesel Sulfur Specifications ........................................................... 36 Table 2.9 Comparison of Conventional and FT Diesel Specifications........................................ 36 Table 2.10 Global Elemental Sulfur Demand and Price from U.S. Suppliers............................. 38 Table 2.11 Global Sulfuric Acid Demand and Price ................................................................... 38 Table 2.12 F-T Diesel Demand and Price (through 2009)........................................................... 39 Table 2.13 Alaska Slag Demand and Price.................................................................................. 39 Table 2.14 Alaska Cement Perlite Demand and Price................................................................. 40 Table 2.15 Dominated Displacement Characteristics for Carbon Dioxide Displacement
Processes ............................................................................................................................... 42 Table 2.16 Depth vs. Oil Gravity Screening Criteria for CO2 Flooding..................................... 43 Table 2.17 Cook Inlet Oil Fields – Production to 12-31-05, ERR, EUR, OOIP, and Possible
Additional Reserves from CO2 Enhanced Oil Recovery Technology. ................................. 52 Table 2.18 Cumulative production, reservoir and oil characteristics of potential CO2-EOR
candidates.............................................................................................................................. 58 Table 2.19 McArthur River field Pro Forma Economic Results at $50/bbl oil and $0.75/Mcf
CO2 cost for Case 1 Assumptions (copy of spread sheet printout)....................................... 67 Table 2.20 Wholesale price of electric power that can be sold to the grid as it is now configured
............................................................................................................................................... 72 Table 3.1 Site Ambient Conditions.............................................................................................. 74 Table 3.2 Site Characteristics ...................................................................................................... 75 Table 3.3 Design Coal.................................................................................................................. 76 Table 3.4 Beluga Coal IGCC Study Environmental Design Basis.............................................. 77 Table 3.5 Typical Process & Cooling Water Properties .............................................................. 79 Table 3.6 Gasification Technology Selection Matrix .................................................................. 80 Table 3.7 Case 1 Plant Performance Summary ........................................................................... 83 Table 3.8 Case 1 Process Stream Compositions and State Points ............................................... 85 Table 3.9 Case 2 Plant Performance Summary ........................................................................... 95 Table 3.10 Case 2 Process Stream Compositions and State Points ............................................. 97 Table 3.11 Case 1 and 2 Capital Cost Summary ....................................................................... 100 Table 4.1 Case 1 Financial Cost Summary................................................................................ 104 Table 4.2 Case 1 Total Plant Costs ............................................................................................ 105 Table 4.3 Case 2 Financial Cost Summary................................................................................ 111 Table 4.4 Case 2 Total Plant Costs ............................................................................................ 112

16
Acronyms and Abbreviations ACMCRA Alaska Surface Coal Mining Control and Reclamation Act
AFBC Atmospheric fluidized-bed combustion
AFDC Allowance for funds used during construction
AGR Acid gas removal
ASU Air separation unit
BGL British Gas Lurgi
Btu British thermal unit
CCT Clean coal technology
CDR Carbon Dioxide Recovery
cfm Cubic feet per minute
CF Capacity factor
CO2 Carbon dioxide
COE Cost of electricity
COS Carbonyl sulfide
COE Cost of electricity
CS Carbon steel
CT Combustion turbine
CWT Cold water temperature
dB Decibel
DCS Distributed control system
DOE Department of Energy
EPA Environmental Protection Agency
EPC Engineering, procurement, and construction
EPRI Electric Power Research Institute
ESP Electrostatic precipitator
ETE Effective thermal efficiency
FBHE Fluidized-bed heat exchanger
FD Forced draft
FGD Flue gas desulfurization
FOAK First of a kind
FRP Fiberglass-reinforced plastic

17
gpm Gallons per minute
GJ Gigajoule
GT Gas turbine
hr Hour
H2 Hydrogen
H2SO4 Sulfuric acid
HAP Hazardous air pollutant
HCl Hydrochloric acid
HDPE High density polyethylene
HHV Higher heating value
hp Horsepower
HP High pressure
HRSG Heat recovery steam generator
HVAC Heating, ventilating, and air conditioning
HWT Hot water temperature
Hz Hertz
in. H2O Inches water
in. Hga Inches mercury (absolute pressure)
in. W.C. Inches water column
ID Induced draft
IGCC Integrated gasification combined cycle
IP Intermediate pressure
ISO International Standards Organization
ITM Ion transfer membrane
KBR Kellogg, Brown and Root, a subsidiary of Halliburton
KNO Agrium Kenai Nitrogen Operations
kPa Kilopascal absolute
kV Kilovolt
kW Kilowatt
kWe Kilowatts electric
kWh Kilowatt-hour
kWt Kilowatts thermal
LAER Lowest achievable emission rate

18
lb/ft2 Pounds/square foot
LCOE Levelized cost of electricity
LASH Limestone ash
LHV Lower heating value
LP Low pressure
MAF Moisture and Ash Free
MCR Maximum coal burning rate
MDEA Methyldiethanolamine
MEA Monoethanolamine
MHz Megahertz
MMBtu Million British thermal units (also shown as 106 Btu)
MMSCFD Million Standard cubic feet per day (also shown as 106 sfcd)
MPa Megapascals absolute
MSL Mean sea level
MWe Megawatts electric
MWh Megawatts-hour
MWt Megawatts thermal
NETL National Energy Technology Laboratory
N/A Not applicable
NAAQS National Ambient Air Quality Standards
NGCC Natural gas combined cycle
NM3 Normal Cubic meter
NOx Oxides of nitrogen
NSPS New Source Performance Standards
O&M Operations and maintenance
OD Outside diameter
OP/VWO Over pressure/valve wide open
OTR Ozone transport region
PA Primary air
PC Pulverized coal
PFD Process Flow Diagram
pph Pounds per hour
ppmvd Parts per million volume, dry

19
PRB Powder River Basin coal region
PSA Pressure Swing Adsorption
psia Pounds per square inch differential
psig Pounds per square inch gage
RDS Research and Development Solutions, LLC
rpm Revolutions per minute
SC Supercritical
SCFD Standard cubic feet per day
scfm Standard cubic feet per minute
scmh Standard cubic meter per hour
SCR Selective catalytic reduction
SMR Steam methane reformer
SNCR Selective non-catalytic reduction
SNG Synthetic natural gas
SO2 Sulfur dioxide
SoCo Southern Company
SOFC Solid oxide fuel cell
SS Stainless steel
TAG Technical Assessment Guide
ST Steam turbine TCR Total capital requirement
TGTU Tail gas treating unit
TPC Total plant capital (cost)
THGD Transport hot gas desulfurizer
TPC Total plant cost
tpd Tons per day
tph Tons per hour
TPI Total plant investment
Tonne Metric ton (1,000 kilograms or 2,204.62 pounds)
V-L Vapor Liquid portion of stream (excluding solids)
WB Wet bulb
wt% Weight percent

20

21
1. INTRODUCTION The Cook Inlet area of South Central Alaska is endowed with significant natural resources. Oil was first discovered in the area in 1955. Further exploration revealed significant natural gas resources that, until recently, were in excess of demand and essentially stranded. During the later part of the 20th century, low cost natural gas provided residents with low cost home heating and electric power. Low cost gas also spawned industrial uses – liquefied natural gas (LNG) and fertilizer plants were developed to produce products for export.
With production from the Cook Inlet’s oil and gas fields on a fairly steep decline, the era of low-cost natural gas is over.7 Rising natural gas prices, now tied to Henry Hub prices in the lower 48 states, are compelling Alaska to re-evaluate the natural gas and electric power situation in the Cook Inlet area.8 The potential for a spur pipeline from the Alaska Natural Gas Transportation System (ANGTS) to provide Alaska North Slope (ANS) natural gas to the Cook Inlet is being aggressively studied.9
This situation is also encouraging industry and policy makers to re-evaluate the role coal can play in South Central Alaska. The Beluga-Matanuska basin coal fields are the largest undeveloped coal fields on tidewater in the United States. These reserves could supply electric power plants and industrial activities for decades to come. The economic feasibility of developing these industries is becoming increasingly attractive as energy prices increase worldwide.
A few small coal mines near Chickaloon and Jonesville have operated for many years in the area. Recently, developers have initiated planning and permitting activities for the Chuitna Coal Mine, a large mine near the village of Tyonek that would begin exporting coal in 2010. A major coal mine like this in the Beluga coal field would make feedstock available for power and industrial plant development in the region.
The Beluga Coal Gasification Feasibility Study is aimed at assessing the use of sub-bituminous coal from Beluga in an integrated gasification combined-cycle (IGCC) plant for the co-production of electric power and synthetic gas and fuels such as Fischer-Tropsch liquids. IGCC technology offers the potential for very clean chemical and power production and the potential for carbon dioxide capture and sequestration. However, as the investigation progressed, we focused on production of feed stock for the Agrium plant and did not consider production of F-T fuels for that site. This report summarizes the results of that assessment.
“Enhanced Oil and Natural Gas Production through Carbon Dioxide Injection” is the subject of the U.S. DOE Funding Opportunity Notice No. DE-PS26-06NT15430. It is the result of a Congressional mandate contained in the 2005 Energy Policy Act, P.L. 109-58, Section 354,
7 Thomas, C. P., Doughty, T. C., Faulder, D. D., and Hite, D. M., 2004, South-Central Alaska Natural Gas Study: U. S. Department of Energy, National Energy Technology Laboratory, Arctic Energy Office 8 “Gas Needs and Market Assessment - Alaskan Spur Pipeline Project” Contract No. DE-AM26-04NT41817, Task 211.01.06, to be completed in June, 2006 9 NETL Project DE-FC26-05AM42653, “Conceptual Engineering / Socio-Economic Impact Study of a Gas Spur Pipeline to South Central Alaska”, ASRC Constructors

22
Subsection (c). This Act provides for a demonstration program for EOR via CO2 injection. It specifies that priority will be given to projects in the Williston Basin in North Dakota and Montana, and in the Cook Inlet Basin in Alaska. This demonstrated the recognized importance of CO2 use in the Cook Inlet region.
During the course of this Beluga Coal study, NETL became aware of an effort by Agrium Inc. to assess the viability of converting their fertilizer plant in Nikiski from natural gas feedstock to coal. The “Blue Sky” project would significantly change the operations and economics of the Agrium plant and would produce power for sale to the local electric grid. Acknowledging the presence of the Blue Sky effort, NETL decided to modify the study’s scope and use the Agrium site as the basis for investigating the feasibility of IGCC technology. The project team consulted extensively with Agrium about their plant’s configuration and requirements, while taking an independent approach to technology and design.
Phase 1 of the current study focused on providing the Agrium plant with all of its synthesis gas needs and sufficient electrical power to eliminate power purchases from the local grid. Phase 2 of the project will consider other Alaskan locations and sizes based on local conditions and potential market sizes.
In Phase 1, equipment sizing resulted in a modest amount of excess power potential that could be sold if warranted. Blue Sky has proposed a significantly larger power plant than the plant proposed in this study, resulting in more power for sale. Project Blue Sky is summarized in Appendix A.
Since IGCC technology coupled with Fischer-Tropsch (F-T) technology can produce a variety of valuable products, this study also included an assessment of the market potential for F-T liquids. While not factored into the economic analysis of the Agrium case study, the assessment provides a basis for sizing other plants in the area to produce products for local and export markets.
Perhaps the most important supporting analyses conducted for this project is the potential for use or disposal of CO2 in the region. All plants fed by coal or natural gas produce large amounts of carbon dioxide (CO2), most of which is currently emitted to the atmosphere. Increasingly, there is interest in either sequestering or using the CO2 for useful purposes. Local options include injecting the CO2 into underground reservoirs or aquifers or using it for enhanced oil recovery (EOR). These options and their economic feasibility were assessed in this study.
Additionally, it is recognized that other gasification projects have been proposed for Alaska. They are addressing other locations in the region and other products. While they are similar to this work, they are very different in scope and magnitude. They include:
• The Fischer-Tropsch Fuel Production and Demonstration Project10 – an investigation of the feasibility of wide-scale use of F-T fuels in the U.S. As part of that study, siting a small footprint F-T plant in Alaska was studied. Plants fed by coal or natural gas were determined to be best sited at Nikiski, the Beluga coal field, Healy (the Usibelli Mine), or in Bristol Bay (where significant exploration of natural gas is
10 Integrated Concepts and Research Corporation (ICRC), “Production and Demonstration of Synthesis Gas-Derived Fuels”, NETL Contract DE-FC26-01NT41099

23
underway). Nikiski was investigated as a site for a gasification plant in Phase 1 of this project. The possible expansion of the Agrium plant to produce F-T products should be investigated by the company and its investors. The Beluga site is being investigated – see below. Thus, in Phase 2 much of the effort will be on the Usibelli site.
• The Alaska Beluga Coal to Liquids Project11 - an 80,000 bbl/d F-T liquids plant sited near the Beluga coal field. This project, being pursued by the private sector, is in development and financing is being sought. Thus, in Phase 2, a Beluga site will not be considered.
The results of these projects provided useful information and guidance to this work. Where ever possible the results of previous studies were used to prevent duplication.
This report is organized into the following sections;
• Coal Supply and Product Markets
o Coal – Assess supply, delivery, and costs of coal delivered to the plant. Limestone was also assessed because it would be required in a Case 2 scenario.
o Alternative Product Markets – Assess market potential for products other than fertilizer from a gasification plant.
o Carbon Dioxide – Assess the potential use of CO2 in the Cook Inlet for EOR or sequestration by injection into aquifers and geologic formations.
o Impacts on Regional Electric Power and Natural Gas Markets – Conversion of the Agrium plant to coal may produce power for sale to the grid ands will change the demand for natural gas. This project assessed the impact on the recent projections for power and natural gas demands.
• Gasification Plant Technologies and Plant Design – A conceptual design for both Case 1 and 2 are described and the characteristics of the resulting plant are described.
• Financial Analysis – The financial aspects of the project are presented. The internal rate of return for each case is presented along with the sensitivities to the numerous variables.
• Environmental Permitting and Issues – The various permits required are identified and the path to project approval is discussed.
2. COAL SUPPLY AND PRODUCT MARKETS 2.1 Coal Supply Options
2.1.1 Alaskan Coal Fields
Alaska has 3.7 trillion metric tones of hypothetical coal resources, found predominantly in three regions. The Northwest region primarily contains bituminous coal (with smaller amounts of sub-bituminous and lignite coal), while the Central Interior (Nenana Province) and South Central (Cook Inlet-Susitna Basin) regions primarily contain sub-bituminous coal with relatively high
11 www.angtl.com
24
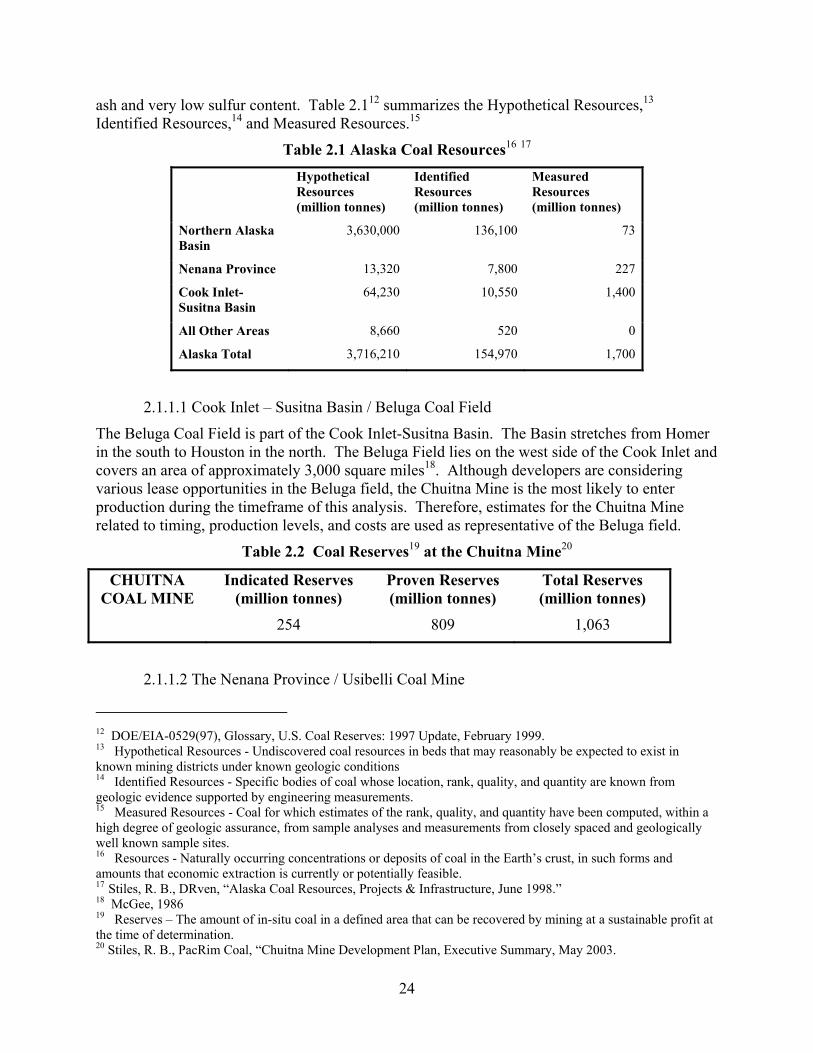
ash and very low sulfur content. Table 2.112 summarizes the Hypothetical Resources,13 Identified Resources,14 and Measured Resources.15
Table 2.1 Alaska Coal Resources16 17 Hypothetical
Resources (million tonnes)
Identified Resources (million tonnes)
Measured Resources (million tonnes)
Northern Alaska Basin
3,630,000 136,100 73
Nenana Province 13,320 7,800 227
Cook Inlet-Susitna Basin
64,230 10,550 1,400
All Other Areas 8,660 520 0
Alaska Total 3,716,210 154,970 1,700
2.1.1.1 Cook Inlet – Susitna Basin / Beluga Coal Field
The Beluga Coal Field is part of the Cook Inlet-Susitna Basin. The Basin stretches from Homer in the south to Houston in the north. The Beluga Field lies on the west side of the Cook Inlet and covers an area of approximately 3,000 square miles18. Although developers are considering various lease opportunities in the Beluga field, the Chuitna Mine is the most likely to enter production during the timeframe of this analysis. Therefore, estimates for the Chuitna Mine related to timing, production levels, and costs are used as representative of the Beluga field.
Table 2.2 Coal Reserves19 at the Chuitna Mine20
CHUITNA COAL MINE
Indicated Reserves (million tonnes)
Proven Reserves (million tonnes)
Total Reserves (million tonnes)
254 809 1,063
2.1.1.2 The Nenana Province / Usibelli Coal Mine
12 DOE/EIA-0529(97), Glossary, U.S. Coal Reserves: 1997 Update, February 1999. 13 Hypothetical Resources - Undiscovered coal resources in beds that may reasonably be expected to exist in known mining districts under known geologic conditions 14 Identified Resources - Specific bodies of coal whose location, rank, quality, and quantity are known from geologic evidence supported by engineering measurements. 15 Measured Resources - Coal for which estimates of the rank, quality, and quantity have been computed, within a high degree of geologic assurance, from sample analyses and measurements from closely spaced and geologically well known sample sites. 16 Resources - Naturally occurring concentrations or deposits of coal in the Earth’s crust, in such forms and amounts that economic extraction is currently or potentially feasible. 17 Stiles, R. B., DRven, “Alaska Coal Resources, Projects & Infrastructure, June 1998.” 18 McGee, 1986 19 Reserves – The amount of in-situ coal in a defined area that can be recovered by mining at a sustainable profit at the time of determination. 20 Stiles, R. B., PacRim Coal, “Chuitna Mine Development Plan, Executive Summary, May 2003.

25
The Usibelli Coal Mine is in the Nenana Province. An estimated 227 million tonnes of in-place surface mineable coal exist at Usibelli, as shown in Table 2.3. The 91 million tonnes of proven reserves are more than sufficient to sustain current production levels and if selected as the source, could supply the Agrium plant for many years to come. At about 2 million tonnes per year production, the Usibelli Mine has permits to continue production for more than 22 years, with more coal available in the future.
Table 2.3 Coal Reserves at the Usibelli Mine21
USIBELLI COAL MINE
Indicated Reserves (million tonnes)
Proven Reserves (million tonnes)
Permitted for Mining (million tonnes)
227 91 45.5
2.1.2 Chuitna Mine The proposed Chuitna mine is a greenfield project that has been under consideration by the developers since 1968. The project is currently pursuing permits (new and revised) with plans to begin production in late 2009 or 2010. Current plans are for annual production of up to 12 million tonnes per year, with a base case of 3 million tonnes per year. The owners are the Bass and Hunt interests of Dallas, Texas. The Hunt interest is the designated operator of the property and DRven Corporation, of Anchorage, Alaska, is the contract development manager.
2.1.2.1 Setting
The Chuitna mine property lies on the west side of the Cook Inlet about 80 kilometers (50 miles) miles west of Anchorage near the village of Tyonek.
21 Usibelli web site (www.usibelli.com), 2005
26
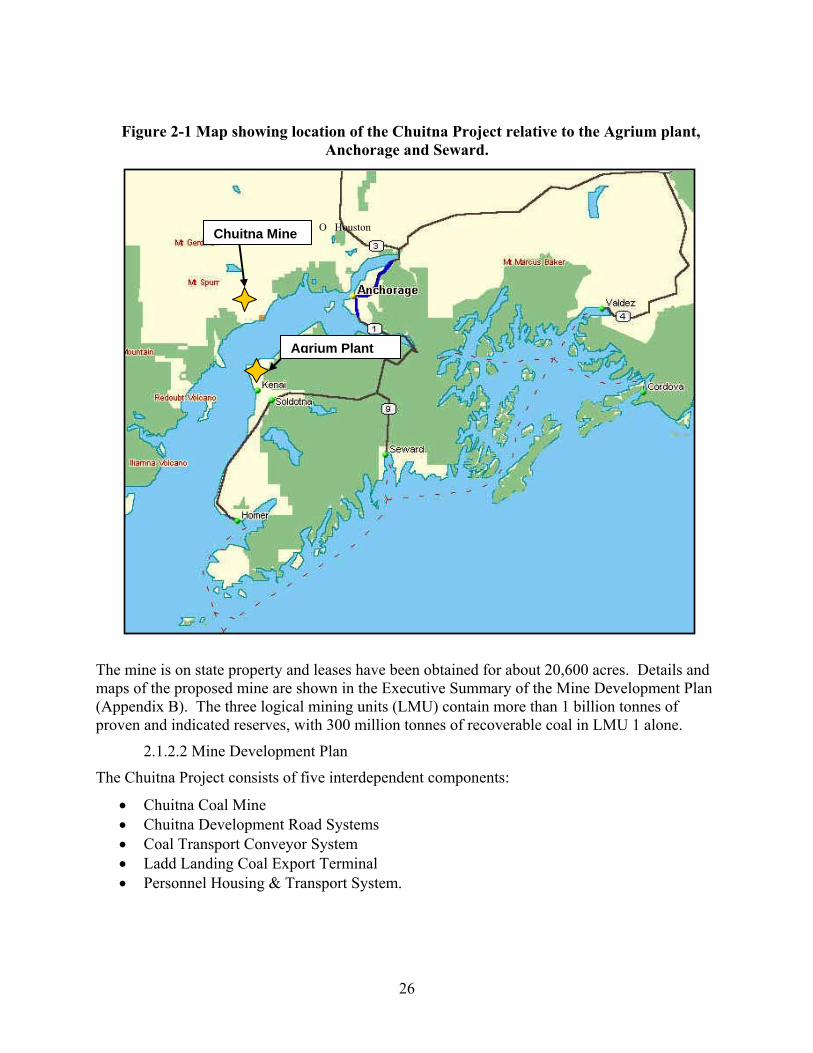
Figure 2-1 Map showing location of the Chuitna Project relative to the Agrium plant, Anchorage and Seward.
The mine is on state property and leases have been obtained for about 20,600 acres. Details and maps of the proposed mine are shown in the Executive Summary of the Mine Development Plan (Appendix B). The three logical mining units (LMU) contain more than 1 billion tonnes of proven and indicated reserves, with 300 million tonnes of recoverable coal in LMU 1 alone.
2.1.2.2 Mine Development Plan
The Chuitna Project consists of five interdependent components:
• Chuitna Coal Mine • Chuitna Development Road Systems • Coal Transport Conveyor System • Ladd Landing Coal Export Terminal • Personnel Housing & Transport System.
Chuitna Mine
Agrium Plant
O Houston
27
Chuitna Coal Mine:
Chuitna will be a surface mine, employing a large dragline for overburden removal, shovels and excavators for coal extraction, and heavy trucks for hauling the coal to the crushers. Crushed coal will be moved to the port site by a 48-inch wide covered conveyor. There are three logical mining units – LMU-1 (9,650 acres), LMU-2 (2,500 acres), and LMU-3 (8,350 acres). LMU-1 will be developed initially and mined in the direction of LMU-2, which will be brought on line as mining progresses.
Chuitna Development Road System:
Two infrastructure development activities will be required to develop the Chuitna Mine:
1) Upgrade of the existing 11-mile (18-km) Pan Am road between Ladd Landing and the coal lease boundary.
2) Development of the barge landing and equipment/material storage area at Ladd Landing.
Coal Transport Conveyor System:
The Chuitna Mine will use a 48-inch wide covered conveyor system to move the coal from the storage pile at the mine to the coal terminal at Ladd Landing. A service road will be constructed along the 11.3-mile (18.3-km) conveyor route. The conveyor will permit efficient and economical coal transport to the terminal with minimal impact to the surrounding country. The conveyor system was chosen over trucking for many reasons, including reduced vehicle expense and maintenance, fuel costs, manpower needs, and road maintenance.
Ladd Landing Coal Export Terminal:
To accommodate Cape Class ships, the existing Ladd Landing facilities will be upgraded with a new 8,000-foot dock, yielding a usable draft of 15 to 18 meters. The design will permit barge loading at 3,000 tonnes/hour for transport to Agrium.
Personnel Housing/Facilities:
Due to its remote location, a construction camp and housing facility will be needed to accommodate the workers while on site. The camp will be sized to house about 175 personnel. Offices, an airstrip, shops and associated facilities will be constructed at the mine site.
Further details are contained in Appendix B.
2.1.3 Usibelli Mine
Founded in 1943 by Emil Usibelli, the Usibelli Coal Mine (UCM) is located in the Alaska Range near the town of Healy. Currently the only coal-producing mine in Alaska, UCM has a work force of about 85 and operates year-round. Over its 62 years of operation, mine production has grown from 10,000 Tons per year to an average 1.5 million tons of coal per year supported by the most modern mining equipment and state-of-the-art engineering. Today, UCM supplies six interior Alaska power plants with coal.
2.1.3.1 Setting
Usibelli Coal Mine is located approximately 2 miles northeast of Healy, Alaska, in the Hoseanna Creek drainage district of interior Alaska. This is about 12 miles north of the entrance to Denali National Park. The mine is about 242 miles from Anchorage and 368 miles from Seward.

28
2.1.3.2 Railroad Transport
Coal from UCM is transported north on the Alaska Railroad (ARRC) to the Fairbanks area power plants and military bases. Coal is shipped south by rail to Seward for export to markets in Korea and South America. Currently, about 850,000 tonnes per year are shipped north to interior Alaska customers and 650,000 are shipped south for export on the railroad.
The Alaska Railroad negotiates shipping contracts with the mine for each destination depending on the shipping volume. Of particular interest is the 368-mile route from Healy to Seward. Due to competition with gravel and road building material shipments during construction season, rail deliveries of coal are conducted primarily in the winter. Estimates from the Alaska Railroad for shipping an additional 1 million tonnes/year of coal to Seward year around is $9/tonne.22 For larger production volumes, improvements to the rail system and additional rolling stock would be required.
2.1.3.3 Seward Coal Terminal
Suneel Shipping Co., Ltd. opened the Seward Coal Terminal in 1984 to load coal ships destined for Korea. Currently, about 650,000 tonnes/year pass through the terminal. The terminal can load ships and barges at rate of up to 1,000 tonnes/hr. The majority of the coal shipments occur in the wintertime, thus year-round barge shipments appear to be practical.
The Alaska Railroad currently owns the Terminal, but Suneel initially built the port and operated it under its subsidiary, Suneel Alaska Corp. Hyundai Merchant Marine purchased Suneel in the late 90’s and owned the port until it was transferred to ARRC in 2002. Hyundai continues to operate the port under lease from ARRC today.
2.1.3.4 Proposed Anchorage Coal Terminal
The Port of Anchorage near Ship Creek is another possible location for a coal loading terminal. When developers were evaluating the viability of re-opening the Wishbone Hill Coal Mine near Sutton, one option involved trucking coal from the mine to the Port of Anchorage for barge shipment. Lynden Transport Company determined that this option was impractical, primarily because icing during the worst two to three months of the winter would make it difficult to keep the port open for barge traffic. Since that time, Lynden has used their land at the port for other purposes and recommends that coal be shipped by rail to the Seward terminal.23
Recently, the Anchorage terminal option has been reconsidered. Usibelli, as part of the Blue Sky team, is investigating the feasibility of off-loading rail cars at the Port of Anchorage and barging coal to the Agrium site. This work is in the preliminary stages, and for confidentiality reasons, details are not available at this time. To consider this option, therefore, several assumptions were made:
• The rail cost of coal delivered to Anchorage will be $5/tonne (5/9 of the cost to deliver to Seward).
• The barge loading rate and cost will be the same as for the Seward terminal. • The capital cost for the terminal will be absorbed in the loading cost.
22 Silverstein, S., Alaska Railroad Corporation, Private Communication, December 21, 2005 23 Jansen, J., Lynden Transport, Private Communication, December 5, 2005

29
2.1.4 Coal Properties The properties of the coals from Chuitna and Usibelli are nearly identical (Table 2.4). Both mines produce a high-moisture sub-bituminous coal with a low sulfur content. In the design basis and in the calculations in the following sections, 7,650 Btu/lb is used for the heating value, equivalent to 16.86 MMBtu/tonne.
Table 2.4 Comparison of the Properties of Chuitna and Usibelli Coals 24 25
Chuitna * Usibelli
Proximate AnalysisMoist (As-Received)
(%)Moist (As-Received)
(%)Moisture 27.1 27.0Ash 10.1 8.0Volitile Matter 33.0 36.0Fixed Carbon 29.8 29.0TOTAL 100.0 100.0 * Calculated from analysis of dried material
ULTIMATE ANALYSIS (without moisture or ash)Carbon 70.4 69.5Hydrogen 5.2 4.5Nitrogen 1.3 0.9Chlorine 0.0 - -Oxygen 22.9 24.8Sulfur 0.3 0.3
100.1 100.0
Heating Value (Btu/lb) 7650 7800
2.1.5 Coal Barging Options There are three possible barging routes to the Agrium plant site. The project team contacted several barge and transportation companies to determine the feasibility and costs for the routes. The companies provided estimates, in varying degrees of detail, about the types and sizes of vessels they might employ, day rates for long-term contracts for the vessels, and in all cases, the quoted fuel use. The day rate for the vessels did not include fuel, as that is the one variable that fluctuates widely. The company estimates were used to develop barging rates using common were used to develop barging rates using common assumptions.
Figure 2.2 Map of the Cook Inlet Region showing potential barge routes.
24 Stiles, R.B., PacRim Coal, “Chuitna Mine Development Plan, Executive Summary, May 2003 25 http://www.usibelli.com/specs.html

30
2.1.5.1 Chuitna Mine
Chuitna coal represents the closest and most economical transport option for the plant. The concept is move the coal to the Ladd Landing dock and barge it approximately 30 miles across the Cook Inlet (Route #1 in Figure 2.2). The dock (as described above) will have barge loading facilities. Assuming 7 miles/hour, the travel time would be 4 1/2 hours. At a loading rate of 3,000 tonnes/hr, loading time will range from 3 to 4 hours depending on the vessel capacity (7,700 to 12,000 tonnes). Assuming a 1,000 tonnes/hr unloading rate, the total roundtrip time is approximately 20 to 25 hours. It is assumed that two barge units will be required to meet the delivered coal volume required by the plant. The details of the calculations are given in Appendix C.
2.1.5.2 Usibelli Mine via Seward
The Usibelli coal route (Route #2 in Figure 2.2) would use current rail infrastructure to deliver coal to the Seward coal terminal for subsequent loading on barges. The distance of approximately 240 miles will require nearly 33 hours shipping time each way. Based on Seward’s loading rate of 1,000 tonnes/hr, 8 to 12 hours will be needed for loading depending on vessel size. This yields a roundtrip total of approximately 80 to 88 hours or almost 4 days.
13
2

31
2.1.5.3 Usibelli Mine via Anchorage Route 3 in Figure 2.2 shows the potential barge route from the Port of Anchorage. As discussed above, this route’s feasibility is being re-assessed. The distance to Agrium is 45 miles. Depending on vessel size, the loading time will range from 8 to 12 hours and the round trip will require from 29 to 37 hours.
2.1.5.4 Barge Costs The barge delivery cost estimates for the three routes are given in Table 2.5. There are many uncertainties in these estimates, thus an average of the two barging companies’ results were used. It is envisioned that as negotiations proceed for a contract, economies will be developed and final contract rates will be lower. Details of these estimates are given in Appendix C.
Table 2.5 Barge Costs for Transport of Coal to Agrium Plant
Route to Agrium
Company 1 ($/tonne)
Company 2 ($/tonne)
Average ($/tonne)
Ladd Landing
Dock 3.16 3,70 3.43
Anchorage Transfer Terminal 3.40 3.70 3.55
Seward Terminal 7.33 11.1 9.21
2.1.6 Delivered Cost of Coal 2.1.6.1 Mine Mouth Cost
Based on discussions with the mine owners, the mine mouth price for coal from either mine will be in the range of $1.10 to 1.25/MMBtu. This correlates with $18.6 to 21.1/tonne.
2.1.6.2 Transport to Dock
For the case of the Chuitna mine, the overland transport cost is about $3/tonne via conveyor.
For the Seward case, the Alaska Railroad has estimated that transport of an additional 1 million tonnes/year – their current limit without significant capital improvements – is $9/tonne.26
2.1.6.3 Barge Loading and Unloading
The Ladd Landing facility will be able to load at a rate of about 3,000 tonnes/hour. It is assumed that the barges can be unloaded at 1,000 tonnes/hr at the Agrium plant.
The Seward facility has a loading rate of 1,000 tonnes/hour. All barge cost estimates reflect these loading and unloading rates.
26 Silverstein, S., Alaska Railroad Corporation, Private Communication, December 21, 2005

32
The loading cost at Seward is $3/tonne. This cost was used as an estimate for all loading and unloading costs.
2.1.6.4 Total Delivered Coal Cost The total cost of coal delivered to the Agrium plant is the total of these various costs.
Cost = Mine-mouth cost + Overland transport + Loading + Barge + Unloading
The results are shown in Table 2.6
Table 2.6 Summary of Cost Estimates for Cost of Coal Delivered to Agrium Plant
Mine Mouth Cost
($/tonne)
Mine Mouth Cost
($/MMBtu)
Over-land
Trans ($/
tonne)
Rail ($/
tonne)
Load ($/
tonne)
Barge ($/
Tonne)
Unload ($/
tonne)
Total Cost ($/
tonne)
Total Cost ($/ MMBtu)
Chuitna via Ladd Landing Ave.
18.6 1.10 3 3 3.43 3 31.0 1.84
21.1 1.25 3 3 3.43 3 33.5 1.99
Usibelli via Anchorage
18.6 1.10 5 3 3.55 3 33.1 1.96
21.1 1.25 5 3 3.55 3 35.6 2.11
Usibelli via Seward
18.6 1.10 9 3 9.95 3 43.5 2.58
21.1 1.25 9 3 9.95 3 46.0 2.73
The overall delivered costs range from a low of $1.84/MMBtu from the Chuitna mine to a high of $2.73/MMBtu from Usibelli delivered via Seward. The relatively well known costs for the mine-mouth coal, overland transport/rail, and loading/ unloading are significant and reduce the total delivered cost’s sensitivity to barge costs.
Since the rail connection via Seward can only deliver about 1 million tonnes per year, this option is best included as a back-up and not as the primary coal source for this plant.
2.1.7 Section 27, Merchant Marine Act, 1920 – The Jones Act
All barge traffic in the Cook Inlet, whether traveling to Alaskan or other ports, must adhere to the provisions of the Jones Act. A summary of the act is given below.
§ 861. Purpose and policy of United States
“It is necessary for the national defense and for the proper growth of its foreign and domestic commerce that the United States shall have a merchant marine of the best equipped and most suitable types of vessels sufficient to carry the greater portion of its commerce and serve as a naval or military auxiliary in time of war or national emergency, ultimately to be owned and operated privately by citizens of the United States; and it is declared to be the policy of the

33
United States to do whatever may be necessary to develop and encourage the maintenance of such a merchant marine, and, insofar as may not be inconsistent with the express provisions of this Act, the Secretary of Transportation shall, in the disposition of vessels and shipping property as hereinafter provided, in the making of rules and regulations, and in the administration of the shipping laws keep always in view this purpose and object as the primary end to be attained.”
The Jones Act (aka Merchant Marine Act) is a United States Federal statute that requires U.S.-flagged vessels to be built in the United States, owned by U.S. citizens, and documented under the laws of the United States. Documented means “registered, enrolled, or licensed under the laws of the United States.” In addition, all officers and 75% of the crew must be U.S. citizens. Vessels that satisfy these requirements comprise the “Jones Act fleet.” Only a Jones Act Fleet can ship and deliver merchandise from one U.S. port to another U.S. port. Therefore, a foreign flagged ship can not travel with merchandise from the Los Angeles Harbor in California to Pearl Harbor in Hawaii.
2.2 Limestone 2.2.1 Limestone Supply In one of the design cases for the Agrium plant, a fluidized bed boiler is being considered for electric power production. This well established technology is efficient and has a fairly low capital cost. Fluidized bed plants require calcium carbonate (limestone) to remove sulfur and other contaminates.
Alaska Lime Company operates the only limestone mine in the state, near Cantwell, Alaska. This mine provided limestone to the Healy Clean Coal project for their test runs. The mine owner/operator projects that limestone could be shipped by rail to either Seward or Anchorage with similar handling cost assumptions as those for coal.27 The estimated Agrium plant requirement is 24 tonnes per day.
2.2.2 Limestone Delivered Cost Estimates The cost for limestone delivered to Agrium is shown in Table 2.7.
27 J. W. Caswell, Alaska Lime Company, Private Communication, February 24, 2006

34
Table 2.7 Estimates of the Cost of Limestone Delivered to Agrium from Cantwell
Mine Mouth Cost ($/tonne)28
Rail
($/ tonne)
Load
($/ tonne)
Barge
($/ tonne)
Unload
($/ tonne)
Total Cost
($/ tonne)
Via Anchorage
100 5 3 3.55 3 115
Via Seward
100 9 3 9.95 3 121
2.3 By-Product Markets A wide range of by-products could be produced by the Beluga IGCC plant. The feasibility study will examine a different slate of by-products in Phases 1 than in Phase 2 because the different cases have different primary products.
Phase 1 By-Products Studied
• Elemental sulfur
• Sulfuric acid
• Slag (vitreous slag as substitute product)
• Slag (aggregate replacement)
• Fischer-Tropsch diesel
Phase 2 By-Products may include:
• Nitrogen
• Carbon dioxide
• Argon
• Possible secondary value added by-products
2.3.1 Slag Slag is a by-product of the gasifying of coal process. Specifically it is a by-product of the gasifier. Generally, slag can be used as a product substitute in certain aggregate applications. Most typical uses of slag are light weight applications in cement and concrete production.
28 Estimate includes cost of transport and loading on railcars
35
Another high end use of the light weight aggregate slag is a partial substitute for expanded perlite. Perlite is known to have price demands in the $150 per ton range. Lower end slag uses includes road construction aggregate29, structural fill materials, landfill cover, and anti-skid materials for roads and highways.
Molten slag that is water quenched creates a vitreous, non-leachable “glassy” particulate that can be granulated and used as blasting grit, for roofing tiles and for other building products. Air cooled slag is sold nationally at approximately $15.50/ton. In local Alaskan markets, slag is sold at approximately $20/ton30.
Blending slag in cement and concrete mixes is proven method for increasing the performance of the mix. By varying the proportions of the blend, attributes such as sulfate resistance and resistance to alkali silica reaction can be attained with blended cement. For concrete producers, blended cement may allow them to take advantage of the benefits of slag.
Benefits of using slag in concrete mix:
• Better concrete workability.
• Easier finish ability.
• Higher compressive and flexural strengths.
• Lower permeability.
• Improved resistance to aggressive chemicals.
• More consistent plastic and hardened properties.
In 2004, thirty three percent (33%) of air cooled slag sales was used for road bases and surfaces, the remainder mostly sold for concrete and asphalt construction. Approximately ninety percent (90%) of granulated slag sold as aggregate is used in cement and concrete production. As with any bulk commodity, the local supply and demand of slag and other competing materials, along with the associated transportation cost, dictates the market demands and cost of the product.
2.3.2 Fischer-Tropsch Diesel Fuel Fischer-Tropsch (FT) diesel, from the coal gasification process, is considered a desirable coal-to-liquids (CTL) fuel. It is a product of the Fischer-Tropsch reactor process where most of the clean synthesis gas is converted to clean liquid hydrocarbon fuels. FT diesel fuel is sulfur-free and is a clean burning fuel with lower emissions of NOx, particulates, CO and hydrocarbons compared to conventional diesel fuel from petroleum refining. Refer to Tables 1 and 2 for current and future gasoline/diesel specifications. Although FT diesel would be expected to be a desired product, due to its limited availability it does not have a large global market. This is partially a result of historically low petroleum prices that have created a market entry barrier; FT liquids have traditionally not fared well against low oil prices.
29 DOE Report, “Utilization of Lightweight Aggregates Made from Coal Gasification Slags” 30 McKinnnon, John, Deputy Commissioner of Transportation and Public Facilities, private conversation

36
Table 2.8 Global Gasoline / Diesel Sulfur Specifications Country Current (ppm) Future (ppm) Date
United States 500 15 2006
EU 50 10 2008
Australia 500 30 2008
Hong Kong 500 50 2006
Japan 50 10 2009
S. Korea 300 50 2006
Table 2.9 Comparison of Conventional and FT Diesel Specifications
EU Diesel (2005) FT Diesel
Sulfur, max (ppm) 50 0
Density, max (kg/cm) 845 790
Cetane, min 51 75
Poly-aromatics, max (vol %) 11 0
T95, max (Co) 360 345
The market for FT liquids is very attractive due to the future sulfur specifications of gasoline and diesel.
World wide the demand for diesel has grown close to three percent (3%) per year in the last 10 years, making it one of the fastest-growing of all oil products. Diesel use in commercial vehicles has grown along with world economic growth. In addition, diesel use in passenger vehicles has grown significantly, particularly in Europe. Though the total number of diesel-fueled cars in the existing world wide car pool is less than twenty percent (20%), this will grow based on car manufacturer’s commitment to the diesel engine.
The petroleum prices of 2005 and 2006 have increased attention on petroleum substitutes such as Coal-to-Liquids (CTLs) including F-T diesel. World-wide supplies of petroleum are limited and subject to political instability. This along with rising world-demand demand, especially in developing countries such as India and China, and the Presidents’ goal of reducing U.S. reliance on imported petroleum, have set the stage for CTLs, including FT diesel, to be reevaluated. Given the supply constraints and resulting price volatilities of natural gas, coal will be a likely fuel of choice for hydrogen production and the definitely the fuel for the Coal-to-Liquids (CTL) market sector. Plants can be readily converted to power and hydrogen facilities by bypassing the F-T unit and the sending the syn-gas to a shift reactor and hydrogen separation device to produce pure hydrogen.
Unfortunately, current performance and economic data on FT diesel and other CTL fuels is not available. This exacerbates uncertainly in projecting future demand and pricing structures in an already uncertain market.

37
2.3.3 Sulfur Sulfur is recovered from the gasification process. The sulfur is an intrinsic component of most coals. In a coal gasification system, the sulfur is typically removed from the raw syn-gas. In the raw syn-gas, the sulfur is predominantly found in the form of hydrogen sulfide. There are several mechanisms of sulfur recovery that are described in the technical and systems aspects of this study.
Through its major derivative, sulfuric acid, sulfur is one of the most important industrial raw materials in the world, particularly for the fertilizer and manufacturing industries. Because of its desirable properties, sulfuric acid has retained its position as the most universally used mineral acid and the most produced and consumed inorganic chemical by volume. Uses of elemental sulfur include the making of pulp and paper, petroleum refining, agricultural chemicals, phosphatic fertilizers, electrical insulation, vulcanizing rubber and the most prolific use, the production of sulfuric acid. Sulfuric acid is used world wide in the fertilizer and manufacturing industrial sectors. The value added end products include fertilizer, ammonium sulfate, super phosphate, hydrochloric acid, nitric acid, sulfate salts, synthetic detergents, dyes and pigments, explosives, pharmaceuticals and in the petroleum refining process. Though the markets for sulfur products are very limited in Alaska, elemental sulfur and byproduct sulfuric acid are the most consumed chemicals world wide.
Domestic elemental sulfur provided sixty six percent (66%) of domestic consumption and byproduct consumption accounted for six percent (6%). The remaining twenty eight percent (28%) of sulfur consumed was provided by imported sulfur and sulfuric acid. About ninety percent (90%) of all sulfur consumed was in the form of sulfuric acid. Agricultural chemicals composed of sixty two (62%) of reported sulfur demand, while petroleum refining and metal mining were twenty nine percent (29%) and three percent (3%) respectively.
Canada provides over seventy percent (70%) of sulfur imported by the U.S., and one hundred percent (100%) of the sulfur product in Alaska.
The following tables illustrate the global demands and prices for elemental sulfur, sulfuric acid, diesel, slag and perlite. The cost of shipping will be an important factor in determining viability of these markets, but that information has not yet been determined.

38
Table 2.10 Global Elemental Sulfur Demand and Price from U.S. Suppliers
Market Demand Current
(tonnes/yr)
Demand Projected
(tonnes/yr)
Current Price (USD)
Distance to Market (miles)
Canadian1,2,3 88,000 - $69.00 1,300
European - - - - Mexican1,2,3 24,000 $82.00 3,800
United States West Coast 1,2,3
- - $12.00-$17.00 2,300
Pacific Rim China 1,2,3
167,000 $59.00 4,000
1U.S. Geological Survey, January 2006, “Mineral Commodity Summaries 2005,” U.S. Department of the Interior, U.S. Government Printing Office, Washington, DC http://minerals.usgs.gov/minerals/pubs/mcs/2006/mcs2006.pdf
2U.S. Geological Survey Minerals Yearbook, 2004, “Sulfur” U.S. Department of the Interior, U.S. Government Printing Office Washington, DC
3Index Mundi, “U.S. Imports of Elemental Sulfur, by Country,” 2005
Table 2.11 Global Sulfuric Acid Demand and Price
Market Demand Current (M tonnes/yr)
Demand Projected (M
tonnes/yr)
Current Price (USD)
Distance to Market (miles)
Canadian1,2,3 98,700 - $78.00 1,300
European - - - - Mexican1,2,3 44,100 $50.00 3,800
United States West Coast 1,2,3
- - - 2,300
Pacific Rim China 1,2,3
2,050 $274.00 4,000
1U.S. Geological Survey, January 2006, “Mineral Commodity Summaries 2005,” U.S. Department of the Interior, U.S. Government Printing Office, Washington, DC http://minerals.usgs.gov/minerals/pubs/mcs/2006/mcs2006.pdf
2U.S. Geological Survey Minerals Yearbook, 2004, “Sulfur” U.S. Department of the Interior, U.S. Government Printing Office Washington, DC
3Index Mundi, “U.S. Imports of Elemental Sulfur, by Country,” 2005

39
Table 2.12 F-T Diesel Demand and Price (through 2009)
Market
Demand Current (BBL/day)
Demand Projected (2009) (BBL/day)
Current Price4 ($/BBL)
Distance to Market(miles)
Asia1 500,000 4,900,000 - -
Canadian - - - -
European2,3 34,910 42,500 $78.00 4,500
Mexican - - - -
United States2,3 West Coast 28,281 34,400 $78.00 2,300
Pacific Rim2,3 29,166 35,500 $78.00 3,400
Table 2.13 Alaska Slag Demand and Price
Demand Current (1,000
tonnes/yr)
Demand Projected
(1,000 tonnes/yr)
Current Price4 (USD)
Distance to Market (miles)
Blasting Grit,3
- - ~$20.00 Local
Concrete Aggregate1,2,3
1,750 - ~$20.00 Local
Fill1,2 2,610 ~$20.00 Local
Road Base and Covering ,1,2
1,210 - ~$20.00 Local
Snow and Ice Control 1,2
101 ~$20.00 Local
1 U.S. Geological Survey, January 2006, “Mineral Commodity Summaries 2005,” U.S. Department of the Interior, U.S. Government Printing Office, Washington, DC http://minerals.usgs.gov/minerals/pubs/mcs /2006/mcs2006.pdf2U.S. Geological Survey Minerals Yearbook, 2004, “The Mineral Industry of Alaska,” U.S. Department of the Interior, U.S. Government Printing Office, Washington, DC. 3U.S. Geological Survey Minerals Yearbook, 2004, “Sand and Gravel, Construction,” U.S. Department of the Interior, U.S. Government Printing Office, Washington, DC 4 McKinnon, John, Deputy Commissioner of Transportation and Public Facilities, private communication: March 5, 2006
1Ogawa, Yoshiki, “Benefits of Gas Replacing Oil Products,” Quatar Petroleum, 2004 2Gavin, James; “Diesel Drives GTL Growth”, Petroleum Economist, 71, 5 30(1), May, 2004 3Birch, Collin; “The Market for GTL Diesel”, Petroleum Economist, 70, 3 S27(3), March, 2003 4 RDS,LLC; “South Central Alaska Gas Needs Assessment,” 55, Draft Report for U.S. DOE NETL, January, 2006

40
Table 2.14 Alaska Cement Perlite Demand and Price
Demand Current4 (tonne/yr)
Demand Projected (tonne/yr)
Current Price (USD/tonne)
Distance to Market (miles)
Alaska - - - -
Masonry Cement 1,2
1,280 - $117.00 Local
Portland Cement 1,2
175,000 - $78.00 Local
Expanded Perlite 1,3
- - $226.00 Local
Mining Perlite 1,3 - - $41.00 Local 1U.S. Geological Survey, January 2006, “Mineral Commodity Summaries 2005,” U.S. Department of the Interior, U.S. Government Printing Office, Washington, DC <http://minerals.usgs.gov/minerals/pubs/mcs/2006/mcs2006.pdf> 2U.S. Geological Survey Minerals Yearbook, 2004, “Cement,” U.S. Department of the Interior, U.S. Government Printing Office, Washington, DC 3U.S. Geological Survey Minerals Yearbook, 2004, “Perlite,” U.S. Department of the Interior, U.S. Government Printing Office, Washington, DC 4Tonnages shown indicate total product tonnes and not just slag or perlite tonnes
2.4 CO2 Use in Cook Inlet Region As part of the overall market assessment, this study considered all of the various products and by-products from an integrated coal gasification combined-cycle plant. A significant amount of CO2 will be produced, and either sequestration or use of that CO2 must be evaluated. Several methodologies are available for CO2 sequestration, many of which are not applicable to the Beluga coal gasification project, but they will be briefly reviewed. The primary potential commercial use for the CO2 is in enhanced oil recovery (EOR) from the partially depleted oil fields of Cook Inlet. If EOR is not feasible, the use of these oil reservoirs, depleted gas reservoirs, or saline aquifers as repositories for the CO2 is an alternative.
Consideration must be given to the potential problems associated with injecting CO2 from the coal gasification process. In addition to leakage from a repository, there is the issue of H2S resulting from the sulfur content of the Beluga or Healy coals. CO2 and H2S interact to yield an acidic water that may result in increased pipeline, liner, and other metal component corrosion and deleterious effects in the reservoir/aquifer capacity or permeability.
Carbon dioxide is a corrosive agent in the presence of water but is generally not reactive in the dry state31. Hydrogen sulfide (H2S) in the CO2 stream in low concentrations inhibits corrosion by reacting with the steel and forming a protective sulfide film, thereby isolating the steel from the CO2. The critical CO2/H2S ratio for lowered corrosion is at least 200, as has been
31 Christopher and others, 2005.

41
demonstrated in numerous field examples. Laboratory tests have suggested the ratio may be higher under specific temperature ranges.
When CO2 and H2S are sequestered in subsurface reservoirs, they may react with minerals and be trapped or removed from the fluid system. Mineral trapping of CO2 and H2S in clastic reservoirs, such as those in Cook Inlet, can be significant over long periods of time. The CO2 tends to be removed as the result of reactions between calcium silicate minerals and the fluids. The H2S is trapped and limited by the amount of iron as oxides or in the silicate minerals.32 For the timeframes important to any commercial use of the CO2 for EOR, the loss of CO2 by mineral trapping will be negligible.
The sulfur content of the Beluga and Healy coals under consideration as feedstocks to the gasification plant is about 0.1 to 0.3% sulfur33. This translates to two to six pounds of sulfur per ton of coal. This low content would suggest that if the sulfur were cycled into the CO2 injection stream, it would be of low concentration relative to the CO2 and thus work as a buffer for CO2 corrosion.
2.4.1 Methods of CO2 Sequestration The fundamental basis for all CO2 sequestration is to store the carbon dioxide in a form or site that will remove it from the atmosphere for at least thousands of years. There are a number of processes that can be used to accomplish this goal. Some processes are slow and require tens or hundreds of years to accomplish this result, but tend to permanently lock-up the CO2. Others are rapid, but have the potential to recycle the CO2 back into the atmosphere within a few hundreds or thousands of years.
Many proposed sequestration processes serve a dual purpose, sequestering the CO2 and producing a marketable product such as oil or natural gas. Others simply store the CO2 with no additional economic benefit. Those that provide economic benefit generally involve injection of CO2 into subsurface formations.
2.4.1.1 Processes Yielding Economic Products (EOR, EGR, and ECBMR)
Commercial CO2 sequestration applications typically inject CO2 as a supercritical fluid into a partially depleted oil or gas reservoir or into a coal bed to enhance the recovery of oil or natural gas (U.S. Geological Survey, 2005). Enhanced oil recovery (EOR) is usually the third stage of oil production and generally follows primary recovery and secondary recovery efforts. Primary recovery utilizes the natural pressure of the reservoir as the driving force to push the oil or gas to the surface. Secondary recovery uses other mechanisms, such as gas re-injection and water flooding, to produce residual oil and gas remaining after the primary recovery phase. The tertiary or enhanced recovery phase involves injecting other gases such as carbon dioxide to stimulate the oil or gas flow to produce remaining fluids that were not extracted during primary or secondary recovery phases. The purpose is not only to restore formation pressure but also to improve oil displacement or fluid flow in the reservoir. Optimal EOR operation is dependent upon reservoir temperature, pressure, depth, net pay, permeability, remaining oil and water saturations, porosity, and fluid properties such as API gravity and viscosity34.
32 Buschkuele and Perkins, 2005. 33 Flores and others, 2004. 34 Commodity Derivatives Group, 2004.

42
2.4.1.1.1 Enhanced Oil Recovery
The most common application of CO2 is to enhance recovery of additional oil from partially depleted reservoirs. Roughly 80% of the commercial use of carbon dioxide is for EOR (Center for Energy and Environmental Studies, 1997). Enhanced gas recovery (EGR) and enhanced coal bed methane recovery (ECBMR) are in their relative infancy and have not been used as extensively.
The use of CO2-EOR technology allows operators to recover oil that would normally be left in the reservoir and may add decades to the life of the field. At the same time a large volume of greenhouse gas is removed from the system. Additionally CO2 is a relatively cheap flooding agent and has been used in a large number of fields. There are more than 70 examples of successful CO2 flood programs worldwide (Christopher and others, 2005). In 2004 CO2-EOR produced about 206,000 barrels of oil per day in the United States (Moritas, 2004), representing approximately 4% of total daily U. S. production. The proportion is rising each year.
There are two mechanisms of oil recovery resulting from CO2 floods: miscible and immiscible displacement of oil. The nature and environment of the reservoir, and the properties of the oil, determine which will method is preferred in a given oil field. In simple terms, if the pressure is high enough in medium to light oil reservoirs, the CO2 and oil become completely miscible (mixed), leading to highly efficient oil recovery. At lower pressures and with heavy oils, CO2 displaces oil without mixing together – this is immiscible displacement. This too enhances recovery, by reducing the oil’s viscosity and by swelling, as some fraction of the CO2 dissolves in the oil (Preuss, 2001). Table 2.15 presents the displacement characteristics that predominate under varying pressure and to lesser extent varying temperature conditions in the reservoir. Immiscible displacement prevails in shallow reservoirs with low pressure and viscous oils. Miscible CO2 displacement is the principle mechanism at pressures above approximately 1,100 psi.
Table 2.15 Dominated Displacement Characteristics for Carbon Dioxide Displacement Processes35
Carbon Dioxide
Injection Process
Reservoir
Criteria
Oil Recovery
Mechanisms
Low pressure
applications
Pressures less than 1000 psia, Shallow and viscous oil fields, where water or thermal
methods are inefficient
Oil swelling and viscosity
reduction
Intermediate pressure, high temperature applications
1000<2000 to 3000 psia up to reservoir temperature
Oil swelling, viscosity reduction and crude
vaporization
Intermediate pressure, low temperature (<122°F)
applications
1000<p<2000 to 3000 psia 00<p
Temperature <122°F
Oil swelling, viscosity reduction and blow down
recovery
High pressure miscible applications
Pressure greater than 2000 to 3000 psia Miscible displacement
35 Klins, 1984.

43
The miscible CO2 process is primarily used in medium and light crude oils while the immiscible process is used with heavy crude oils. Reservoirs containing oils with gravities less than 22° API generally cannot be CO2 miscible-flood candidates. The advantages of a CO2 flood (miscible and immiscible) are multiple and include:
• miscibility is attainable at low pressure,
• displacement efficiency is high in miscible case,
• useful over a wider range of crude oils than hydrocarbon injection methods, and
• miscibility can be regenerated if lost.
Screening criteria are required to determine if a depleting reservoir or field is suitable for CO2 flooding, and whether the field is better suited for miscible or immiscible flooding36 ). The criteria offered by Taber and others (1996) are shown in Table 2.16. This is one of the simplest screening systems offered and focuses exclusively on depth (with temperature and pressure increases acknowledged) and oil gravity. It should be noted that at depths of less than 1,800 feet (549 m), all reservoirs fail the screening criteria for both miscible and immiscible flooding (Taber and others, 1996).
Table 2.16 Depth vs. Oil Gravity Screening Criteria for CO2 Flooding37
Klins (1984) expands on the data of Table 2.16. While concurring with the importance of depth and oil gravity for determining the applicability of miscible or immiscible CO2 floods, he amplifies the screening criteria. Characteristics that result in more effective miscible floods include:
• good response to water flood.
36 Taber and others, 1966; Klins, 1984; Nelms and Burke, 2004; and Advanced Resources International, Inc., 2005 37 Taber and others, 1996
For CO2-Miscible Flooding
Oil Gravity °API
Depth Must be Greater Than
Feet
>40 2,500
32-39.9 2,800
28-31.9 3,300
22-27.9 4,000
<22 Fail miscible, screen for immiscible
For Immiscible CO2 Flooding
13-21.9 1,800
<13 All oil reservoirs fail at any depth

44
• oil recovery factor between 20% and 50% prior to CO2 flood and after the water flood.
• oil reservoir depth must exceed 2,500 feet to attain CO2 minimum miscibility pressure (MMP), which is a function of lithostatic pressure, bottom hole temperature, and oil composition.
• oil gravity greater than 27°API with an oil viscosity of less than 10 centipoise (cp).
Advanced Resources International, Inc. (2005) lists the critical screening criteria as reservoir depth, oil gravity, reservoir pressure, reservoir temperature, and oil composition.
If a reservoir passes the screening process, several empirical rules of thumb can be applied to predict results and operating parameters for CO2 miscible floods (Nelms and Burke, 2004):
• CO2 -EOR of the original oil in place (OOIP), in the best reservoirs, ranges from 8 to 11% for miscible floods,
• immiscible CO2 floods recover 50% or less than miscible floods,
• to achieve CO2 miscible flooding the MMP is roughly equal to the initial bubble point pressure,
• the CO2 injection requirement is 7,000 to 8,000 cubic feet of CO2 per barrel of oil recovered (others cite volumes as low as 2,000 cubic feet per barrel)
• alternating injection of water and gas (WAG) can be used to reduce high CO2 injection concentrations, and
• water injection after primary production is required to fill gas voidage and to increase reservoir pressure to original conditions prior to CO2 injection.
In general, miscible CO2 flooding is much more effective than immiscible flooding. The miscible CO2 flood can significantly reduce oil saturation and increase oil recovery. Residual oil saturations after a water flood are typically 20% to 40% overall. The residual oil saturation after miscible CO2 flood has been shown to be as low as 3% to 5% in well-swept areas (Christopher and others, 2005). Where the reservoir pressure is significantly below MMP, the primary effect of CO2 injection is to swell the oil and reduce its viscosity (immiscible flooding). Swelling can cause some of the residual oil to become mobile and recoverable, but since miscibility is not achieved, full benefits of the CO2 injection are not realized.
The criteria and generalities presented above will be applied in a later portion of this section to evaluate the applicability of CO2 floods to depleting oil reservoirs within Cook Inlet.
2.4.1.1.2 Enhanced Gas Recovery
Enhanced gas recovery (EGR) is a concept that has yet to see application in depleted gas reservoirs, but should work under the right circumstances (Christopher and others, 2005). It utilizes the fact that CO2 is more dense than methane (density of supercritical CO2 is about one half that of water), and if injected at the bottom of a reservoir, will spread horizontally under the gas and push it out of the reservoir. This would work only if the vertical permeability of the reservoir was quite high (Christopher and others, 2005). Model studies indicate that the CO2 concentration remains high and does not mix with the methane, so that the produced methane will not be contaminated with the CO2 (Christopher and others, 2005).
In a CO2-EGR project, the volume ratio of CO2 (cost)/CH4 (revenue) is a key parameter. The factors that increase this ratio are solubility of CO2 in connate water, repressurization, and

45
reservoir permeability/geometry; those that reduce it are gas mixing and existing pressure drive (Christopher and others, 2005). The study by Christopher and others (2005), using methane at $13/mcf and carbon dioxide at $50/ton, concluded that CO2-EGR was not economically feasible and would require a subsidy.
2.4.1.1.3 Enhanced Coal Bed Methane Recovery
CO2 sequestration in coals beds is somewhat different from the more conventional depleted oil reservoir flooding and merits some discussion. The injection of CO2 into deep, unmineable coal seams not only locks up CO2, but enhances recovery of coalbed methane (CBM). Burlington Resources (since 1995) and BP America (since 1997) have been injecting CO2 into wells in the San Juan basin of New Mexico to recover additional CBM38. The results of pilot projects suggest that methane production could be increased 75% by injecting CO2 39.
The process is different in that the CO2 is preferentially adsorbed to the coal at the expense of methane and with sufficient pressure maintained on the coal, the CO2 will remain in the coal. The methane moves out slowly and there is a long delayed increase in productivity. This method can only be used in areas of existing CBM production, because the methane from the coal must have an exit point to provide room for the CO2 in the coal bed40. As a general rule of thumb, 2 to 3 standard cubic feet of CO2 is required per standard cubic foot of methane desorbed41.
2.4.1.2 Non-Commercial
Several technologies can be used for CO2 sequestration if there is no potential commercial benefit to injection due to the absence of hydrocarbon reservoirs. Some of the more commonly considered technologies are discussed in this section.
2.4.1.2.1 Oceanic Dispersion
The world’s oceans represent the largest potential sink for anthropogenic CO2.
The estimates of ultimate sequestration capacity are in the range of 1,000 to 10,000 gigatons of carbon, the equivalent of 200 to 2,000 years of current carbon emissions from fossil fuels42. The best injection option in the near-term appears to be dissolution at depths between 1,000 and 1,500 meters (3,000 to 5,000 feet) by pipeline or towed pipe. For the long term, very deep injection, beyond 1500 meters, may be desirable. To attempt this solution to CO2 sequestration in the Cook Inlet area is impractical due to the excessive costs associated with a very long pipeline required to transport the gas from the gasification plant to disposal sites with that depth.
2.4.1.2.2 Making Rocks
CO2 is naturally sequestered from the air through the weathering process, but the rate of natural sequestration is much too slow to cope with the rate of anthropogenic CO2 production. Thus, artificial techniques are being developed and tested using magnesium silicate and slightly acidic aqueous solutions of CO2. The resulting products are carbonates and silicates – but even this process is slow. Therefore, stronger solutions and heat are required to achieve conversion rates that meet the needs of the CO2 sequestration objectives. Recent experiments have been able to
38 Bartlett and others, 2003 39 Preuss, 2001 40 Bartlett and others, 2003 41 Christopher and others, 2005 42 Center for Energy and Environmental Studies, 1997

46
convert 25% of solid magnesium silicate to carbonate in 30 minutes, at 1000 psi and 80° C43. The process is largely experimental and not suitable for consideration in Cook Inlet.
2.4.1.2.3 Saline Aquifers
As in the case of depleted hydrocarbon reservoirs, the procedure is to pump CO2 into “deep”, widespread saline aquifers. The CO2 displaces the existing fluid and is trapped as a free phase (pure CO2), which is referred to as “hydrodynamic trapping.” A fraction of the CO2 will dissolve into the existing fluid44. Saline aquifers may be the largest long-term subsurface sequestration option. In this case, “deep” is 800 meters (2,500 feet) the depth at which CO2 in hydrostatic equilibrium reaches its critical pressure (73 atmospheres or 1072 psi); at its critical point the density of CO2 is about half the density of water45. Such aquifers are generally saline and are usually hydraulically separated from the shallower “sweet water” aquifers and surface water supplies used by people. The potential sequestration capacity of deep horizontal reservoirs is many times that of depleted, areally restricted, structural or stratigraphic oil and gas reservoirs.
The ultimate CO2 sequestration capacity of a given aquifer is the difference between the total capacity for CO2 at saturation and the total inorganic carbon currently in solution in that aquifer. The solubility of CO2 depends on the pressure, temperature, and salinity of the formation water46, as shown in Figure 2.3. Figure 2.3 clearly demonstrates that a low salinity, low temperature, and high pressure environment is the most effective for sequestering CO2 in widespread, deep, saline aquifers.
43 Bartlett and others, 2003) 44 USGS, 2005a 45 Center for Energy and Environmental Studies, 1997 46 Bachu and Adams, 2003

47
Figure 2-2 The effects of pressure, temperature and salinity on the solubility of CO2 in a
saline aquifer47
2.4.1.2.4 Summation Of these three sequestration methods, only the utilization of saline or deep reservoirs would have potential application for sequestering excess CO2 produced by the Beluga coal gasification plant. This option would be utilized only if commercial uses for the gas were not found to be economically viable and sequestration of the CO2 was mandated by law.
2.4.2 Potential Geological Sequestration Sites – Cook Inlet There are four potential geologic sites for CO2 sequestration in the subsurface of the Cook Inlet area and most, if not all, are within the Tertiary Kenai Group (Figure 2.4). These are the widespread saline aquifers of the upper Kenai Group, the abundant but somewhat discontinuous and generally thin coals of the middle and upper Kenai Group, the partially depleted gas reservoirs of the middle and upper Kenai Group, and the partially depleted oil reservoirs of the lower Kenai Group. The latter two sites are dominantly sandstone and conglomerate packages within aerially limited structural configurations.
The aspect of sequestration storage capacity in subsurface environments has not been previously addressed. The typical approach to CO2 sequestration assessment in geological media involves the sequestration capacity of a geological formation, i.e., the volume or mass of CO2 that can be stored in a geological formation such as saline aquifers, coal beds, or petroleum reservoirs.
47 Christopher and others, 2005
48
A U. S. Geological Survey study48 has developed a specific sequestration volume (SSV) calculation that expresses sequestration capacity in terms of reservoir volumes such as cubic meters, cubic feet, or barrels. The SSV is the result of the analysis of storage capacity of porous and permeable units that contain traps of definable volume. The SSV is calculated as the amount of geologic formation needed to sequester a given mass of CO2 by converting the mass of CO2 into volumes of geologic formations needed to sequester CO2 based on realistic geologic conditions. If any of the discussed sequestration methods are found to have possible application in the Cook Inlet area, this technique will provide a measure of the success of the program, beyond the economic considerations.
48 Burruss and Brennan, 2004

49
Figure 2-3 Tertiary Stratigraphy (Kenai Group) of Upper Cook Inlet Basin

50
2.4.2.1 Saline Aquifers (Reservoirs)
Many saline aquifers within the Tertiary Kenai Group of the Cook Inlet area could provide potential CO2 sequestration sites. The upper Tyonek to lower Sterling (Figure 2.4) portions of the Kenai Group provide the best options, as these intervals have the lowest salinities (3,000 to 8,000 ppm) in terms of NaCl equivalents. The lower Tyonek and Hemlock strata have intermediate salinities (8,000 to 12,000 + ppm), with the lower Hemlock Conglomerate ranging to 17,000 ppm. The deeper and older Mesozoic formation waters have salinities that range to 22,000 ppm.
Figure 2.3 shows that the deeper more saline waters have less capacity for retaining CO2 in solution and would be less effective storage intervals. Thus the fluvial sandstones of the lower Sterling through upper Tyonek appear to be the most favorable targets. These are also the coolest aquifers but have the lowest pressures. Additionally, due to the nature of the depositional systems operating during the late Tertiary, the sandstones have limited lateral extent and do not mimic the widespread marine strata that have been used elsewhere, such as in the North Sea. Seals may be a concern in these relatively shallow, possibly under-compacted units.
2.4.2.2 Deep Coal Beds
Deep coal beds (at depths beyond which mining is feasible) are found throughout the Tertiary section, but are thickest and most abundant in the Tyonek and Beluga formations. Tyonek coal seams have maximum thickness of more than 30 feet (9.15 m) and those of the Beluga are known to range between 5 and 10 feet (1.5 and 3.0 m)49. The Tyonek coals are principally concentrated along the northwest margin of the basin, where cumulative thicknesses locally exceed 1,400 feet (425 m)50. Within a single coal field, coal bed correlation from well to well has proven difficult for distances of more than a mile or two (a few kilometers)51. However, in outcrop, individual coal beds have been traced for 6.2 miles (10.0 km)52. The Beluga and the even thinner Sterling coals are expected to have more limited lateral extent.
2.4.2.3 Partially Depleted Gas Reservoirs
The partially depleted gas reservoirs in the Cook Inlet area are predominantly in the upper Tyonek through the lower Sterling portions of the Kenai Group (Figure 2.4). There are 28 known gas fields in Cook Inlet with approximately 10.0 tcf original gas in place (OGIP). Estimated ultimate recovery (EUR) volumes range from less than 0.15 billion cubic feet of gas (bcfg) to 2,345 bcfg53. Four fields are expected to produce in excess of 1.0 tcfg with an additional seven fields producing between 100 and 250 bcfg. The remaining 17 fields are expected to ultimately produce about 375 bcfg or an average of 22 bcfg per field.
The average recovery factor for the Cook Inlet gas fields is about 85%. This high recovery rate, plus the low price structure for natural gas in the Cook Inlet area, severely limit the potential economic impact of EGR for the Cook Inlet gas fields. Only four of the inlet’s gas fields are expected to have sufficient reserves remaining after primary production to be possible targets for CO2-EGR. Since there are no analogs for CO2-EGR, it is not possible to cite an expected efficiency for the process. If it was assumed, as in the case of CO2-EOR, that 8 to 11% of the
49 Flores and others, 2004 50 Hite, 1976 and Flores and others, 2004 51 Flores and others, 2004 52 Barnes, 1966 and Ramsey, 1981 53 Thomas and others, 2004

51
OGIP would be produced through CO2 injection, the resulting increase in reserves would be on the order of 665 to 920 bcfg.
These volumes are probably unrealistically high, as the mechanism of CO2 enhanced production in gas reservoirs is vastly different from the miscible enhancement in oil reservoirs. Volumes approaching those of immiscible CO2 floods, about 50% of those expected from miscible floods, may be more realistic. Also the current and anticipated economics for the cost of CO2 injection versus the present contract price of Cook Inlet gas are not conducive to making this an economic undertaking.
2.4.2.4 Partially Depleted Oil Reservoirs
The eight oil fields in Cook Inlet all produce from the lower portion of the Kenai Group (Figure 2.4), specifically from the Hemlock Conglomerate, lower portions of the Tyonek Formation, and locally from the West Foreland Formation. The Hemlock is the most important oil producing formation, accounting for approximately 80% of the Cook Inlet production54. The various zones of the Tyonek provide 18% of the inlet’s oil and the West Foreland accounts for the remaining 2% (Magoon and Anders, 1992). These fields frequently produce from multiple reservoirs or reservoir intervals. (A list of the fields and the productive reservoir intervals is shown in Table 2.4 and discussed in Section 2.3.5.2.) There are a total of 17 reservoirs or reservoir bearing intervals.
With the exception of the small Redoubt Shoal field (Table 2.17) the oil fields are well on the way to being depleted. Cumulative production from the five major fields through 2005 averages 97.4% of EUR (Table 2.17). There are one to five individual reservoirs or reservoir intervals per field. Provided that the reservoirs in these fields can meet the screening criteria and that sufficient volumes of CO2 are available, there is a genuine possibility that CO2-EOR may add significant reserve potential and longevity to these oil fields. The OOIP for all fields is approximately 3,670 MMbo (Table 2.17). The five giant fields have 3,550 MMb of OOIP or 2,216 MMb of residual oil in place (ROIP).
Utilizing the average 8 to 11% increase in reserves noted in existing CO2-EOR programs (Nelms and Burke, 2004), potential reserve additions for the five major fields would range between 285 and 390 MMbo. Reserves of this magnitude would be equivalent to the combined production of all Cook Inlet Oil Fields over the last 20 to 25 years55.
Based on the preceding discussion there are three possible methods that may be applicable for the sequestration of excess CO2 produced from the coal gasification process. These methods all involve injection of CO2 into the sandstone and conglomerate aquifers and reservoirs of the Cook Inlet Tertiary section. The non-injection options simply are not feasible for the reasons given earlier and the ECBMR technology is not applicable in the near future due to the lack of ongoing or developing CBM exploration and production. This leaves EOR, EGR, and injection into saline aquifers as the methods with possible application for CO2 sequestration.
54 Magoon and Anders, 1992 55 Alaska Division of Oil and Gas, 2004
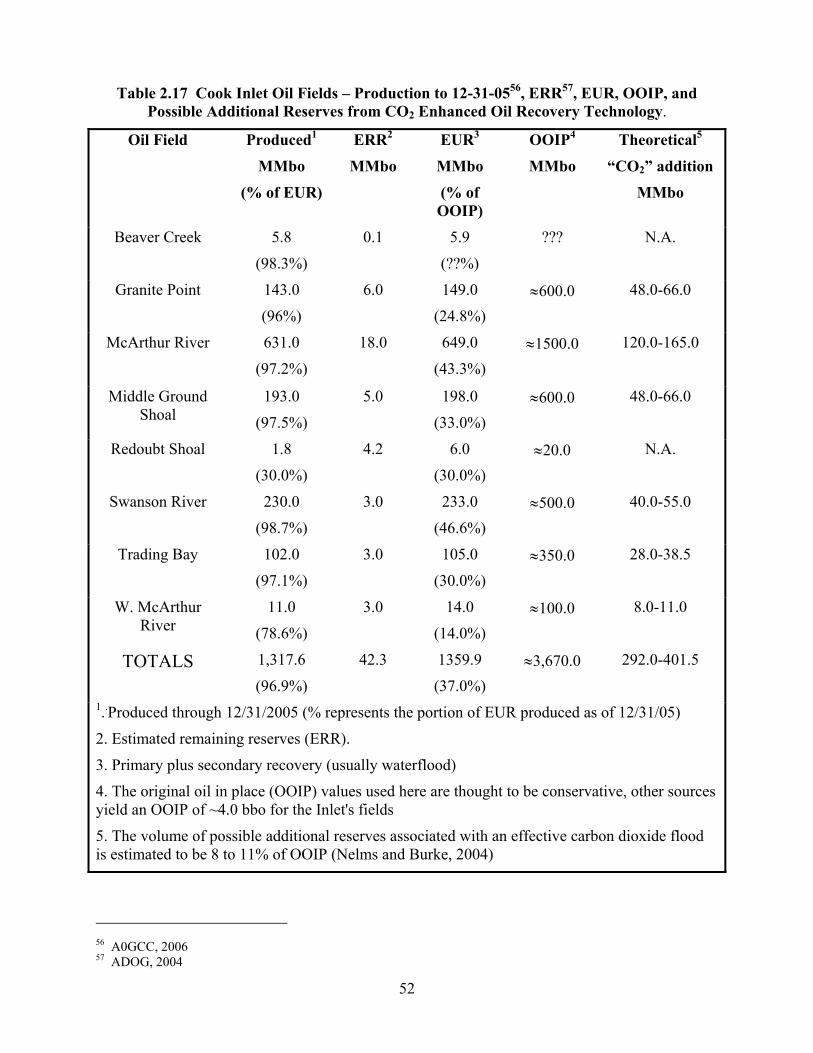
52
Table 2.17 Cook Inlet Oil Fields – Production to 12-31-0556, ERR57, EUR, OOIP, and Possible Additional Reserves from CO2 Enhanced Oil Recovery Technology.
Oil Field Produced1
MMbo
(% of EUR)
ERR2
MMbo
EUR3
MMbo
(% of OOIP)
OOIP4
MMbo
Theoretical5
“CO2” addition
MMbo
Beaver Creek 5.8
(98.3%)
0.1 5.9
(??%)
??? N.A.
Granite Point 143.0
(96%)
6.0 149.0
(24.8%) ≈600.0 48.0-66.0
McArthur River 631.0
(97.2%)
18.0 649.0
(43.3%) ≈1500.0
120.0-165.0
Middle Ground Shoal
193.0
(97.5%)
5.0 198.0
(33.0%) ≈600.0 48.0-66.0
Redoubt Shoal 1.8
(30.0%)
4.2 6.0
(30.0%) ≈20.0 N.A.
Swanson River 230.0
(98.7%)
3.0 233.0
(46.6%) ≈500.0 40.0-55.0
Trading Bay 102.0
(97.1%)
3.0 105.0
(30.0%) ≈350.0 28.0-38.5
W. McArthur River
11.0
(78.6%)
3.0 14.0
(14.0%) ≈100.0 8.0-11.0
TOTALS 1,317.6
(96.9%)
42.3 1359.9
(37.0%) ≈3,670.0 292.0-401.5
1..Produced through 12/31/2005 (% represents the portion of EUR produced as of 12/31/05)
2. Estimated remaining reserves (ERR).
3. Primary plus secondary recovery (usually waterflood)
4. The original oil in place (OOIP) values used here are thought to be conservative, other sources yield an OOIP of ~4.0 bbo for the Inlet's fields
5. The volume of possible additional reserves associated with an effective carbon dioxide flood is estimated to be 8 to 11% of OOIP (Nelms and Burke, 2004)
56 A0GCC, 2006 57 ADOG, 2004
53
2.4.2.5 Preferred CO2 Sequestration Methodologies for Cook Inlet
From the perspective of obtaining maximum benefit from the sequestration of CO2, the most obvious option would be EOR. The probability of obtaining appreciable benefit from the development of an EGR program is very low due to the high rates of recovery and the low price for natural gas in the Cook Inlet area. However, EGR and injection into saline reservoirs may be last option choices if there is no market for the CO2 as an agent for EOR.
Enhanced oil recovery will be evaluated as it may apply to Cook Inlet oil fields and injection into saline aquifers will be considered as an alternative to EOR. The choice of saline aquifers is driven by the potential for lower costs, compared to injection into deeper formations, if widespread aquifers can be located in close proximity to the coal gasification plant. Pipeline construction, maintenance, and associated costs would be minimized; however, new wells and facilities would be required.
Before examining the applicability of these technologies to the Cook Inlet area, current examples of each will be reviewed. There are many examples of CO2-EOR both in North America and elsewhere in the world. Examples of successful saline aquifer sequestration are far fewer and largely driven by environmental policies and taxation of CO2 due to its greenhouse gas characteristics.
2.4.3 Examples -Carbon Dioxide Flooding of Oil Reservoirs The first commercial scale CO2-EOR programs began in the Permian Basin in 197258. Major expansion began in the 1980s and today there are more than 70 CO2-EOR projects worldwide. The great majority of these are in North America, primarily in the Permian Basin of West Texas and New Mexico, with newer and expanding efforts in Wyoming, North Dakota, and Oklahoma. Internationally, Canada and Norway have noteworthy programs.
2.4.3.1 North America
As stated earlier current CO2-EOR programs are responsible for at least 206 Mbo/d in the United States (4% of current daily production) and over 20 Mbo/d in Canada. Beecy (2005) has estimated that future EOR for the United States is on the order of 148 to 210 bbo with the bulk coming from CO2 floods. These numbers are based on a total domestic OOIP of 1,335 bbo and using an EOR recovery of 11.1 to 15.7% of OOIP. A more conservative volume, using the generally accepted 8 to 11% range59, would be 107 to 147 bbo.
A six basin study sponsored by NETL (2005), based on a series of reports by the DOE Office of Fossil Energy, indicates significant potential of CO2 flooding in diverse areas of the United States. The assessments conclude that successful CO2 floods in large favorable reservoirs could yield another 43.3 billion barrels of incremental oil. That compares with the 22.0 billion barrels of proven oil reserves in the United States60. If these numbers are of the right order of magnitude, future oil production in the United States will relay heavily on EOR and CO2 flooding.
58 Christopher and others, 2005 59 Nelms and Burke, 2004 60 NETL, 2005

54
Ongoing or planned CO2-EOR programs are largely concentrated in the west Texas, New Mexico, Wyoming, Montana/North Dakota, Oklahoma, and Canada. These efforts reflect a long term commitment to EOR and CO2 sequestration, although not necessarily both objectives in each project. The CO2 is provided from natural reservoirs such as Elmo Dome and Sheep Mountain, from CO2-rich natural gas production, and anthropogenic sources such as the Dakota coal gasification plant in Beulah, North Dakota. The principal areas and projects are discussed below.
2.4.3.1.1 Permian Basin-West Texas and New Mexico
The Permian Basin in west Texas has a long history of CO2-EOR. More than 65 sandstone, limestone, and dolomite reservoirs have been subjected to miscible CO2 floods in the last 30 years61. Large-scale CO2 flooding in the Permian Basin began in 1984 and injection rates have averaged 1.2 bcfCO2/d. Oil production due to CO2 flooding (above water flood decline) has risen to approximately 170,000 bopd, but is leveling off. Texas-wide CO2-EOR currently accounts for slightly more than 15% of average annual production in Texas.
The ultimate recovery associated with CO2 flooding is expected to be in the billions of barrels. The estimates range widely but all indicate a great potential. Since 1984, cumulative CO2-EOR production in west Texas is nearly 1.0 bbo and ultimate CO2 enhanced recovery of 2.0 bbo is not unreasonable62. PTTC Texas (2005) cites recent studies that indicate a resource target of 4.5 bb of miscible floodable oil. Tinker and Williams (2005) estimate that 5.7 bbo in Texas and 8.5 bbo throughout the southern region of the United States could be recovered through CO2-EOR methods.
The magnitude of the recovery can be seen in the history of production increases since the initiation of CO2 floods at SACROC Unit and the Yates field. SACROC and Yates are two of the larger fields with current CO2-EOR programs. Since the start-up of CO2 flooding in these fields, the recovery rates have increased greatly63. SACROC has quadrupled daily production to 32,800 bopd and Yates is now producing 24,000 bopd. The two fields have a combined 8.0 billion barrels of OOIP. If CO2-EOR is effective in the range of 8% to 11% of OOIP, these fields have the potential to ultimately produce an incremental 640 to 880 MMbo.
Typical reservoir characteristics were determined by evaluating 66 west Texas reservoirs64:
• average bottom hole temperature = 108° F (86-134°),
• average viscosity = 1.52 cp (0.5-2.6 cp),
• average oil saturation at start of CO2 flood = 55% (35-85%),
• average porosity = 11% (7-13.5%),
• average permeability = 9md (1.5-62md),
• average depth = 5,281’ (4,500-8,000’), and
• average oil gravity = 33°API (28-41° API).
61 PTTC Texas, 2005 62 Christopher and others, 2005 63 Petroleum News 2005 64 Nelms, and Burke, 2004

55
These characteristics conform well to the screening criteria that qualify a reservoir for miscible CO2 floods. The following examples from other areas exhibit similar reservoir and oil characteristics. Reservoirs in the Cook Inlet area will need to exhibit similar characteristics to pass the screening test for effective CO2 floods.
2.4.3.1.2 Wyoming
Carbon dioxide flooding is rapidly expanding in Wyoming. One example is the Salt River field with 1.9 bb of OOIP65. The miscible CO2 flood, initiated in 2003, is expected to add 150 MMbo to the EUR from this 100-year old field66. About 7,200 tons of CO2/day is sequestered by injection. Net production is expected to increase from 5,300 bopd to 28,000 bopd over the next several years. This five-fold increase in production will extend the life of the field by 15 years or more.
2.4.3.1.3 Montana and North Dakota
Carbon dioxide flooding is an emerging technology in Montana and North Dakota. The feasibility and potential of CO2 floods have been evaluated by studying 26 oil fields in the two states. As of 1985, the total OOIP in the studied fields was 4.367 bbo, with cumulative recovery of 858 MMbo. Estimated total oil recovery from primary and secondary production was projected to be 1.038 bbo, or 23.8% of OOIP. Thus there would be 3.539 bbo remaining prior to initiation of EOR. Future potential for CO2 miscible oil recovery was estimated to be 232 MMbo67. This number is low compared to the range of recoveries experienced in existing floods. Using the average range of 8% to 11% of OOIP, incremental recovery could be as great as 350-480 MMbo.
2.4.3.1.4 Oklahoma
The Postle oil field is an example of a successful CO2-EOR project in Oklahoma. It is a relatively small but important field. The CO2 injection program began in 1996 and has boosted production rates from 3,000 bopd to more than 11,000 bopd68.
2.4.2.1.5 Saskatchewan, Canada
The Weyburn oil field in Saskatchewan, Canada is an important example of a successful miscible CO2 that utilizes CO2 from a coal gasification plant, much as the proposed Cook Inlet program would. The field, discovered in 1954, produces from a carbonate unit called the Mississippian Midale Formation69. The productive interval is at depths of 4,650 to 4,750 feet (1,420-1450m) and the oil gravity is 25-34° API. The OOIP is 1.40 bbo and the oil recovery prior to the CO2 flood was about 350-360 MMbo or approximately 25% of OOIP.
EnCana initiated the CO2 flood in 2000 and it is expected that the flood will extend the life of the field 20 to 25 years70. Production has more than doubled, from 10,000 bopd to 21,000 bopd. Ultimately, 130 MMbo of incremental production will be achieved over the extended life of the field, approximately 9% of OOIP.
65 Melzer, 2005 66 Anadarko Petroleum Corporation, 2005 67 Nelms and Burke, 2004 68 Oil and Gas Journal, 2005a 69 Christopher and others, 2005 and Nelms and Burke, 2004 70 Nelms and Burke, 2004 and Oil and Gas Journal, 2005b
56
To achieve this incremental recovery, EnCana is injecting CO2 at the rate of approximately one million metric tons per year, and over the next 15 years EnCana will probably inject 18 million tons of CO2.
2.4.3.2 Other Areas
Outside North America, CO2-EOR technology is still in its infancy. One example is the Gullfaks field, offshore Norway71. Production is from a series of Jurassic sandstones with high to very high reservoir quality, porosity ranging from 30% to 35% and horizontal permeability of the order of 800 md. The reservoir pressure and temperature are about 310 bar and 74° C (165° F), respectively at the reservoir depth of 1,850 m (6,070 feet) and the oil gravity is between 32 and 36° API. The reservoir is extensively layered and faulted, not unlike many of the Cook Inlet reservoir intervals.
Field production began in 1986 and as of July, 2003, when the CO2-WAG program began, the field had produced 300 million standard (MS) cubic meters (1.89 bbo) of the current EUR of 342 MS cubic meters (2.155 bbo). The OOIP is about 582 MS cubic meters (3.66 bbo)72. The strategy is to maintain reservoir pressure above the saturation pressure (230 bar) by water injection augmented by CO2 injection. The estimates of CO2-EOR incremental oil production are 48 MS cubic meters (302 MMbo) through 2020 and 58 MS cubic meters (365 MMbo) through 203073.
2.4.3.3 Summary
These examples clearly demonstrate the wide applicability and effectiveness of CO2 floods in increasing the recovery rates and life of oil fields in a variety of geologic settings. They also have the considerable added benefit of reducing greenhouse gas emissions. The potential upside from CO2-EOR is the production of tens to hundreds of billions of additional barrels of oil, from known reservoirs with existing infrastructure and experienced personnel.
2.4.4 Examples of Carbon Dioxide Sequestration in Saline Aquifers Carbon dioxide injection in saline reservoirs has tremendous potential with respect to the volumes that may be sequestered in them. Despite this potential, storage of CO2 in saline reservoirs is not economically advantaged in most cases74, and saline reservoirs have larger uncertainties. Unlike depleted oil or gas reservoirs, there is generally very little direct information on reservoir heterogeneity, porosity, permeability and nature of seals, and unlike oil field or coal bed methane storage, there is no added value product resulting from the sequestration. Consequently, there has been little economic incentive to utilize saline aquifers for CO2 sequestration in the United States.
Internationally, the situation is somewhat different in that restrictions on greenhouse gas emissions, including CO2 emissions, are restricted and often taxed. This is the situation that led to the sequestration of CO2 from the Sleipner West gas field in a saline aquifer in Norway.
The Sleipner West gas field is located 240 km (150 miles) offshore Norway and produces from Tertiary reservoirs75. The natural gas contains 9% CO2 and the European limit for gas export is
71 Agustsson and Grinestaff, 2004 72 Augustsson and Grimestaff, 2004 73 Augustson, 2004 74 Christopher and others, 2005 75 Center for Energy and Environmental Studies, 1997
57
2.5% CO2. Thus, approximately 75% of the CO2 must be stripped from the gas stream prior to marketing the gas. This leaves 6.5% CO2 to be vented or otherwise disposed.
In 1991, the Norwegian government imposed a tax of $55/ton on CO2 emissions. This tax would have cost Statoil and its partners $110,000 per day for CO2 emissions from the Sleipner West gas field76. Thus venting the excess CO2 was not a financially viable option. Statoil and partners elected to sequester the CO2 in the Miocene Utsira Formation, a saline aquifer about 800 m (2,500 feet) above the gas field and 1,000 m (3,300 feet) below the sea floor. The Utsira Formation is typified by regionally pervasive high porosity and permeability and ranges from 50-300m (165-985 feet) in thickness77. The CO2 migrates by displacing ambient water, with which it is largely immiscible, and by rising relative to the water due to its lower density78.
The operators inject one million tons of CO2 into the Utsira Formation annually and estimates are that the formation can hold 600 billion tons of CO2, an amount thought to be equivalent to all the CO2 that would be produced from all of Europe’s fossil fuel power plants for 800 years79. Figures of this magnitude provide some idea of the potential of saline aquifers to meet the challenge of CO2 sequestration in the years and decades to come.
In the United States injection of CO2 into saline aquifers has historically been viewed as the option of last choice. There are costs that cannot be recovered and unless there are substantial subsidies or trade-offs this approach may have little likelihood of acceptance in many regions. Regardless of the costs, injection into saline aquifers is being evaluated in the Texas Gulf coast, where BP America80 has undertaken an experiment to inject and monitor the distribution of CO2 in the 5,000 ft deep Frio Formation, a saline aquifer. This is one of multiple aquifers in the general area and injection into them may be the most acceptable solution for sequestering large volumes of CO2. The widespread nature and ease of access may ultimately make these aquifers the preferred disposal sites for the many chemical plants and refineries in the region.
2.4.5 Cook Inlet Oil Fields and CO2 Flood Potential As previously indicated, EGR and ECBMR are not viewed as viable options for commercial applications related to CO2 sequestration in the Cook Inlet area. Therefore if there is an economic benefit to be derived from sequestration of any excess CO2, it will come from EOR programs directed at not only storing the CO2 but also increasing the production and useful life of the oil fields and production infrastructure of the inlet. To accomplish this goal, there must be one or more large oil reservoirs that meet the screening criteria for miscible CO2 flooding, and the price of oil vs. the cost of carbon dioxide must be economically advantaged.
2.4.5.1 Primary Cook Inlet Oil Field Candidates
Although seven of the eight oil fields (Table 2.17) in Cook Inlet are currently producing and represent potential candidates for CO2-EOR floods, only five were considered strong candidates. The Beaver Creek oil field (Table 2.17) was abandoned after producing only 5.7 MMbo. Redoubt Shoal with OOIP of approximately 20.0 MMbo is also an unlikely candidate. The West McArthur River oil field OOIP has been estimated to be about 100 MMbo, which is considerably less than the other five fields and should be considered marginal as a candidate for CO2 injection.
76 Bartlett and others, 2003 77 House and others, 2003 78 Walter, 2000 79 Bartlett and others, 2003 80 Bartlett and others, 2003

58
The remaining five oil fields have estimated OOIP volumes ranging from 350 to 1,500 MMbo and theoretically could provide incremental reserves that range from 35 MMbo at Trading Bay to 150 MMbo at McArthur River (Table 2.17).
In a study conducted for the DOE’s Office of Fossil Energy81, six fields, excluding Redoubt Shoal and Beaver Creek, were evaluated for suitability as targets of CO2-EOR programs.
2.4.5.2 Reservoir Characteristics
The review and evaluation of the productive pools within the Cook Inlet oil fields shows that 17 reservoirs or reservoir-bearing intervals have been productive. For the purposes of determining suitability as CO2 flood candidates the 17 potential reservoirs/reservoir intervals (Table 2.18) are effectively reduced to 15 if the Redoubt Shoal and Beaver Creek fields are discounted as lacking sufficient incremental reserve potential. The total is further reduced to 14 when the West McArthur River field removed due to its marginal potential. The 14 remaining reservoir intervals were screened for CO2-EOR potential and the results indicate that 13 fulfill the criteria to qualify for miscible CO2 floods and one (Trading Bay Field, Tyonek B reservoir) is suitable for immiscible flood only (Table 2.18). The miscible reservoirs are denoted by a single asterisk (*) in Table 2.18.
Table 2.18 Cumulative production, reservoir and oil characteristics of potential CO2-EOR candidates.
* = miscible flood, ** = immiscible flood, + = not viable, ++ marginal candidate. (Alaska Oil and Gas Conservation Commission, 2003)
Oil Field/
Reservoir
(production
to date)
Parameters
Depth
(feet)
Net Pay
(feet)
Porosity
(%)
Perm-
eability
(md)
Current
Reser-
voir
Press-
ure
(psi)
Temp-
erature
(°F)
Oil
gravity
(°API)
Oil
Viscosity
@ original pressure
(cp)
Beaver Creek/
Hemlock
(5.7 MMbo)
14,800 100 ???? ???? 1,236 215 35 ????
Granite Pt./
Middle Kenai*
(139.8 MMbo)
8,780 250-600
14.0 10 2,000 135-170
41-44 ????
Granite Pt./
Hemlock*
11,000 120 11 5 4,500 160 34 ????
81 Advanced Resources International, Inc., 2005

59
Oil Field/
Reservoir
(production
to date)
Parameters
Depth
(feet)
Net Pay
(feet)
Porosity
(%)
Perm-
eability
(md)
Current
Reser-
voir
Press-
ure
(psi)
Temp-
erature
(°F)
Oil
gravity
(°API)
Oil
Viscosity
@ original pressure
(cp)
(2.0 Mmbo)
McArthur R./
Hemlock*
(533.2 MMbo)
9,350 290 10.5 53 3,770 180 33.1 1.19
McArthur R./
Mid-Kenai G.*
(61.6 MMbo)
8,850 100 18.1 65 2,650 174 34 1.088
McArthur R./
W. Foreland*
(24.3 MMbo)
9,650 100 15.7 102 4,000 183 30.3 1.497
Middle Ground
Shoal/Hemlock,
E, F, and G*
(176.9 MMbo)
8,500 500 11 10 2,500-
3,500
155 36-38 0.85
Middle Ground
Shoal/ Tyonek A*
(2.8 MMbo)
5,500 190 16 15 ???? 128 39 ????
Middle Ground
Shoal/ Tyonek
B, C, and D*
(12.0 MMbo)
6,000 335 16 15 1,700 130 36-38 ????
Redoubt Shoal/
Hemlock+
(1.5 MMbo)
12,000 450 11.5 6 5,100 195 26.5 2.00
Swanson River/
Hemlock*
(228.6 MMbo)
10,780 75 21 55 2,500 180 30 ????

60
Oil Field/
Reservoir
(production
to date)
Parameters
Depth
(feet)
Net Pay
(feet)
Porosity
(%)
Perm-
eability
(md)
Current
Reser-
voir
Press-
ure
(psi)
Temp-
erature
(°F)
Oil
gravity
(°API)
Oil
Viscosity
@ original pressure
(cp)
Trading Bay/
Hemlock
(14.1 MMbo)
9,800 215 12 12 1,700? 180 35.8-36.2
1.036
Trading Bay/
Tyonek B**
(4.0 MMbo)
3,300 20 (?) ???? 1,200 108 20 8.1
Trading Bay/
Tyonek C*
(20.7 MMbo)
4,400 20 (?) ???? 1,800 111 25 4.1
Trading Bay/
Tyonek D*
(29.3 MMbo)
5,628 20 250 2,300 135 26 1.24
Trading Bay/
Tyonek E*
(8.3 MMbo)
5,700
100-
1000
20 130 1,500 139 30.7 0.71
W. McArthur R./ Hemlock++
(10.5 MMbo)
9,400 160 12 30 3,200 180 28.4 3.4
A DOE study by Advanced Resources International, Inc. (2005) identified 12 reservoirs as technically favorable for miscible flood and one, the Trading Bay Unit, Tyonek B, as suited only for immiscible flood. The Granite Point Hemlock reservoir did not qualify for either miscible or immiscible flooding. There may be some validity to this position, as the reservoir has not been highly productive.
2.4.5.3 Production History of Cook Inlet Oil Fields
The first discovery of commercial quantities of oil in the Cook Inlet region was at the Swanson River field in 1957, with first production in 1960. The other large oil fields were discovered in rapid order: Middle Ground Shoal in 1962, Granite Point and McArthur River in 1965, and Trading Bay in 1968. Water flooding has been a common aspect of all the Cook Inlet oil fields, usually implemented within 2 to 4 years of first oil production. The major exceptions are the
61
McArthur River West Forelands reservoir and the Swanson River Hemlock reservoir, in which water flooding began 18 and 10 years, respectively, after first production. The Swanson River field has had a long history of injection of natural gas for pressure maintenance and is the only field in Cook Inlet with gas injection.
As Table 2.17 demonstrates, a majority of the fields are well into decline and individually have produced more than 90% (in most cases, more than 95%) of the estimated ultimate recovery (EUR). The cumulative production of 1,303.7 MMbo is about 95.9% of the EUR of 1,359.9 MMbo. For the five largest fields, the EUR averages about 35.5% of the OOIP for the five main fields, ranging from 24.8% at Granite Point to 46.6% for the Swanson River field and 37% for the basin as a whole (34% if the more optimistic OOIP of 4,000 MMbo is used). These recovery factors plus the response to the water flood meet two reservoir characteristics that Klins (1984) cites as optimal for the most effective miscible floods.
The severe decline in production from the Cook Inlet fields has been well documented82. Peak production of nearly 83 MMbo/yr occurred in 1970 and quickly declined to less than 20 MMbo/yr by 1985. Current production is about 10.0 MMbo/yr and production is forecast to be less than 1.0 MMbo by 2014. The Alaska Division of Oil and Gas (2004) estimates that the Beaver Creek field will be abandoned by the end of 2010. If the reservoirs are not stimulated through some form of EOR, the last of the major fields will be depleted by the year 2016. CO2-EOR appears to be the obvious choice.
2.4.5.4 Potential for CO2-EOR in Cook Inlet
Unless significant new discoveries are made within the next five years or reserve growth occurs within the existing fields through development of by-passed productive zones or EOR methods, the Cook Inlet oil fields will be abandoned, with nearly two-thirds of the oil “stranded” in the reservoirs. The history of CO2-EOR in the lower 48 states and Canada suggest that a significant percentage of that 2,310 MMbo could be recovered through CO2 injection. This incremental component of production could be even larger if the OOIP is closer to 4,000 MMbo.
Advanced Resources International, Inc. (2005) identified 13 reservoirs suitable for CO2-EOR. Twelve reservoirs successfully passed the screening process to qualify for miscible floods and one was suited for immiscible flood. The study utilized three scenarios:
• The “State of the Art” or base case, which assumes that successful state-of-the-art technology from other areas, is successfully applied to the oil reservoirs of Cook Inlet. The oil price is $25.00/barrel and the cost of CO2 is $1.25/mcf. The high cost of CO2 was based on the lack of an abundant local source of CO2.
• The “Risk Mitigation” or second case assumes that various factors combine to increase the price of the marker crude (WTI) by $10.00/barrel, thus increasing the price for Cook Inlet oil to $35.00/barrel. The lack of ready supply for CO2 remained as a factor in this scenario.
• The “Ample Supplies of CO2” or third case assumes the development of local supply or supplies of CO2 and reduces the CO2 cost to $0.70/mcf. The price of oil was held at $35.00/barrel. The rate-of-return was assumed to be 15% before taxes.
82 Alaska Division of Oil and Gas, 2004

62
The first two scenarios did not produce an economically viable scenario; however, results of the third scenario indicated that up to 140 MMb of incremental oil recovery was achievable from two fields. No technical reasons are described in the study to suggest that additional reservoirs would not become viable if economic conditions were more favorable.
In the current coal gasification study, the results of the review and evaluation of field and reservoir suitability for CO2 were similar to the Advanced Resources International, Inc. (2005) study and more optimistic in terms of potential EOR results. The present evaluation found a like number of reservoirs suitable for miscible CO2 floods (13 vs. 12) and both evaluations found the Tyonek B reservoir at the Trading Bay field to be suitable for only an immiscible flood. But with the knowledge that if this EOR effort is launched there will be a nearby source of CO2, the prospects become more attractive. Similarly, the upper price of $35.00/barrel is thought to be conservative and should be more in the range of $45.00 to 65.00/barrel for the near to intermediate future.
The reservoirs of the lower Tertiary are interpreted to be non-marine and thus lack the more widespread distribution and degree of lateral continuity frequently displayed by shallow marine units. However, even in the non-marine units of the Kenai Group of Cook Inlet there are different non-marine depositional facies that vary considerably in both aerial distribution and lateral continuity; thus, they may respond differently and some may be more effectively flooded than others.
The Hemlock Conglomerate reservoirs are largely alluvial fan and braided stream deposits with associated fine-grained overbank and coal sequences. The fan deposits tend to have greater lateral continuity and aerial extent. Consequently, a CO2 flood should be quite effective, and relatively large volumes of CO2 could be injected into these reservoir units. The Tyonek reservoirs are almost exclusively braided or meandering stream deposits and as a consequence they have limited lateral extent and a ribbon-like geometry which may somewhat limit both the volumes of CO2 that the reservoirs can store and the effectiveness of the process.
The reservoir-by-reservoir cumulative production is presented in Table 2.18. The Hemlock reservoirs in the McArthur River, Swanson River, and Middle Ground Shoal fields have produced a total of 939 MMbo and are the most important reservoirs in the inlet. The Tyonek reservoirs of the McArthur River, Granite Point, and Trading Bay fields are of secondary significance but still major producers with approximately 265 MMbo produced.
The Hemlock reservoirs would appear to be the most attractive flood candidates. This conclusion is based on both the geometry and continuity of the reservoirs and the percentage of the basin’s known oil reserves that are within Hemlock reservoirs. The Tyonek reservoirs are not excluded from CO2 flooding, but they would be considered a lower priority objective, unless other factors such as proximity to CO2 supply favor their utilization.
Ideally, the sequence of flooding would be the Hemlock reservoirs (and associated reservoirs of the Tyonek) of the McArthur River field, Middle Ground Shoal field, and Swanson River field, followed by floods in the Tyonek reservoirs of the Granite Point and Trading Bay fields.
The research for this study did not uncover OOIP for individual reservoirs, only estimates of OOIP by field. Thus, in order to estimate the potential for individual reservoirs, a standard other than the one applied in Table 2.17 was used to derive reservoir-by-reservoir estimates of incremental production (reserves). Where OOIP is not known, oil recovery is typically 25% of

63
cumulative production83. Using this figure, a reservoir-by-reservoir analysis of incremental production yields the following results for the major reservoirs:
• McArthur River – Hemlock = 133 MMbo
• Swanson River – Hemlock = 57 MMbo
• Middle Ground Shoal – Hemlock = 44 MMbo
• McArthur River – Tyonek = 16 MMbo
• Granite Point – Tyonek = 35 MMbo
• Trading Bay – Tyonek = 18 MMbo
The sum of these estimates is 303 MMbo, which falls within the range of 292 to 401.5 MMbo shown on Table 2.17. If the West McArthur River field values are deleted the range is 285 to 390 MMbo. The numbers of Table 2.17 also include several reservoirs not included in the list above.
The significance of these numbers lies in the fact that 300 million barrels or more of incremental oil production is possible if a CO2 injection program is undertaken in the Cook Inlet oil fields. The critical factors are the long-term availability of a sufficient volume of CO2 from the coal gasification operation and/or other sources, sufficiently high oil prices, the willingness of the oil producers to take on these programs, and the need for additional infrastructure. With a viable CO2-EOR program in place, the life of the five major fields could be extended for an additional 20 to 25 years and additional production equal to that of the last 20 to 25 years in Cook Inlet.
To further evaluate the economics of CO2 flooding in the Cook Inlet, a first-cut economic analysis of the McArthur River field was performed. It was not possible in this study to conduct the geological, engineering, reservoir simulation, and cost estimation analysis that would be required by corporate decision makers to initiate such a project. It should also be recognized that Cook Inlet oil fields have aging infrastructure and that the platforms, facilities, pipelines, and wells may all need significant refurbishing to meet CO2 flooding requirements and to continue in operation for another 20 to 30 years. For the Swanson River field there is the added non-technical complication of its location in the Kenai National Wildlife Refuge, which may inhibit the operator’s options for continued operations. These upside costs and impediments can only be estimated as part of a detailed comprehensive reservoir and economic study.
2.4.5.4.1 Economic Evaluation for CO2-EOR Flood at McArthur River Field
The goal of the McArthur River field analysis is to bracket the potential economic value of a CO2-EOR flood. The analysis is based on an empirical estimate of potential oil production response to a CO2 flood. A more rigorous analysis involving compositional reservoir simulation for a type pattern and scaling of the results to a full field-wide response was not possible for this study.
The economic analysis used the IFPS economic model employed for past Alaska oil and gas studies84. These studies used commercially available software to model in detail a deterministic discounted cash flow of oil and gas development under state of Alaska, federal, and local 83 Petroleum Technology Transfer Council, 2005 84 Thomas et al., 1991, 1993, 2004

64
government tax and royalty rules and environmental regulations. The model provides a detailed treatment of Alaska petroleum tax law and has been used and refined from these previous studies for this application. The financial analysis uses a series of data files describing each project, the commodity price track, pipeline tariffs, and other inputs that are used to model projects and standardizes the analyses and results for comparability between projects.
Historical field production is from the Alaska Oil and Gas Conservation Commission (AOGCC) electronic production database. The AOGCC production database from April 1969 through February 2005 contains individual well records for monthly oil, gas and water production. This information was also used for derivative data such as active well counts, daily production, gas-oil ratio (GOR), and water cut trends.
The historical oil, gas, and water production data is presented in Figure 2.5. The field production peaked at 108,600 standard barrels/day in November 1975 before starting a sustained decline. Cumulative production of oil and NGLs through December 2005 is 631,194 Mstb for a recovery factor of 42.1% of the OOIP. The primary producing interval has been the Hemlock, with contributions from the Middle Kenai G and an undefined formation. Current production is 7,240 stb/day. The field decline accelerated in 2002 and 2003, declining at of about 12%/year. The field decline has temporarily been arrested with an average production for the last 17 months of 8,108 stb/day.

65
Figure 2-4 McArthur River Field Historical Production (AOGCC database)
1/1/651/1/66
1/1/671/1/68
1/1/691/1/70
1/1/711/1/72
1/1/731/1/74
1/1/751/1/76
1/1/771/1/78
1/1/791/1/80
1/1/811/1/82
1/1/831/1/84
1/1/851/1/86
1/1/871/1/88
1/1/891/1/90
1/1/911/1/92
1/1/931/1/94
1/1/951/1/96
1/1/971/1/98
1/1/991/1/00
1/1/011/1/02
1/1/031/1/04
1/1/05
0
20,000
40,000
60,000
80,000
100,000
120,000
Oil
and
Wat
er p
rodu
ctio
n, b
bl/d
ay
0
10,000
20,000
30,000
40,000
50,000
60,000
Gas production,M
cf/day
OilGasWater
DDF3/05/2006
McArthur River FieldHistorical Production
It was assumed that 40 MMcfd of CO2 would be available from the Agrium fertilizer plant for injection. It is possible that up to 160 MMcfd of CO2 may be available if a coal gasification plant is developed and Agrium can increase it level of fertilizer production. Hence, the CO2 EOR incremental oil recovery could be accelerated and possibly increased or other fields could be developed. A detailed cost estimate of capital cost needed to prepare the well field and production facilities for a CO2 flood was not feasible for this screening-level economic evaluation. The following estimates and assumptions were used:
• Well remediation costs of $3.5 million per well for 41 production wells and 21 injection wells, with costs spread out over eight years.
• Capital costs for a new platform at $100 million because current production platforms are not likely to have sufficient space to handle CO2 compression and separation facilities.
• CO2 pipeline at $15 million.
• Capital investments are made at the beginning of the project.
• Capital cost for CO2 compression and separation facility to handle 80 MMcf/d (primary CO2 purchases and additional recycled gas) at $193 million.
• Total capital investment of $308 million.
• Operating costs included fixed costs of $200,000 per well annually and variable operating costs of $0.50/bbl fluid lifting cost. The water production was estimated using
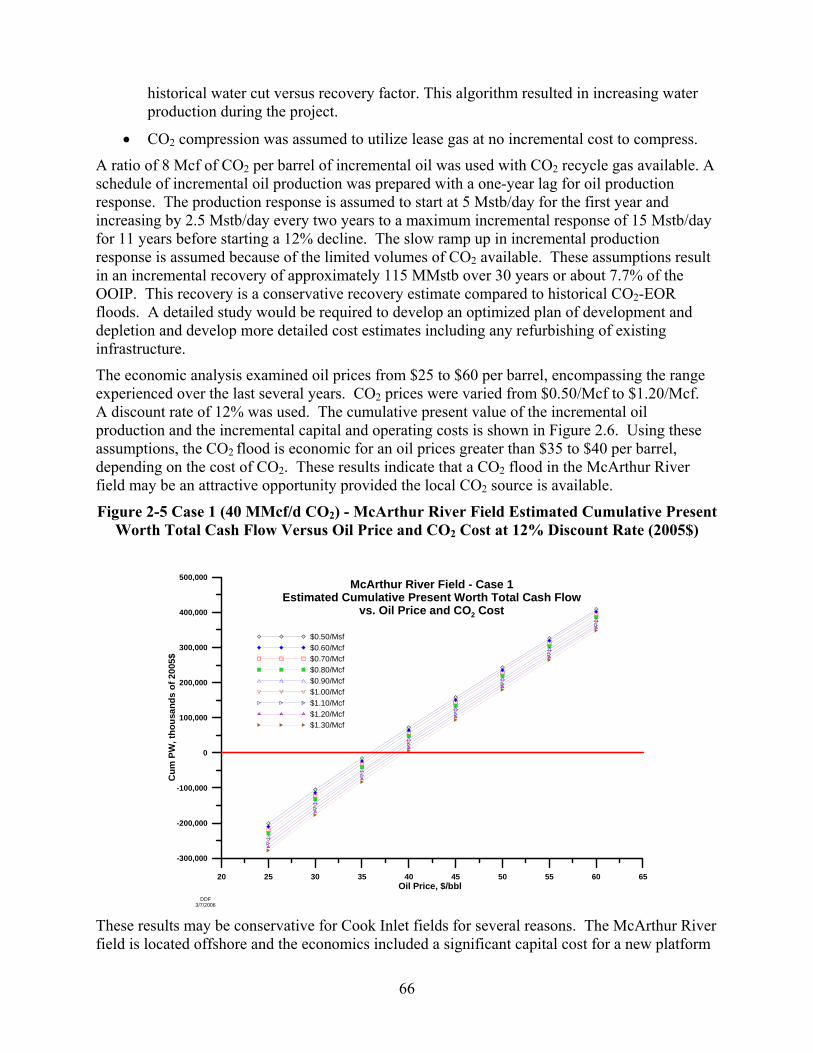
66
historical water cut versus recovery factor. This algorithm resulted in increasing water production during the project.
• CO2 compression was assumed to utilize lease gas at no incremental cost to compress.
A ratio of 8 Mcf of CO2 per barrel of incremental oil was used with CO2 recycle gas available. A schedule of incremental oil production was prepared with a one-year lag for oil production response. The production response is assumed to start at 5 Mstb/day for the first year and increasing by 2.5 Mstb/day every two years to a maximum incremental response of 15 Mstb/day for 11 years before starting a 12% decline. The slow ramp up in incremental production response is assumed because of the limited volumes of CO2 available. These assumptions result in an incremental recovery of approximately 115 MMstb over 30 years or about 7.7% of the OOIP. This recovery is a conservative recovery estimate compared to historical CO2-EOR floods. A detailed study would be required to develop an optimized plan of development and depletion and develop more detailed cost estimates including any refurbishing of existing infrastructure.
The economic analysis examined oil prices from $25 to $60 per barrel, encompassing the range experienced over the last several years. CO2 prices were varied from $0.50/Mcf to $1.20/Mcf. A discount rate of 12% was used. The cumulative present value of the incremental oil production and the incremental capital and operating costs is shown in Figure 2.6. Using these assumptions, the CO2 flood is economic for an oil prices greater than $35 to $40 per barrel, depending on the cost of CO2. These results indicate that a CO2 flood in the McArthur River field may be an attractive opportunity provided the local CO2 source is available.
Figure 2-5 Case 1 (40 MMcf/d CO2) - McArthur River Field Estimated Cumulative Present Worth Total Cash Flow Versus Oil Price and CO2 Cost at 12% Discount Rate (2005$)
20 25 30 35 40 45 50 55 60 65Oil Price, $/bbl
-300,000
-200,000
-100,000
0
100,000
200,000
300,000
400,000
500,000
Cum
PW
, tho
usan
ds o
f 200
5$
$0.50/Msf$0.60/Mcf$0.70/Mcf$0.80/Mcf$0.90/Mcf$1.00/Mcf$1.10/Mcf$1.20/Mcf$1.30/Mcf
DDF3/7/2006
McArthur River Field - Case 1Estimated Cumulative Present Worth Total Cash Flow
vs. Oil Price and CO2 Cost
These results may be conservative for Cook Inlet fields for several reasons. The McArthur River field is located offshore and the economics included a significant capital cost for a new platform
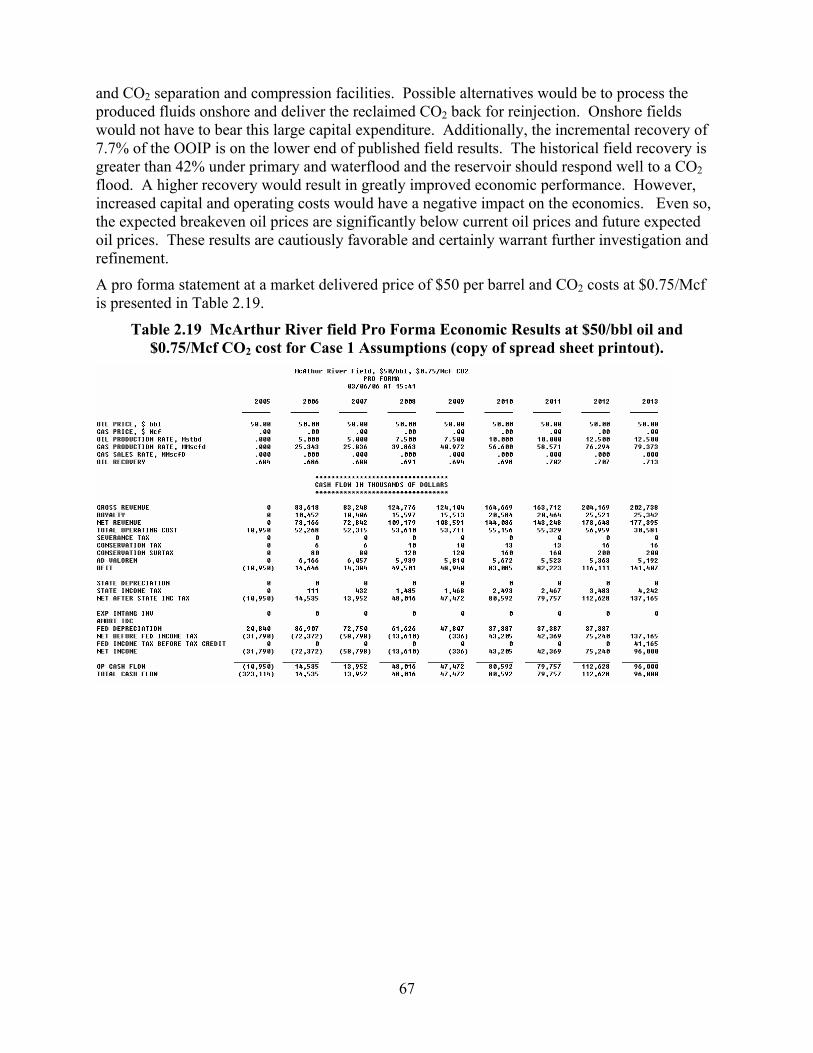
67
and CO2 separation and compression facilities. Possible alternatives would be to process the produced fluids onshore and deliver the reclaimed CO2 back for reinjection. Onshore fields would not have to bear this large capital expenditure. Additionally, the incremental recovery of 7.7% of the OOIP is on the lower end of published field results. The historical field recovery is greater than 42% under primary and waterflood and the reservoir should respond well to a CO2 flood. A higher recovery would result in greatly improved economic performance. However, increased capital and operating costs would have a negative impact on the economics. Even so, the expected breakeven oil prices are significantly below current oil prices and future expected oil prices. These results are cautiously favorable and certainly warrant further investigation and refinement.
A pro forma statement at a market delivered price of $50 per barrel and CO2 costs at $0.75/Mcf is presented in Table 2.19.
Table 2.19 McArthur River field Pro Forma Economic Results at $50/bbl oil and $0.75/Mcf CO2 cost for Case 1 Assumptions (copy of spread sheet printout).

68

69
2.4.6 Injection in Saline Aquifers Despite the potential for an effective and economic CO2-EOR program in the Cook Inlet oil fields, there remains a very real possibility that it will not see implementation. Failure to satisfy any of the critical factors presented above could prevent the development of an EOR program. If this were not to come to pass, the only option for sequestration of excess CO2 would appear to be the costly option of injection into saline aquifers, or possibly into depleted gas fields. Gas field injection would be the preferred option but it would require agreement and cooperation from the field owners. The potential of developing a viable EGR operation is unknown as none exist to date, and pursuing this course would probably be based on the precept that the field was exhausted and the reservoir was for all intents and purposes a “saline aquifer.” The obvious advantages in using an abandoned gas field are the existence of pipeline system, wells for injection, and other critical infrastructure.
Proximity to the injection sites (exhausted gas reservoirs or saline aquifers) is an important consideration to minimize costs. The only large gas fields in the vicinity of the proposed gasification facility are the Beaver Creek, Cannery Loop, and Kenai fields. These fields are all expected to be producing through 2015 and beyond, and it is doubtful the operators would be supportive of using them as a sequestration site for CO2.
The use of saline aquifers would require the development of a pipeline system, injection wells, and the necessary support infrastructure. Finding suitable sites at relatively shallow depths and in close proximity to the coal gasification plant would be required to minimize costs. Fortunately, this is probably an achievable objective. The lower Sterling and upper Beluga formations (Figure 2.2) underlie all of the Kenai Peninsula and generally at depths of only 3,000 to 5,000 ft or less. The primary concerns would be to locate aquifers containing waters that are too saline to be classified as potable and areas which possess good seals and lack significant faulting, in order to avoid potential leakage.

70
The upper Kenai Group sandstones have good to excellent porosity and are ubiquitous in occurrence. The salinities are low and thus they have excellent ability to take the CO2 into solution. This approach has seen limited utilization but has the potential to sequester very large volumes of CO2.
Required injection into either exhausted gas reservoirs or saline aquifers would be at considerable cost to the operators of the coal gasification plant and, unless some form of subsidy or tax break were granted, could easily jeopardize the entire project. For the reasons stated previously, exhausted gas reservoirs are the vastly superior option if a non-commercial sequestration option is necessary.
2.4.7 Conclusions The sequestration of excess amounts of CO2 from a proposed coal gasification plant in the Nikiski area of the Kenai Peninsula was reviewed from the aspect of how and where that volume of gas might be stored and what the potential consequences are. The conclusions reached are as follows:
• Sequestration of CO2 can occur in several ways, including injection into the subsurface, oceanic disposal, and chemical reactions to bind the CO2 in non-reactive minerals and bury the products.
• In the case of the coal gasification facility, the options appear to be limited to one or more of the subsurface injection scenarios – enhanced oil recovery, enhanced gas recovery, enhanced coal bed methane recovery, or injection into saline aquifers.
• Enhanced oil recovery and injection into saline aquifers are the only two methods that are adaptable to the local realities.
• There are more than 70 CO2-EOR programs world-wide and the process works regardless of reservoir lithology. Expected incremental oil recovery is 8 to 11% of OOIP or approximately 25% of cumulative production.
• There is only one large-scale saline aquifer injection program, offshore Norway, and it is viable only because of the $55.00/ton tax on polluting CO2. The taxes would be $110,000/day. Such a program in the Cook Inlet area would require a significant subsidy or tax break.
• There are more than a dozen reservoirs, primarily the Hemlock and Tyonek producing intervals in the five major fields of Cook Inlet that pass the screening criteria for miscible CO2 floods.
• Using the average range of incremental increase in production (8% to 11%), the five major Cook Inlet oil fields have the potential to produce an incremental 290 to 400 MMbo. Using only the major reservoirs and a 25% of cumulative production estimation tool, the incremental production would be approximately 300 MMbo.
• Screening level economics performed for the McArthur River field suggest that an economic CO2 flooding program in Cook Inlet’s oil fields might be possible at oil prices greater than $35 to $40 per barrel with the cost of CO2 ranging from $0.50/Mcf to $1.20/Mcf.

71
• The results of a successful flooding program could extend the life of the oil fields for 20 or more years and yield as much incremental oil as has been produced in the last quarter century
• If a CO2-EOR program were not developed and sequestration of excess CO2 was mandated by law, there would be a need for a strong subsidy or the entire coal gasification program may be burdened to the point where it had questionable economic value.
• There are highly porous and permeable saline aquifers at shallow depths and within close proximity of the proposed gasification plant. There would be a need to verify that any potential storage interval did not contain potable water, had adequate seals, and was not extensively faulted (to prevent leakage).
• There is some potential to use exhausted gas reservoirs for sequestration. These would be more cost effective and much of the required infrastructure exists. However, none are expected to be abandoned until 2015 or later.
These conclusions and their potential use are not based on the knowledge of the volumes of CO2 required for EOR purposes, the costs involved, or the willingness of the field operators to participate in a CO2-EOR program. The evaluation reflects only the effectiveness of CO2 flooding, the applicability of miscible and/or immiscible CO2 to the reservoirs of the Cook Inlet oil fields, and the potential volumes of oil resulting from such an enhanced oil recovery effort.
2.5 Impact on Cook Inlet Region Natural Gas Markets Agrium currently relies on scarce Cook Inlet natural gas as the chief feedstock for manufacturing fertilizer. Switching from natural gas to synthesis gas from coal will increase the amount of natural gas available for other uses in the Cook Inlet area, such as home heating and electric power generation. The impact on natural gas demand by eliminating Agrium as a natural gas customer was evaluated in another RDS study (“Gas Needs and Market Assessment - Alaskan Spur Pipeline Project” Contract No. DE-AM26-04NT41817, Task 211.01.06, completed in June, 2006.) In the assessment, it was assumed that unless low cost natural gas is obtained the fertilizer plant will suspend operations in the fall of 2006. If the Agrium plant converts to coal as feedstock, removing it from the regional gas market, effect on that assessment was found.
2.6 Impact on Regional Power Grid A separate needs assessment report analyzed the Alaska Railbelt power grid in South Central Alaska in detail85. That report examined the impact of various natural gas supply scenarios, focusing on the effects of population and industrial changes in the region. This Beluga Coal Study adapted the results of the market assessment study to the proposed IGCC plant.
As such the current projections of wholesale electric power prices reflect no changes to the electric power grid. Given the final configuration of the plant this provides for stranded generation output. The ease or difficulty of alleviating these constraints will require an electric transmission system impact study.
85 Thomas, C.P. and C. Ellsworth, et al, RDS, “Gas Needs and Market Assessment - Alaskan Spur Pipeline Project” Contract No. DE-AM26-04NT41817, Task 211.01.06, completed in June, 2006.

72
In keeping with the nature of this scoping study a transmission system impact study was not performed. The wholesale electric revenues received by the Agrium Plant could be significantly increased if the constraints can be alleviated and electric power is allowed to flow freely to the grid.
2.6.1 Wholesale Market Price Forecast A forecast of wholesale market prices was prepared for the Alaska Railbelt to determine project revenues from excess power sales by the Agrium facility. The base case assumed that the Beluga Project would provide 70 MW of electric power to the grid and receive the prevailing wholesale price. Plant output would be base loaded and provided on a 24*7 basis to the electric grid.
It was further assumed that the generation of electric power from the Beluga Project would be a byproduct of the coal gasification project and thus electric power would be dispatched into the electric grid regardless of local market prices.
The market price of power for the Railbelt was determined through a dispatch simulation of the electric power system for 2006 through 2024. This simulation captured the attributes of all existing and proposed generating units, loads and transmission lines in the system. The market price projections are shown in Table 2.20 and Figure 2.7 below.
Table 2.20 Wholesale price of electric power that can be sold to the grid as it is now configured
Wholesale Prices of Electric PowerAssuming Various Levels of Sale from the Agrium PlantNominal $/MWH
Output of Plant 2010 2011 2012 2013 2014 2015 2016 2017 2018 2019 2020 2021 2022 2023 2024 202544MW 52.07$ 50.70$ 51.61$ 53.48$ 55.97$ 59.02$ 58.83$ 60.98$ 63.36$ 63.02$ 66.77$ 71.19$ 69.39$ 74.01$ 76.36$ 66.27$ 50MW 51.80$ 50.53$ 51.37$ 53.40$ 55.87$ 58.99$ 58.44$ 60.11$ 62.27$ 62.75$ 66.44$ 71.05$ 68.66$ 73.90$ 73.74$ 67.79$ 60MW 47.68$ 46.41$ 47.22$ 49.07$ 51.35$ 54.15$ 58.05$ 59.90$ 61.73$ 62.24$ 66.16$ 70.39$ 71.00$ 73.33$ 72.61$ 66.08$ 70MW 45.94$ 45.32$ 46.43$ 48.20$ 51.02$ 53.84$ 53.45$ 54.97$ 56.75$ 56.31$ 59.34$ 63.29$ 68.93$ 62.17$ 66.27$ 67.92$

73
Figure 2-6 Average Revenue per MWH Generated and Sold into the Railbelt Market for a
70 MW Plant
0
10
20
30
40
50
60
70
80
2010 2011 2012 2013 2014 2015 2016 2017 2018 2019 2020 2021 2022 2023 2024 2025
Nom
inal
$/M
WH
It can be seen that 70 MW there is a higher market value than for 80 MW - threshold at which the market unit price will drop. This is because that at some point between 70 and 80 MW, the output from the Agrium plant will displace some of the low cost generation capacity in the system as it is currently configured. This fact indicates an upper limit of power that can be sold without revamping of the grid structure and modification of the transmission system. Therefore, some of the power produced will not be economically transferred to the grid, limiting the sale to about 70 MW.
3. GASIFICATION PLANT TECHNOLOGY AND PLANT DESIGN
3.1 Design Basis
3.1.1 Project Background Agrium U.S. Inc., a nitrogen fertilizer manufacturer that depends on Cook Inlet gas as a feedstock to produce ammonia, urea and power has been forced to shut down one ammonia plant and one urea plant due to insufficient gas supplies. The idea envisioned to keep the Agrium Kenai Nitrogen Operations (KNO) plant open is to build a gasification plant and replace the natural gas feedstock with gas produced from coal available in the region. The plant would take
74
coal, barged from one of two possible mines north of Kenai, and gasify it to provide new feedstock to the Agrium plant, displacing natural gas.
The objective of this two phase project is to determine the economic feasibility of siting a coal based gasification plant in the Cook Inlet region of Alaska to refuel the KNO plant. For Phase 1 of this study, the Agrium KNO plant in Nikiski, Alaska is the assumed site and customer for the gasification plant, with the plant designed to specifically meet the demands of the KNO plant.
This preliminary study examines a concept that would gasify either coal loaded at the Chuitna mine from across the Cook Inlet or from the existing Usibelli mine. Both coals are characterized with high moisture (27%), moderate ash (10-11%) and low sulfur (0.2%). At the Agrium site the coal will be fed to a high pressure gasifier where it is gasified with oxygen to produce synthesis gas. The syngas is cooled and cleaned. The coal has low sulfur content, but it may be necessary to remove a large amount of CO2 from the syngas with the sulfur to meet the syngas specifications of the Agrium process.
The IGCC plant will be integrated with the Agrium facility to produce a feedstock for producing an ammonia and urea fertilizer. Rather than producing synthetic natural gas (SNG), the gasification plant will assess two alterative cases for supplying the required feedstocks to the fertilizer plant – Hydrogen/Nitrogen/Carbon Dioxide/Steam/Power or Syngas/Nitrogen/Carbon Dioxide/Steam/Power.
The plant size will be based on meeting the Agrium feedstock and auxiliary power requirements (initially estimated to be 100 MWe). Waste heat from the gasification section of the plant will be recovered by producing high pressure steam, either for use in the KNO plant operations or to produce power in a steam turbine. Other facilities include wastewater treatment where the gasifier and other wastewater streams are cleaned for reuse.
The information contained in the Revision 0 version of the Design Basis primarily reflects Phase 1 of the project effort. The document may be updated for Phase 1, or a new Design Basis dedicated to Phase 1 may be developed later in the project.
3.1.2 Site Description The characteristics of the host site are presented in Table 3-1 and Table 3-2.
Table 3.1 Site Ambient Conditions
Elevation, ft 130 Barometric Pressure, psia 14.696 Design Ambient Temperature, Wet Bulb, °F 30 Design Ambient Relative Humidity, % 45

75
Table 3.2 Site Characteristics
Location Agrium Fertilizer Plant; Nikiski, Alaska Topography Flat, Sandy soil Size, acres 120 Transportation ocean vessel Ash Disposal Slag may be landfilled or sold for profit Water Wells Access Barge
The following design parameters are site-specific:
• Flood plain considerations: Maximum seawater elevation in a storm surge is less than 130 feet above mean sea level (MSL).
• Existing soil/site conditions: Soil bearing capacity is a function of depth as follows:
o 4-ft – 3,000 lb/ft2
o 6-ft – 3,000 lb/ft2 for foundations < 5-ft wide and 5,000 lb/ft2 for foundations > 5-ft wide
o 12-ft – 5,000 lb/ft2 for foundations < 5-ft wide and 8,000 lb/ft2 for foundations > 5-ft wide
o Major foundations should use spread footings. Soil resistivity should be a reasonable number for sandy soil. The design frost penetration is 12-ft below grade.
• Water discharges and reuse: Should be able to utilize existing NPDES permit.
• Rainfall/snowfall criteria: Design one-hour rainfall is 0.6 inches (minimum duration of 30 minutes), and the design 24-hour rainfall is 2.5 inches. The design snow load is 50 lb/ft2.
• Seismic design: The structural design basis is for seismic zone 4.
• Buildings/enclosures: Use local Alaskan building codes.
• Fire protection: Tie into existing system.
• Local code height requirements. No height restrictions. Aircraft alert lights required.
• Noise regulations – Impact on site and surrounding area: None
3.1.3 Design Coal The design coal for this study is from the Beluga Mine, and the design properties are shown in Table 3-3. Based on data from the Chuitna mine, the coal will contain approximately 16% inherent moisture, defined as the amount of moisture left in the coal after a moderate amount of low-temperature drying.

76
Table 3.3 Design Coal
Rank Sub-bituminous
Seam Chuitna
Source Beluga Mine
Proximate Analysis (weight %) AR* Dry
Moisture 27.00 0.00
Ash 10.00 13.70
Volatile Matter 33.20 45.48
Fixed Carbon 29.67 40.64
Sulfur 0.13 0.18
Total 100.00 100.00
HHV, Btu/lb 7,650
Ultimate Analysis (weight %) AR Dry, Ash Free
Moisture 27.00 0.00
Ash 10.00 0.00
Carbon 44.32 70.35
Hydrogen 3.24 5.15
Nitrogen 0.84 1.33
Chlorine 0.01 0.02
Sulfur 0.16 0.25
Oxygen 14.43 22.90
Total 100.00 100.00
* As Received
3.1.4 Environmental Requirements The expected environmental requirements are summarized in Table 3-4.

77
Table 3.4 Beluga Coal IGCC Study Environmental Design Basis
Pollutant Project Emission Limits Particulate Matter (PM), 0.01 lb/MMBtu (0.09 lb/MWh) Sulfur Dioxide (SO2) 0.022 lb/MMBtu (0.19 lb/MWh)
Nitrogen Oxides (NOx) 0.059 lb/MMBtu (0.51 lb/MWh, 15 ppmvd corrected to 15 volume % oxygen)
Carbon Monoxide (CO) 0.03 lb/MMBtu (0.026 lb/MWh) Volatile Organic Compounds (VOC) 0.002 lb/MMBtu (0.017 lb/MWh)
Note – These are expected requirements not permit limits.
3.1.5 Balance of Plant Assumed balance of plant requirements are as follows:
Cooling system Recirculating, Evaporative Cooling Tower or hybrid Air/Water cooling tower. Cooling tower makeup water composition is provided in Table 3-5..
Fuel and Other storage Coal 30 days Slag 30 days Sulfur 30 days
Plant Distribution Voltage Motors below 1 hp 110/220 volt Motors 250 hp and below 480 volt Motors above 250 hp 4,160 volt Motors above 5,000 hp 13,800 volt Steam and Gas Turbine generators
24,000 volt
Grid Interconnection voltage 345 kV Water and Waste Water
Makeup Water Process water is available from existing or new wells at a flow rate of 1,500 gpm. The quality of the process water is shown in Table 3-5.
Feed water Treatment of the process water supply (Table 3-5) is included and will produce boiler feed quality water for the IGCC plant.
Process Wastewater Water associated with gasification activity and storm water that contacts equipment surfaces will be collected and treated for discharge through a permitted discharge permit. Wastewater treatment capacity at the plant will be considered.

78
Sanitary Waste Disposal Design will include a packaged domestic sewage treatment plant with effluent discharged to the industrial wastewater treatment system. Sludge will be hauled off site. Sanitary waste treatment capacity at the plant will be considered.
Water Discharge Most of the wastewater is to be recycled for plant needs. Blowdown will be treated for chloride and metals, and discharged.
Solid Waste Gasifier slag is assumed to be a solid waste that is classified as non-hazardous. An offsite waste disposal site is assumed to have the capacity to accept waste generated throughout the life of the facility. Solid waste sent to disposal is at an assumed nominal fee per ton, even if the waste is hauled back to the mine. Solid waste generated that can be recycled or reused is assumed to be a zero cost to the technology
Process water and cooling water come from two different sources. Their composition and physical properties are shown in Table 3-5.
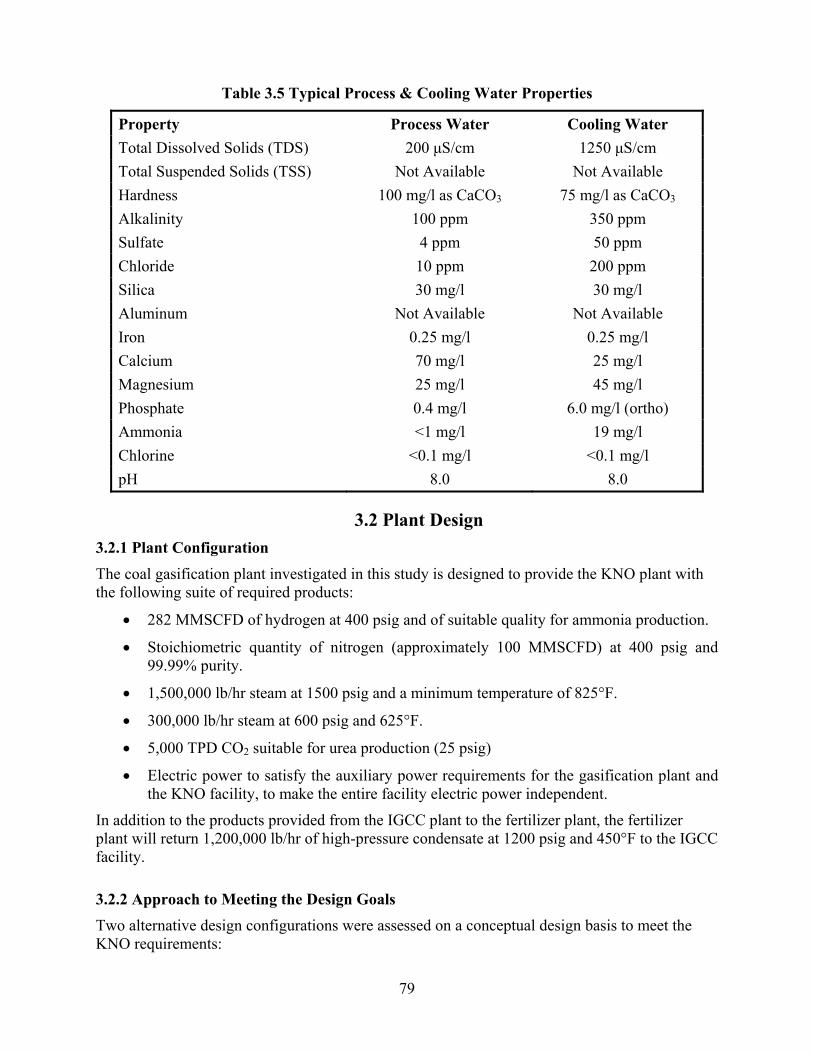
79
Table 3.5 Typical Process & Cooling Water Properties
Property Process Water Cooling Water Total Dissolved Solids (TDS) 200 μS/cm 1250 μS/cm Total Suspended Solids (TSS) Not Available Not Available Hardness 100 mg/l as CaCO3 75 mg/l as CaCO3 Alkalinity 100 ppm 350 ppm Sulfate 4 ppm 50 ppm Chloride 10 ppm 200 ppm Silica 30 mg/l 30 mg/l Aluminum Not Available Not Available Iron 0.25 mg/l 0.25 mg/l Calcium 70 mg/l 25 mg/l Magnesium 25 mg/l 45 mg/l Phosphate 0.4 mg/l 6.0 mg/l (ortho) Ammonia <1 mg/l 19 mg/l Chlorine <0.1 mg/l <0.1 mg/l pH 8.0 8.0
3.2 Plant Design 3.2.1 Plant Configuration The coal gasification plant investigated in this study is designed to provide the KNO plant with the following suite of required products:
• 282 MMSCFD of hydrogen at 400 psig and of suitable quality for ammonia production.
• Stoichiometric quantity of nitrogen (approximately 100 MMSCFD) at 400 psig and 99.99% purity.
• 1,500,000 lb/hr steam at 1500 psig and a minimum temperature of 825°F.
• 300,000 lb/hr steam at 600 psig and 625°F.
• 5,000 TPD CO2 suitable for urea production (25 psig)
• Electric power to satisfy the auxiliary power requirements for the gasification plant and the KNO facility, to make the entire facility electric power independent.
In addition to the products provided from the IGCC plant to the fertilizer plant, the fertilizer plant will return 1,200,000 lb/hr of high-pressure condensate at 1200 psig and 450°F to the IGCC facility.
3.2.2 Approach to Meeting the Design Goals Two alternative design configurations were assessed on a conceptual design basis to meet the KNO requirements:

80
• Process the syngas from the gasification plant to supply required hydrogen and nitrogen to the KNO ammonia synthesis loop compressor (Case 1).
• Process the syngas from the gasification plant to supply required hydrogen and nitrogen to the KNO ammonia synthesis loop compressor, but do not produce power from a gas turbine. Rather, independently produce the required steam for the KNO facility (Case 2).
Six gasification technologies were considered for this study, and the ConocoPhillips E-Gas technology was ultimately selected. The criteria considered included commercial status, ability to gasify the proposed feedstock, type of solid waste produced, oxygen/coal ratio, modular capacity of the gasifier, syngas composition, operating pressure and other byproduct potential. A comparison of the five technologies is provided in Table 3.6..
Table 3.6 Gasification Technology Selection Matrix
Gasifier - Comparison Property
Shell Gasifier
ConocoPhillips E-Gas Gasifier
GE Energy Gasifier
BGL Gasifier
KBR Transport Gasifier
Commercial Status High Moderate High Low None Ability to Gasify Beluga Mine Coal High Moderate Low High High
Type of Solid Waste Slag Slag Slag Slag Ash Oxygen/coal ratio Low Moderate High No Data No Data Modular Capacity of Gasifier, TPD 4,000 3,000 3,000 1,000 900
Maximum Operating Pressure ~500 psig ~600 psig ~1,000 psig ? ?
Other Byproducts None None None Tars Re-Injected None
Relative Cost /MMBtu Feed High Moderate Moderate High Moderate
The Shell gasification technology should be considered a primary option for processing the fuel available in the Kenai region of Alaska. Since the gasifier processes dry coal, the most significant burden on the plant is the coal drying system. Since the coal must be dried from 27% moisture to approximately 10%, the burden may be very costly given current coal drying technologies. Since Agrium is investigating use of a Shell gasifier for the service in question, it is excluded from Phase 1 of this study.
Since the GE gasifier is considered to be the least efficient and least experienced at processing low rank coals among the gasifiers that have been demonstrated at commercial scale, it is eliminated from consideration for this study.86 Current engineering work being performed by GE in conjunction with Bechtel may serve to improve the operating characteristics of the gasifier on low rank coals. As such, it may be worthwhile to pursue preliminary discussions with GE to gauge the status of the technology so that it may be considered in future efforts.
86 Coal Gasification Guidebook: Status, Applications and Technologies, 1993, EPRI TR-102034s

81
The BGL and KBR gasifiers were eliminated from consideration in this study due to lack of commercial operating experience. Commercial operating experience is an essential factor in projecting gasifier performance and cost.
Given its experience in processing low rank coals and the two-stage design of the gasifier that helps to improve efficiency of gasification, the ConocoPhillips E-Gas gasifier was chosen for further study in Phase 1 of this project.
3.3 Case 1 – Based on IGCC Concept 3.3.1 Plant Design The Agrium Kenai Nitrogen Operations (KNO) coal gasification plant is designed to meet the feedstock and power needs of the entire KNO facility. These were previously met by a combination of natural gas and utility-supplied power.
The KNO plant design is governed by the requirement to supply 282 MMSCFD of pure hydrogen to the KNO ammonia plant. In addition, the KNO facility requires 1.5 million lb/hr of high pressure steam and 5,000 TPD pure CO2 as feed for urea synthesis.
The KNO gasification plant is fueled with Alaskan sub-bituminous coal delivered by barge to the Agrium site. The coal is pulverized and mixed with water to make a slurry. The E-GAS™ two-stage coal gasification technology features an oxygen-blown, entrained flow, refractory lined gasifier with continuous slag removal. The coal/water slurry is injected into the gasifier with a split to the primary and secondary stages. The slurry reacts with oxygen in the primary stage at about 2500ºF while the slurry fraction injected into the second stage quenches the reaction with endothermic gasification reactions. The plant uses 11,700 tons per day of coal and requires four gasification trains. A turnkey, multi-train, dedicated air separation unit supplies oxygen of 95% purity to the gasifiers and pure nitrogen as feed to the ammonia synthesis process and combustion turbine fuel dilution.
Gas leaving each gasifier is cooled in a fire-tube syngas cooler, producing high-pressure steam. Particulate matter is removed from the cooled gas via a cyclone collector followed by a ceramic candle filter. The raw syngas is further cleaned in a spray scrubber to remove remaining particulate and trace components. At that point, the four gasifiers are manifolded together to provide a common syngas source. Steam is then added to the syngas before it enters the water gas shift reactor.
A series of three shifts with inter-cooled stages is required to convert a nominal 97% of the CO to CO2. Syngas leaving the final shift reactor is cooled through a series of gas coolers to about 100ºF. Before entering the acid gas removal process, the syngas goes through a mercury removal bed in which 90% to 95% of the mercury is removed from the syngas with activated carbon, and a portion of the syngas is recycled to the gasifier to promote second stage gasification reactions.
CO2, along with H2S, is removed from the cool, particulate-free gas stream with Selexol solvent. The purpose of the Selexol unit is to preferentially remove H2S as a product stream, leaving CO2 as a separate product stream. This is achieved in the so-called double-stage or double-absorber Selexol process. A pure CO2 stream is recovered from the Selexol process and compressed to 50 psia as feed to the urea synthesis process. The remaining CO2 is used as a diluent for gas turbine

82
fuel. The H2S stream recovered from the Selexol process is fed to a Claus plant to produce elemental sulfur.
Clean syngas leaving the Selexol absorber is used to produce hydrogen and as fuel for the General Electric 7FA combustion turbine. A stream of gas feeds a Pressure Swing Adsorption (PSA) process, which produces 282 MMSCFD of pure hydrogen. The hydrogen leaves the PSA at 395 psia. The off gas from the PSA is compressed and mixed with the fuel feed for the gas turbine. The GE 7FA produces 197 MWe. Hot flue gas from the gas turbine passes through a HRSG in which additional high-pressure steam is produced; the resulting steam produces 36 MWe from a steam turbine.
This Gasification plant design is based on the ConocoPhillips E-Gas technology selected based on Table 3-6.
Plant configuration summary: 1. E-Gas Gasifier
2. 95 mol% Oxygen produced by Cryogenic ASU.
3. Syngas Cooler and slag removal at gasifier outlet
4. Syngas scrubber for chlorides removal
5. Water Gas Shift/COS+HCN Hydrolysis Reactors
6. Mercury Removal (Activated carbon bed)
7. Dual stage Selexol acid gas removal
8. Recovered H2S converted to elemental sulfur
9. CO2 stream to urea synthesis
10. Pressure Swing Adsorption unit for Hydrogen separation and purification
11. GE 7FA Gas Turbine with Heat Recovery Steam Generator (HRSG)
Design redundancy: Configure syngas production from four gasifier trains operating at 80% capacity to approach 90% capacity factor.
Overall performance for the entire plant is summarized in Table 3-7, which includes auxiliary power requirements. The net plant output power, after plant auxiliary power requirements are deducted, is nominally 81 MWe87
. The overall plant thermal effective efficiency (thermal value of hydrogen and power produced) is 54.8%, on an HHV basis.
Figure 3-1 is a block flow diagram for the plant, and is accompanied by Table 3-8, which includes detailed process stream composition and state points.
87 Note that due to the potential sale price for power at various levels, the economic analyses assumed 70 MW of power available for sale to the grid.
83
Table 3.7 Case 1 Plant Performance Summary E-GasTM Gasifier, H/P ASU, GE 7FA G/T
Plant Output Gas Turbine Power 197,000 kWe Steam Turbine Power 35,940 kWe Total 232,940 kWe
Hydrogen Production Hydrogen Product 62,409 lb/hr Hydrogen Production 282 MMscfd
Auxiliary Load4
Coal Handling 180 kWe Coal Milling 4,550 Coal Slurry Pumps 1,090 Slag Handling and Dewatering 2,330 Air Separation Unit Auxiliaries 1,000 Air Separation Unit Main Air Compressor 85,190 kWe Oxygen Compressor 12,570 kWe Nitrogen Compressor 10,000 kWe CO2 Diluent Boost Compressor 1,010 kWe Urea CO2 Compressor 2,000 kWe Syngas Recycle Blower 3,600 kWe Syngas Boost Compressor 6,840 kWe Boiler Feedwater Pumps 270 kWe Condensate Pump 6,410 kWe Circulating Water Pump 1,120 kWe Cooling Tower Fans 250 kWe Selexol Unit Auxiliaries 8,500 kWe Claus Plant Auxiliaries 500 kWe Gas Turbine Auxiliaries 620 kWe Miscellaneous Balance-of-Plant 3,000 kWe Transformer Losses 680 kWe Total 151,710 kWe
Plant Performance Net Auxiliary Load 151,710 kWe Net Plant Power 81,230 kWe Net Plant Power Efficiency (HHV) 3.7% Net Plant Power Heat Rate (HHV) 91,841 Btu/kWh Effective Thermal Efficiency1 54.8% Coal Feed Flowrate 974,953 lb/hr Thermal Input2 2,185,839 kWt Nitrogen Production 94 MMscfd CO2 Production (to urea plant) 2,500 tons/day Steam Production (1500 psig saturated) 1,500,000 lb/hr Elemental Sulfur Production3 19 tons/day Condenser Duty 270.2 MMBtu/hr
1 – Efficiency calculation includes thermal value of hydrogen and power produced only. 2 – HHV of As-Fed Chuitna 27% Moisture Coal is 7,650 Btu/lb. 3 – Predicted based on 99.5% Sulfur Recovery in Claus Unit w/o ST impacts. 4 - 12,000 kW KNO Plant requirement included in Economic Analysis
84
Figure 3-1 Case 1 Process Block Flow Diagram E-Gas™ Gasifier-Based Hydrogen Production Plant
ELEVATED PRESSURE
ASU
E-GASTM
GASIFIER
CYCLONES&
FILTERS
SYNGASSCRUBBER
SHIFT REACTOR
GAS COOKINGBFW HEATING &
KNOCKOUT
SOUR WATER
STRIPPER
MERCURY REMOVAL SELEXOL UNIT
GAS TURBINE COMBUSTOR
HRSG
CLAUSPLANT
PRESSURE SWING
ADSORBER
1
ASUMAIN AIR
COMPRESSOR
5
2
19
AMBIENT AIR21
STACKGAS
FLUEGAS
4
3GASIFIEROXIDANT
NITROGENDILUENT
SYNGAS BOOST
COMPRESSOR
SYNGASRECYCLE
COMPRESSOR
8
SHIFTSTEAM
9
WATER FROMSYNGAS SCRUBBER
& ACID GASCOMPRESSORINTERCOOLERS
10
12WATER TOTREATMENT
TURBINE COOLING AIR
SOUR GAS11
SULFUR
22
15
CO2 TO UREA PLANT
CO2 COMPRESSOR
13 14
16
17
N2 TOAMMONIA
PLANT
H2 TOAMMONIA
PLANT
18
20
NOTE: ALL SYNGAS & DILUENT STREAMS PREHEATED TO 530OF
GE 7FAGAS TURBINEVENT GAS
NITROGENCOMPRESSOR
AIR TO ASU
NOTE O2COMPRESSORMODELED BUT
NOT SHOWN
SYNGAS
CLEAN GAS
CO2 VENT GAS
6
COAL SLURRY
7
SLAG
85
Table 3.8 Case 1 Process Stream Compositions and State Points 1 2 3 4 5 6A 7 8 9 10 11
V-L Mole Fraction Ar 0.0093 0.0046 0.0000 0.0000 0.0320 0.0000 0.0000 0.0000 0.0051 0.0000 0.0003CH4 0.0000 0.0000 0.0000 0.0000 0.0000 0.0000 0.0000 0.0000 0.0127 0.0000 0.0017CO 0.0000 0.0000 0.0000 0.0000 0.0000 0.0000 0.0000 0.0000 0.0049 0.0000 0.0003CO2 0.0003 0.0006 0.0000 0.0000 0.0000 0.0000 0.0000 0.0000 0.3402 0.0053 0.4170COS 0.0000 0.0000 0.0000 0.0000 0.0000 0.0000 0.0000 0.0000 0.0000 0.0000 0.0000H2 0.0000 0.0000 0.0000 0.0000 0.0000 0.0000 0.0000 0.0000 0.4233 0.0000 0.0010H2O 0.0032 0.0054 0.0000 0.0000 0.0000 1.0000 0.0000 1.0000 0.2041 0.9856 0.0000H2S 0.0000 0.0000 0.0000 0.0000 0.0000 0.0000 0.0000 0.0000 0.0005 0.0000 0.0024N2 0.7784 0.9690 1.0000 1.0000 0.0180 0.0000 0.0000 0.0000 0.0074 0.0000 0.0002NH3 0.0000 0.0000 0.0000 0.0000 0.0000 0.0000 0.0000 0.0000 0.0019 0.0090 0.5770O2 0.2088 0.0205 0.0000 0.0000 0.9500 0.0000 0.0000 0.0000 0.0000 0.0000 0.0000SO2 0.0000 0.0000 0.0000 0.0000 0.0000 0.0000 0.0000 0.0000 0.0000 0.0000 0.0000
Total 1.0000 1.0000 1.0000 1.0000 1.0000 1.0000 0.0000 1.0000 1.0000 1.0000 1.0000
V-L Flowrate (lbmol/hr) 76,573 45,641 10,322 4,771 15,838 27,477 0 34,306 123,935 25,449 399V-L Flowrate (lb/hr) 2,215,230 1,282,730 289,164 133,647 509,688 494,584 0 618,040 2,516,020 461,768 11,310V-L Flowrate (MMscfd) 697.3 415.6 94.0 43.4 144.2 --- --- 312.8 1,130.1 4.6 3.6Solids Flowrate (lb/hr) 0 0 0 0 0 711,718 102,314 0 0 0 0
Temperature (°F) 184 77 246 246 192 300 300 500 436 144 186Pressure (psia) 190.0 16.4 415.0 415.0 785.0 600.0 500.0 530.0 469.7 422.0 28.0Enthalpy (Btu/lb) 53.7 15.4 53.3 53.3 34.6 --- --- 1,288.9 357.6 107.8 48.0HHV (Btu/lb) 0.0 0.0 0.0 0.0 0.0 0.0 0.0 0.0 2,857.6 82.8 3,403.9Total Energy (Btu/lb) 53.7 15.4 53.3 53.3 34.6 0.0 0.0 1,288.9 3,215.2 190.6 3,451.9Density (lb/ft3) 0.795 0.080 1.534 1.534 3.613 --- --- 0.927 0.992 59.586 0.114Molecular Weight 28.930 28.105 28.013 28.013 32.181 --- --- 18.015 20.301 18.145 28.318
A - Solids flowrate includes dry coal; V-L flowrate includes slurry water and water from coal

86
Table 3.8 (Continued) Case 1 Process Stream Compositions and State Points
12 13 14 15 16 17 18 19 20 21 22V-L Mole Fraction
Ar 0.0000 0.0064 0.0064 0.0000 0.0109 0.0000 0.0511 0.0093 0.0108 0.0108 0.0000CH4 0.0000 0.0159 0.0159 0.0002 0.0262 0.0000 0.1227 0.0000 0.0000 0.0000 0.0000CO 0.0000 0.0062 0.0062 0.0000 0.0104 0.0000 0.0488 0.0000 0.0000 0.0000 0.0000CO2 0.0000 0.4268 0.4268 0.9955 0.0268 0.0000 0.1254 0.0003 0.1466 0.1466 0.0000COS 0.0000 0.0000 0.0000 0.0000 0.0000 0.0000 0.0000 0.0000 0.0000 0.0000 0.0000H2 0.0000 0.5327 0.5327 0.0004 0.9250 1.0000 0.6490 0.0000 0.0000 0.0000 0.0000H2O 1.0000 0.0021 0.0021 0.0038 0.0001 0.0000 0.0005 0.0032 0.0984 0.0984 0.0000H2S 0.0000 0.0006 0.0006 0.0000 0.0000 0.0000 0.0000 0.0000 0.0000 0.0000 0.0000N2 0.0000 0.0093 0.0093 0.0000 0.0005 0.0000 0.0025 0.7784 0.6410 0.6410 0.0000NH3 0.0000 0.0000 0.0000 0.0000 0.0000 0.0000 0.0000 0.0000 0.0000 0.0000 0.0000O2 0.0000 0.0000 0.0000 0.0000 0.0000 0.0000 0.0000 0.2088 0.1033 0.1033 0.0000SO2 0.0000 0.0000 0.0000 0.0000 0.0000 0.0000 0.0000 0.0000 0.0000 0.0000 0.0000
Total 1.0000 1.0000 1.0000 1.0000 1.0000 1.0000 1.0000 1.0000 1.0000 1.0000 0.0000
V-L Flowrate (lbmol/hr) 32,430 98,485 78,788 9,494 43,899 30,957 8,995 112,010 140,866 140,866 0V-L Flowrate (lb/hr) 584,241 2,054,250 1,643,400 416,674 184,838 62,405 118,465 3,240,420 3,933,350 3,933,350 0V-L Flowrate (MMscfd) 0.4 897.8 718.3 42.5 406.4 281.9 76.6 999.9 1,291.7 1,291.4 0.0Solids Flowrate (lb/hr) 0 0 0 0 0 0 0 0 0 0 2,925
Temperature (°F) 186 103 103 105 95 96 96 34 1,025 250 344Pressure (psia) 28.0 422.0 412.0 49.9 415.0 410.0 60.0 14.7 14.8 14.8 23.6Enthalpy (Btu/lb) 155.4 28.1 28.1 15.1 105.9 217.9 38.4 2.6 324.5 111.5 21.9HHV (Btu/lb) 0.0 3,481.4 3,481.4 3.1 29,744.9 61,098.6 10,818.2 0.0 0.0 0.0 ---Total Energy (Btu/lb) 155.4 3,509.6 3,509.6 18.2 29,850.9 61,316.6 10,856.6 2.6 324.5 111.5 21.9Density (lb/ft3) 58.239 1.458 1.424 0.367 0.289 0.139 0.124 0.080 0.028 0.058 ---Molecular Weight 18.015 20.858 20.858 43.887 4.211 2.016 12.282 28.930 29.915 29.915 ---

87
3.3.2 Process Description The following paragraphs describe the process sections in more detail.
3.3.2.1 Coal Handling System
The function of the coal handling system is to unload, convey, prepare, and store the coal delivered to the plant. The scope of the system is from the barge unloading and coal receiving hoppers up to and including the slide gate valves on the outlet of the coal storage silos.
The Chuitna sub-bituminous coal is delivered to the site by 5,000 ton self-unloading barges to the KNO dock. The unloading will be done into two receiving hoppers. Coal from each hopper is fed directly into a vibratory feeder. The 15 cm x 0 (6 in x 0) coal from the feeder is discharged onto a belt conveyor. The coal is then transferred to another conveyor that passes under a magnetic plate separator to remove tramp iron and then to the reclaim pile.
A rubber-tired front-end loader directs coal into six vibratory feeders located in the reclaim hopper located under the pile. The feeders deliver the coal onto a belt conveyor (No. 3), which transfers the coal to the coal surge bin located in the crusher tower. The coal is reduced in size to 7.6 cm x 0 (3" x 0) by the first of two crushers. The coal then enters the second crusher, which reduces the coal size to 2.5 cm x 0 (1¼" x 0). Conveyor No. 4 then transfers the coal to the transfer tower. In the transfer tower the coal is routed to the tripper, which loads the coal into one of the six silos. Two sampling systems are supplied – an as-received sampling system and an as-fired sampling system. Data from the analysis of these samples are used to support the reliable and efficient operation of the plant.
3.3.2.2 Coal Grinding and Slurry Preparation
Coal is fed onto a conveyor by vibratory feeders located below each coal silo. The conveyor feeds the coal to an inclined conveyor that delivers the coal to the rod mill feed hopper. The feed hopper provides a surge capacity of about two hours and contains two hopper outlets. A vibrating feeder on each hopper outlet supplies the weigh feeder, which in turn feeds a rod mill. Two rod mills each process 60% of the coal feed requirements for each gasifier. The rod mill grinds the coal and wets it with treated slurry water transferred from the slurry water tank by the slurry water pumps. The coal slurry is then discharged into the rod mill product tank. The slurry is then pumped from the rod mill product tank to the slurry storage and slurry blending tanks.
The coal grinding system is equipped with a dust suppression system consisting of water sprays aided by a wetting agent. The degree of dust suppression required will depend on local environmental regulations. All of the tanks are equipped with vertical agitators to keep the coal slurry solids suspended.
The equipment in the coal grinding and slurry preparation system is fabricated of materials appropriate for the abrasive environment present in the system. The tanks and agitators are rubber lined. The pumps are either rubber lined or hardened metal to minimize erosion. Piping is fabricated of high-density polyethylene (HDPE).
3.3.2.3 Gasification
The E-GAS™ two-stage coal gasification technology features an oxygen-blown, entrained flow, refractory lined gasifier with continuous slag removal. A 59 wt% dry coal/water slurry is injected into the gasifier at a 78:22 split ratio to the primary and secondary stages. The slurry

88
reacts with oxygen in the primary stage at about 2,500ºF and 500 psia. The coal undergoes partial combustion, releasing heat that causes the gasification reactions to proceed very rapidly and the ash to fuse and flow. A turnkey, dedicated air separation unit supplies oxygen at 95% purity.
The primary gasification zone operates above the ash fusion temperature, thereby ensuring the flow and removal of molten slag. This temperature is maintained by a controlled oxygen feed. All of the oxygen is used in the first stage in exothermic partial oxidation/gasification reactions. The molten ash exits through a tap hole at the bottom of the primary stage into a water quench, forming an inert vitreous slag. The molten slag is quenched in water and removed in a novel continuous-pressure letdown/dewatering system. Gaseous products from the primary zone flow upward into the second gasification zone, a vertical refractory-lined vessel.
The remaining 22% of preheated slurry is injected in the secondary zone of the gasifier to achieve a full slurry quench – only the slurry is used to quench the gas coming up from the first stage and no gas recycle is used to aid the quench. A fraction of the raw fuel gas stream is recycled to promote quenching.
The second gasification stage provides both heating value enhancement and raw syngas cooling. Hot gaseous products from the primary zone provide the thermal energy required to heat and gasify the atomized slurry. These gasification reactions are endothermic and considerably decrease the sensible heat content of the primary zone gases, resulting in quench of the gasification reactions. As a result, the exit temperature of the secondary zone, around 1,900ºF, is much lower than that of the primary zone.
Char produced in the secondary gasification zone leaves the gasifier entrained in the fuel gas stream. The combined downstream cyclone and candle filter particulate control devices remove the char from the fuel gas stream for return to the gasifier first stage.
3.3.2.4 Raw Gas Cooling
Hot raw gas from the secondary gasification zone exits the gasifier at 1,900ºF. This gas stream is cooled to approximately 1,000ºF in a fire-tube boiler. The waste heat from this cooling is used to generate high-pressure steam. Boiler feedwater in the tube walls is saturated, and then steam and water are separated in a steam drum. Approximately 548,000 lb/hr of saturated steam at 1,800 psia is produced. This steam then forms part of the general heat recovery system that provides high pressure steam to meet KNO needs. The raw syngas is cooled further to 670ºF in heating the fuel gas saturation water.
3.3.2.5 Particulate Removal
A cyclone and a ceramic candle filter in series are used to remove any particulate material exiting the secondary gasification zone. This material, char and fly ash, is recycled back to the gasifier. The filter is comprised of an array of ceramic candle elements in a pressure vessel. The filter is cleaned by periodically back pulsing it with fuel gas to remove the fines material. Raw gas exits the candle filter at 665ºF and 455 psia. Below 1,000°F, a large portion of the alkali and volatile metals will condense on particulates and will be captured by the filter element itself.
3.3.2.6 Gas Scrubbing
The “sour” gas leaving the particulate filter system consists mostly of hydrogen, CO2, CO, water vapor, nitrogen, and smaller quantities of methane, carbonyl sulfide (COS), H2S, and NH3.

89
The cooled syngas at 330°F enters the scrubber for particulate removal. The quench scrubber washes the syngas in a counter-current flow in two packed beds. After leaving the scrubber, the gas has a residual soot content of less than 1 mg/m3, and is mixed with 500 psia steam to reach a temperature of about 372ºF, suitable for feeding to the water gas shift reactor. The quench scrubber removes traces of entrained particles, principally unconverted carbon, slag, and metals. The quench scrubber also removes soluble trace contaminants such as NH3, HCN and halide compounds. The bottoms from the scrubber are sent to the slag removal and handling system for processing. Sour water from the scrubber is stripped of sour gas and treated for recycle or discharge.
3.3.2.7 CO Shift
After leaving the particulate control unit, steam is injected into the gas stream to initiate the CO shift process. The shift converter uses a sulfur-tolerant shift catalyst to convert the steam and CO in the syngas into hydrogen and CO2. The shift catalyst also promotes the COS hydrolysis reaction. Heat is removed from the gas stream following the shift, the gases are cooled, sour water is condensed, and the gas stream is sent to the sulfur removal unit. A set of three high-temperature shift reactors is used to shift the bulk of the CO in the fuel gas to CO2. Heat exchange between reaction stages helps maintain a moderate reaction temperature. The shift catalyst also promotes COS and HCN hydrolysis. The three-staged shift approach maximizes CO conversion while maintaining reasonable reactor volumes.
The CO shift converter consists of four fixed-bed reactors with two reactors in series and two in parallel. The two reactors in series, with cooling between the two, are required to control the exothermic temperature rise. The two reactors in parallel are required due to accommodate the high gas mass flow rate. Feed to the shift converter is first preheated by hot effluent from the second converter, heated by hot effluent from the first converter, and fed to the top of the two first-stage converters in parallel. Effluent from the first stage is cooled and fed to the top of the second-stage converters. Effluent from the second stage is cooled by exchanging heat with incoming feed, by an air cooler and finally by a water cooler.
The shifted raw gas temperature exiting the third shift converter is approximately 236°C (456°F). This stream is cooled to 178°C (353°F) in a low-temperature economizer. The fuel gas stream is cooled in a series of low-temperature economizers and then routed to the Selexol unit. Fuel gas condensate is recovered and routed to a sour drum.
3.3.2.8 Sour Gas Stripper
The sour gas stripper removes NH3, H2S, and other impurities from the scrubber waste stream. The sour gas stripper consists of a sour drum that accumulates sour water from the gas scrubber and condensate from syngas coolers. Sour water from the drum flows to the sour stripper, which consists of a packed column with a steam-heated reboiler. Sour gas is stripped from the liquid and sent to the KNO facility for incineration. Remaining water is sent to wastewater treatment.
3.3.2.9 Mercury Removal
Mercury removal at the plant is based on packed beds of sulfur-impregnated carbon similar to what has been used at Eastman Chemical’s gasification plant. Dual beds of sulfur-impregnated carbon with approximately a 20-second superficial gas residence time should achieve 95% mercury reduction in addition to removal of other volatile heavy metals such as arsenic.
90
3.3.2.10 Acid Gas Removal
In this plant configuration, H2S and CO2 are removed within the same process system, the Selexol unit. The purpose of the Selexol unit is to preferentially remove H2S as a product stream and then to remove CO2 as a separate product stream. This is achieved in the double-stage Selexol unit.
Cool, dry, and particulate-free synthesis gas enters the first absorber unit at approximately 400 psia and 100°F. In this absorber, H2S is preferentially removed from the fuel gas stream by “loading” the lean Selexol solvent with CO2. The solvent, saturated with CO2, preferentially removes H2S. The rich solution leaving the bottom of the absorber is regenerated in a stripper through the indirect application of thermal energy via condensing low-pressure steam in a reboiler. The stripper acid gas stream, consisting of 43% H2S and 37% CO2, is sent to the Claus plant.
Sweet fuel gas flowing from the first absorber is cooled and routed to the second absorber unit. In this absorber, the fuel gas is contacted with “unloaded” lean solvent. The solvent removes 95% of the CO2 remaining in the fuel gas stream. A CO2 balance is maintained by hydraulically expanding the CO2-saturated rich solution and then flashing CO2 vapor off the liquid at reduced pressure. Sweet fuel gas off the second absorber is sent to the PSA and the burner of the combustion turbine.
3.3.2.11 Sulfur Recovery
Acid gas from the first-stage absorber of the Selexol unit is sent to the Claus plant. The Claus plant partially oxidizes the H2S in the acid gas to elemental sulfur. Approximately 20 tons per day of elemental sulfur is recovered from the fuel gas stream. This value represents an overall sulfur recovery efficiency of 99.8%.
Acid gas from the Selexol unit and recycled tail gas treatment unit are preheated to 232°C (450°F). A portion of the acid gas along with all of the sour gas and oxidant are fed to the Claus furnace. In the furnace, one-third of the H2S is catalytically oxidized to SO2. A furnace temperature greater than 1,343°C (2,450°F) must be maintained in order to thermally decompose all of the NH3 present in the sour gas stream. The SO2 reacts with the remaining H2S to form sulfur and water vapor. Three preheaters and three sulfur converters are used to obtain a per-pass H2S conversion of approximately 97.8%.
3.3.2.12 CO2 Compression
CO2 is flashed from the rich solution at two pressures. The bulk of the CO2 is flashed off at approximately 50 psia while the remainder is flashed off at atmospheric pressure. The second low-pressure CO2 stream is “boosted” to 50 psia and then combined with the first CO2 stream. A separate pure CO2 stream of 5,000 TPD is sent to the KNO urea synthesis process as feedstock. The remaining CO2 is either vented to the atmosphere or, if necessary, can be used as a gas turbine diluent.
3.3.2.13 Hydrogen Purification
A portion of the clean syngas stream leaving the Selexol absorber is sent to a PSA unit to separate and purify the hydrogen. The product hydrogen leaves the PSA unit at 395 psia, and the PSA tail gas is compressed and mixed with the fuel gas for the gas turbine.

91
Treated gas from the Selexol absorber is fed directly to the PSA unit where hydrogen is purified to approximately 99.9%. Carbon oxides are limited to 10 ppm in the final hydrogen product. The PSA process is based on the principle of adsorbent beds adsorbing more impurities at high gas-phase partial pressure than at low partial pressure.
The gas stream is passed through adsorbent beds at 415 psia, and then the impurities are purged from the beds at 60 psia. The PSA process operates on a cyclic basis and is controlled by automatic switching valves. Multiple beds are used in order to provide constant product and purge gas flows.
3.3.2.14 Gas Turbine Generator
The gas turbine generator selected for this application is the same General Electric MS 7FA model turbine chosen for the Wabash River IGCC Demonstration Project. There are more than 140 GE 7FA and GE 9FA units ordered or in operation. This machine is an axial flow, single spool, constant speed unit, with variable inlet guide vanes. The machine is designed for maximum reliability and efficiency with low maintenance. The turbine includes advanced bucket cooling techniques, compressor aerodynamic design and advanced alloys, enabling a higher firing temperature than previous generation machines. The standard production version of this machine, fired with natural gas, will develop a compressor pressure ratio of 15.2:1 and a rotor inlet temperature of almost 2350°F.
In this service, with syngas from an IGCC plant, the machine requires some modifications to the burner and turbine nozzles in order to properly combust the medium-Btu gas and expand the combustion products in the turbine section of the machine. A reduction in rotor inlet temperature of about 50°F is expected, relative to a production model 7FA machine firing natural gas. This temperature reduction is necessary to not exceed design basis gas path temperatures throughout the expander. If the first-stage rotor inlet temperature were maintained at the design value, gas path temperatures downstream of the inlet to the first (HP) turbine stage may increase, relative to natural gas-fired temperatures, due to gas property changes.
The modifications to the machine may include some redesign of the original can-annular combustors. A second potential modification involves increasing the nozzle areas of the turbine to accommodate the mass and volume flow of medium-Btu fuel gas combustion products, which are increased relative to those produced when firing natural gas. Other modifications include rearranging the various auxiliary skids that support the machine to accommodate the spatial requirements of the plant general arrangement. The generator is a standard hydrogen-cooled machine with static exciter.
3.3.2.15 Steam Generation
Fire-Tube Syngas Cooler – The fire-tube boiler for each gasifier is a shell and tube design, with an overall duty rating of 150 million Btu/hour. The boiler cools the syngas from 1900 to 700°F and produces steam at main steam pressure, saturated conditions of 1754 psia, 617° F. This steam is conveyed to the HRSG, where it is superheated.
Heat Recovery Steam Generator (HRSG) – The HRSG is a horizontal gas flow, drum-type, multi-pressure design that is matched to the characteristics of the gas turbine exhaust gas when firing medium-Btu gas. The HP drum produces steam at main steam pressure, while the IP drum produces steam for export to the cold reheat. The HRSG drum pressures are nominally 1614/362 psia for the HP/IP turbine sections, respectively.
92
Natural circulation of steam is accomplished in the HRSG by utilizing differences in densities due to temperature differences of the steam. The natural circulation HRSG provides the most cost-effective and reliable design.
The HRSG drums include moisture separators, internal baffles, and piping for feedwater/steam. Also included with the drum is a visual sight glass to monitor drum water level. All tubes, including the economizers, superheaters, and all headers and drums are equipped with drains. Safety relief valves are furnished in order to comply with appropriate codes and ensure a safe work place.
Superheater, boiler, and economizer sections are supported by shop-assembled structural steel. Inlet and outlet duct is provided to route the gases from the gas turbine outlet to the HRSG inlet and the HRSG outlet to the stack. A diverter valve is included in the inlet duct to bypass the gas when appropriate. Suitable expansion joints are also included.
3.3.2.16 Air Separation Plant
The air separation plant is designed to produce a nominal output of 6,000 tons/day of 95% pure O2 from two trains. The air compressor is powered by an electric motor. Approximately 10,000 tons/day of nitrogen are also recovered, compressed, and used as dilution in the gas turbine combustor and as feedstock for the ammonia synthesis process.
The air feed to the air separation unit is supplied from a stand-alone air compressor. The filtered air is then compressed in the centrifugal compressor, with intercooling between each stage. The air stream is cooled and then fed to an adsorbent-based pre-purifier system. The adsorbent removes water carbon dioxide, and C4+ saturated hydrocarbons in the air. After passing through the adsorption beds, the air is filtered to remove any adsorbent fines that may be present. Regeneration of the adsorbent in the pre-purifiers is accomplished by passing a hot nitrogen stream through the off-stream bed(s) countercurrent to the normal airflow.
The air from the pre-purifier is then split into three streams. About 70% of the air is fed directly to the cold box. About 25 to 30% of the air is compressed in an air booster compressor. This boosted air is then cooled in an aftercooler against cooling water before it is fed to the cold box. About 5% of the air is fed to a turbine driven, single stage, centrifugal booster compressor. This stream is cooled in a shell and tube aftercooler against cooling water before it is fed to the cold box.
All three air feeds are cooled in the cold box to cryogenic temperatures against returning product oxygen and nitrogen streams in plate-and-fin heat exchangers. The large air stream is fed directly to the first distillation column to begin the separation process. The second air stream is liquefied against boiling liquid oxygen before it is fed to the distillation columns. The third, small air stream is fed to the cryogenic expander to produce refrigeration to sustain the cryogenic separation process. The work produced from the expansion is used to power the turbine booster compressor.
Inside the cold box the air is separated into oxygen and nitrogen products. The oxygen product is withdrawn from the distillation columns as a liquid and is pressurized in a cryogenic pump. The pressurized liquid oxygen is then vaporized against the high-pressure air feed before being warmed to ambient temperature. The gaseous oxygen exits the cold box and is split into two streams. Essentially all of the gaseous oxygen is fed to the centrifugal compressor with

93
intercooling between each stage of compression. The compressed oxygen is then fed to the gasification unit.
Nitrogen is produced from the cold box at two pressure levels. Low-pressure nitrogen is split into two streams. A small portion of the nitrogen is used as the regeneration gas for the pre-purifiers and is vented to the atmosphere. The remaining nitrogen is compressed and split as feed to the KNO ammonia process and as gas turbine diluent nitrogen.
3.3.2.17 Flare Stack
A self-supporting, refractory-lined, carbon steel flare stack is provided to combust and dispose of product gas during startup, shutdown, and upset conditions. The flare stack is provided with multiple pilot burners, fueled by natural gas or propane, with pilot home monitoring instrumentation.
3.4 Case 2- Hydrogen and CO2 Production Without Sequestration or Power Production
3.4.1 Plant Design The Agrium Kenai Nitrogen Operations (KNO) coal gasification plant is designed to meet the feedstock and power needs of the entire KNO facility. The KNO plant design is governed by the requirement to supply 282 MMSCFD of pure hydrogen to the KNO ammonia plant. In addition, the KNO facility requires 1.5 million lb/hr of high pressure steam and 5,000 TPD pure CO2 as feed for urea synthesis.
The KNO gasification plant is fueled with Alaskan sub-bituminous coal delivered by barge to the Agrium site. The coal is pulverized and mixed with water to make a slurry. The plant is based on the ConocoPhillips E-GAS™ gasification technology which readily meets the syngas requirements to produce the required plant products. The E-GAS™ two-stage coal gasification technology features an oxygen-blown, entrained flow, refractory lined gasifier with continuous slag removal. The plant uses 12,500 tons per day of coal and requires four gasification trains and a CFB boiler. A turnkey, multi-train, dedicated air separation unit supplies oxygen of 95 percent purity to the gasifiers and pure nitrogen as feed to the ammonia synthesis process.
Gas leaving each gasifier is cooled in a fire-tube syngas cooler, producing high-pressure steam. Particulate matter is removed via a cyclone collector followed by a ceramic candle filter. The raw syngas is further cleaned in a spray scrubber to remove remaining particulate and trace components. At that point, the four gasifiers are manifolded together to provide a common syngas source. Steam is then added to the syngas before it enters the water gas shift reactor.
A series of three shifts with inter-cooled stages is required to convert a nominal 97% of the CO to CO2. Syngas leaving the final shift reactor is cooled through a series of gas coolers to about 100ºF. Before entering the acid gas removal process, the syngas goes through a mercury removal bed in which 90 to 95% of the mercury is removed from the syngas with activated carbon, and a portion of the syngas is recycled to the gasifier to promote second stage gasification reactions.
CO2, along with H2S, is removed from the cool, particulate-free gas stream with Selexol solvent. The purpose of the Selexol unit is to preferentially remove H2S as a product stream, leaving CO2
94
as a separate product stream. This is achieved in the so-called double-stage or double-absorber Selexol process. A pure CO2 stream is recovered from the Selexol process and compressed to 50 psia as feed to the urea synthesis process. The H2S stream recovered from the Selexol process is fed to a Claus plant to produce elemental sulfur.
Clean syngas leaving the Selexol absorber feeds a Pressure Swing Adsorption (PSA) process, which produces 282 MMSCFD of pure hydrogen. The hydrogen leaves the PSA at 395 psia. The off gas from the PSA is expanded to 20 psia and mixed with the fuel feed for the CFB boiler. The overall plant produces sufficient steam and steam-based power to meet the KNO facility needs.
Case 2 is identical to Case 1, except:
In this plant design, rather than having a gas turbine, off-gas from the PSA will be fired with coal in a supplemental CFB boiler to produce high pressure steam for KNO use.
Plant configuration summary: 1. E-Gas Gasifier
2. 95 mol% Oxygen produced by Cryogenic ASU.
3. Syngas Cooler and slag removal at gasifier outlet
4. Syngas scrubber for chlorides removal
5. Water Gas Shift/COS+HCN Hydrolysis Reactors
6. Mercury Removal (Activated carbon bed)
7. Dual stage Selexol acid gas removal
8. Recovered H2S converted to elemental sulfur
9. CO2 stream to KNO urea synthesis
10. Pressure Swing Adsorption unit for Hydrogen separation and purification
11. CFB Boiler for supplemental steam production
Design redundancy: Estimate four syngas production gasifier trains operating at 80% capacity to approach 90% capacity factor.
Overall performance for the entire plant is summarized in Table 3-9, which includes auxiliary power requirements. After plant auxiliary power requirements are deducted, net plant output is nominally 12 MWe. The overall plant thermal effective efficiency (thermal value of hydrogen and power produced) is 48.4%, on an HHV basis.
Figure 3-2 is a block flow diagram for the plant, and is accompanied by Table 3-10, which includes detailed process stream composition and state points.
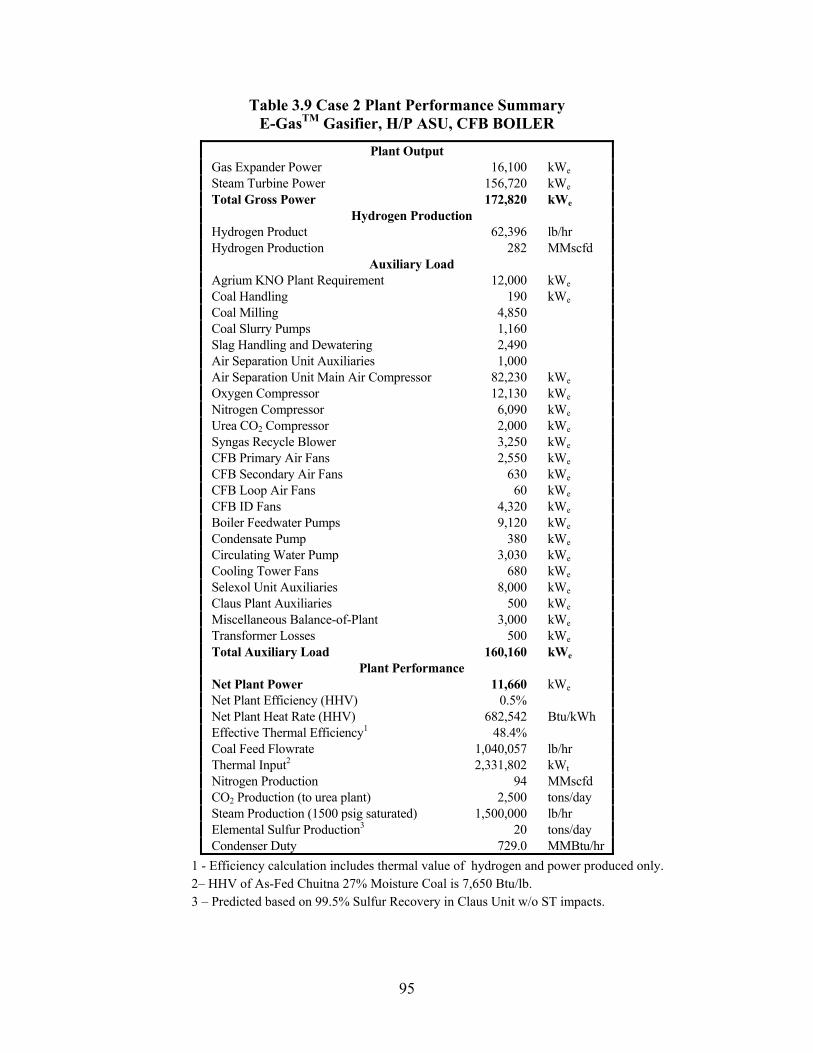
95
Table 3.9 Case 2 Plant Performance Summary E-GasTM Gasifier, H/P ASU, CFB BOILER
Plant Output Gas Expander Power 16,100 kWe Steam Turbine Power 156,720 kWe Total Gross Power 172,820 kWe
Hydrogen Production Hydrogen Product 62,396 lb/hr Hydrogen Production 282 MMscfd
Auxiliary Load Agrium KNO Plant Requirement 12,000 kWe Coal Handling 190 kWe Coal Milling 4,850 Coal Slurry Pumps 1,160 Slag Handling and Dewatering 2,490 Air Separation Unit Auxiliaries 1,000 Air Separation Unit Main Air Compressor 82,230 kWe Oxygen Compressor 12,130 kWe Nitrogen Compressor 6,090 kWe Urea CO2 Compressor 2,000 kWe Syngas Recycle Blower 3,250 kWe CFB Primary Air Fans 2,550 kWe CFB Secondary Air Fans 630 kWe CFB Loop Air Fans 60 kWe CFB ID Fans 4,320 kWe Boiler Feedwater Pumps 9,120 kWe Condensate Pump 380 kWe Circulating Water Pump 3,030 kWe Cooling Tower Fans 680 kWe Selexol Unit Auxiliaries 8,000 kWe Claus Plant Auxiliaries 500 kWe Miscellaneous Balance-of-Plant 3,000 kWe Transformer Losses 500 kWe Total Auxiliary Load 160,160 kWe
Plant Performance Net Plant Power 11,660 kWe Net Plant Efficiency (HHV) 0.5% Net Plant Heat Rate (HHV) 682,542 Btu/kWh Effective Thermal Efficiency1 48.4% Coal Feed Flowrate 1,040,057 lb/hr Thermal Input2 2,331,802 kWt Nitrogen Production 94 MMscfd CO2 Production (to urea plant) 2,500 tons/day Steam Production (1500 psig saturated) 1,500,000 lb/hr Elemental Sulfur Production3 20 tons/day Condenser Duty 729.0 MMBtu/hr
1 - Efficiency calculation includes thermal value of hydrogen and power produced only. 2– HHV of As-Fed Chuitna 27% Moisture Coal is 7,650 Btu/lb. 3 – Predicted based on 99.5% Sulfur Recovery in Claus Unit w/o ST impacts.

96
Figure 3-2 Case 2 Process Block Flow Diagram E-Gas™ Gasifier-Based Hydrogen Production Plant
ELEVATED PRESSURE
ASU
E-GASTM
GASIFIER
CYCLONES&
FILTERS
SYNGASSCRUBBER
SHIFT REACTOR
GAS COOKINGBFW HEATING &
KNOCKOUT
SOUR WATER
STRIPPER
MERCURY REMOVAL SELEXOL UNIT
BAGHOUSE
CLAUSPLANT
PRESSURE SWING
ADSORBER
1
ASUMAIN AIR
COMPRESSOR
5
4
2
COAL SLURRY
18AMBIENT AIR
22
STACKGAS
FLUEGAS
3
GASIFIEROXIDANT
6
SLAG
SYNGAS EXPANDER
SYNGASRECYCLE
COMPRESSOR
7
SHIFTSTEAM
8
WATER FROMSYNGAS SCRUBBER
& ACID GASCOMPRESSORINTERCOOLERS
9
11WATER TOTREATMENT
SOUR GAS10
SULFUR
23
14
CO2 TO UREA PLANT
CO2 COMPRESSOR
12 13
15
16
N2 TOAMMONIA
PLANT
H2 TOAMMONIA
PLANT
17
21
VENT GAS
NITROGENCOMPRESSOR
AIR TO ASU
NOTE O2COMPRESSORMODELED BUT
NOT SHOWN
SYNGAS
CLEAN GAS
CO2 VENT GAS
CIRCULATINGFLUIDIZED BED
BOILER19LIMESTONE
20COAL
ID FANS
ASH TODISPOSAL
NOTE: AIR ENTERS BOILER VIA 3 COMPRESSORS
PRIMARY, SECONDARY,AND LOOP AIR

97
Table 3.10 Case 2 Process Stream Compositions and State Points
1 2 3 4 5A 6 7 8 9 10 11V-L Mole Fraction
Ar 0.0093 0.0042 0.0000 0.0320 0.0000 0.0000 0.0000 0.0055 0.0000 0.0003 0.0000CH4 0.0000 0.0000 0.0000 0.0000 0.0000 0.0000 0.0000 0.0105 0.0000 0.0013 0.0000CO 0.0000 0.0000 0.0000 0.0000 0.0000 0.0000 0.0000 0.0050 0.0000 0.0003 0.0000CO2 0.0003 0.0005 0.0000 0.0000 0.0000 0.0000 0.0000 0.3474 0.0054 0.4341 0.0000COS 0.0000 0.0000 0.0000 0.0000 0.0000 0.0000 0.0000 0.0000 0.0000 0.0000 0.0000H2 0.0000 0.0000 0.0000 0.0000 0.0000 0.0000 0.0000 0.4215 0.0000 0.0010 0.0000H2O 0.0032 0.0049 0.0000 0.0000 1.0000 0.0000 1.0000 0.1998 0.9852 0.0000 1.0000H2S 0.0000 0.0000 0.0000 0.0000 0.0000 0.0000 0.0000 0.0005 0.0000 0.0025 0.0000N2 0.7784 0.9717 1.0000 0.0180 0.0000 0.0000 0.0000 0.0079 0.0000 0.0002 0.0000NH3 0.0000 0.0000 0.0000 0.0000 0.0000 0.0000 0.0000 0.0019 0.0093 0.5602 0.0000O2 0.2088 0.0187 0.0000 0.9500 0.0000 0.0000 0.0000 0.0000 0.0000 0.0000 0.0000SO2 0.0000 0.0000 0.0000 0.0000 0.0000 0.0000 0.0000 0.0000 0.0000 0.0000 0.0000
Total 1.0000 1.0000 1.0000 1.0000 1.0000 0.0000 1.0000 1.0000 1.0000 1.0000 1.0000
V-L Flowrate (lbmol/hr) 73,910 48,300 10,322 15,287 27,062 0 29,818 111,636 22,456 375 31,224V-L Flowrate (lb/hr) 2,138,200 1,357,070 289,164 491,964 487,108 0 537,179 2,292,770 407,529 10,790 562,509V-L Flowrate (MMscfd) 673.0 439.8 94.0 139.2 --- --- 271.6 1,016.7 4.1 3.4 0.4Solids Flowrate (lb/hr) 0 0 0 0 649,740 93,404 0 0 0 0 0
Temperature (°F) 184 79 246 192 300 300 500 435 144 197 197Pressure (psia) 190.0 16.4 415.0 785.0 600.0 500.0 530.0 469.7 422.0 28.0 28.0Enthalpy (Btu/lb) 53.7 15.4 53.3 34.6 --- --- 1,288.9 349.1 107.5 50.8 166.7HHV (Btu/lb) 0.0 0.0 0.0 0.0 0.0 0.0 0.0 2,773.4 85.3 3,248.2 0.0Total Energy (Btu/lb) 53.7 15.4 53.3 34.6 0.0 0.0 1,288.9 3,122.4 192.8 3,299.0 166.7Density (lb/ft3) 0.795 0.080 1.534 3.613 --- --- 0.927 1.005 59.586 0.114 57.846Molecular Weight 28.930 28.097 28.013 32.181 --- --- 18.015 20.538 18.148 28.783 18.015
A - Solids flowrate includes dry coal; V-L flowrate includes slurry water and water from coalB - Total Air flowrate to CFB boiler (includes primary air, secondary air and loop air)
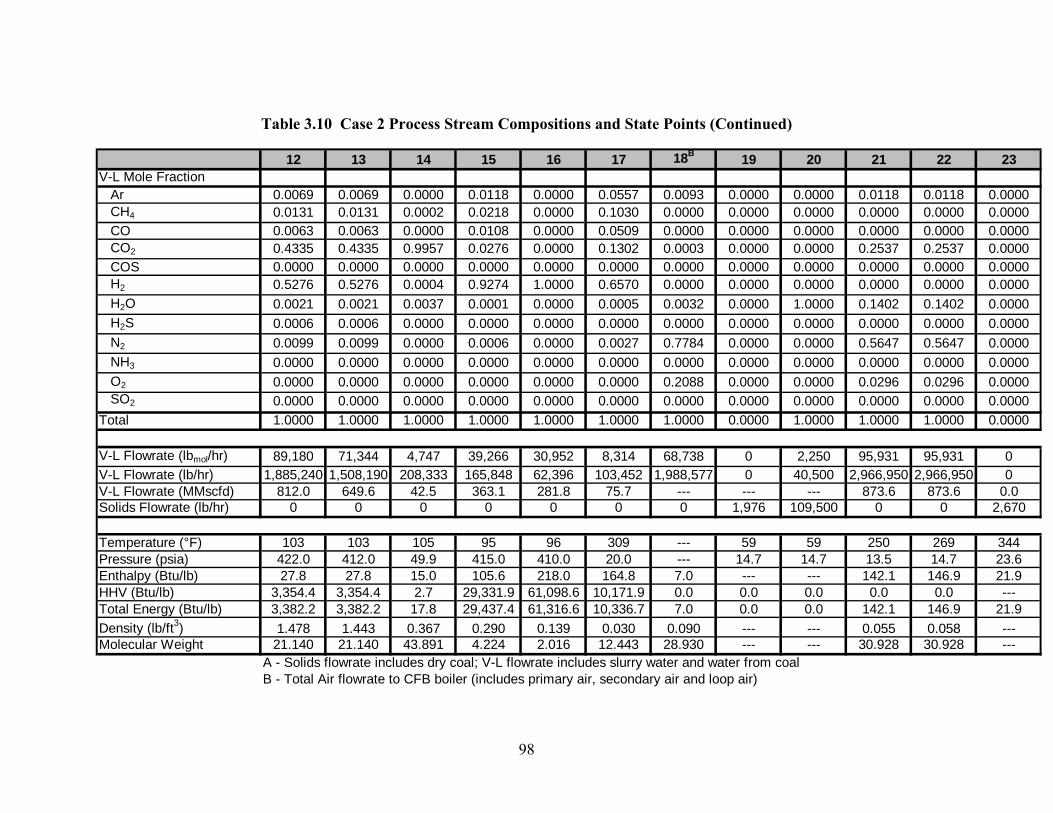
98
Table 3.10 Case 2 Process Stream Compositions and State Points (Continued)
12 13 14 15 16 17 18B 19 20 21 22 23V-L Mole Fraction
Ar 0.0069 0.0069 0.0000 0.0118 0.0000 0.0557 0.0093 0.0000 0.0000 0.0118 0.0118 0.0000CH4 0.0131 0.0131 0.0002 0.0218 0.0000 0.1030 0.0000 0.0000 0.0000 0.0000 0.0000 0.0000CO 0.0063 0.0063 0.0000 0.0108 0.0000 0.0509 0.0000 0.0000 0.0000 0.0000 0.0000 0.0000CO2 0.4335 0.4335 0.9957 0.0276 0.0000 0.1302 0.0003 0.0000 0.0000 0.2537 0.2537 0.0000COS 0.0000 0.0000 0.0000 0.0000 0.0000 0.0000 0.0000 0.0000 0.0000 0.0000 0.0000 0.0000H2 0.5276 0.5276 0.0004 0.9274 1.0000 0.6570 0.0000 0.0000 0.0000 0.0000 0.0000 0.0000H2O 0.0021 0.0021 0.0037 0.0001 0.0000 0.0005 0.0032 0.0000 1.0000 0.1402 0.1402 0.0000H2S 0.0006 0.0006 0.0000 0.0000 0.0000 0.0000 0.0000 0.0000 0.0000 0.0000 0.0000 0.0000N2 0.0099 0.0099 0.0000 0.0006 0.0000 0.0027 0.7784 0.0000 0.0000 0.5647 0.5647 0.0000NH3 0.0000 0.0000 0.0000 0.0000 0.0000 0.0000 0.0000 0.0000 0.0000 0.0000 0.0000 0.0000O2 0.0000 0.0000 0.0000 0.0000 0.0000 0.0000 0.2088 0.0000 0.0000 0.0296 0.0296 0.0000SO2 0.0000 0.0000 0.0000 0.0000 0.0000 0.0000 0.0000 0.0000 0.0000 0.0000 0.0000 0.0000
Total 1.0000 1.0000 1.0000 1.0000 1.0000 1.0000 1.0000 0.0000 1.0000 1.0000 1.0000 0.0000
V-L Flowrate (lbmol/hr) 89,180 71,344 4,747 39,266 30,952 8,314 68,738 0 2,250 95,931 95,931 0V-L Flowrate (lb/hr) 1,885,240 1,508,190 208,333 165,848 62,396 103,452 1,988,577 0 40,500 2,966,950 2,966,950 0V-L Flowrate (MMscfd) 812.0 649.6 42.5 363.1 281.8 75.7 --- --- --- 873.6 873.6 0.0Solids Flowrate (lb/hr) 0 0 0 0 0 0 0 1,976 109,500 0 0 2,670
Temperature (°F) 103 103 105 95 96 309 --- 59 59 250 269 344Pressure (psia) 422.0 412.0 49.9 415.0 410.0 20.0 --- 14.7 14.7 13.5 14.7 23.6Enthalpy (Btu/lb) 27.8 27.8 15.0 105.6 218.0 164.8 7.0 --- --- 142.1 146.9 21.9HHV (Btu/lb) 3,354.4 3,354.4 2.7 29,331.9 61,098.6 10,171.9 0.0 0.0 0.0 0.0 0.0 ---Total Energy (Btu/lb) 3,382.2 3,382.2 17.8 29,437.4 61,316.6 10,336.7 7.0 0.0 0.0 142.1 146.9 21.9Density (lb/ft3) 1.478 1.443 0.367 0.290 0.139 0.030 0.090 --- --- 0.055 0.058 ---Molecular Weight 21.140 21.140 43.891 4.224 2.016 12.443 28.930 --- --- 30.928 30.928 ---
A - Solids flowrate includes dry coal; V-L flowrate includes slurry water and water from coalB - Total Air flowrate to CFB boiler (includes primary air, secondary air and loop air)

99
3.5 Major Equipment List for Case 1 and Case 2 The equipment lists corresponding to the power plant configuration shown in Figure 3-1 and Figure 3-2 are shown in Appendix D.
3.6 Economic Parameters Capital cost and production cost estimates have been developed for the KNO plant based on adjusted vendor-furnished data, actual cost data or best possible projections. Because the primary purpose of the plant is to produce either syngas or hydrogen and other feedstocks for the Agrium fertilizer plant, a cost of electricity is not appropriate and is not calculated.
3.6.1 Capital Costs The capital costs at the Total Plant Cost level include equipment, materials, labor, indirect construction costs, engineering, and contingencies. Operation and maintenance cost values were determined on a first-year basis. Quantities for major consumables such as fuel were taken from the heat and mass balance developed for this application. Other consumables were evaluated on the basis of the quantity required using reference data. Operation cost were determined on the basis of the number of operators. Maintenance costs were evaluated on the basis of requirements for each major plant section. The operating and maintenance costs are expressed on an annual basis.
Each major component were based on a reference bottoms-up estimate:
• Total Plant Cost, or “Overnight Construction Cost” values are expressed in January 2006 dollars.
• Total Plant Investment values are expressed in mixed year dollars for a January 2010 commercial operation.
• The estimate represents current commercial offerings for the IGCC technology or best possible projections for very near-term, yet non-commercial offerings.
• The estimates represent a complete plant facility, including necessary integrations with the existing Agrium plant, except for the items listed below.
• The boundary limit is defined as the total plant facility within the “fence line,” including coal receiving and water supply system. Interconnections between the plant and the fertilizer plant are not included in this study, and are assumed to be by others.
• Site is Nikiski, Alaska adjacent to the Agrium fertilizer plant. Costs were based on a relative equipment/material/labor factor.
• Costs are grouped according to a process/system oriented code of accounts; all reasonably allocable components of a system or process are included in the specific system account in contrast to a facility, area, or commodity account structure.
• The operating and maintenance expenses and consumable costs were developed on a quantitative basis.

100
• Operating labor cost was determined on the basis of the number of operators required.
• Maintenance cost was evaluated on the basis of relationships of maintenance cost to initial capital cost. For each case considered in this study, O&M costs will be calculated for the new plant equipment only.
• Cost of consumables, including fuel, were determined on the basis of individual rates of consumption, the unit cost of each consumable, and the plant annual operating hours.
• As this is a preliminary assessment, no byproduct credits for commodities were determined.
The capital cost, specifically referred to as Total Plant Cost (TPC) for this plant, were estimated for the categories consisting of bare erected cost, engineering and home office overheads, and fee plus contingencies. The TPC level of capital cost is the “overnight construction” estimate. The capital cost were determined through the process of estimating the cost of every significant piece of equipment, component, and bulk quantity.
The Capital Cost summary is shown in Table 3-11.
Table 3.11 Case 1 and 2 Capital Cost Summary
Comparison of Total Plant Costs for Cases 1 and 2 TPC, $1,000
Plant Item/Description Case 1 Case 2 Coal & Sorbent Handling $110,205 $116,167 Coal Preparation & Feed $151,733 $159,942 Feedwater Systems $7,950 $26,110 Gasifier & Accessories $569,475 $567,938 Syngas Cleanup & H2 Separation $261,639 $263,940 Combustion Turbine $78,919 $0 HRSG & Stack $73,925 $0 CFB and Stack $0 $254,657 Expander Generator $0 $8,103 Steam Turbine Generator $12,625 $47,158 Cooling Water System $9,429 $19,807 Ash/Spent Sorbent handling $64,762 $68,370 Accessory Electric $155,818 $166,749 I&C $76,644 $82,021 Site Improvements $36,615 $38,596 Buildings $30,745 $49,615
Total Plant Cost $1,640,484 $1,869,173
3.6.2 Production Costs and Expenses The production costs or operating costs and related maintenance expenses (O&M) described in this section pertain to those charges associated with operating and maintaining the plant over its expected life.
The costs and expenses associated with operating and maintaining the plant include:

101
• Operating labor
• Maintenance – material and labor
• Administrative and support labor
• Consumables
• Fuel cost
These costs and expenses were estimated on a reference year (January 2006) basis and then escalated to a first-year basis, in January 2010 dollars. The first-year costs assume normal operation and do not include the initial startup costs. The operating labor, maintenance material and labor, and other labor-related costs were combined and then divided into two components: fixed O&M, which is independent of power generation, and variable O&M, which is proportional to power generation. The first-year O&M cost estimate allocation were based on the plant capacity factor.
The other operating costs, consumables and fuel, were determined on a daily 100% operating capacity basis and adjusted to an annual plant operation basis. The inputs for each category of operating costs and expenses were identified in the succeeding section on financial considerations.
4. FINANCIAL ANALYSIS
The results of the cost estimate for the gasification plant were used as the basis for the financial analysis. The analysis strived to reflect the overall economics of the manufacturing site as a whole, including the existing Agrium ammonia and urea plants. A simplified schematic of the plant inputs and outputs used in the financial modeling for Case 1 can be seen in Figure 4.1 below:
Figure 4-1 Key Plant Inputs/Outputs, Case 1 Financial Model CO2 N2
41 MMscfd 281 MMscfd
Coal Ammonia10,636 mTPD H2 282 MMscfd 2,075 mTPD
N2 94 MMscfdChemicals CO2 41 MMscfd Urea
Steam 1.5 MMlb/hr 3,099 mTPDPower 11 MWe
Slag Sulfur Export Power955 mTPD 19 mTPD 70 MWe
Gasification FacilityNew Existing
Agrium Facility

102
The key results desired from the analysis were the project return on equity investment, discounted cash flow, and identification of key model sensitivities. The model used to perform this work is the Nexant-developed Power Systems Financial Model, Version 5.0. This model was originally developed in May 2002 and has since been modified to incorporate additional functionality. The model has been used in numerous gasification studies, and is now the standard used by NETL for IGCC systems analysis. It is a robust discounted cash flow model that takes into account all major financial and scenario assumptions in developing the key economic outputs.
4.1 Methodology To develop appropriate financial assumptions for the combined facility, a number of sources were reviewed and conversations held with team experts. The main sources used as the input bases were NETL’s “Quality Guidelines for Energy System Studies,” previous gasification optimization studies performed by Nexant88 for NETL, and situation-specific analysis performed by the analysis team. Details of the financial assumptions made for both cases can be found in Appendix E. A few of the major assumptions and some of the areas that were explored via sensitivity analysis are listed below:
• A 25% project contingency applied across the entire plant to reflect the uncertainty in the cost estimate at this phase of the analysis.
• 85% plant availability. • 37% tax rate. • Total operation and maintenance (O&M) costs of 7% per year (fixed and variable),
reflecting the O&M costs for both the gasification and fertilizer plants. This is higher than what is typically used in IGCC economic assessments due to the incorporation of the ammonia and urea plants into the model.
• 42-month construction period. • 30-year plant life. • 70:30 debt to equity ratio for project financing, 8% cost of capital. • 2 to 3% escalation was included throughout the life of the plant for all products,
feedstocks, and operating costs. Specific details can be found in Appendix E. Specific plant performance and operating data were entered into the model from the design basis. The material and energy balance set the entries for items such as power output, ammonia and urea production, sulfur generation, and coal feed requirements. The plant EPC cost used for the model analysis was determined by establishing installed cost estimates for all major unit operations, off-sites, and balance-of-plant items. A more rigorous explanation of how these numbers were developed was outlined in Section 3.3, Capital and Operating Costs.
The values for all commodity inputs and outputs come from the research done for Section 2. The coal price of $32.25/metric ton was based on averages of all the cases evaluated for supply from the Chuitna mine. Ammonia and urea prices are derived from the “expected average product 88 Tasks 1 and 2, Gasification Plant Cost and Performance Optimization study, DOE Contract number DE-AC26-99FT40342, September 2003.

103
price” for these commodities in Alaska based on previous RDS market analysis.89 Similar analysis on both sulfur and electricity markets in Alaska provided the values eventually used in the model.
Preliminary model runs were performed in February 2006 when the first estimates were developed for system configuration, plant cost, and commodity prices. These estimates were modified after input from the Review Committee and additional team optimization. Insight developed from the first model runs also helped to shape the design of each case. Once the final two case designs were agreed upon, separate model runs were performed to reflect the design differences between each case.
One of the major design variations considered was the inclusion of equipment to capture and compress carbon dioxide for enhanced oil recovery. Both a Selexol unit for carbon dioxide capture and a compressor for getting the stream to appropriate pipeline pressure (~2000 psi) were included in this alternate design. Costs for pipelines and other equipment outside of the plant boundaries were not included. While this case produced another product stream that enhanced overall cash flow (~40 MMSCFD of carbon dioxide) the trade-off is greater capital cost ($72MM) and auxiliary power load (~30MW).
An initial value of $0.50/MSCF of carbon dioxide was used after discussions with local oil and gas producers. The IRR for this case was ~1 percentage point lower than the final Case 1 design. A sensitivity analysis on carbon dioxide in the alternate case showed that a value of nearly $1.00/MSCF would be necessary to make it break-even with Case 1. Since it was determined that this value is higher than what could be obtained in the Alaskan market, equipment for carbon dioxide capture and storage was removed from the base case designs.
4.2 Results and Sensitivities The general methodology followed for performing the financial analysis was outlined in Section 4.1. Inputs were placed into the Power Systems Financial Model Version 5.0 to obtain the results discussed in this section. Appendix E provides the model inputs for both cases considered.
The plant EPC cost entered into the financial model was taken from the analysis done in Section 3.3, with only a few modifications. “Bare Erected Cost” was combined with the engineering and home office fees provided in the cost estimate to produce the EPC cost. On top of these costs, a 25% process contingency, a 2% start-up cost, and 10% owner’s cost was included to reflect the total plant costs.
4.2.1 Case 1
For Case 1 with EPC costs of $1,312 million and a project life of 30 years, the return on investment (ROI) is expected to be 11.1%, with a net present value (NPV) of $53 million using a 12% discount factor. The table below outlines the rate of return, NPV, payback year, and 89 “South Central Alaska Gas Needs Assessment”, Draft Report, as part of Contract No. DE-AM26-04NT41817, Task 211.01.06, January 2006.

104
required ammonia/urea selling prices to obtain a 12% ROI with other entries fixed. For the ammonia/urea analysis, a constant spread of $40/tonne was maintained. Besides the base case, a “high” and “low” estimate is listed reflecting potential uncertainty in the cost estimate at this stage of +/- 25%. For ammonia and urea, the prices are FOB Black Sea, adjusted to include shipping costs to Asian markets.
Table 4.1 Case 1 Financial Cost Summary
Base Low
-25% EPC
High
+25% EPC
ROI (%)
11.1 18.0 6.1
NPV ($million)
(12% Discount Rate) -53 271 -441
Payback Year
(start-up 2011) 2023 2017 2030
Ammonia/Urea Selling Price for 12%ROI ($/MT) 230/190 190/150 269/229
For the base case, Table 4.2 below breaks down the total plant cost including EPC costs, all fees, start-up costs, and costs incurred from project financing. The “High” and “Low” case costs would be proportionately changed by the percentage difference in EPC costs.
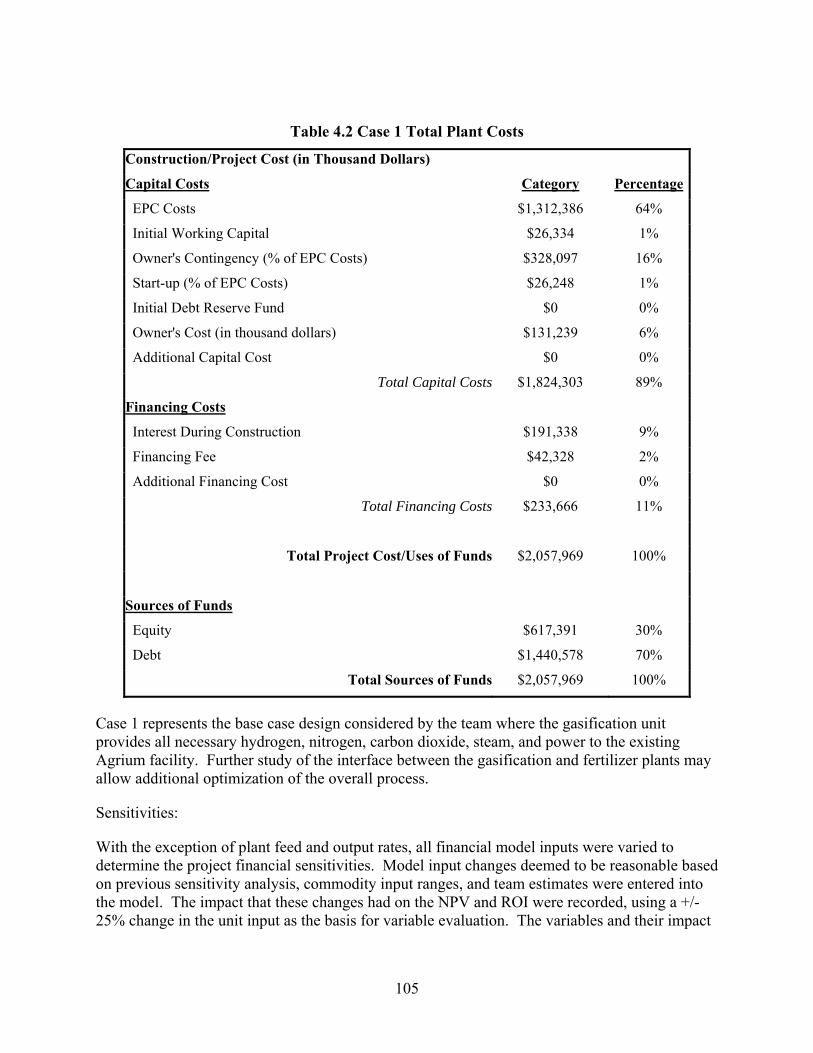
105
Table 4.2 Case 1 Total Plant Costs
Construction/Project Cost (in Thousand Dollars)
Capital Costs Category Percentage
EPC Costs $1,312,386 64%
Initial Working Capital $26,334 1%
Owner's Contingency (% of EPC Costs) $328,097 16%
Start-up (% of EPC Costs) $26,248 1%
Initial Debt Reserve Fund $0 0%
Owner's Cost (in thousand dollars) $131,239 6%
Additional Capital Cost $0 0%
Total Capital Costs $1,824,303 89%
Financing Costs
Interest During Construction $191,338 9%
Financing Fee $42,328 2%
Additional Financing Cost $0 0%
Total Financing Costs $233,666 11%
Total Project Cost/Uses of Funds $2,057,969 100%
Sources of Funds
Equity $617,391 30%
Debt $1,440,578 70%
Total Sources of Funds $2,057,969 100%
Case 1 represents the base case design considered by the team where the gasification unit provides all necessary hydrogen, nitrogen, carbon dioxide, steam, and power to the existing Agrium facility. Further study of the interface between the gasification and fertilizer plants may allow additional optimization of the overall process.
Sensitivities:
With the exception of plant feed and output rates, all financial model inputs were varied to determine the project financial sensitivities. Model input changes deemed to be reasonable based on previous sensitivity analysis, commodity input ranges, and team estimates were entered into the model. The impact that these changes had on the NPV and ROI were recorded, using a +/- 25% change in the unit input as the basis for variable evaluation. The variables and their impact

106
on the financial outputs were then ranked to determine the model inputs of highest sensitivity. Results of this analysis can be seen in Figure 4.2 below.
Figure 4-2 Case 1 Change in IRR, +/- 25% Model Inputs
Change in IRR, +/- 25% Model Inputs
-8 -6 -4 -2 0 2 4 6 8
Sulfur ($/MT)
Electric Tariff ($/MWh)
Tax Rate
% Debt Financing
Project Life (Yrs)
Loan Interest Rate
O&M Cost (% of EPC)
Delivered Coal Price ($/ton)
Ammonia ($/Short Ton)
Urea ($/Short Ton)
EPC Cost ($MM)
Availability
Information for how changes in the plant cost impact the IRR and NPV were shown earlier in Table 4.1. Because other model inputs are based on a percentage of the plant cost (contingency factor and O&M costs, as an example), changes in this variable has a multiplier impact on the overall economic results. In a capital investment of this magnitude, developing the most accurate plant cost estimate is critical to understanding the project economics.
The other inputs that had the greatest impact on overall project finances were the process availability, ammonia/urea price, and the coal price. Taking into account the ranges of variable changes presented here, no other variable was able to impact the NPV by more than 2.5 percentage points. Note that the variable range considered here, +/- 25%, was used to give a common ground to evaluate all variables, but the possible range for each input could vary by considerably more.
Figure 4.3 shows the relationship between process availability and project IRR.
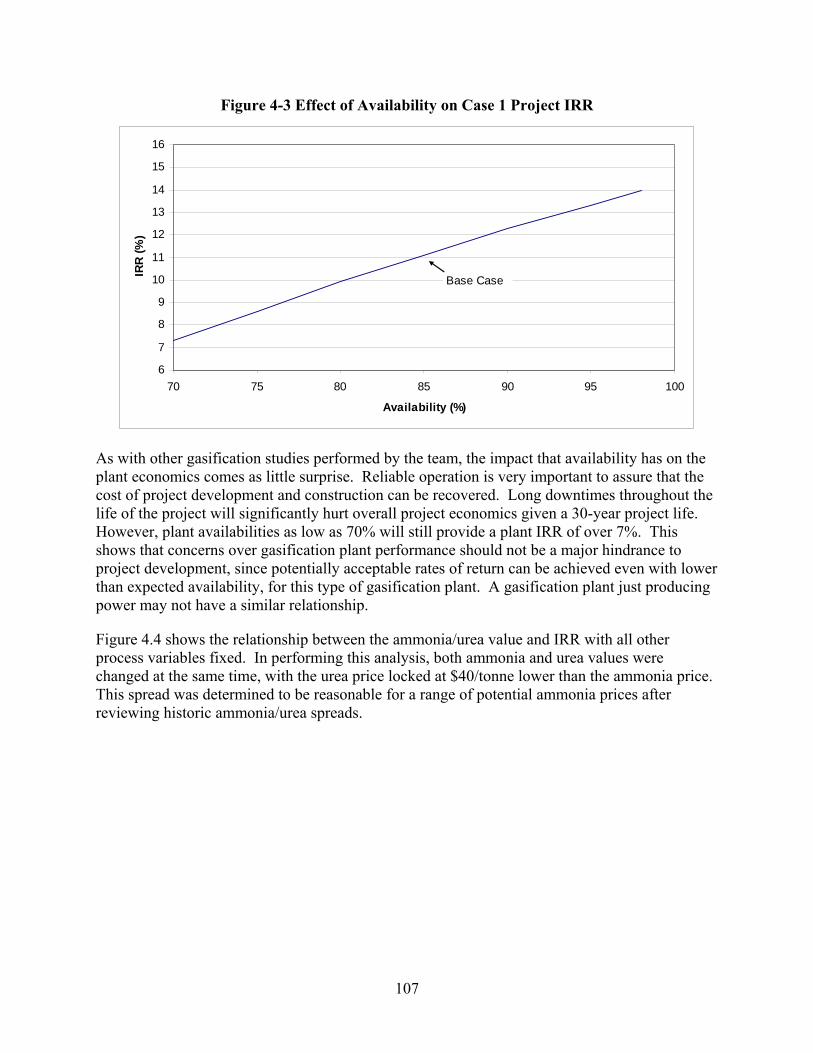
107
Figure 4-3 Effect of Availability on Case 1 Project IRR
6
7
8
9
10
11
12
13
14
15
16
70 75 80 85 90 95 100
Availability (%)
IRR
(%)
Base Case
As with other gasification studies performed by the team, the impact that availability has on the plant economics comes as little surprise. Reliable operation is very important to assure that the cost of project development and construction can be recovered. Long downtimes throughout the life of the project will significantly hurt overall project economics given a 30-year project life. However, plant availabilities as low as 70% will still provide a plant IRR of over 7%. This shows that concerns over gasification plant performance should not be a major hindrance to project development, since potentially acceptable rates of return can be achieved even with lower than expected availability, for this type of gasification plant. A gasification plant just producing power may not have a similar relationship.
Figure 4.4 shows the relationship between the ammonia/urea value and IRR with all other process variables fixed. In performing this analysis, both ammonia and urea values were changed at the same time, with the urea price locked at $40/tonne lower than the ammonia price. This spread was determined to be reasonable for a range of potential ammonia prices after reviewing historic ammonia/urea spreads.

108
Figure 4-4 Effect of Ammonia/Urea Sales Price on Case 1 Project IRR
-20
-15
-10
-5
0
5
10
15
20
25
50 100 150 200 250 300 350
Ammonia Price ($/tonne)
IRR
(%)
Note: Ammonia and Urea prices tested simultaneously
Urea Price = Ammonia Price - $40/tonne
Base Case
Market prices for ammonia and urea have varied widely in recent years due to fluctuating natural gas prices and worldwide supply and demand. With relatively stable coal prices in Alaska, a gasification unit configured to produce raw materials, power, and steam can act as a hedge against price volatility and natural gas supply. Given that the ammonia/urea product market has recently witnessed prices near both ends of the range evaluated above, project developers should strongly evaluate what the market conditions are expected to be for this main product, and determine ways to hedge against potential low prices.
Considerable time during this study has also been spent on estimating what the delivered coal price to the gasification facility will be. Figure 4.5 shows the impact that changes in the coal price has on the plant IRR.
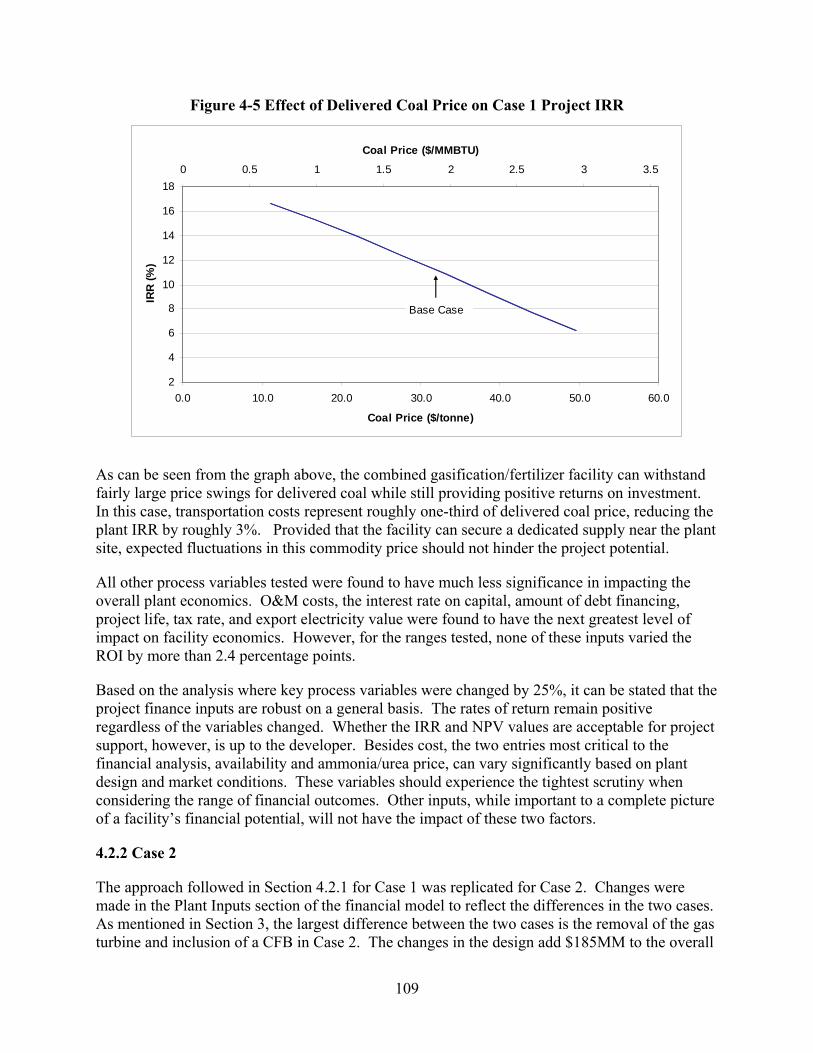
109
Figure 4-5 Effect of Delivered Coal Price on Case 1 Project IRR
2
4
6
8
10
12
14
16
18
0.0 10.0 20.0 30.0 40.0 50.0 60.0
Coal Price ($/tonne)
IRR
(%)
0 0.5 1 1.5 2 2.5 3 3.5
Coal Price ($/MMBTU)
Base Case
As can be seen from the graph above, the combined gasification/fertilizer facility can withstand fairly large price swings for delivered coal while still providing positive returns on investment. In this case, transportation costs represent roughly one-third of delivered coal price, reducing the plant IRR by roughly 3%. Provided that the facility can secure a dedicated supply near the plant site, expected fluctuations in this commodity price should not hinder the project potential.
All other process variables tested were found to have much less significance in impacting the overall plant economics. O&M costs, the interest rate on capital, amount of debt financing, project life, tax rate, and export electricity value were found to have the next greatest level of impact on facility economics. However, for the ranges tested, none of these inputs varied the ROI by more than 2.4 percentage points.
Based on the analysis where key process variables were changed by 25%, it can be stated that the project finance inputs are robust on a general basis. The rates of return remain positive regardless of the variables changed. Whether the IRR and NPV values are acceptable for project support, however, is up to the developer. Besides cost, the two entries most critical to the financial analysis, availability and ammonia/urea price, can vary significantly based on plant design and market conditions. These variables should experience the tightest scrutiny when considering the range of financial outcomes. Other inputs, while important to a complete picture of a facility’s financial potential, will not have the impact of these two factors.
4.2.2 Case 2
The approach followed in Section 4.2.1 for Case 1 was replicated for Case 2. Changes were made in the Plant Inputs section of the financial model to reflect the differences in the two cases. As mentioned in Section 3, the largest difference between the two cases is the removal of the gas turbine and inclusion of a CFB in Case 2. The changes in the design add $185MM to the overall

110
capital cost. Since contingency fees, development costs, owner’s costs, and O&M costs are all based off a percentage of the total EPC value, these costs increased proportionately. While the amount of hydrogen, nitrogen, CO2, and steam necessary for the Agrium plant operation remain unchanged, the coal feed requirements increased slightly while the electricity export rate dropped significantly (12MW in Case 2 versus 70 MW in Case 1). Figure 4.6 below shows the inputs and outputs used in the financial model, with items different from Case 1 placed in italics.
Figure 4-6 Key Plant Inputs/Outputs, Case 2 Economic Model
CO2 N241 MMscfd 281 MMscfd
Coal Ammonia11,346 mTPD H2 282 MMscfd 2,075 mTPD
N2 94 MMscfdChemicals CO2 41 MMscfd Urea
(including limestone) Steam 1.5 MMlb/hr 3,099 mTPDPower 11 MWe
Slag Sulfur Export Power1207 mTPD 20 mTPD 12 MWe
with a CFBGasification Facility
New ExistingAgrium Facility
The scenario inputs for the variable financial entries into the model are unchanged from Case 1. The change in the plant EPC costs are not expected to change the conditions of project financing or other financial assumptions. In addition, Case 2 should not be different in terms of the construction time or the plant’s economic life. With the exception of the inputs for export electricity to the grid, commodity tariffs and escalation rates were kept the same as Case 1. Based on the Alaska electricity system modeling performed, the export price increased in Case 2 by ~$6/MWhr. See Appendix E for the financial model entries.
For a facility with EPC costs of $1498 million and a project life of 30 years, the ROI is expected to be 6.0%, with a NPV of -$413 million using a 12% discount factor. The table below outlines the rate of return, NPV, payback year, and required ammonia selling price to obtain a 12% ROI with other entries fixed. As in Case 1, a “high” and “low” estimate is listed reflecting potential uncertainty in the cost estimate at this stage of +/- 25%.

111
Table 4.3 Case 2 Financial Cost Summary
Case 2 Base Low (-25% EPC)
High (+25% EPC)
Case 1
ROI (%) 6.0 12.5 1.7 11.1
NPV ($MM)(12% Discount Rate) -413 25 -880 -53
Payback Year(Start-up 2011) 2031 2021 2038 2023
Ammonia/Urea Selling Price for 12% ROI ($/MT)
267/227 221/181 312/272
230/190
A side-by-side comparison of the cases, as can be seen by comparing the Case 2 base to the last column in Table 4.3, shows how Case 1 is superior in all financial categories. Reviewing the key model inputs, Case 2 is more expensive, requires more coal, and exports less power relative to Case 1. While eliminating the gas turbine and the small steam turbine reduces the Case 2 cost, adding the CFB, a large 156 MW steam turbine, a 16 MW expander, and three times the cooling load far outweighs the initial cost savings. While it could potentially be argued that this case would have greater reliability than Case 1, a sensitivity analysis of this parameter shows that any potential gains would not be enough to create financial results superior to Case 1.
For the base case, Table 4.4 below breaks down the total plant cost including EPC costs, all fees, start-up costs, and costs occurred from project financing. The “High” and “Low” case costs would be proportionately changed by the percentage difference in EPC costs.

112
Table 4.4 Case 2 Total Plant Costs
Construction/Project Cost (in Thousand Dollars)
Capital Costs Category Percentage
EPC Costs $1,497,600 64%
Initial Working Capital $25,168 1%
Owner's Contingency (% of EPC Costs) $374,400 16%
Start-up (% of EPC Costs) $29,952 1%
Initial Debt Reserve Fund $0 0%
Owner's Cost (in thousand dollars) $149,760 6%
Additional Capital Cost $0 0%
Total Capital Costs $2,076,880 89%
Financing Costs
Interest During Construction $217,829 9%
Financing Fee $48,189 2%
Additional Financing Cost $0 0%
Total Financing Costs $266,018 11%
Total Project Cost/Uses of Funds $2,342,898 100%
Sources of Funds
Equity $702,869 30%
Debt $1,640,029 70%
Total Sources of Funds $2,342,898 100%
As mentioned in the Case 1 analysis, the main design consideration was for the combined gasification/CFB unit to provide all necessary hydrogen, nitrogen, carbon dioxide, steam, and power to the Agrium facility. Additional project analysis attempted to change other portions of the plant design to improve project economics. The initial assumptions behind the inclusion of Case 2 is that elimination of the gas turbine and use of a CFB to supply steam and power to the Agrium plant would reduce the overall project cost. The high steam and auxiliary power load of the plant led to very large units being required to meet the design basis without the gas turbine, leading to the net increase in cost.

113
Sensitivities:
Because there has been little change in the financial assumptions made between the two cases, the parameters found to be most sensitive in Case 1 are the same in Case 2. Guaranteed availability, ammonia/urea price, and delivered coal costs were again found to be the most sensitive model inputs. Figures 4.7 through 4.9 below show the impact that changes in these inputs have on the project IRR.
Figure 4-7 Effect of Availability on Case 2 Project IRR
0
2
4
6
8
10
12
70 75 80 85 90 95 100
Availability (%)
IRR
(%)
Base Case
Figure 4-8 Effect of Ammonia/Urea Sales Price on Case 2 Project IRR
-25
-20
-15
-10
-5
0
5
10
15
20
50 100 150 200 250 300 350
Ammonia Price ($/tonne)
IRR
(%)
Note: Ammonia and Urea prices tested simultaneously
Urea Price = Ammonia Price - $40/tonne
Base Case

114
Figure 4-9 Effect of Delivered Coal Price on Case 2 Project IRR
0
2
4
6
8
10
12
0.0 10.0 20.0 30.0 40.0 50.0 60.0
Coal Price ($/tonne)
IRR
(%)
0 0.5 1 1.5 2 2.5 3 3.5
Coal Price ($/MMBTU)
Base Case
The trends seen in these figures are similar to those witnessed in Case 1. The IRR numbers seen here are all lower when compared to Case 1 for a similar range. High levels of availability greatly assist in assuring the plant will be economically justified. As mentioned earlier, it is possible that Case 2 could have a higher overall availability due to removal of the gas turbine. However, as shown in Figure 4.7, even availabilities in the 90%+ range would not produce financial results superior to Case 1.
The main plant export, ammonia and urea, will have the largest impact of all the feeds and products relevant to the plant performance. While the delivered coal price is also important to consider, the greatest focus should be placed in estimating ammonia and urea prices in order to develop the most accurate plant economics. Because of the lower IRR in the Case 2 base model, this case is more at risk of negative equity returns if the prices of ammonia and urea fall. Case 1 can produce a positive cash flow over a wider range of ammonia/urea prices relative to Case 2.
As with Case 1, all other process variable tested were found to have much less significance in impacting the overall plant economics. While there were slight changes in the relative order, the net impact of all other financial model entries remain relatively small. Plant O&M costs have a greater impact on the financial results since they are calculated as a percentage of larger EPC costs, while the electricity tariff has a lower impact due to the significantly lower level of power being exported. In addition, the higher plant EPC cost increases the sensitivity of the model to interest rate and fees that are a percentage of the EPC cost. None of the other model inputs varied the IRR by more than 2.9 percentage points for the ranges tested. The higher EPC cost in Case 2 creates a greater range of financial outputs for similar model changes when compared to Case 1. This slightly decreases the robustness of the financial model for this case. In addition, the weaker base case financial performance exhibited by Case 2 may put the returns much closer to minimums required by project developers to move forward with project finance. The range of potential project outcomes, taking into account potential fluctuations in the financial model

115
inputs, has shifted down by ~5 percentage points relative to Case 1. Considering that the range of potential project upside and downside are roughly similar in both cases, it is unlikely that Case 2 should be considered further for development at the Agrium site.
5. ENVIRONMENTAL PERMITTING AND ISSUES The Cook Inlet IGCC facility as defined in this report would require a number of federal, state and borough environmental construction and operation permits. To identify the relevant environmental permits and issues, the project is organized into the following components:
• Construction/Operation of Gasifier, Turbines and Balance-of-Plant Equipment.
• Plant Modification, Integration and Optimization – removal and replacement of existing plant equipment and installation of additional facilities and infrastructure to integrate the gasifier and turbines into the existing Agrium facility and optimize operations.
• Marine Terminal Modification - modification of the existing Agrium marine terminal facility to accommodate coal barges and coal off-loading.
• Transport of Coal to the IGCC Facility – transport of coal by barge from an existing marine terminal near the Chuitna Mine, or from the existing coal marine terminal at Seward.
Based on the proposed Project Design Basis, the following discusses key permitting and regulatory issues.
5.1 Air Emissions An IGCC plant will produce air emissions from the exhaust stacks of the heat recovery steam generators, coal milling and drying units, flares, and cooling towers. The Alaska Department of Environmental Conservation regulates air emissions as set out by 18 AAC 50, and is the delegated authority for preparing air quality permits. Nonetheless, the U.S. Environmental Protection Agency imposes federal emission limits, monitoring, and reporting from new sources as set out by 40 CFR 60. The state may or may not include these federal requirements into its air quality permits. However, regardless of incorporation into a state permit, the federal requirements still apply.
The summary below provides the permitting triggers, permitting requirements, and limits that will be applicable to this project.
5.1.1 Emissions
The existing potential to emit at Agrium, the IGCC project emissions, and total emissions are provided below in tons per year (tpy).

116
Emissions Agrium (tpy) IGCC Project (tpy) Total Emissions (tpy)
Nitrogen Oxides (NOx) 3936 520 4456
Carbon Monoxide (CO) 1898 27 1925
Sulfur Dioxide (SO2) 10 194 204
Particulate Matter (PM-10) 579 92 671
Volatile Organic Compounds (VOC) 386 17 403
The IGCC project emissions are based on a 233 MW plant size and emission factors provided in the Design Basis. The project emissions assume that particulate matter (PM), mercury (Hg), lead (Pb) and hydrogen sulfide (H2S) control equipment are part of the integral design of the ICGG power generation plant. Thus, Hg and Pb emissions from the IGCC project are negligible, less than 1 tpy.
5.1.2 Permitting Agrium is currently classified as a Prevention of Significant Deterioration (PSD) major stationary source because it has the potential to emit 250 tpy or more of a regulated air pollutant (e.g., major for NOx, CO, PM-10, and VOC). When modifying a stationary source, the project will be classified as a major modification requiring PSD review if there is a significant emission increase and a significant net emission increase. The project has significant emission increases, and there is also a significant net emission increase because we are assuming no emission reductions from Agrium as shown below.
Emissions IGCC Project (tpy)
Emission Credits (tpy)
Total Project Emissions
(tpy)
Significant Emission
Level (tpy)
Major Modification
? NOx 520 0 520 40 yes
CO 27 0 27 100 no
SO2 194 0 194 40 yes
PM-10 92 0 92 15 yes
VOC 17 0 17 100 no
A major modification permit under 18 AAC 50.306 and 40 CFR 52.21 will entail the following:
• Pre-construction air quality monitoring for 4 months to one year – the pre-construction monitoring can be waived if preliminary dispersion modeling shows that the project emission impacts are less than the significant monitoring thresholds;

117
• Post-construction air quality monitoring – post construction monitoring may be required if standards are threatened or there is uncertainty in the modeling;
• Meteorological monitoring – onsite meteorological monitoring may be required;
• Ambient air quality modeling – the analysis would include modeling of each of the pollutants that have an emission increase greater than the significant emission level (i.e., NOx, SO2, and PM-10). If the preliminary analysis shows that project impacts are less than the significant monitoring thresholds, then a full ambient impact analysis is not required (which would involve estimation of background pollutant concentrations resulting from existing sources and associated growth to ensure compliance with both the PSD increments and standards);
• Best available control technology review – for IGCC power plants, the review would include determining the economic and technical feasibility of installing selective catalytic reduction;
• Impact analysis of impairment to visibility, soils, and vegetation – the impact analysis would demonstrate the potential emissions impact on visibility, soils, and vegetation;
• Class I area impact analysis – the analysis would need to determine if emissions adversely impact a Class I area; and,
• Demonstration of compliance with applicable emission limits – the demonstration may include emissions calculations, source testing, and other monitoring.
If it was possible to offset emissions such that there will not be a significant net emission increase, a major modification permit could be avoided as shown below:
Emissions IGCC Project
(tpy) Emission
Credits (tpy)
Total Project Emissions
(tpy)
Significant Emission
Level (tpy) Major
Modification? NOx 520 -481 39 40 no
CO 27 0 27 100 no
SO2 194 -155 39 40 no
PM-10 92 -78 14 15 no
VOC 17 0 17 100 no
Note: Emission credits are any increases or decreases in actual emissions that have occurred within the last five years. Hence, this is not based on Agrium’s potential or permitted emissions.
However, it does not appear that Agrium has enough SO2 emissions to obtain credits in the amount of 155 tpy. Thus, the IGCC project would have to reduce its SO2 emissions to obtain the credits necessary to avoid a major modification permit.
In the event that a major modification permit could be avoided, a minor permit under 18 AAC 50.502(c) (3) will be required and entails the following:

118
• Establishment of owner requested limits – establish the limits that are necessary to get credible emission reductions;
• Demonstration of compliance with applicable emission limits – the demonstration may include emissions calculations, source testing, and other monitoring; and,
• Ambient air quality modeling to ensure protection of standards – the analysis would demonstrate that potential stationary source emissions will not interfere with projection of the ambient standards. If further emission credits were possible, modeling would not be required (e.g., total project emissions of NOx, SO2, and PM-10 were less than 10 tpy).
Both types of permitting would require updating the Agrium operating permit as set out by 18 AAC 50.
5.1.3 Applicable Limits The following limits will be applicable to the IGCC project. Applicability is based on a 233 MW plant size and emission factors as provided in the Design Basis with power sales of 69 MW (i.e., less than one-third of its potential electric output capacity).
Additional limits may apply if the facility is considered a Hazardous Air Pollutant (HAP) major facility. To be HAPs major, the emissions from Agrium and the IGCC plant need to be greater than 10 tons per year for a single HAP or 25 tons per year of total HAPs. HAPs were not identified in the Design Basis.

119
NOx CO SO2 PM-10 VOC Hg Opacity
Emission Factors
0.059 lb/MMBtu
(0.51 lb/MW-hr)
0.03 lb/MMBtu
(0.026 lb/MW-hr)
0.022 lb/MMBtu
(0.19 lb/MW-hr)
0.01 lb/MMBtu
(0.09 lb/MW-hr)
0.002 lb/MMBtu
(0.017 lb/MW-hr)
to be determined
to be determined
500 ppm sulfur
compounds emissions,
expressed as SO2
0.05 gr/dscf corrected to
standard conditions
and averaged
over 3 hours
20% averaged
over any 6 consecutive
minutes State Emission Limits
NA NA
18 AAC 50.055(c)
18 AAC 50.055(b)
NA NA
18 AAC 50.055(a)(1)
160 ng/J (1.3 lb
NOx/MW-hr) gross energy output
110 ng/J (0.9
lb/MW-hr) gross
energy output
Federal Emission Limits if ≤ 1/3 Power Sales 40 CFR
60 Subpart KKKK (as proposed)
NA
40 CFR 60 Subpart KKKK (as proposed)
NA NA NA NA
130 ng/J (1.0 lb
NOx/MW-hr) gross energy output
180 ng/J (1.4
lb/MW-hr) gross
energy output
18 ng/J (0.14
lb/MW-hr) gross
energy output
-OR-
6.4 ng/J (0.015
lb/MMBtu) heat input
20 × 10−6 lb/MW-hr
(0.020 lb/GW-hr)
gross energy output
20% averaged
over any 6 consecutive
minutes
Federal Emission Limits if > 1/3 Power Sales (not the Design Basis, but included for informational purposes) 40 CFR 60
Subpart Da (as final)
NA
40 CFR 60 Subpart Da (as final)
40 CFR 60 Subpart Da (as final)
NA
40 CFR 60 Subpart Da (as final)
40 CFR 60 Subpart Da (as final)
The IGCC plant will also be subject to 40 CFR 60 Subpart Y for Coal Preparation Plants because it processes more than 200 tons per day of coal. This subpart limits particulate emissions and opacity from thermal dryers, pneumatic coal cleaning equipment, coal processing and conveying equipment, coal storage system, or coal transfer and loading system processing coal.
The IGCC plant will be subject to 40 CFR 60 Subpart KKKK (as proposed) rather than 40 CFR 60 Subpart Da (as final on February 28, 2006) because the facility will not be supplying more

120
than one-third of its potential electric output capacity and more than 25 MW net-electrical output to any utility power distribution system for sale. Hence, the IGCC plant will not considered an electric utility steam generating unit. Subpart Da has a more stringent NOx limit, less stringent SO2 limit, as well as limits for PM, mercury, and opacity as shown in the table above.
If the IGCC plant is not an electric utility steam generating unit (i.e., ≤ 1/3 power sales and subject to 40 CFR 60 Subpart KKKK) and the IGCC plant and Agrium’s combined emissions are in excess of the HAPs threshold (i.e., over 10 tons per year for a single HAP or 25 tons per year of total HAPs), then the facility would be subject to 40 CFR 63 Subpart YYYY. Subpart YYYY limits formaldehyde emissions to 91 ppbvd at 15% oxygen. Whereas, if the facility was subject to 40 CFR 60 Subpart Da, then 40 CFR 63 Subpart YYYY would not apply.
Because the Claus sulfur recovery plant is less than 20 long tons per day (i.e., long ton equals 2,240 pounds), it is exempt from 40 CFR 60 Subpart J for Petroleum Refineries.
Comparing the emission factors with the applicable limits demonstrates that the designed IGCC plant will comply with state and federal limits with the exception of mercury. As stated earlier, the mercury emission factors were unknown and the IGCC plant would have to be designed to meet the federal limit if applicable. The sulfur impregnated activated carbon system that is proposed can reduce mercury emissions by 90 to 95%.
Other applicable limits that would be developed include:
• Best Available Control Technology (BACT) Limits for NOx, SO2, and PM-10 (i.e., for the major modification route) – determined by ADEC. According to EPA, selective catalytic controls are not currently BACT for IGCC plants. Therefore, the BACT limits would be representative of the emissions with no controls. Compliance would most likely be determined after installation with source testing. However, if PM-10 BACT is determined to be a surrogate opacity limit, then visible emission observations would be the compliance mechanism.
• Owner Requested Limits for NOx, SO2, and PM-10 (i.e., for the minor permit route) – the owner requested limits are usually based on limited hours per year a unit can operate, or the gallons per year of fuel consumption, which would restrict the tpy emitted. Compliance would most likely be determined by periodic monitoring of operating hours or fuel consumption.
• Ambient Air Quality Limits – the ambient air quality limits are derived from the modeling analysis. Compliance would most likely be determined by periodic monitoring.
5.1.4 Air Emissions Conclusion The easiest, fastest, and most cost effective way to obtain air quality permitting for the IGCC project at Agrium would be the minor permit route. However, this entails offsetting emissions from Agrium and the IGCC project, which may not be possible, in order for total project emissions to be less than the significant emission levels that trigger major modification. The savings would be from having no requirements for pre-construction air quality monitoring, post construction air quality monitoring, best available control technology review, impact analyses, and potentially for ambient air quality modeling. Nonetheless, both permitting options are obtainable and the IGCC plant appears to meet state and federal limits.

121
5.1.5 Case 2 – Addition of Coal Fired Boiler Case 2 involves coal gasification with a coal fired power plant, steam turbine, and generator. Because the Design Basis did not include emission factors, this section will only provide the limits applicable this system. Applicability is based on a 172 MW plant size as provided in the Design Basis with power sales of 12 MW (i.e., less than one-third of its potential electric output capacity). Additional limits may apply if the facility is considered a Hazardous Air Pollutant (HAP) major facility – these limits are included in the table below.
NOx CO SO2 PM-10 VOC Hg Opacity
500 ppm sulfur
compounds emissions,
expressed as SO2
0.05 gr/dscf corrected to
standard conditions
and averaged
over 3 hours
20% averaged
over any 6 consecutive
minutes State Emission Limits
NA NA
18 AAC 50.055(c)
18 AAC 50.055(b)
NA NA
18 AAC 50.055(a)(1)
270 ng/J (2.1
lb/MW-hr) gross
energy output
-OR-
86 ng/J (0.2 lb/MMBtu) heat input
87 ng/J (0.2 lb/MMBtu) heat input
Federal Emission Limits if ≤ 1/3 Power Sales
40 CFR 60 Subpart Db
NA
40 CFR 60 Subpart Db
13 ng/J (0.03
lb/MMBtu) heat input
NA NA NA
Federal Emission Limits if HAP Major
400 ppm at 7% O2, dry
basis
0.025 lb/MMBtu heat input
30 × 10−7
lb/MMBtu heat input
Hydrogen Chloride
0.02 lb/MMBtu heat input
The state has additional particulate emission limits for coal preparation plant’s thermal drying units and pneumatic coal-cleaning units in 18 AAC 50.055(e). In addition, the plant will also be subject to 40 CFR 60 Subpart Y for Coal Preparation Plants because it processes more than 200 tons per day of coal. This subpart limits particulate emissions and opacity from thermal dryers, pneumatic coal cleaning equipment, coal processing and conveying equipment, coal storage system, or coal transfer and loading system processing coal.

122
It is likely that without mercury and hydrogen chloride controls that the plant would be HAPs major and subject to both sets of federal limits described in the table above.
Other limits that would be developed in the permitting of the plant are similar to those described in Section 5.1.3.
5.2 Solid and Hazardous Waste The project will generate several new solid and hazardous waste streams during construction and operation, and will require handling and storage of non-hazardous and hazardous materials. Existing permits will have to be modified or new permits will have to be obtained from State of Alaska resource agencies, and possibly several federal agencies.
Non-hazardous wastes include:
• Construction debris (grubbing, packaging, litter, etc.) will be generated by constructing all of the new facilities. This debris can be disposed of as a solid waste at existing permitted solid waste disposal facilities.
• “Clean” demolition debris will be generated by demolishing some of the existing infrastructure at the Agrium facility. Clean demolition debris is material that does not contain asbestos. Handling options include segregating and recycling, or disposal at existing permitted solid waste disposal facilities.
• Coal slag from the gasifier (and CFB in Case2) could be marketed as an aggregate or disposed of by landfill.
• Fly ash from the gasifier (and CFB in Case 2) can be reused or disposed of by landfill.
• Sulfur will be generated from the hydrogen feed stock (used in the Agrium KNO facility). Reuse or disposal options are undefined at this time.
Marketing some of these wastes for reuse may be possible (slag and fly ash for use in concrete, sulfur for sulfuric acid, catalyst wastes recycled as micronutrient fertilizer). Disposal in approved landfills and/or in monofills is also an option. Mercury content of slag and fly ash could become a regulatory issue for reuse or disposal in the future.
IGCC operations will require storing and handling several hazardous materials and will also generate several new hazardous wastes. Hazardous materials to be used at the facility include chilled methanol, sodium hydroxide, sulfuric acid, caustic soda ash and potassium permanganate. All will require transporting, storing and tracking as hazardous materials.
Potential hazardous wastes include:
• Spent filter elements and media including spent carbon containing mercury (some are hazardous).
• Spent catalyst wastes for unspecified disposal (hazardous).
• Metals, salts, and sludge from water treatment (and possibly a cooling tower) as well as amines used to capture CO2 (potentially hazardous).

123
• Asbestos containing materials (ACMs) classified as a hazardous waste may also result from demolition of Agrium KNO structures. Disposal options for ACMs include segregating and disposing in an approved landfill.
The project will also require that about 225,000 tonnes of coal be stored at the IGCC facility to avoid product and power disruption.
5.3 Water and Wastewater The proposed project has water supply and wastewater disposal requirements that would require a number of federal, state and borough environmental permits. These permits can generally be classed in three groups:
• Process Water Supply – Process water is available from existing or new wells at a flow rate of 1,500 gpm. Well installation and additional groundwater withdrawal would require permitting, and additional groundwater supply may require evaluation of saltwater intrusion to groundwater reservoirs.
• Wastewater Discharges – Construction of the gasifier and turbines, and required changes to Agrium facilities and operations, will likely require modification of the facility’s existing wastewater treatment systems and its existing NPDES permit. Proposed facilities and operations that could result in surface water discharges to be reviewed under NPDES regulations include domestic wastewater, storm water runoff, coal, and slag storage facility effluent, cooling blow down, industrial process wastewater, and reverse osmosis (RO) brine. These effluents typically contain salts, minerals, sulfide, chloride, ammonium and cyanide (Ratafia-Brown 2002). The exact composition of wastewater discharges is unknown at this time. In general, wastewater streams would be treated to remove oil and solids prior to discharge. Advanced treatment for some contaminants may be required. Some waste streams could be disposed of by underground injection, requiring compliance with EPA’s UIC regulations. Total reuse of water is an additional option.
• Cooling Water Supply and Discharge – Cooling water requirements of 3,000 gpm may also be met by new wells if the additional capacity is available. As an alternative, cooling could be accomplished by a flow-through marine intake and discharge system. Any of these processes would result in additional regulatory requirements.
• Marine intake and discharge facilities would require an evaluation of impacts to fish and other marine organisms via Clean Water Act Section 316 (a) and (b) studies, which may require time-consuming environmental studies.
• Intake and discharge of heated marine water would impact Essential Fish Habitat in Cook Inlet and would trigger an evaluation by the National Marine Fisheries Service. Essential Fish Habitat in the project area in Cook Inlet includes migration and feeding habitats for adults and juveniles of all five salmon species (coho salmon, Chinook salmon, chum salmon, pink salmon and sockeye salmon); Dolly Varden; walleye pollock; Pacific cod; flatfish; and sculpins.
•
124
5.4 Site and Dock Modifications The proposed project includes site development and modification of existing dock facilities.
• Site redevelopment/new site development – The south portion of the existing Agrium facility will be redeveloped and new development could occur on vacant parcels of land located south and east of the Agrium facility. The redevelopment site will require demolition and removal of existing structures and Phase 2 level environmental analysis to determine if contaminants remain. Prior to redevelopment, any remaining contaminants may be subject to additional remedial actions to prepare the site for reuse.
• The vacant parcels located south and west of the existing facility should be screened for contaminants (Phase 1 Environmental Investigation), fish and wildlife habitat characteristics, presence of wetlands and cultural resource sites. The presence of these features could result in environmental permit requirements.
• Dock Modification - The existing Agrium KNO marine terminal facility would be modified to accommodate berthing of barges for delivery and off-loading of coal. Modification of the existing dock would require federal and state permits that would consider the effects on fish and wildlife, water quality, hydrodynamics, erosion and sedimentation processes, navigation and sea ice management. The addition of tug fueling or sewage pump-out facilities to the marine facility could require additional permits.
• Dock modifications and dredging to accommodate coal barges would require a USACE permit and would trigger evaluations by National Marine Fisheries Service for Essential Fish Habitat impacts and potential impacts to marine mammals (Marine Mammal Protection Act). If Cook Inlet beluga whales (currently listed as a Candidate species and under status review) become listed as threatened or endangered, the Endangered Species Act would also be applicable. The U.S. Fish and Wildlife Service would review potential impacts to marine birds, shorebirds, waterfowl and Steller’s eiders in accordance with the Fish and Wildlife Coordination Act and Endangered Species Act.
5.5 Coal Marine Transport At 10,000 tonnes/day coal delivered to the IGCC plant, a minimum of two and a maximum of six barge deliveries per day would be required depending upon the point of origin (Seward or Ladd) and barge capacities. Coal delivered via Ladd would require two barges per day. Coal delivered via Seward would require four to six barges per day.
Coal transport in itself would not require environmental permits; however, agency review of the dock modification permit application may include consideration of potential impacts associated with coal transport. Depending on the transportation route, either across Cook Inlet from the Chuitna Mine site or around the Kenai Peninsula from the Seward coal dock, different species and habitats would be of concern.
5.5.1 Transport Across Cook Inlet
• Cook Inlet beluga whales (NMFS “depleted” stock and Candidate Species) would be of primary concern as this route crosses habitats used by beluga whales during winter. Beluga whales also move through the project area into High Value/High Sensitivity

125
Habitats used for calving and feeding in the Northern Inlet at Chickaloon Bay, Cairn Point and Susitna Delta. Cook Inlet beluga whales are currently under review for potential listing under the Endangered Species Act because this stock has not recovered despite cessation of subsistence harvest, which was identified as the primary factor in their decline.
• Barge traffic could potentially interference with subsistence, sport and commercial salmonid fisheries in the upper inlet (upper end of the east tide rip)
• Spills in this transportation corridor may impact important anadromous fish migration and feeding habitats; tidal shorebird migration staging habitats in Trading and Redoubt Bays; and waterfowl habitats.
5.5.2 Transport From Seward
• Beluga whales would be a concern as this route crosses feeding and coastal migration habitats at the mouth of the Kenai River and along the Kenai Peninsula shoreline.
• The barge route around the Kenai Peninsula from Seward to Nikiski would pass through the Alaska Maritime National Wildlife Refuge.
• The barge route around the Kenai Peninsula from Seward to Nikiski through the Kennedy Entrance to Cook Inlet crosses designated critical habitat for Steller sea lions (NMFS Threatened Species); habitats around the Barren Islands used by humpback whales (NMFS Endangered Species); winter ranges used by Steller’s eider (USFWS Threatened Species); marine foraging habitats important to the Kittlitz’s murrelet (USFWS Candidate Species); spring and fall migration routes of grey whales (NMFS Delisted); and may encounter short-tailed albatross (USFWS Endangered Species).
• Spills during coal transportation could impact areas used by pelagic seabirds (500-1500 seabirds/km2), and designated Essential Fish Habitat for weathervane scallops, yellowfin sole, skate. walleye pollock eggs and larvae, Pacific halibut, and forage species.
• Barge traffic could interfere with subsistence, sport and commercial fisheries throughout Cook Inlet (especially the mouth of the Kenai River and across Cook Inlet tide rips).
5.6 National Environmental Policy Act (NEPA) Compliance The National Environmental Policy Act (42 U.S.C. § 4321 et seq.), (NEPA) assures that information on the environmental implications of a federal or federally-funded action is available to public officials and citizens before making decisions or taking actions.
Actions having the potential to significantly impact the environment must be evaluated by federal agencies to determine the environmental consequences, identify reasonable alternatives and document the environmental analysis. One of the involved agencies must prepare an Environmental Assessment (EA) or Environmental Impact Statement (EIS) prior to any of the agencies issuing permits or other approvals for the project. Federal actions that could trigger the preparation of an EA/EIS include:
• Federal funding or loan guarantees by the Department of Energy (DOE),

126
• Modification of the existing NPDES permit to accommodate facility modification and construction of the new project and /or permitting of injection wells under UIC regulations (Environmental Protection Agency),
• Modification of the dock or installation of a cooling water intake/outfall (U.S. Army Corps of Engineers).
NEPA Compliance and Consultation
Document 3 Agency
Draft/Final EIS Preparation NEPA Compliance EPA, USACE or DOE
Section 106 Consultation Section 106 NHPA EPA, USACE, ADNR
Section 7 Consultation Section 7 ESA USFWS
Essential Fish Habitat Magnuson Act NMFS
Marine Mammals Protection Plan
Marine Mammals Protection Act
NMFS
When preparing an EA or EIS, the federal agency must consider not only the IGCC Project (gasifier, turbines, Agrium facility modifications and coal transport), but Connected Actions and Cumulative Impacts that are related to the project.
• Connected Actions: Actions by others that are required for the Proposed Project to operate, and actions that will result from construction and operation of the Proposed Project.
• Cumulative impacts: Impacts resulting from other past, present, and reasonably foreseeable actions in the project area. 5.7 Applicable Environmental Permits
Below is a summary of key federal, state and borough environmental permits that may be required for various aspects of the proposed project. A more comprehensive and descriptive list of applicable federal, state and local permitting activities is included in Appendix A. The potential applicability of listed regulations is based up the current level of detail regarding design and operation of the proposed IGCC facility, and would be subject to revision based upon further project planning and design.
Summary of Federal, State and Borough Environmental Permits
Major – Primary Permits/Approvals Minor – Administrative Permits/Approvals
Medium Major Minor Agency
Air ACMP –Permit to Construct and operate (New and Modification)
Open Burning Permit (Construction)
ADEC

127
Summary of Federal, State and Borough Environmental Permits
Major – Primary Permits/Approvals Minor – Administrative Permits/Approvals
Medium Major Minor Agency
NPDES SPCC Plan EPA
Section 401 Certification Solid Waste Plan ADEC
Certification of Reasonableness – 402/404
SPCC Plan ADEC
Injection Well Permit EPA Water/Wastewater
316 (a) & (b) Cooling Water Intake and Outfall
EPA or ADEC
CWA Section 404 USACE Navigable Waterways/Waters of the U.S.
Rivers & Harbors Section 10
USACE
Water Rights Appropriation ADNR Water Supply
Water Supply Permit ADEC
Title 41 Permit ADNR
Fish Passage ADNR Ecology Fishery Research. (Field
Studies) ADF&G
Hazardous Waste Permit EPA Solid/Hazardous Waste Haz. Waste
Transportation U.S. DOT
Coastal Zone Consistency ADNR,
Kenai Borough Land Use
Driveway Permit ADOT
5.7 Summary An analysis of the current design basis indicates that a proposed IGCC facility at the Agrium Kenai Plant is feasible in terms of current environmental permitting and compliance requirements imposed by federal, state and local regulations. Detailed environmental compliance strategies and mitigation measures would need to be developed in concert with design details and operational plans.

128
6. SUMMARY AND CONCLUSIONS
6.1 Coal and Limestone Supply • As summarized in Section 2.1, there are sufficient coal supplies to provide feedstock to
the Agrium plant.
• The delivered cost of coal is estimated to be:
o From the Chuitna Mine via Ladd Landing - $1.84 to $1.99/MMBtu.
o From Usibelli Mine via Anchorage - $1.96 to $2.11/MMBtu.
o From Usibelli Mine via Seward - $2.58 to 2.73/MMBtu.
• There is sufficient limestone available from the Alaska Lime Mine in Cantwell to supply the plant (Case 2) at an estimated delivered cost of $114/tonne via Anchorage or $121/tonne via Seward.
6.2 Product Markets 6.2.1 By-Product Markets As summarized in Section 2.3, there are local and export markets well defined for most of the potential by-products from the plant. F-T diesel and other CTL products are the least defined and at this time the most unpredictable
6.2.2 Impact on Natural Gas Markets Within the range of options considered in this analysis, the impact on the South Central Alaska natural gas supply/demand will not change from that predicted by the natural gas market needs assessment90.
6.2.3 Impact on Power Markets Within the range of options considered in this analysis, the impact on the South Central Alaska electric power supply/demand will not change from that predicted by the natural gas market needs assessment.
6.3 CO2 EOR and Sequestration The sequestration of excess amounts of CO2 produced by the proposed coal gasification plant in the Nikiski area of the Kenai Peninsula was reviewed in Section 2.4, from the aspect of how and where that volume of gas might be stored and what the potential consequences are. The conclusions reached are as follows.
• Sequestration of CO2 can occur in several ways, including injection into the subsurface, oceanic disposal, and chemical reactions to bind the CO2 in non-reactive minerals and bury the products.
90 Thomas, C.P. and C. Ellsworth, et al, RDS, “Gas Needs and Market Assessment - Alaskan Spur Pipeline Project” Contract No. DE-AM26-04NT41817, Task 211.01.06, completed in June, 2006.
129
• In the case of the coal gasification facility, the options appear to be limited to one of more of the subsurface injection scenarios – enhanced oil recovery, enhanced gas recovery, enhanced coal bed methane recovery, or injection into saline aquifers.
• Enhanced oil recovery and injection into saline aquifers are the only two methods that are adaptable to the local realities.
• There are more than 70 CO2-EOR programs worldwide and the process works regardless of reservoir lithology. Expected incremental oil recovery is 8 to 11% of OOIP or approximately 25% of cumulative production.
• There is only one large-scale saline aquifer injection program, offshore Norway, and it is viable only because of the $55.00/ton tax on polluting CO2. The taxes would be $110,000/day. Such a program in the Cook Inlet area would require a significant subsidy or tax break.
• There are more than a dozen reservoirs, primarily the Hemlock and Tyonek producing intervals in the five major fields of Cook Inlet that pass the screening criteria for miscible CO2 floods.
• Using the average range of incremental increase in production (8 to 11%), the five major Cook Inlet oil fields have the potential to produce an incremental 290 to 400 MMbo. Using only the major reservoirs and a 25% of cumulative production estimate, the incremental production would be approximately 300 MMbo.
• Screening level economics performed for the McArthur River field suggest that an economic CO2 flooding program in Cook Inlet’s oil fields might be possible at oil prices greater than $35 to $40 per barrel with the cost of CO2 ranging from $0.50/Mcf to $1.20/Mcf.
• The results of a successful flooding program could extend the life of the oil fields for 20 or more years and yield as much incremental oil as has been produced in the last quarter century
• If a CO2-EOR program were not developed and sequestration of excess CO2 was mandated by law, there would be a need for a strong subsidy or the entire coal gasification program may be burdened to the point where it had questionable economic value.
• There are highly porous and permeable saline aquifers at shallow depths and within close proximity of the proposed gasification plant. There would be a need to verify that any potential storage interval did not contain potable water, had adequate seals, and was not extensively faulted (to prevent leakage).
• There is some potential to use exhausted gas reservoirs for sequestration. These would be more cost effective and much of the required infrastructure exists. However, none are expected to be abandoned until 2015 or later.
These conclusions and their potential use are not based on the knowledge of the volumes of CO2 required for EOR purposes, the costs involved, or the willingness of the field operators to participate in a CO2-EOR program. The evaluation reflects only the effectiveness of CO2

130
flooding, the applicability of miscible and/or immiscible CO2 to the reservoirs of the Cook Inlet oil fields, and the potential volumes of oil resulting from such an enhanced oil recovery effort.
6.4 Plant Design Phase 1 assessed two alternative design configurations for meeting the KNO requirements:
• Case 1: Process the syngas from the gasification plant to supply required hydrogen and nitrogen to the KNO ammonia synthesis loop compressor and produce sufficient steam and power for the KNO needs.
• Case 2: Process the syngas from the gasification plant to supply required hydrogen and nitrogen to the KNO ammonia synthesis loop compressor, but do not produce power from a gas turbine. Rather, independently produce the required steam for the KNO facility.
• Six gasification technologies were considered for this study, and the ConocoPhillips E-Gas technology was ultimately selected as the best choice.
6.5 Economic evaluation • For Case 1 (IGCC based) the IRR is 11.1%
• For Case 2 (Hydrogen and CO2 Production Without Sequestration or Power Production) the IRR is 6.0%
• Case 1 possesses superior financial potential relative to Case 2. While both cases produce enough raw materials necessary for ammonia and urea production at the Agrium facility, Case 2 is more expensive, produces less export power, and requires slightly more coal feed in order to do so. Removal of the gas turbine from Case 1 and replacement in Case 2 with a CFB and a larger steam turbine to supply the necessary feedstocks to the Agrium plant does not appear to be economically justified.
• Sensitivity analysis was performed on all model inputs in both cases. The items found to have the greatest impact on the financial results are the plant EPC cost, system availability, ammonia/urea prices, and delivered coal cost. These inputs were clearly the most influential on the financial outcomes
• The model input that has the potential to most impact the project economics is the ammonia/urea price because of the very wide range of potential values.
6.6 Environmental Permitting An analysis of the current design basis indicates that a proposed IGCC facility at the Agrium Kenai Plant is feasible in terms of current environmental permitting and compliance requirements imposed by federal, state and local regulations. Detailed environmental compliance strategies and mitigation measures would need to be developed in concert with design details and operational plans.

131
7. REFERENCES Advanced Resources International, Inc., 2005, “Basin Oriented Strategies for CO2 Enhanced Oil Recovery – Alaska”, prepared for U. S. Department of Energy, Office of Fossil Fuel-Office of Oil and Natural Gas, 72 p.
Alaska Department of Natural Resources, 2005, “Prevention and Emergency Response Subarea Plan Maps –Cook Inlet”, [http://www.asgdc.state.ak.us/maps/cplans/subareas.html#cook] Accessed on 24 January 2006.
Alaska Division of Oil and Gas, 2004, “Alaska Historic and Forecast Oil and Gas Production”, Alaska Department of Natural Resources, Alaska Division of Oil and Gas, 2004 Annual Report, 4-1 – 4-27 pp..
Alaska Oil and Gas Conservation Commission, 2003, “Field and Pool Summary”, Alaska Oil and Gas Conservation Commission, 2003 Annual Report, 110-390 pp.
Alaska Oil and Gas Conservation Commission, 2006, “Summary by Pool, Oil and NGL”, December, 2005.
Anadarko Petroleum Corporation, 2005, “Global Activities – CO2 Sequestration”, http://www.anadarko.com/global_activities/north_america
Augustsson, H., and Grinestaff, G. H., 2004, “A Study of IOR by CO2 Injection in the Gullfaks Field, Offshore Norway”, SPE/DOE Fourteenth Symposium on Improving Oil Recovery, Tulsa, Oklahoma, April 17-21, 2004, 14 p.
Bachu, S., and Adams, J. J., 2003, “Sequestration in Geological Media in Response to Climate Change – Capacity of Deep Saline Aquifers to Sequester CO2 in Solution”, Energy Conversion and Management, Vol. 44, Issue 20, December, 2003, 3151-3175 pp.
Bartlett, K., Pinsker, L., Reed, C., White, C., LaSota, K., and Jones, R., 2003, “Demonstrating Carbon Sequestration”, Geotimes, March 2003.
Beechy, D. J., 2005, “Opportunities for Increasing Revenues from State and Federal Lands – Pursuing the “Stranded Oil” Prize”, Eastern Lands and Resources Council and Western States Lands Commissions Association, Joint Spring Conference, Washington, DC, April 17-20, 2005.
Birch, Collin; “The Market for GTL Diesel”, Petroleum Economist, 70, 3, s27(3), March, 2003
Burruss, R. C., and Brennan, S. T., 2004, “Task 2: Sequestration Storage Capacity of Subsurface Traps”, U. S. Geological Survey, CO2 Sequestration Project, http://energy.er.usgs.gov/projects/co2_task2.htm.
Buschkuele, B. E., and Perkins, E. H., 2005, “Mineralogy and Geochemical Trapping of Acid Gas in the Edmonton Area of Central Alberta, Canada”, Alberta Energy Board, 9 p.
Caswell, J.W. Alaska Lime Company, Private Communication, February 24, 2006.
Center for Energy and Environmental Studies, 1997, “Fuels Decarbonization and Carbon Sequestration—Report of a Workshop”, ed., Socolow, R., PU/CEES Report 302, School of Engineering and Applied Science, Princeton University http://www.princeton.edu/~ceesdoe/

132
Christopher, C. A., Fox, C. E., and Avasthi, S. M., 2005, “Geological Sequestration of CO2”, Society of Petroleum Engineers, Continuing Education Short Course Notes, Dallas, Texas, November 29-30, 2005.
Coal Gasification Guidebook: Status, Applications and Technologies, 1993, EPRI TR-102034s
Commodity Derivatives Group, 2004, “Enhanced Oil Recovery CO2 Flood”, Harris Nesbitt BMO Financial Group, Presentation, 18 slides.
Cuthbert, Nigel; “Markets for GTL Products”, Petroleum Economist, 70, 3, s24(3), March, 2003
DOE Report, “Utilization of Lightweight Aggregates Made from Coal Gasification Slags”.
DOE/EIA-0529(97), Glossary, U.S. Coal Reserves: 1997 Update, February 1999 Flores, R.M., Stricker, G. D., and Kinney, S. C., 2004, “Alaska Coal Geology, Resources, and Coalbed Methane Potential”, U. S. Geological Survey, DDS-77, 125 p.
Gavin, James; “Diesel Drives GTL Growth”, Petroleum Economist, 71, 5, 30(1), May, 2004
Hite, D. M., 1976, “Some Sedimentary Aspects of the Kenai Group, Cook Inlet, Alaska”, in Miller, T. P., ed., Recent and Ancient Sedimentary Environments in Alaska: Proceedings, Alaska Geological Society Symposium, April 2-4, 1975, Anchorage, Alaska, Alaska Geological Society, I1-I23 P.
Hoaoe, Tomoka; “Asian Markets Present Little Near-Term Opportunity for GTL Fuels”, Oil and Gas Journal, 100, 8, 62(2), February 25, 2002
House, N. J., Faulder, D. D., Olson, J. L., and Franchi, J. R., 2003, “Simulation Study of CO2 Sequestration in a North Sea Formation”, Paper SPE 81202, SPE/EPA/DOE Exploration and Production Environmental Conference, San Antonio, Texas, March 10-12, 2003, 7 p.
Index Mundi, “U.S. Imports of Elemental Sulfur, by Country”, 2005 < http://www.indexmundi.com/en/commodities/minerals/sulfur/>
Index Mundi, “Masonry Cement Production and Stock in the United States, by District”, 2005 < http://www.indexmundi.com/en/commodities/minerals/cement/>
Integrated Concepts and Research Corporation (ICRC), “Production and Demonstration of Synthesis Gas-Derived Fuels”, NETL Contract DE-FC26-01NT41099 Jansen, J., Lynden Transport, Private Communication, December 5, 2005.
Klins, M. A., 1984, “Carbon Dioxide Flooding”, International Human Resources Development Corporation, 69 p.
Magoon, L. B., Anders, D. E., 1992, “Oil-to-Source-Rock Correlation Using Carbon-Isotopic Data and Biological Marker Compounds, Cook Inlet-Alaska Peninsula, Alaska”: in Moldowan, J. M., Albrecht, P., and Philip, R.P., eds., Biological Markers in Sediments and Petroleum, Englewood Cliffs, Prentice-Hall, 241-274 p.
McKinnnon, John, Deputy Commissioner of Transportation and Public Facilities, private conversation; March 5, 2006

133
Melzer, S., 2005, “Oil and Gas Maximising Recovery Programmed (formerly SHARP) IOR Views”, Tenth Annual Carbon Management Workshop, December, 2004, Midland, Texas, USA, DTI Oil and Gas, Issue 10, June, 2005.
Minerals Management Service, Alaska OCS Region. 2003. Cook Inlet Planning Area, Oil and Gas Lease Sales 191 and 199. Final Environmental Impact Statement. MMS 2003-055. Available at [http://www.mms.gov.alaska/cprojec/Cook_Inlet/Cook Inlet Sale.htm].
National Energy Technology Laboratory, 2005, “DOE Research Helps put CO2 EOR Oil Production on Verge of Explosive Growth in the U. S.”, E and P Focus, Vol. 1, No. 2, 8 p.
National Marine Fisheries Service. NOAA Fisheries -- Essential Fish Habitat, Alaska Region [http://akr-mapping.fakr.noaa.gov/Website/EFH/viewer.htm?simple] accessed and queried 26 January 2006.
National Marine Fisheries Service. 2005. “Draft conservation plan for the Cook Inlet beluga whale (Delphinapterus leucas)”, National Marine Fisheries Service, Juneau, Alaska.
Nelms, R. L., and Burke, R. B., 2004, “Evaluation of Reservoir Characteristics to Assess North Dakota CO2 Miscible Flooding Potential”, 12th Williston Basin Horizontal Well and Petroleum Conference, May 2-4, 2004, Minot, North Dakota, 11 p.
“Obstacles to Alternative Fuels, Iran Daily”, Global Energy, October 03, 2005 <http://www.iran-daily.com/1384/2391/html/energy.htm#s95580>
Ogawa, Yoshiki, “Benefits of Gas Replacing Oil Products”, Qatar Petroleum, 2004
Oil and Gas Journal, 2005a, “Oklahoma’s Postle Field due Expansion”, Oil and Gas Journal, September 19, 2005.
Oil and Gas Journal, 2005b, “Weyburn Project Illustrates CO2 Sequestration”, Oil and Gas Journal, November 21, 2005, p. 5.
Petroleum News, 2005, “Squeezing More Oil out of Aging Fields”, Petroleum News, Vol. 10, No. 35, August 18, 2005, p. 9.
Preuss, P., 2001, “Storing CO2 Underground – One option for Mitigating Greenhouse Gases”, Science Beat, Berkeley Lab, 4p. (http://enews.lbl.gov/Science-Articles/Archive/terr-sequ.html
Petroleum Technology Transfer Council, 2005, “CO2 Flooding Increases Recovery”, from Carbon Dioxide Injection for Enhanced Oil Recovery, (a summation of workshops), http://www.pttc.org/solutions/12.htm
PTTC Texas, 2005, “Reserve Growth Potential from CO2 Enhanced Oil Recovery Along the Gulf Coast”, Gulf Coast Center, University of Texas Bureau of Economic Geology and PTTC Texas Region, Workshop, Houston, Texas, December 13, 2005.
Ratafia-Brown, J., L. Manfredo, J. Hoffmann, and M. Ramezan. 2002. “Major Environmental Aspects of Gasification-Based Power Generation Technologies”, Final Report prepared by Science Application International Corporation for U.S. Department of Energy, Office of Fossil Energy, National Energy Technology Laboratory [http://www.netl.doe.gov/].

134
Stiles, R.B. 2005. “Development Status Chuitna Coal Project”, Presentation to Alaska Support Industry Alliance Kenai Chapter, Kenai, Alaska, November 22, 2005. Available at [http://www.cookinletoilandgas.org/PowerPoint%20Presentations/PDF%20Versions/Alliance%20Presentation.pdf] Accessed on 12 January 2006.
Stiles, R. B., DRven, “Alaska Coal Resources, Projects & Infrastructure”, June 1998.
Stiles, R. B, PacRim Coal, “Chuitna Mine Development Plan”, Executive Summary, May 2003.
Silverstein, S., Alaska Railroad Corporation, Private Communication, December 21, 2005.
Taber, J. J., Martin F. D., and Seright, R. S., 1996, “EOR Screening Criteria Revisited”, Society of Petroleum Engineers”, SPE 35385, Proceedings, SPE/DOE Tenth Symposium on Improved Oil Recovery, Tulsa, April 21-24, 1996.
Thackeray, Fred; “Fischer-Tropsch GTL Arrives – Almost”, Petroleum Economist, 68, 9, 22, Sept., 2001
Thomas, C.P., R. B. Allaire, T. C. Doughty, D. D. Faulder, J. S. Irving, H. C. Jamison, and G. J. White, 1993, “Alaska North Slope National Energy Strategy Initiative: Analysis of Five Undeveloped Fields”, DOE/ID/01570-T164, U.S. Department of Energy, May.
Thomas, C. P., Doughty, T. C., Faulder, D. D., and Hite, D. M., 2004, “South-Central Alaska Natural Gas Study”: U. S. Department of Energy, National Energy Technology Laboratory, Arctic Energy Office, 207 p.
Thomas, C. P., T. C. Doughty, D. D. Faulder, W. E. Harrison, J. S. Irving, H. C. Jamison, and G. J. White, 1991, “Alaska Oil and Gas: Energy Wealth or Vanishing Opportunity?”, DOE/ID/ 01570-H1, U.S. Department of Energy, January, 278 p.
Thomas, C.P. and C. Ellsworth, et al, RDS, “Gas Needs and Market Assessment - Alaskan Spur Pipeline Project”, Contract No. DE-AM26-04NT41817, Task 211.01.06, completed in June, 2006.
Tinker, S. W., and Williams, M. L., 2005, “Enhanced Oil Recovery”, FutureGen Texas, www.beg.utexas.edu/futuregentexas
U.S. Geological Survey, January 2006, “Mineral Commodity Summaries 2005”, U.S. Department of the Interior, U.S. Government Printing Office, Washington, DC < http://minerals.usgs.gov/minerals/pubs/mcs/2006/mcs2006.pdf> 44 – 45, 84 – 90, 92 - 93, 122 – 123, 142 – 143, 158 – 159, 164 - 165 pp.
U.S. Geological Survey Minerals Yearbook, 2004, “The Mineral Industry of Alaska”, Department of the Interior, U.S. Government Printing Office, Washington, DC
U.S. Geological Survey Minerals Yearbook, 2004, “Perlite”, Department of the Interior, U.S. Government Printing Office, Washington, DC
U.S. Geological Survey Minerals Yearbook, 2004, “Cement”. Department of the Interior, U.S. Government Printing Office, Washington, DC
U.S. Geological Survey Minerals Yearbook, 2004, “Sulfur”. Department of the Interior, U.S. Government Printing Office, Washington, DC

135
U.S. Geological Survey Minerals Yearbook, 2004, “Sand and Gravel, Construction”. Department of the Interior, U.S. Government Printing Office, Washington, DC U.S. Geological Survey Minerals Yearbook, 2004, “Iron and Steel Slag”, Department of the Interior, U.S. Government Printing Office, Washington, DC
U.S. Geological Survey, 2005, “CO2 Sequestration Project and Task Outline”, U.S. Geological Survey, CO2 Sequestration Outline, available at http://energy.er.usgs.gov/projects/co2_sequestration/co2
Usibelli web site (www.usibelli.com), 2005
Walter, K., 2000, “A Solution for Carbon Dioxide Overload”, Science and Technology Review, December, 2000.

136
Appendix A: Project Blue Sky

Agrium MEDIA ANNOUNCEMENT
Agrium to explore alternative feedstock for Kenai Nitrogen Operations
MA05-003 Date: November 16, 2005
Contact: Bill Boycott, General Manager Agrium Kenai Nitrogen Operations Phone (907) 776-3089
Lisa Parker , Government & Public Relations Phone (907) 776-3275
Contact us at: www.agrium.com KENAI, Alaska - Agrium U.S. Inc. (TSX and NYSE: AGU) annolUlced today thatinconjlUlction with industry partners it would conduct a feasibility study to evaluate the potential use of coal gasification as a feedstock for the Kenai Nitrogen facility.
The proposed gasification plant would use local low-sulphur coal to produce the feedstock needed for ammonia and urea production. It would also produce a significant amount of energy that could be sold into the Alaska power grid.
"We believe this proposal contains a lot of merit," said Bill Boycott, General Manager, Agrium Kenai Nitrogen Operations. "We plan on working with a nuniber of partners to evaluate the . potential to commercialize one of Alaska's largest natural resources in an environmentally responsible manner. This project would create an off-take gas agreement opportunity for Agrium and generate another source of competitively priced electricity into the power grid, if it were to proceed to completion. It would also provide excess C02 for use in the exploration of oil and gas and keep Alaska's largest value-added industry in business for decades to come."
Boycott said the company has been working with the U.S. Department of Energy and Alaska's Congressional Delegation. Senators Ted Stevens and Lisa Murkowski have been very supportive of the project. Other partners in the study include Usibelli Coal Mine and the' engineering firms Black & Veatch and Uhde. Agrium is in discussion with Shell for its proprietary coal gasification technology. The coal would be sourced from the Beluga Coal Field, located about 40 miles across Cook Inlet from the Agrium plant. The field contains more than two billion tons of proven reserves, making it one of the world's largest low-sulfur coalfields. The project name, Blue Sky, is in reference to the new environmentally friendly coal gasification process.
Agrium's Kenai operations consist of two ammonia plants and two urea plants. The facility could produce over 1.5 million product tormes if it were to operate at full capacity. The project could retain 230 direct jobs at Agrium and create additionaljobs at the coal gasification facility and related coal mine. The gasification facility could be in operation as early as 2011 if results from the analysis were positive.

Agrium is a leading global producer and marketer of agricultural nutrients and industrial products and a major retail supplier of agricultural products and services in both North and South America. Agrium produces and markets three primary groups of nutrients: nitrogen, phosphate and potash as well as controlled release fertilizers and micronutrients. Agrium's strategy is to grow through acquisitions as well as the development, commercialization and marketing of new products and international, opportunities.
Certain statements in this release constitute forward-looking statements. Such forward-looking statements involve known and unknown risks and uncertainties,. including those referred to in the management discussion and analysis section of the Corporation's most recent annual report to shareholders, which mqy cause the actual results, performance or achievements of the Corporation to be materially differentfrom any future results; performance or achievements expressed or implied by suchforward-Iooking statements. A number offactors could cause actual, results to differ materially from those in the forward-looking statements, including, but not limited to, the ultimate economic and technical feasibility of the project, government policy, energy prices, the future supply, demand and price levelfor nitrogen, thefuture gas prices and availability at Kenai, andfuture additionalfertilizer capacity and operating rates. Agrium disclaims any intention or obligation to update or revise any forward-looking information as a result of new information or future events ..
-30-

137
Appendix B: Chuitna Mine Development Plan Executive Summary

CHUITNA COAL PROJECT OVERVIEW The CHUITNA COAL PROJECT, a “Greenfield”, coal export development located on the west side of the Cook Inlet is approximately 80km (50 mi) west of Anchorage. The CHUITNA COAL PROJECT is composed of three major components: the CHUITNA COAL MINE, CHUITNA PROJECT INFRASTRUCTURE and LADD LANDING DEVELOPMENT.
CHUITNA COAL MINE The Chuitna Coal Mine, cornerstone of the Chuitna Coal Project, is based on a +1 billion metric ton (T) ultra low sulfur subbituminous coal reserve located within an 83.2km2 (20,571 acre) lease tract. The first area to be mined (LMU_1) in the lease tract will yield approximately 300 MMT of coal at a field average ratio of less than 5:1. The design installed production capacity for the LMU_1 is 12 MMTpy.
CHUITNA PROJECT INFRASTRUCTURE Chuitna Project Infrastructure is composed of four subcomponents: HOUSING & AIRSTRIP FACILITY: Single status
housing for the Project operating workforce and an airstrip for transport of personnel and small equipment to and from the Project Area. The Housing & Airstrip Facility will be located in close proximity to the Chuitna Coal Mine.
MINE ACCESS ROAD: An all weather road
connecting the Mine with Ladd Landing on the coast of the Cook Inlet, an approximately 20km (12 mi) distance. The road will be used during development/construction of the Chuitna Coal Mine and the Housing & Airstrip facility and
during operations to transport equipment and operating supplies to and from Ladd Landing.
COAL TRANSPORT CONVEYOR: A covered
overland coal transport conveyor with an annual throughput capacity of 15 MMTpy.
POWER TRANSMISSION FACILITY: A high voltage
transmission line from the nearby Beluga Power Station to Ladd Landing and the Mine.
LADD LANDING DEVELOPMENT
The Ladd Landing Development is composed of two subcomponents: LADD COAL EXPORT TERMINAL: A facility capable
of an annual throughput of 15 MMTpy with upland storage for a minimum of 250,000 Tons; an offshore vessel berth with an 18-20m (±60 ft) minimum draft and installed capacity to load ocean going vessels at approximately 75,000 to 80,000 Tons/day.
LADD LOGISTICS CENTER: The central receiving,
storage, warehouse, and logistics support facility for the Chuitna Coal Project. The Ladd Logistics Center will include a bulkhead structure with a 3 m (± 10 ft) minimum draft.
Alternative Access Corridors As can be seen in the adjacent figure PacRim Coal, LP (Applicant) has identified two potential access corridors: North Ladd Access Corridor and Ladd Access Corridor. The Mine Access Road, Coal Transport Conveyor and Power Transmission Facility will be located in either the North Ladd Access Corridor or the Ladd Access Corridor. The Applicant will select the preferred access corridor after selection of the 3rd Party contractor.
CCC HHH UUU III TTT NNN AAA CCC OOO AAA LLL PPP RRR OOO JJJ EEE CCC TTT
EXECUTIVE SUMMARY
PPPRRR OOO JJJ EEE CCC TTT OOO VVV EEE RRR VVV III EEE WWW CHUITNA COAL PROJECT
A “Greenfield” coal export development located in Southcentral Alaska. The
CHUITNA COAL PROJECT, located on the west side of the Cook Inlet is
approximately 80km (50 mi) west of Anchorage.
The CHUITNA COAL PROJECT is composed of three major components: the
CHUITNA COAL MINE, CHUITNA PROJECT INFRASTRUCTURE and LADD
LANDING DEVELOPMENT.
CHUITNA COAL MINE
The Chuitna Coal Mine, cornerstone of the Chuitna Coal Project, is based on a
+1 billion metric ton (T) ultra low sulfur subbitumenious coal reserve located
within an 83.2km2 (20,571 acre) lease tract. The first area to be mined
(LMU_1) in the lease tract will yield approximately 300 MMT of coal at a field
average ratio of less than 5:1. The design installed production capacity for the
LMU_1 is 12 MMTpy.
CHUITNA PROJECT INFRASTRUCTURE
Chuitna Project Infrastructure is composed of four subcomponents:
HOUSING & AIRSTRIP FACILITY: Single status housing for the Project
operating workforce and an airstrip for transport of personnel and small
equipment to and from the Project Area. The Housing & Airstrip
Facility will be located in close proximity to the Chuitna Coal Mine.
MINE ACCESS ROAD: An all weather road connecting the Mine with
Ladd Landing on the coast of the Cook Inlet, an approximately 20km
(12 mi) distance. The road will be used during
development/construction of the Chuitna Coal Mine and the Housing
& Airstrip facility and during operations to transport equipment and
operating supplies to and from Ladd Landing.
COAL TRANSPORT CONVEYOR: A covered overland coal transport
conveyor with an annual throughput capacity of 15 MMTpy.
POWER TRANSMISSION FACILITY: A high voltage transmission line
from the nearby Beluga Power Station to Ladd Landing and the Mine.
LADD LANDING DEVELOPMENT
The Ladd Landing Development is composed of two subcomponents:
LADD COAL EXPORT TERMINAL: A facility capable of an annual
throughput of 15 MMTpy with upland storage for a minimum of 250,000
Tons; an offshore vessel berth with an 18-20m (±60 ft) minimum draft
and installed capacity to load ocean going vessels at approximately
75,000 to 80,000 Tons/day.
LADD LOGISTICS CENTER: The central receiving, storage, warehouse,
and logistics support facility for the Chuitna Coal Project. The Ladd
Logistics Center will include a bulkhead structure with a 3 m (± 10 ft)
minimum draft.
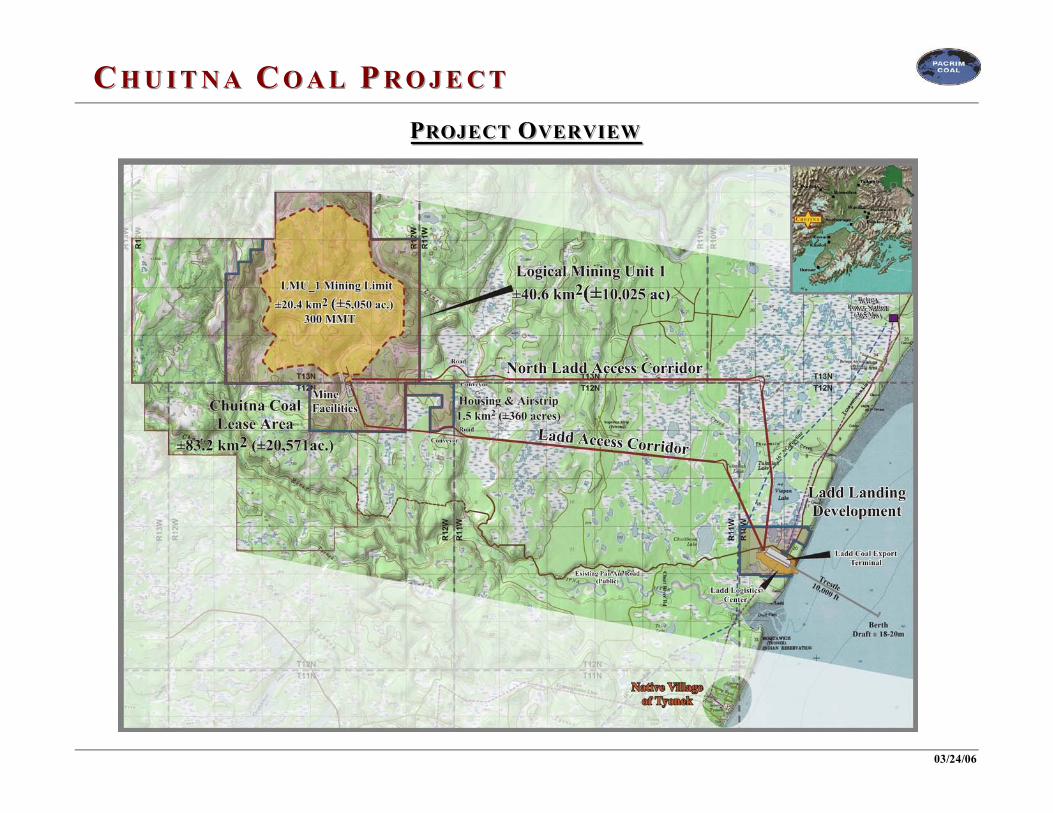
CCC HHH UUU III TTT NNN AAA CCC OOO AAA LLL PPP RRR OOO JJJ EEE CCC TTT
03/24/06
PPPRRR OOO JJJ EEE CCC TTT OOO VVV EEE RRR VVV III EEE WWW
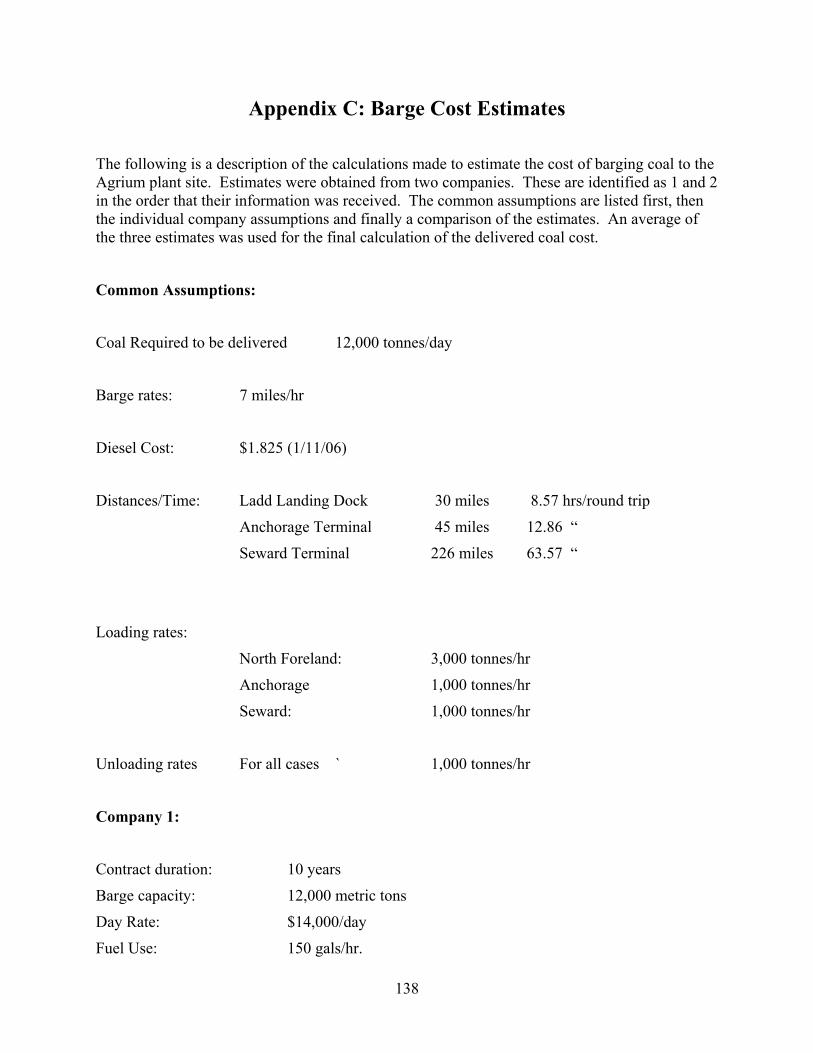
138
Appendix C: Barge Cost Estimates
The following is a description of the calculations made to estimate the cost of barging coal to the Agrium plant site. Estimates were obtained from two companies. These are identified as 1 and 2 in the order that their information was received. The common assumptions are listed first, then the individual company assumptions and finally a comparison of the estimates. An average of the three estimates was used for the final calculation of the delivered coal cost.
Common Assumptions:
Coal Required to be delivered 12,000 tonnes/day
Barge rates: 7 miles/hr
Diesel Cost: $1.825 (1/11/06)
Distances/Time: Ladd Landing Dock 30 miles 8.57 hrs/round trip
Anchorage Terminal 45 miles 12.86 “
Seward Terminal 226 miles 63.57 “
Loading rates:
North Foreland: 3,000 tonnes/hr
Anchorage 1,000 tonnes/hr
Seward: 1,000 tonnes/hr
Unloading rates For all cases ` 1,000 tonnes/hr
Company 1:
Contract duration: 10 years
Barge capacity: 12,000 metric tons
Day Rate: $14,000/day
Fuel Use: 150 gals/hr.

139
Assist Tug Required
Day Rate: $4,000/day
Fuel Use: 75 gal/hr
Company 2:
Contract duration: 15 years
Barge capacity: 8,500 short tons (7,727.3 metric tons)
Fuel Use: $3,000/day
Assist Tug Not Required
Company 1 Company 2
Chuitna Mine Agrium Plant Requires 12,000 tonnes/day 12,000 tonnes/day
Barge Capacity 12000 tonne/load 7,727.3 tonne/load
10000 tonne/day 10,000.0 tonne/day
Loads/day 0.83 loads/day 1.3 loads/day
Round Trip Time: 1 way 4.29 hrs 4.29 knots/hr
load @ 3,000tonne/hr 4.00 hrs 3.00 hrs
unload rate 12 hrs 8 hrs
Total Time/round trip 24.57 hrs 19.57 hrs
Barges Required 2.00 2.00
Assist Tugs required 1.00 0.0
Day Rates Barge Units 28,000 $/day 38,400 $/day
Assist Tug 4,000 $/day 0
Total 32,000 $/day 38,400 $/day
Fuel Usage 150 gal/hr - barge 3,000
gal/day
75 gal/hr - tug
Fuel Usage gal/hr 375 gal/hr total
Fuel Usage gal/hr 1.825 $/gal 1.825 $/gal
Total Fuel Usage
Fuel Price - 1/11/06 5,866 $/day 6,000 $/day
Total Barge/Tug Cost 37,866 $/day 44,400 $/day

140
Cost/Tonne 3.156 $/tonne 3.700 $/tonne
Cost/MMBtu 0.187 0.219 $/MMBtu
MMBtu/tonne 16.865
Anchorage Agrium Plant Requires 12,000 tonnes/day
Barge Capacity 12000 tonne/load 7,727.3 tonne/load
12000 tonne/day 12,000.0 tonne/day
Loads/day 1.00 loads/day 1.6 loads/day
Round Trip Time: 1 way 6.43 hrs 6.43 knots/hr
load @ 1,000tonne/hr 12.00 hrs 8.00 hrs
unload rate 12 hrs 8 hrs
Total Time/round trip 36.86 hrs 28.86 hrs
Max. Tonnes delivered/day 15627.907 12,853
Barges Required 2.00 2.00
Assist Tugs required 1.00 0.0
Day Rates Barge Units 28,000 $/day 38,400 $/day
Assist Tug 4,000 $/day 0
Total 32,000 $/day 38,400 $/day
Fuel Usage 150 gal/hr - barge 3,000
75 gal/hr - tug
Fuel Usage gal/hr 375 gal/hr total
Fuel Usage gal/hr 1.825 $/gal 1.825 $/gal
Total Fuel Usage
Fuel Price - 1/11/06 8,799 $/day 6,000 $/day
Total Barge/Tug Cost 40,799 $/day 44,400 $/day
Cost/Tonne 3.400 $/tonne 3.700 $/tonne
Cost/MMBtu 0.202 0.219 $/MMBtu
MMBtu/tonne 16.865
Seward 12,000 tonnes/day
Distance - 1 way 226 miles 226 miles
Speed 7 miles/hr 7 miles/hr
Time/1-way trip 32.29 hr 32.29 hr
Load Time 12 hr 8 hr
Unload Time 12 8
Total RT Time 88.57 hr 80.57 hr
3.69 days 3.36 days
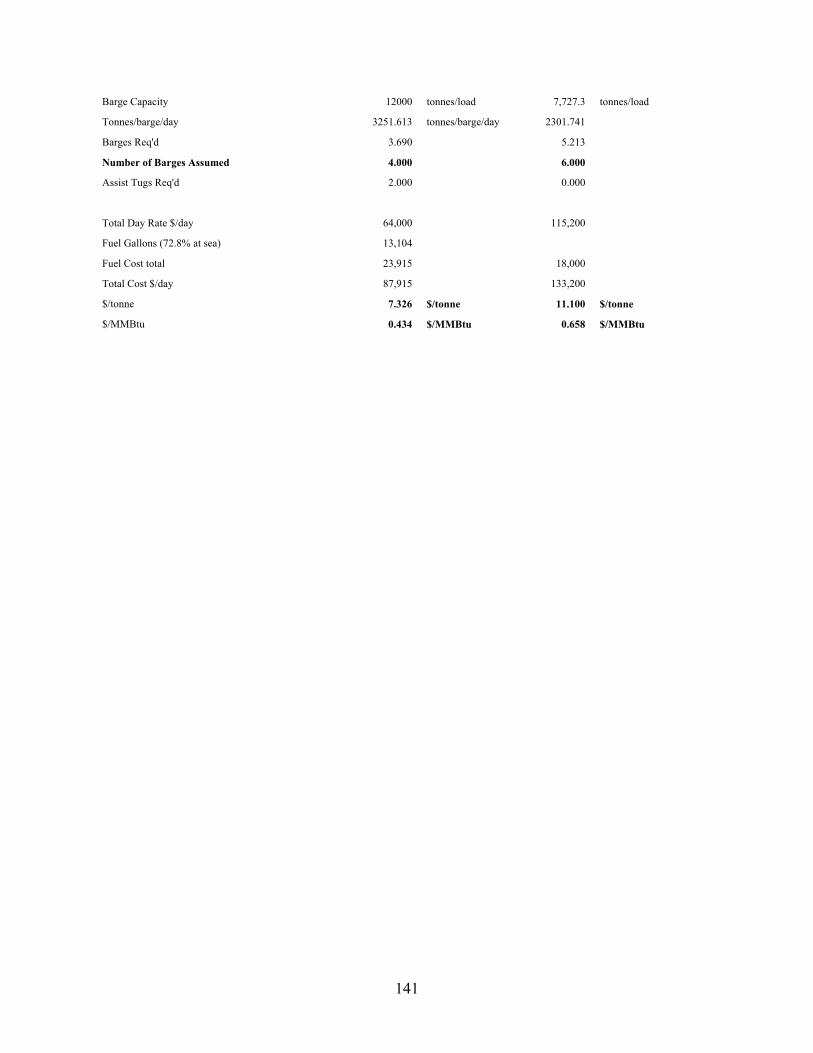
141
Barge Capacity 12000 tonnes/load 7,727.3 tonnes/load
Tonnes/barge/day 3251.613 tonnes/barge/day 2301.741
Barges Req'd 3.690 5.213
Number of Barges Assumed 4.000 6.000
Assist Tugs Req'd 2.000 0.000
Total Day Rate $/day 64,000 115,200
Fuel Gallons (72.8% at sea) 13,104
Fuel Cost total 23,915 18,000
Total Cost $/day 87,915 133,200
$/tonne 7.326 $/tonne 11.100 $/tonne
$/MMBtu 0.434 $/MMBtu 0.658 $/MMBtu
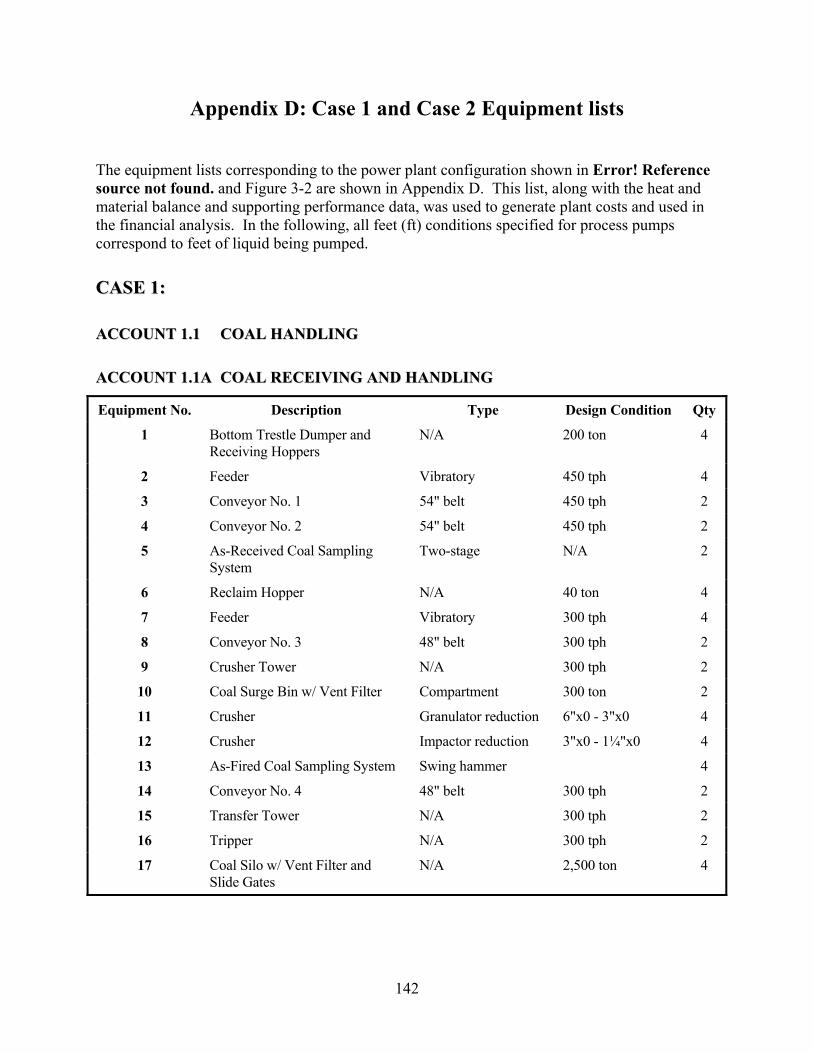
142
Appendix D: Case 1 and Case 2 Equipment lists The equipment lists corresponding to the power plant configuration shown in Error! Reference source not found. and Figure 3-2 are shown in Appendix D. This list, along with the heat and material balance and supporting performance data, was used to generate plant costs and used in the financial analysis. In the following, all feet (ft) conditions specified for process pumps correspond to feet of liquid being pumped.
CCAASSEE 11::
AACCCCOOUUNNTT 11..11 CCOOAALL HHAANNDDLLIINNGG
AACCCCOOUUNNTT 11..11AA CCOOAALL RREECCEEIIVVIINNGG AANNDD HHAANNDDLLIINNGG
Equipment No. Description Type Design Condition Qty
1 Bottom Trestle Dumper and Receiving Hoppers
N/A 200 ton 4
2 Feeder Vibratory 450 tph 4
3 Conveyor No. 1 54" belt 450 tph 2
4 Conveyor No. 2 54" belt 450 tph 2
5 As-Received Coal Sampling System
Two-stage N/A 2
6 Reclaim Hopper N/A 40 ton 4
7 Feeder Vibratory 300 tph 4
8 Conveyor No. 3 48" belt 300 tph 2
9 Crusher Tower N/A 300 tph 2
10 Coal Surge Bin w/ Vent Filter Compartment 300 ton 2
11 Crusher Granulator reduction 6"x0 - 3"x0 4
12 Crusher Impactor reduction 3"x0 - 1¼"x0 4
13 As-Fired Coal Sampling System Swing hammer 4
14 Conveyor No. 4 48" belt 300 tph 2
15 Transfer Tower N/A 300 tph 2
16 Tripper N/A 300 tph 2
17 Coal Silo w/ Vent Filter and Slide Gates
N/A 2,500 ton 4

143
AACCCCOOUUNNTT 11..22 CCOOAALL PPRREEPPAARRAATTIIOONN AANNDD FFEEEEDD
AACCCCOOUUNNTT 11..22AA FFUUEELL SSLLUURRRRYY PPRREEPPAARRAATTIIOONN AANNDD FFUUEELL IINNJJEECCTTIIOONN
Equipment No. Description Type Design Condition Qty
1 Vibratory Feeder 140 tph 3
2 Conveyor No. 1 Belt 300 tph 2
3 Conveyor No. 2 Belt 300 tph 2
4 Rod Mill Feed Hopper Vertical, double hopper 300 tons 2
5 Vibratory Feeder 200 tph 4
6 Weight Feeder Belt 200 tph 4
7 Rod Mill Rotary 200 tph 4
8 Slurry Water Storage Tank with Agitator
Field erected 200,000 gal 2
9 Slurry Water Pumps Horizontal, centrifugal 1,200 gpm 4
10 Rod Mill Product Tank with Agitator
Field erected 200,000 gal 2
11 Rod Mill Product Pumps Horizontal, centrifugal 2,000 gpm 4
12 Slurry Storage Tank with Agitator
Field erected 350,000 gal 2
13 Centrifugal Slurry Pumps Horizontal, centrifugal 3,000 gpm 4
14 PD Slurry Pumps Progressing cavity 500 gpm 8
15 Slurry Blending Tank with Agitator
Field erected 100,000 gal 2
16 Slurry Blending Tank Pumps Horizontal, centrifugal 450 gpm 4

144
ACCOUNT 1.3 FEEDWATER AND MISCELLANEOUS SYSTEMS AND
EQUIPMENT
AACCCCOOUUNNTT 11..33AA CCOONNDDEENNSSAATTEE AANNDD FFEEEEDDWWAATTEERR SSYYSSTTEEMM
Equipment No. Description Type Design Condition Qty
1 Cond. Storage Tank Vertical, cylindrical, outdoor
50,000 gal 2
2 Condensate Pumps Vert. canned 900 gpm @ 400 ft 4
3 Deaerator (integral with HRSG)
Horiz. spray type 700,000 lb/h 200°F to 240°F
2
4 LP Feed Pump Horiz. centrifugal single stage
300 gpm/1,000 ft 2
5 HP Feed Pump Barrel type, multi-staged, centr.
2,000 gpm @ 5,500 ft & 300 gpm @ 1,700 ft
2

145
AACCCCOOUUNNTT 11..33BB MISCELLANEOUS EQUIPMENT
Equipment No. Description Type Design Condition Qty
1 Auxiliary Boiler Shop fabricated, water tube 400 psig, 650°F 70,000 lb/h
1
2 Service Air Compressors Recip., single stage, double acting, horiz.
100 psig, 750 cfm 2
3 Inst. Air Dryers Duplex, regenerative 750 cfm 1
4 Service Water Pumps Horiz. centrifugal, double suction
200 ft, 1,200 gpm 2
5 Closed Cycle Cooling Water Pumps
Horizontal, centrifugal 70 ft, 1,200 gpm 2
6 Fire Service Booster Pump Two-stage horiz. centrifugal 250 ft, 1,200 gpm 1
7 Engine-Driven Fire Pump Vertical turbine, diesel engine
350 ft, 1,000 gpm 1
8 Raw Water Pumps SS, single suction 60 ft, 300 gpm 2
9 Filtered Water Pumps SS, single suction 160 ft, 120 gpm 2
10 Filtered Water Tank Vertical, cylindrical 15,000 gal 1
11 Makeup Demineralizer Anion, cation, and mixed bed
70 gpm 2
12 Sour Water Stripper System
Vendor supplied 200,000 lb/h sour water
1
13 Liquid Waste Treatment System
Vendor supplied 400 gpm 1

146
AACCCCOOUUNNTT 11..44 GGAASSIIFFIIEERR AANNDD AACCCCEESSSSOORRIIEESS
AACCCCOOUUNNTT 11..44AA GGAASSIIFFIICCAATTIIOONN ((TTOOTTAALL FFOORR PPLLAANNTT))
Equipment No. Description Type Design Condition Qty
1 Gasifier Pressurized two-stage entrained bed
2,500 ton/day/ 515 psia
4
2 Raw Gas Cooler Fire-tube boiler 1,800 psig/635°F (drum) 600,000 lb/h
4
3 Raw Gas Cyclone High Efficiency 600,000 lb/h, medium-Btu gas
4
4 Candle Filter Pressurized filter with pulse jet cleaning
600 candles 60/40x1500 mm
4
5 Flare Stack Self-supporting, carbon steel, stainless steel top, pilot ignition
600,000 lb/h, medium-Btu gas
4
AACCCCOOUUNNTT 11..44BB AAIIRR SSEEPPAARRAATTIIOONN PPLLAANNTT ((TTOOTTAALL FFOORR PPLLAANNTT))
Equipment No. Description Type Design Condition Qty
1 Air Compressor Centrifugal, multi-stage 100,000 scfm, 199 psia discharge pressure
4
2 Cold Box Vendor Design 3,055 ton/day O2 2
3 Oxygen Compressor Centrifugal, multi-stage 50,000 scfm, 563 psia discharge pressure
2
4 Nitrogen Compressor Centrifugal, multi-stage 100,000 scfm, 415 psia discharge pressure
2
5 Nitrogen Boost Compressor
Centrifugal, multi-stage 11,000 scfm, 300 psia discharge pressure
1

147
ACCOUNT 1.5 SYNGAS CLEANUP
ACCOUNT 1.5A WATER-GAS SHIFT, HYDROGEN PRODUCTION, RAW GAS COOLING
AND HUMIDIFICATION
Equipment No.
Description Type Design Condition Qty
1 High-Temperature Shift Reactor 1
Fixed bed 3.3 MPa (480 psia), 399°C (750ºF)
2
2 High-Temperature Shift Reactor 2
Fixed bed 3.3 MPa (480 psia), 399°C (750ºF)
2
3 High-Temperature Shift Reactor 3
Fixed bed 3.3 MPa (480 psia), 399°C (750ºF)
2
4 HP Steam Generator Shell and tube 63 x 106 kJ/h (60 x 106 Btu/h) @ 13.8 MPa (2000 psia) and 371°C (700ºF)
4
5 IP Steam Generator Shell and tube 32 x 106 kJ/h (30 x 106 Btu/h) @ 2.1 MPa (300 psia) and 260°C (500ºF)
4
6 LP Steam Generator Shell and tube 16 x 106 kJ/h (15 x 106 Btu/h) @ 1.4 MPa (200 psia) and 260°C (500ºF)
4
7 Saturation Water Economizers
Shell and tube 53 x 106 kJ/h (50 x 106 Btu/h) @ 6.9 MPa (1000 psia) and 260°C (500ºF)
4
8 Raw Gas Coolers Shell and tube with condensate drain
300 x 106 kJ/h (150 x 106 Btu/h) 4
9 Raw Gas Knockout Drum
Vertical with mist eliminator
6.9 MPa (500 psia), 54°C (130ºF)
4
10 Fuel Gas Saturator Vertical tray tower 20 stages, 2.6 MPa (400 psia), 232°C (450ºF)
1
11 Saturator Water Pump Centrifugal 341 m3/h, (500 gpm) @ 14 m (120 ft)
1
12 Fuel Gas Reheater 1 Shell and tube 42 x 106 kJ/h (40 x 106 Btu/h) @ 2.6 MPa (400 psia) and 288°C (550ºF)
1

148
ACCOUNT 1.5B MERCURY REMOVAL, ACID GAS REMOVAL, SULFUR
RECOVERY AND CO2 COMPRESSION
Equipment No. Description Type Design Condition Qty
1 Mercury Adsorber Packed Bed of Sulfur Impregnated Activated Carbon
280,000 kg/h (620,000 lb/h) syngas 2.9 m (9.5 ft) ID x 7.3 m (24 ft)
4
2 Selexol H2S Absorber Packed bed 280,000 kg/h (720,000 lb/h) 2.7 m (9 ft) ID x 32.3 m (106 ft)
4
3 CO2 Absorber 1 Packed bed 3.0 m (10 ft) ID x 33.5 m (110 ft)
4
4 CO2 Absorber 2 Packed bed 3.0 m (10 ft) ID x 33.5 m (110 ft)
4
5 Selexol Reabsorber Packed bed 1.8 m (6 ft) ID x 28.0 m (92 ft)
4
6 Selexol Stripper Packed bed 2.7 m (9 ft) ID x 28.0 m (92 ft)
4
7 Flash 1 2.1 MPa (299 psia) 2.1 m (7 ft) x 12.2 m (40 ft)
4
8 Flash 2 1.1 MPa (160 psia) 2.1 m (7 ft) x 12.2 m (40 ft)
4
9 Flash 3 152 kPa (22 psia) 2.1 m (7 ft) x 12.2 m (40 ft)
4
10 Lean/Rich Exchanger Shell and tube 132 x 106 kJ/h (125 x 106 Btu/h)
4
11 Lean/Product Exchanger Shell and tube 6.5 x 10⁶ kJ/h (6.2 x 10⁶ Btu/h)
4
12 Stripped Gas Cooler Shell and tube 8.7 x 10⁶ kJ/h (8.2 x 10⁶ Btu/h)
4
13 Acid Gas Condenser Air cooled 12.7 x 10⁶ kJ/h (12.0 x 10⁶ Btu/h)
4

149
ACCOUNT 1.5B (CONTINUED) MERCURY REMOVAL, ACID GAS REMOVAL,
SULFUR RECOVERY AND CO2 COMPRESSION
Equipment No. Description Type Design Condition Qty
14 Stripper Reboiler Shell and tube 58 x 106 kJ/h (55 x 106 Btu/h)
4
15 Lean Pump Horizontal, centrifugal 522 m3/h (2,300 gpm) 6.3 MPa (910 psi)
4
16 Rich Pump Horizontal, centrifugal 204 m3/h (900 gpm) 207 kPa (30 psi)
4
17 Solvent Recycle Pump Horizontal, centrifugal 795 m3/h (3,500 gpm) 6.0 MPa (875 psi)
4
18 Loaded Solvent Pump Horizontal, centrifugal 375 m3/h (1,650 gpm) 69 kPa (10 psi)
4
19 Claus Plant Commercial 20 TPD sulfur 1

150
AACCCCOOUUNNTT 11..66 CCOOMMBBUUSSTTIIOONN TTUURRBBIINNEE AANNDD AAUUXXIILLIIAARRIIEESS
Equipment No. Description Type Design Condition Qty
1 197 MWe Gas Turbine Generator
Axial flow, single spool based on GE 7FA
900 lb/sec airflow 2350°F rotor inlet temp.; 15.2:1 pressure ratio
1
2 Enclosure Sound attenuating 85 dB at 3 ft 1
3 Air Inlet Filter/Silencer Two-stage 900 lb/sec airflow 3.0 in. H2O pressure drop, dirty
1
4 Starting Package Electric motor, torque converter drive, turning gear
2,000 hp, time from turning gear to full load ~30 minutes
1
5 Air to Air Cooler 1
6 Mechanical Package CS oil reservoir and pumps dual vertical cartridge filters air compressor
1
7 Oil Cooler Air-cooled, fin fan 1
8 Electrical Control Package Distributed control system 1 sec. update time 8 MHz clock speed
1
9 Generator Glycol Cooler Air-cooled, fin fan 1
10 Compressor Wash Skid 1
AACCCCOOUUNNTT 11..77 WWAASSTTEE HHEEAATT BBOOIILLEERR,, DDUUCCTTIINNGG,, AANNDD SSTTAACCKK
Equipment No. Description Type Design Condition Qty
1 Heat Recovery Steam Generator
Drum, multi-pressure, with economizer section and integral deaerator
HP-1672 psia/ 1000°F 640,000 lb/h IP-381 psia/1000°F 540,000 lb/h
1
2 Stack Carbon steel plate, type 409 stainless steel liner
213 ft high x 28 ft dia. 1

151
ACCOUNT 1.8 STEAM TURBINE GENERATOR AND AUXILIARIES
Equipment No. Description Type Design Condition Qty
1 36 MW Steam Turbine Generator
TC2F26 1800 psig 1000°F/1000°F
1
2 Bearing Lube Oil Coolers Plate and frame 2
3 Bearing Lube Oil Conditioner
Pressure filter closed loop 1
4 Control System Digital electro-hydraulic 1600 psig 1
5 Generator Coolers Plate and frame 2
6 Hydrogen Seal Oil System Closed loop 1
7 Surface Condenser Single pass, divided waterbox
880,000 lb/h steam @ 2.4 in. Hga
1
8 Condenser Vacuum Pumps Rotary, water sealed 2500/25 scfm (hogging/holding)
2
ACCOUNT 1.9 COOLING WATER SYSTEM
Equipment No. Description Type Design Condition (per each)
Qty
1 Circ. Water Pumps Vertical wet pit 40,000 gpm @ 60 ft 2
2 Cooling Tower Mechanical draft 100,000 gpm 1
AACCCCOOUUNNTT 11..1100 SSLLAAGG RREECCOOVVEERRYY AANNDD HHAANNDDLLIINNGG
Equipment No. Description Type Design Condition Qty
1 Slag Quench Tank Water bath 12 tph 4
2 Slag Crusher Roll 12 tph 4
3 Slag Depressurizer Proprietary 12 tph 4
4 Slag Handling Tank Horizontal, weir 6 tph 8
5 Slag Conveyor Drag chain 6 tph 8
6 Slag Separation Screen Vibrating 50 tph *1
7 Coarse Slag Conveyor Belt/bucket 50 tph *1
8 Fine Ash Storage Tank Vertical 50,000 gallons *1
9 Fine Ash Transfer Pumps Horizontal/centrifugal 200 gpm 2
10 Storage Bin Vertical 5,000 tons *1
11 Unloading Equipment Telescoping chute 50 tph *1
*Total for plant.

152
CCAASSEE 22::
AACCCCOOUUNNTT 22..11 CCOOAALL HHAANNDDLLIINNGG
AACCCCOOUUNNTT 22..11AA CCOOAALL RREECCEEIIVVIINNGG AANNDD HHAANNDDLLIINNGG
Equipment No. Description Type Design Condition Qty
1 Bottom Trestle Dumper and Receiving Hoppers
N/A 200 ton 4
2 Feeder Vibratory 450 tph 4
3 Conveyor No. 1 54" belt 450 tph 2
4 Conveyor No. 2 54" belt 450 tph 2
5 As-Received Coal Sampling System
Two-stage N/A 2
6 Reclaim Hopper N/A 40 ton 4
7 Feeder Vibratory 300 tph 4
8 Conveyor No. 3 48" belt 300 tph 2
9 Crusher Tower N/A 300 tph 2
10 Coal Surge Bin w/ Vent Filter Compartment 300 ton 2
11 Crusher Granulator reduction 6"x0 - 3"x0 4
12 Crusher Impactor reduction 3"x0 - 1¼"x0 4
13 As-Fired Coal Sampling System Swing hammer 4
14 Conveyor No. 4 48" belt 300 tph 2
15 Transfer Tower N/A 300 tph 2
16 Tripper N/A 300 tph 2
17 Coal Silo w/ Vent Filter and Slide Gates
N/A 2,500 ton 4

153
AACCCCOOUUNNTT 22..22 CCOOAALL PPRREEPPAARRAATTIIOONN AANNDD FFEEEEDD
AACCCCOOUUNNTT 22..22AA FFUUEELL SSLLUURRRRYY PPRREEPPAARRAATTIIOONN AANNDD FFUUEELL IINNJJEECCTTIIOONN
Equipment No. Description Type Design Condition Qty
1 Vibratory Feeder 140 tph 3
2 Conveyor No. 1 Belt 300 tph 2
3 Conveyor No. 2 Belt 300 tph 2
4 Rod Mill Feed Hopper Vertical, double hopper 300 tons 2
5 Vibratory Feeder 200 tph 4
6 Weight Feeder Belt 200 tph 4
7 Rod Mill Rotary 200 tph 4
8 Slurry Water Storage Tank with Agitator
Field erected 200,000 gal 2
9 Slurry Water Pumps Horizontal, centrifugal 1,200 gpm 4
10 Rod Mill Product Tank with Agitator
Field erected 200,000 gal 2
11 Rod Mill Product Pumps Horizontal, centrifugal 2,000 gpm 4
12 Slurry Storage Tank with Agitator
Field erected 350,000 gal 2
13 Centrifugal Slurry Pumps Horizontal, centrifugal 3,000 gpm 4
14 PD Slurry Pumps Progressing cavity 500 gpm 8
15 Slurry Blending Tank with Agitator
Field erected 100,000 gal 2
16 Slurry Blending Tank Pumps Horizontal, centrifugal 450 gpm 4
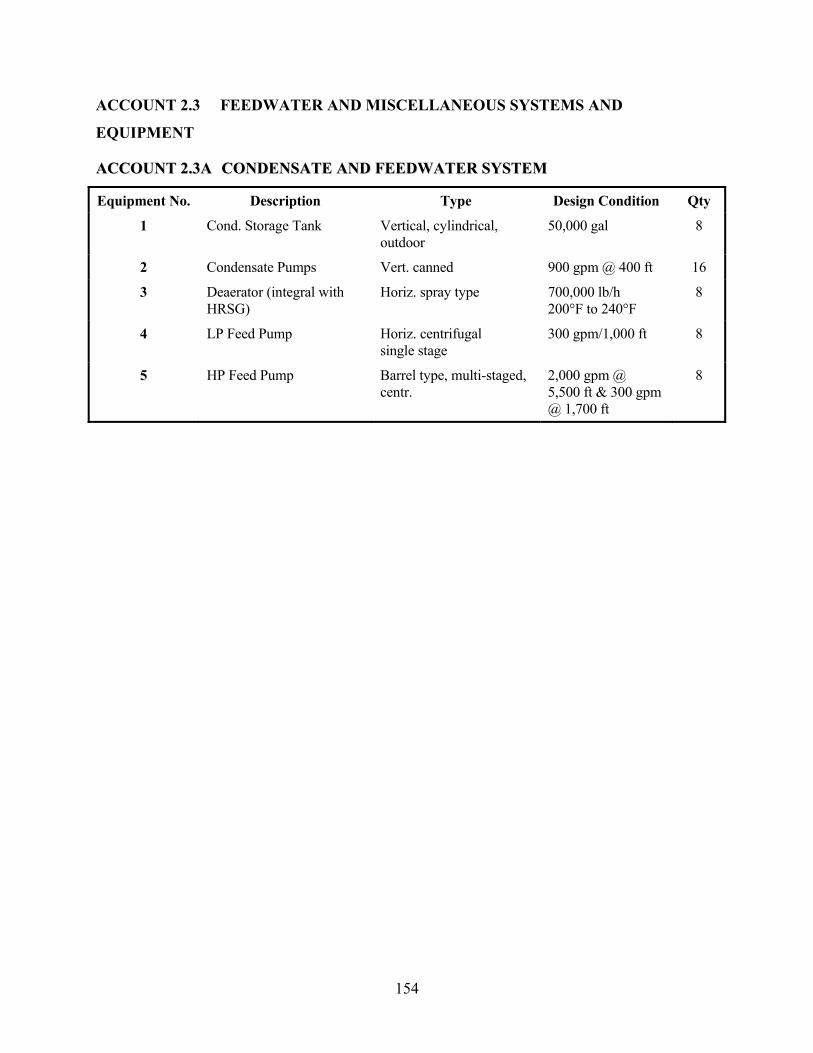
154
ACCOUNT 2.3 FEEDWATER AND MISCELLANEOUS SYSTEMS AND
EQUIPMENT
AACCCCOOUUNNTT 22..33AA CCOONNDDEENNSSAATTEE AANNDD FFEEEEDDWWAATTEERR SSYYSSTTEEMM
Equipment No. Description Type Design Condition Qty
1 Cond. Storage Tank Vertical, cylindrical, outdoor
50,000 gal 8
2 Condensate Pumps Vert. canned 900 gpm @ 400 ft 16
3 Deaerator (integral with HRSG)
Horiz. spray type 700,000 lb/h 200°F to 240°F
8
4 LP Feed Pump Horiz. centrifugal single stage
300 gpm/1,000 ft 8
5 HP Feed Pump Barrel type, multi-staged, centr.
2,000 gpm @ 5,500 ft & 300 gpm @ 1,700 ft
8

155
AACCCCOOUUNNTT 22..33BB MISCELLANEOUS EQUIPMENT
Equipment No. Description Type Design Condition Qty
1 Auxiliary Boiler Shop fabricated, water tube 400 psig, 650°F 70,000 lb/h
1
2 Service Air Compressors Recip., single stage, double acting, horiz.
100 psig, 750 cfm 2
3 Inst. Air Dryers Duplex, regenerative 750 cfm 1
4 Service Water Pumps Horiz. centrifugal, double suction
200 ft, 1,200 gpm 2
5 Closed Cycle Cooling Water Pumps
Horizontal, centrifugal 70 ft, 1,200 gpm 2
6 Fire Service Booster Pump Two-stage horiz. centrifugal 250 ft, 1,200 gpm 1
7 Engine-Driven Fire Pump Vertical turbine, diesel engine
350 ft, 1,000 gpm 1
8 Raw Water Pumps SS, single suction 60 ft, 300 gpm 2
9 Filtered Water Pumps SS, single suction 160 ft, 120 gpm 2
10 Filtered Water Tank Vertical, cylindrical 15,000 gal 1
11 Makeup Demineralizer Anion, cation, and mixed bed
70 gpm 2
12 Sour Water Stripper System
Vendor supplied 200,000 lb/h sour water
1
13 Liquid Waste Treatment System
Vendor supplied 400 gpm 1

156
AACCCCOOUUNNTT 22..44 GGAASSIIFFIIEERR AANNDD AACCCCEESSSSOORRIIEESS
AACCCCOOUUNNTT 22..44AA GGAASSIIFFIICCAATTIIOONN ((TTOOTTAALL FFOORR PPLLAANNTT))
Equipment No. Description Type Design Condition Qty
1 Gasifier Pressurized two-stage entrained bed
2,500 ton/day/ 515 psia
4
2 Raw Gas Cooler Fire-tube boiler 1,800 psig/635°F (drum) 600,000 lb/h
4
3 Raw Gas Cyclone High Efficiency 600,000 lb/h, medium-Btu gas
4
4 Candle Filter Pressurized filter with pulse jet cleaning
600 candles 60/40x1500 mm
4
5 Flare Stack Self-supporting, carbon steel, stainless steel top, pilot ignition
600,000 lb/h, medium-Btu gas
4
AACCCCOOUUNNTT 22..44BB AAIIRR SSEEPPAARRAATTIIOONN PPLLAANNTT ((TTOOTTAALL FFOORR PPLLAANNTT))
Equipment No. Description Type Design Condition Qty
1 Air Compressor Centrifugal, multi-stage 100,000 scfm, 199 psia discharge pressure
4
2 Cold Box Vendor Design 2,950 ton/day O2 2
3 Oxygen Compressor Centrifugal, multi-stage 50,000 scfm, 563 psia discharge pressure
2
4 Nitrogen Compressor Centrifugal, multi-stage 100,000 scfm, 415 psia discharge pressure
2
5 Nitrogen Boost Compressor
Centrifugal, multi-stage 11,000 scfm, 300 psia discharge pressure
1

157
ACCOUNT 2.5 SYNGAS CLEANUP
ACCOUNT 2.5A WATER-GAS SHIFT, HYDROGEN PRODUCTION, RAW GAS COOLING
AND HUMIDIFICATION
Equipment No.
Description Type Design Condition Qty
1 High-Temperature Shift Reactor 1
Fixed bed 3.3 MPa (480 psia), 399°C (750ºF)
2
2 High-Temperature Shift Reactor 2
Fixed bed 3.3 MPa (480 psia), 399°C (750ºF)
2
3 High-Temperature Shift Reactor 3
Fixed bed 3.3 MPa (480 psia), 399°C (750ºF)
2
4 HP Steam Generator Shell and tube 63 x 106 kJ/h (60 x 106 Btu/h) @ 13.8 MPa (2000 psia) and 371°C (700ºF)
4
5 IP Steam Generator Shell and tube 32 x 106 kJ/h (30 x 106 Btu/h) @ 2.1 MPa (300 psia) and 260°C (500ºF)
4
6 LP Steam Generator Shell and tube 16 x 106 kJ/h (15 x 106 Btu/h) @ 1.4 MPa (200 psia) and 260°C (500ºF)
4
7 Saturation Water Economizers
Shell and tube 53 x 106 kJ/h (50 x 106 Btu/h) @ 6.9 MPa (1000 psia) and 260°C (500ºF)
4
8 Raw Gas Coolers Shell and tube with condensate drain
300 x 106 kJ/h (150 x 106 Btu/h) 4
9 Raw Gas Knockout Drum
Vertical with mist eliminator
6.9 MPa (500 psia), 54°C (130ºF)
4

158
ACCOUNT 2.5B MERCURY REMOVAL, ACID GAS REMOVAL, SULFUR
RECOVERY AND CO2 COMPRESSION
Equipment No. Description Type Design Condition Qty
1 Mercury Adsorber Packed Bed of Sulfur Impregnated Activated Carbon
280,000 kg/h (620,000 lb/h) syngas 2.9 m (9.5 ft) ID x 7.3 m (24 ft)
4
2 Selexol H2S Absorber Packed bed 280,000 kg/h (720,000 lb/h) 2.7 m (9 ft) ID x 32.3 m (106 ft)
4
3 CO2 Absorber 1 Packed bed 3.0 m (10 ft) ID x 33.5 m (110 ft)
4
4 CO2 Absorber 2 Packed bed 3.0 m (10 ft) ID x 33.5 m (110 ft)
4
5 Selexol Reabsorber Packed bed 1.8 m (6 ft) ID x 28.0 m (92 ft)
4
6 Selexol Stripper Packed bed 2.7 m (9 ft) ID x 28.0 m (92 ft)
4
7 Flash 1 2.1 MPa (299 psia) 2.1 m (7 ft) x 12.2 m (40 ft)
4
8 Flash 2 1.1 MPa (160 psia) 2.1 m (7 ft) x 12.2 m (40 ft)
4
9 Flash 3 152 kPa (22 psia) 2.1 m (7 ft) x 12.2 m (40 ft)
4
10 Lean/Rich Exchanger Shell and tube 132 x 106 kJ/h (125 x 106 Btu/h)
4
11 Lean/Product Exchanger Shell and tube 6.5 x 10⁶ kJ/h (6.2 x 10⁶ Btu/h)
4
12 Stripped Gas Cooler Shell and tube 8.7 x 10⁶ kJ/h (8.2 x 10⁶ Btu/h)
4
13 Acid Gas Condenser Air cooled 12.7 x 10⁶ kJ/h (12.0 x 10⁶ Btu/h)
4

159
ACCOUNT 2.5B (CONTINUED) MERCURY REMOVAL, ACID GAS REMOVAL,
SULFUR RECOVERY AND CO2 COMPRESSION
Equipment No. Description Type Design Condition Qty
14 Stripper Reboiler Shell and tube 58 x 106 kJ/h (55 x 106 Btu/h)
4
15 Lean Pump Horizontal, centrifugal 522 m3/h (2,300 gpm) 6.3 MPa (910 psi)
4
16 Rich Pump Horizontal, centrifugal 204 m3/h (900 gpm) 207 kPa (30 psi)
4
17 Solvent Recycle Pump Horizontal, centrifugal 795 m3/h (3,500 gpm) 6.0 MPa (875 psi)
4
18 Loaded Solvent Pump Horizontal, centrifugal 375 m3/h (1,650 gpm) 69 kPa (10 psi)
4
19 Claus Plant Commercial 20 TPD sulfur 1
20 Pressure Swing Adsorber UOP Poly Sorb 282 TPD Hydrogen 1
AACCCCOOUUNNTT 22..77 CCFFBB BBOOIILLEERR,, DDUUCCTTIINNGG,, AANNDD SSTTAACCKK
Equipment No. Description Type Design Condition Qty
1 Circulating Fluidized Bed Coal-Fired Boiler
Drum, multi-pressure, with economizer section and integral deaerator
HP-1672 psia/ 1000°F
IP-381 psia/1000°F
1
2 Stack Carbon steel plate, type 409 stainless steel liner
213 ft high x 28 ft dia. 1

160
ACCOUNT 2.8 STEAM TURBINE GENERATOR AND AUXILIARIES
Equipment No. Description Type Design Condition Qty
1 156 MW Steam Turbine Generator
TC2F26 1800 psig 1000°F/1000°F
1
2 Bearing Lube Oil Coolers Plate and frame 2
3 Bearing Lube Oil Conditioner
Pressure filter closed loop 1
4 Control System Digital electro-hydraulic 1600 psig 1
5 Generator Coolers Plate and frame 2
6 Hydrogen Seal Oil System Closed loop 1
7 Surface Condenser Single pass, divided waterbox
880,000 lb/h steam @ 2.4 in. Hga
4
8 Condenser Vacuum Pumps Rotary, water sealed 5000/25 scfm (hogging/holding)
4
ACCOUNT 2.9 COOLING WATER SYSTEM
Equipment No. Description Type Design Condition (per each)
Qty
1 Circ. Water Pumps Vertical wet pit 40,000 gpm @ 60 ft 8
2 Cooling Tower Mechanical draft 100,000 gpm 4
AACCCCOOUUNNTT 22..1100 SSLLAAGG RREECCOOVVEERRYY AANNDD HHAANNDDLLIINNGG
Equipment No. Description Type Design Condition Qty
1 Slag Quench Tank Water bath 12 tph 4
2 Slag Crusher Roll 12 tph 4
3 Slag Depressurizer Proprietary 12 tph 4
4 Slag Handling Tank Horizontal, weir 6 tph 8
5 Slag Conveyor Drag chain 6 tph 8
6 Slag Separation Screen Vibrating 50 tph *1
7 Coarse Slag Conveyor Belt/bucket 50 tph *1
8 Fine Ash Storage Tank Vertical 50,000 gallons *1
9 Fine Ash Transfer Pumps Horizontal/centrifugal 200 gpm 2
10 Storage Bin Vertical 5,000 tons *1
11 Unloading Equipment Telescoping chute 50 tph *1
*Total for plant.

161
Appendix E: Financial Model Entries
Table E.1
Financial Model Entries—Plant Inputs
Case 1 Case 2
Project Name Beluga IGCC C1 Beluga IGCC C2
Project Location Alaska Alaska
Primary Output/Plant Application (Options: Power, Multiple Outputs) Multiple Outputs Multiple Outputs
Primary Fuel Type (Options: Gas, Coal, Petroleum Coke, Other/Waste) Coal Coal
Secondary Fuel Type (Options: None, Gas, Coal, Petroleum Coke, Other/Waste) None None
Plant Output and Operating Data : Note - All ton units are U.S. Short Tons (2000 lbs)
Syngas Capacity (MMcf/Day) 0 0
Gross Electric Power Capacity (MW) 232.9 171.8
Net Electric Power Capacity (MW) 70.0 11.7
Steam Capacity (Tons/Hr) 0 0
Hydrogen Capacity (MMcf/Day) 0 0
Carbon Dioxide Capacity (MMcf/Day) 40.8 40.8
Elemental Sulfur Capacity (Tons/Day) 19 20
Slag Ash Capacity (Tons/Day) 1,230 1,328
Ammonia (Tons/Day) 2,283 2,283
Urea (Tons/Day) 3,409 3,409
Environmental Credit (Tons/Day) 0 0
Operating Hours per Year 8,760 8,760
Guaranteed Availability (percentage) 85% 85%
Enter One of the Following Items(For Each Primary/Secondary Fuel) Depending on Project Type:
Primary Fuel Heat Rate (Btu/kWh) based on HHV FOR POWER PROJECTS 0 0
Secondary Fuel Heat Rate (Btu/kWh) based on HHV FOR POWER PROJECTS 0 0
Primary Fuel Annual Fuel Consumption (in MMcf OR Thousand Tons) FOR NON POWER PROJECTS 3,630 3,872
Secondary Fuel Annual Fuel Consumption (in MMcf OR Thousand Tons) FOR NON POWER PROJECTS 0 0
Initial Capital and Financing Costs (enter 'Additional Costs' in thousand dollars)
EPC (in thousand dollars) 1,312,386 1,497,600
Owner's Contingency (% of EPC Costs) 25% 25%
Start-up (% of EPC Costs) 2% 2%
Owner's Cost (in thousand dollars) 131,239 149,760
Operating Costs and Expenses
Variable O&M (% of EPC Cost) 1.75% 1.75%
Fixed O&M Cost (% of EPC Cost) 5.25% 5.25%

162
Table E.2
Financial Model Entries—Scenario Inputs
Capital Structure
Percentage Debt 70%
Percentage Equity 30%
Project Debt Terms
Loan 1: Senior Debt
% of Total Project Debt (total for Loans 1,2, and 3 must = 100%) 100%
Interest Rate 8%
Financing Fee 3%
Repayment Term (in Years) 15
Grace Period on Principal Repayment 1
First Year of Principal Repayment 2012
Loan Covenant Assumptions
Interest Rate for Debt Reserve Fund (DRF) 4%
Debt Reserve Fund Used on Senior Debt (Options: Yes or No) No
Depreciation : "SL" for Straight-Line OR "DB" for 150% Declining Balance Method
Construction (Years) : Note - DB Method Must be 15 or 20 years 15 SL
Financing (Years) : Note - DB Method Must be 15 or 20 years 15 SL
Working Capital
Days Receivable 30
Days Payable 30
Annual Operating Cash (Thousand $) $100
Initial Working Capital (% of first year revenues) 7%
ECONOMIC ASSUMPTIONS
Cash Flow Analysis Period
Plant Economic Life/Concession Length (in Years) 30
Discount Rate 12%
Escalation Factors
Project Output/Tariff
Electricity: Energy Payment from SAIC model (~2.4% over project life, slightly lower in Case 2)
Ammonia 3.0%
Urea 3.0%
Elemental Sulfur 3.0%
Slag Ash 3.0%
Fuel/Feedstock
Coal 2.0%

163
Operating Expenses and Construction Items
Variable O&M 2.0%
Fixed O&M 2.0%
Other Non-fuel Expenses 2.0%
EPC Costs 2.0%
Tax Assumptions
Tax Holiday (in Years) 0
Income Tax Rate 37%
Subsidized Tax Rate (used as investment incentive) 0%
Length of Subsidized Tax Period (in Years) 0
FUEL/FEEDSTOCK ASSUMPTIONS
Fuel Prices : For the Base Year, then escalated by fuel factors above
Coal ($/U.S. Short Ton) 29.25
Alternatively, use Forecasted Prices (From Fuel Forecasts Sheet)? (Yes/No) No
TARIFF ASSUMPTIONS
INITIAL TARIFF LEVEL (In Dollars in the first year of construction)
Electricity Payment ($/MWh) 45.94 (52.07 in Case 2)
Ammonia ($/U.S. Short Ton) 203
Urea ($/U.S. Short Ton) 167
Elemental Sulfur ($/U.S. Short Ton) 63
Carbon Dioxide ($/MSCF) 0
Slag Ash ($/U.S. Short Ton) 0
CONSTRUCTION ASSUMPTIONS
Construction Schedule A
Construction Start Date 7/1/2007
Construction Period (in months) 42
Plant Start-up Date (must start on January 1) 1/1/2011
EPC Cost Escalation in Effect? (Yes/No) 7/1/2007
Percentage of Cost for Construction Periods Four Year Period
Enter for Five, Four or Three Year Periods (To the Right --->) Year 1 Year 2 Year 3 Year 4
Capital Costs : Unescalated Allocations 15.0% 30.0% 30.0% 25.0%
Initial Working Capital 0.0% 0.0% 0.0% 100.0%
Owner's Contingency (% of EPC Costs) 0.0% 0.0% 0.0% 100.0%
Development Fee (% of EPC Costs) 35.0% 35.0% 30.0% 0.0%
Start-up (% of EPC Costs) 0.0% 30.0% 70.0% 0.0%
Initial Debt Reserve Fund 0.0% 30.0% 70.0% 0.0%
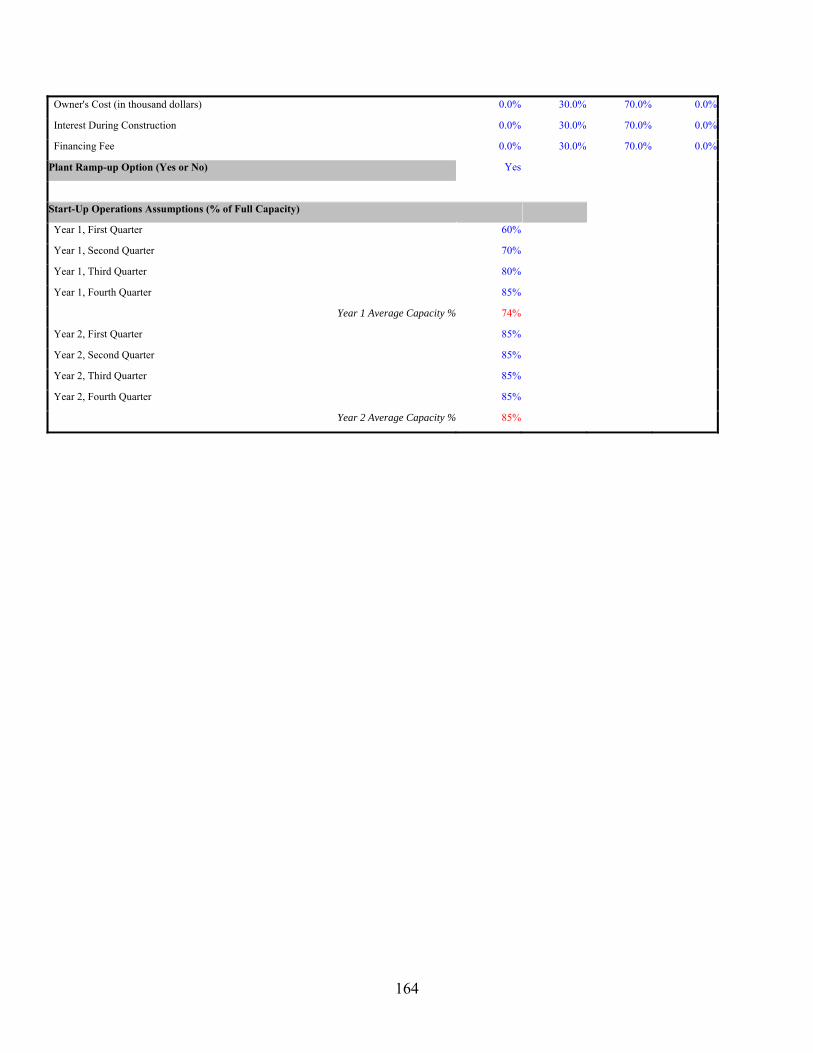
164
Owner's Cost (in thousand dollars) 0.0% 30.0% 70.0% 0.0%
Interest During Construction 0.0% 30.0% 70.0% 0.0%
Financing Fee 0.0% 30.0% 70.0% 0.0%
Plant Ramp-up Option (Yes or No) Yes
Start-Up Operations Assumptions (% of Full Capacity)
Year 1, First Quarter 60%
Year 1, Second Quarter 70%
Year 1, Third Quarter 80%
Year 1, Fourth Quarter 85%
Year 1 Average Capacity % 74%
Year 2, First Quarter 85%
Year 2, Second Quarter 85%
Year 2, Third Quarter 85%
Year 2, Fourth Quarter 85%
Year 2 Average Capacity % 85%

165
Appendix F. Applicable Federal State and Local Permitting Activities. Potential Applicability to Project Components
Permit / Activity Authority Description Marine Terminal Modification
Tug/Barge Operation IGCC Existing Facility
APPLICABLE FEDERAL ENVIRONMENTAL PERMITS AND PERMITTING ACTIVITIES
U.S. Environmental Protection Agency (EPA)
National Pollutant Discharge Elimination System (NPDES): Point Source and Stormwater Discharges
Section 402, Clean Water Act (22 U.S.C. § 1251 et seq.)
Point source and stormwater discharges to surface waters including industrial and domestic wastewater, gravel pit and construction dewatering, hydrostatic test water, storm water discharges,
stromwater and domestic wastewater
Unlikely stromwater, industrial and domestic wastewater
Modifications to existing permit possible
Discharge of Fill Material
Sec. 404, Clean Water Act (CWA): (33 USC § 1251 et seq.)
USEPA reviews and comments on USACE Section 404 permit applications for compliance with the Section 404(b)(1) guidelines and other statutes and authorities within its jurisdiction (40 CFR 230).
Wetland and coastal water fill/ structures
Unlikely Wetland filling Unlikely
SPCC Plan Section 311 of the CWA (33 USC §1251 et seq.)
USEPA requires a spill prevention, control, and countermeasure (SPCC) plan to be developed by owners or operators of any facility storing a total capacity of 1,320 gallons of fuel in aboveground storage tanks.
Fuel Storage Tanks Fuel Storage Tanks Fuel Storage Tanks Modifications can require new or modified fuel storage.
Underground Injection Control (UIC)
Safe Drinking Water Act (42 USC §300)
Regulates implementation of Class I and Class V injection wells in Alaska for injection of non-hazardous and hazardous waste
Unlikely Unlikely Injection of wastes Unlikely
Cultural and Historical Resource Preservation
Section 106, National Historic Preservation Act of 1966 (NHPA) (16 USC 470 et seq.)
Ensure consideration of the values of historic properties in carrying out federal activities, and to make efforts to identify and mitigate impacts to significant historic properties
Review of NPDES activity
Unlikely Review of NPDES activity
Unlikely
Hazardous Waste Generator and Transporter
Sections 3001 through 3019 of the Resource Conservation and Recovery Act (RCRA) (42 USC 3251 et seq.)
Establishes criteria governing the management of hazardous waste
Management of hazardous waste
Management of hazardous waste
Management of hazardous waste
Management of hazardous waste
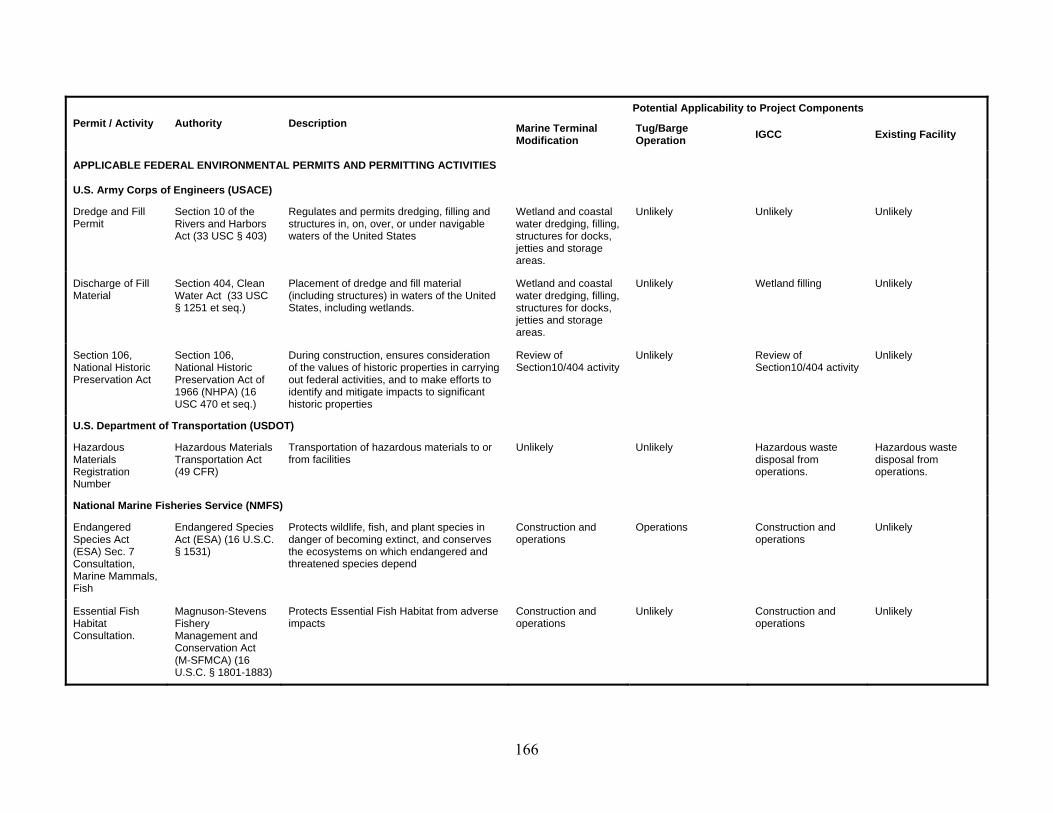
166
Potential Applicability to Project Components Permit / Activity Authority Description Marine Terminal
Modification Tug/Barge Operation IGCC Existing Facility
APPLICABLE FEDERAL ENVIRONMENTAL PERMITS AND PERMITTING ACTIVITIES
U.S. Army Corps of Engineers (USACE)
Dredge and Fill Permit
Section 10 of the Rivers and Harbors Act (33 USC § 403)
Regulates and permits dredging, filling and structures in, on, over, or under navigable waters of the United States
Wetland and coastal water dredging, filling, structures for docks, jetties and storage areas.
Unlikely Unlikely Unlikely
Discharge of Fill Material
Section 404, Clean Water Act (33 USC § 1251 et seq.)
Placement of dredge and fill material (including structures) in waters of the United States, including wetlands.
Wetland and coastal water dredging, filling, structures for docks, jetties and storage areas.
Unlikely Wetland filling Unlikely
Section 106, National Historic Preservation Act
Section 106, National Historic Preservation Act of 1966 (NHPA) (16 USC 470 et seq.)
During construction, ensures consideration of the values of historic properties in carrying out federal activities, and to make efforts to identify and mitigate impacts to significant historic properties
Review of Section10/404 activity
Unlikely Review of Section10/404 activity
Unlikely
U.S. Department of Transportation (USDOT)
Hazardous Materials Registration Number
Hazardous Materials Transportation Act (49 CFR)
Transportation of hazardous materials to or from facilities
Unlikely Unlikely Hazardous waste disposal from operations.
Hazardous waste disposal from operations.
National Marine Fisheries Service (NMFS)
Endangered Species Act (ESA) Sec. 7 Consultation, Marine Mammals, Fish
Endangered Species Act (ESA) (16 U.S.C. § 1531)
Protects wildlife, fish, and plant species in danger of becoming extinct, and conserves the ecosystems on which endangered and threatened species depend
Construction and operations
Operations Construction and operations
Unlikely
Essential Fish Habitat Consultation.
Magnuson-Stevens Fishery Management and Conservation Act (M-SFMCA) (16 U.S.C. § 1801-1883)
Protects Essential Fish Habitat from adverse impacts
Construction and operations
Unlikely Construction and operations
Unlikely

167
Potential Applicability to Project Components Permit / Activity Authority Description Marine Terminal
Modification Tug/Barge Operation IGCC Existing Facility
APPLICABLE FEDERAL ENVIRONMENTAL PERMITS AND PERMITTING ACTIVITIES
Fish & Wildlife Coordination Act Consultation, Marine Mammal Protection Act Consultation
Fish and Wildlife Coordination Act (FWCA) (16 USC § 661 et seq) Marine Mammal Protection Act (MMPA) (16 U.S.C. § 1361-1407)
Protection of wildlife resources and habitat. ensuring that marine mammal are maintained at, or in some cases restored to healthy population levels.
Construction and operations
Operations Construction and operations
Unlikely
U.S. Fish and Wildlife Service (USFWS)
ESA Sec. 7 Consult.
Endangered Species Act (ESA) (16 U.S.C. § 1531)
Protects wildlife, fish, and plant species in danger of becoming extinct, and to conserve the ecosystems on which endangered and threatened species depend
Construction and operations
Operations Construction and operations
Unlikely
Bald Eagle Protection Act Clearance
Bald and Golden Eagle Protection Act (16 U.S.C. § 668)
Makes it unlawful to take, pursue, molest, or disturb bald and golden eagles, their nests, or their eggs
Construction and operations
Unlikely Construction and operations
Unlikely
Migratory Bird Protection Act Consultation
Migratory Bird Treaty Act (Title 16 U.S.C. § 703)
Protect birds that have common migration patterns between the United States and Canada, Mexico, Japan, and Russia
Construction and operations
Unlikely Construction and operations
Unlikely
Fish & Wildlife Coordination Act Consultation
Fish and Wildlife Coordination Act (FWCA) (16 USC § 661 et seq)
Protection of wildlife resources and habitat Construction and operations
Operations Construction and operations
Unlikely
APPLICABLE STATE ENVIRONMENTAL PERMITS AND PERMITTING ACTIVITIES
Alaska Department of Natural Resources (ADNR)
Alaska Coastal Management Program (ACMP) Consistency Review
Alaska Statutes (AS) 46.39 and 46.40
Project is within Alaska’s Coastal Zone. Therefore, it will be reviewed for consistency with the ACMP’ Coastal Management Program’s enforceable policies, including coastal district policies. The review is a coordinated review of federal and state authorizations, all of which require a positive consistency determination before issuance of permits. Coastal Consistency Reviews are conducted by ADNR Office of Project Management and Permitting (ADNR/OPMP)
Within coastal zone Within coastal zone Within coastal zone Within coastal zone

168
Potential Applicability to Project Components Permit / Activity Authority Description Marine Terminal
Modification Tug/Barge Operation IGCC Existing Facility
APPLICABLE STATE ENVIRONMENTAL PERMITS AND PERMITTING ACTIVITIES
Alaska Department of Natural Resources (ADNR)
Coastal Plan Questionnaire (CPQ)
AS 46.39 and 46.40 The CPQ is the regulatory checklist that will be the guiding document during the ACMP review for permits to be acquired for the project. A project plan of operations, and permit applications will be attached to the CPQ.
Must be done as part of ACMP review
Must be done as part of ACMP review
Must be done as part of ACMP review
Must be done as part of ACMP review
Plan of Operations
AS 27.21 While the CPQ is the guiding document checklist for permitting, this unit plan will guide the entire project. Descriptions in the plan of operations will be the basis upon which all state regulatory agencies will base their permitting consistency reviews. It also will address regulatory concerns, information needs and methods for resolving them.
Included with CPQ Included with CPQ Included with CPQ Included with CPQ
Temporary Water Use Permit (TWUP)
AS 46.15 Temporary uses of a significant volume of water, for up to 5 years during development or operation of a project requires a Temporary Water Use Permit. The permit is issued by the ADNR/MLW/Water Section
Unlikely Unlikely Required for temporary water use
Unlikely. Water can be used via existing Agrium KNO water rights
Permit to Appropriate Water (Water Rights)
AS 46.15 Appropriation of a significant amount of water on other than a temporary basis requires authorization by a Water Rights Permit. A water rights permit is a legal right to use a specific amount of surface or groundwater from a specific source. This water can be diverted, impounded, or withdrawn for a specific use. When a water right is granted, it becomes appurtenant to the land where the water is being used for as long as the water is used.
Unlikely. Unlikely Required. Existing. Agrium KNO is allowed to withdraw about 2MM gpd of water.
Material Sale AS 38.05 and 020 If materials such as sand, gravel, or rock, are needed from state lands off a millsite lease or road right-of-way, then a separate material sale is issued by the ADNR/MLW/Lands Section.
Unlikely. Unlikely Sand, gravel and rock will be required for construction.
Sand, gravel and rock will be required for construction.

169
Potential Applicability to Project Components Permit / Activity Authority Description Marine Terminal
Modification Tug/Barge Operation IGCC Existing Facility
APPLICABLE STATE ENVIRONMENTAL PERMITS AND PERMITTING ACTIVITIES
Alaska Department of Natural Resources (ADNR)
Cultural Resource Protection.
National Historic Preservation Act Section 106
Clearance must be obtained to ensure that a project will not significantly impact cultural and archaeological resources. If significant disturbance cannot be avoided, then a compensation strategy is developed.
Cultural resource clearances are obtained from ADNR/State Historic Preservation Office.
Unlikely Unlikely Required for undeveloped sites adjacent to Agrium
Unlikely
Title 41 Permit AS 16.05.840 or 16.05.870
This permit, regardless of land ownership, is required for any activity conducted within fish-bearing waters, such as docks, material sites, and water-withdrawal structures.
The ADNR/OHMP issues this permit.
Required for construction and operation.
Unlikely Required for construction and operation.
Required for construction and operation.
Fish Passage AS 16.05.840 (Fishway Act) and AS 41.14
The Fishway Act requires that an individual or governmental agency notify and obtain authorization from the Alaska Department of Natural Resources (ADNR) for activities within or across a stream used by fish if the department determines that such uses or activities can represent an impediment to the efficient passage of fish. Culvert installation; stream realignment or diversions; dams; low-water crossings; and construction, placement, deposition, or removal of any material or structure below ordinary high water all require approval from the ADNR.
Although approval is by the ADNR/OHMP, an ADF&G Fish Habitat Biologist will review and make recommendation.
Required for construction and operation.
Unlikely Required for construction and operation.
Required for construction and operation.

170
Potential Applicability to Project Components Permit / Activity Authority Description Marine Terminal
Modification Tug/Barge Operation IGCC Existing Facility
APPLICABLE STATE ENVIRONMENTAL PERMITS AND PERMITTING ACTIVITIES
Alaska Department of Natural Resources (ADNR)
FISH Habitat Permit
AS 16.05.870 (Anadromous Fish Act)
Alaska Statute 41.14.870 (Anadromous Fish Act) requires that an individual or governmental agency provide prior notification and obtain approval from the ADNR "to construct a hydraulic project or use, divert, obstruct, pollute, or change the natural flow or bed" of a specified anadromous waterbody or "to use wheeled, tracked, or excavating equipment or log-dragging equipment in the bed" of a specified anadromous waterbody. All activities within or across a specified anadromous waterbody and all instream activities affecting a specified anadromous waterbody require approval from the ADNR, including construction; road crossings; gravel removal; placer mining; water withdrawals; the use of vehicles or equipment in the waterway; stream realignment or diversion; bank stabilization; blasting; and the placement, excavation, deposition, disposal, or removal of any material. Recreational boating and fishing activities generally do not require a permit.
Although approval is by the ADNR/OHMP, an ADF&G Fish Habitat Biologist reviews plans and notifications.
Required for construction and operation.
Unlikely Required for construction and operation.
Required for construction and operation.

171
Potential Applicability to Project Components Permit / Activity Authority Description Marine Terminal
Modification Tug/Barge Operation IGCC Existing Facility
APPLICABLE STATE ENVIRONMENTAL PERMITS AND PERMITTING ACTIVITIES
Alaska Department of Environmental Conservation (ADEC)
Solid Waste Permits and a Comprehensive Solid Waste Management Plan
AS 44.46, AS 46.03, AS 46.04, and AS 46.06
During construction and operation, the project may require solid waste disposal permits for inert waste, wood waste, industrial solid waste, coal ash, hazardous waste, polluted soil, building demolition waste containing asbestos, building demolition waste, and construction waste. This means, this project then may require development and submittal of a comprehensive solid waste management permit in lieu of individual permits.
Permits and/or a solid waste management plan are approved by the ADEC/Division of Environmental Health /Solid Waste Program to operate the solid waste management system.
At a minimum, for incinerated domestic waste and sewage, inert waste, wood waste, and construction waste.
Unlikely At a minimum, for inert waste, wood waste, industrial solid waste, coal ash, hazardous waste, and construction waste.
Probably existing but for industrial solid waste, hazardous waste, polluted soil, building demolition waste containing asbestos, building demolition waste, and construction waste.
Section 401 Certification
Section 401 of the Clean Water Act (CWA)
Storm water discharges are regulated under the NPDES program and certain storm water discharges require an NPDES permit from EPA. Under the NPDES program the state of Alaska does not have permitting and enforcement authority. However, pursuant to Section 401 of the Clean Water Act (CWA) the state of Alaska certifies EPA general permits both construction activities and during operational phases. This is commonly known as "401 Certification". The facility may have separate NPDES permits to cover waste water and storm water discharges, or the requirements may be combined into one permit.
Required for construction and operation.
Unlikely Required for construction and operation.
Existing (for current NPDES permit)

172
Potential Applicability to Project Components Permit / Activity Authority Description Marine Terminal
Modification Tug/Barge Operation IGCC Existing Facility
APPLICABLE STATE ENVIRONMENTAL PERMITS AND PERMITTING ACTIVITIES
Alaska Department of Environmental Conservation (ADEC)
Certificate of Reasonable Assurance for 402 and 404 Permits.
Section 402 and 404 CWA
Activities involving discharge of wastewater or fill material into waters of the United States are not only governed by the terms and conditions of a CWA Section 402 NPDES Permit from EPA, and a CWA Section 404 Permit from the COE, but also require a Certificate of Reasonable Assurance from the State of Alaska. These certificates can only be issued if ADEC/Division of Water can state that the proposed activity will comply with Section 401 of the CWA and that any discharge will comply with applicable state water quality standards.
Required for construction and operation of terminals.
Unlikely Required for construction and operation
Unlikely
Approval to Construct and Operate a Public Water Supply System.
18 AAC 70 and 18 AAC 72
Prior to start of construction, ADEC/Division of Water must approve detailed engineering reports, plans, and specifications for the construction, alteration, or modification of a public water system. Once construction has been completed, ADEC must approve operation of a public water system.
Required for construction and operation of terminal. Potable water supply
Unlikely Required for construction and operation of facility potable water supply
Unlikely
Plan Review for Non-Domestic Wastewater Treatment System.
18 AAC 72 or Section 401 Certification
Plans for treatment of wastewater from non-domestic wastewater sources must be submitted to the ADEC/Division of Water. Approval follows, either as an ADEC Wastewater Disposal Permit (18 AAC 72) or an NPDES Permit (ADEC reviews plans under CWA Section 401).
Required for construction and operation of terminal wastewater system
Unlikely Required for wastewater treatment system
Unlikely

173
Potential Applicability to Project Components Permit / Activity Authority Description Marine Terminal
Modification Tug/Barge Operation IGCC Existing Facility
APPLICABLE STATE ENVIRONMENTAL PERMITS AND PERMITTING ACTIVITIES
Alaska Department of Environmental Conservation (ADEC)
Plan Review and Construction Approval for Domestic Sewage System.
18 AAC 72 The construction and operation of facilities that collect, treat, and dispose of wastewater is governed by a plan review to ensure that minimum standards are applied. Detailed engineering reports, plans, and specifications must be certified by a registered Professional Engineer. These are then submitted for approval by the ADEC/Division of Water.
Required for construction and operation of terminal domestic wastewater system.
Unlikely Required for domestic wastewater treatment system
Unlikely
Spill Prevent, Control and Countermeasure (SPCC) Plan Review
40 CFR 112.1-7. ADEC will use its CWA Section 401 certification authority to review the SPCC Plan required by EPA for storage of large quantities of oil.
Required for fuel storage areas.
Unlikely Required for fuel storage areas.
Required for fuel storage areas.
Oil Discharge Prevention and Contingency Plan Review and Approval.
18 AAC 75.455 Approval of an oil discharge contingency plan is required prior to commencement of operation of vessels and oil barges on state waters, or for oil terminal facilities capable of storing more than 1,320 gallons above ground or more than 42,000 gallons underground. These contingency plans are reviewed and approved every 3 years by the ADEC/Division of Spill Prevention and Response/ Industry Preparedness Program
Required for fuel storage areas.
Required for fuel storage areas.
Unlikely Unlikely
Air Quality Control Permits
18 AAC 50 Air Quality Permits. The construction, modification, and operation of facilities that produce air pollutants require state Air Quality Control Permits. Depending on the activity, projects could require Title I Construction, Title I Minor, and/or Title V operating permits. The determination to require permits is based on the total emissions and/or project emissions.
Generally, air quality must be maintained at the lowest practical concentrations of contaminants specified in the Ambient Air Quality Standards of 18 AAC 50.020(a).
Unlikely Unlikely Title I Construction Permit and Title V Operating Permit will be required.
Title I Minor or Title I Construction Permit (depending on emission reductions), and Title V Operating Permit (significant version) required.

174
Potential Applicability to Project Components Permit / Activity Authority Description Marine Terminal
Modification Tug/Barge Operation IGCC Existing Facility
APPLICABLE STATE ENVIRONMENTAL PERMITS AND PERMITTING ACTIVITIES
Alaska Department of Environmental Conservation (ADEC)
Air Quality Open Burn Approval
18 AAC 50.065 An open burn approval is required for open burning of woody debris if the intent is to clear and burn from 40 acres or more in a year. Whereas the ADNR Burn Permit primarily is concerned with fire control, this ADEC permit primarily is concerned with air quality.
Unlikely Unlikely Required during construction.
Unlikely
Food Sanitation Permits
AS 46.03.20 Construction and operation of permanent, temporary, and mobile food services is governed and permitted by the ADEC/Division of Environmental Health/Food Safety and Sanitation Program.
Unlikely Unlikely Food services during construction and operation will require permits.
Unlikely
Alaska Department of Fish and Game (ADF&G)
Fish Resources Permit
5 AAC 41 This permit is required of anyone who wants to collect or hold alive any live fish, shellfish, or aquatic plants or their gametes (except gold fish and decorative tropical fish) for purposes of science, education, propagation, or exhibition. It is issued by the ADF&G/Division of Sports Fish, and ADF&G/Division of Commercial Fisheries.
Unlikely Unlikely Required during baseline studies for marine intake/outfall.
Unlikely
Alaska Department of Transportation and Public Facilities (ADOT/PF)
Driveway Permit 17 AAC 10.020 ADOT/PF uses state highway standards to review and approve plans for modifying, realigning, or constructing state roads, including driveways or roadways entering them.
Unlikely Unlikely Required for access roadway entering state roads.
Required for access roadway entering state roads.
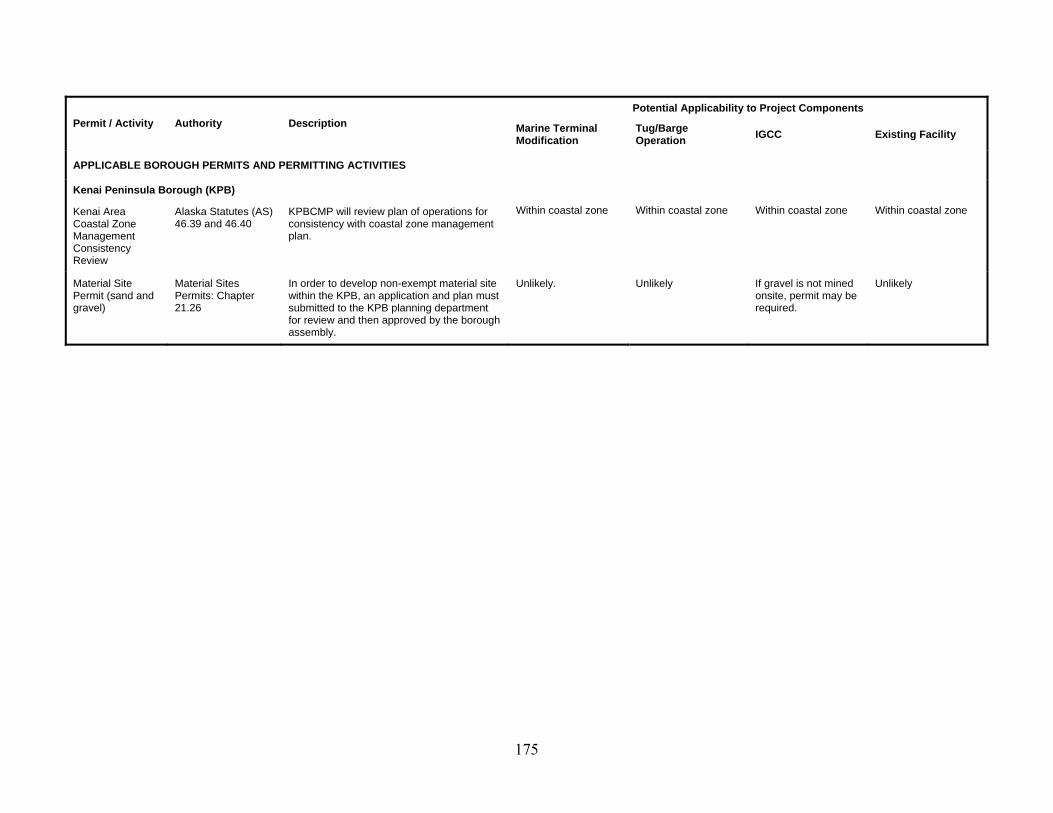
175
Potential Applicability to Project Components Permit / Activity Authority Description Marine Terminal
Modification Tug/Barge Operation IGCC Existing Facility
APPLICABLE BOROUGH PERMITS AND PERMITTING ACTIVITIES
Kenai Peninsula Borough (KPB)
Kenai Area Coastal Zone Management Consistency Review
Alaska Statutes (AS) 46.39 and 46.40
KPBCMP will review plan of operations for consistency with coastal zone management plan.
Within coastal zone Within coastal zone Within coastal zone Within coastal zone
Material Site Permit (sand and gravel)
Material Sites Permits: Chapter 21.26
In order to develop non-exempt material site within the KPB, an application and plan must submitted to the KPB planning department for review and then approved by the borough assembly.
Unlikely. Unlikely If gravel is not mined onsite, permit may be required.
Unlikely

National Energy Technology Laboratory NETL Contacts: Michael Eastman Sr. Management and Technical Analyst 412-386-6136 [email protected] Visit the NETL website at: www.netl.doe.gov July 2006
Research and Development Solutions, LLC RDS Contacts: Robert Chaney SAIC 907-271-3633 [email protected]