bell curves and 8 standard deviation - weebly
TRANSCRIPT

103
Opening Reading
1. Read over the description of a bell curve on the next page and then mark the picture with the characteristics of the curve. Which characteristic was confusing for you?
What Is a Bell Curve or Normal Curve?
A bell curve is another name for a normal distribution curve (sometimes just shortened to “normal curve”) or Gaussian distribution. The name comes from the fact it looks bell-shaped.
Characteristics of Bell Curves, Normal Curves
1. The mean (average) is always in the center of a bell curve or normal curve.
2. A bell curve/normal curve has only one mode, or peak. Mode here means “peak”; a curve with one peak is unimodal; two peaks is bimodal, and so on.
3. A bell curve/normal curve has predictable standard deviations that follow the 68-95-99.7 rule.
4. A bell curve/normal curve is symmetric. Exactly half of data points are to the le! of the mean and exactly half are to the right of the mean.
Source: http://www.statisticshowto.com/bell-curve/
LEARNING OBJECTIVES
➤ Today I am: examining the properties of bell curves.
➤ So that I can: determine the standard deviation of the data sets.
➤ I’ll know I have it when I can: understand how the standard deviation describes
the variability of the data.
Bell Curves and Standard Deviation
LESSON
8
104 Module 1 Descriptive Statistics
Graphs © Iamnee/Shutterstock.com
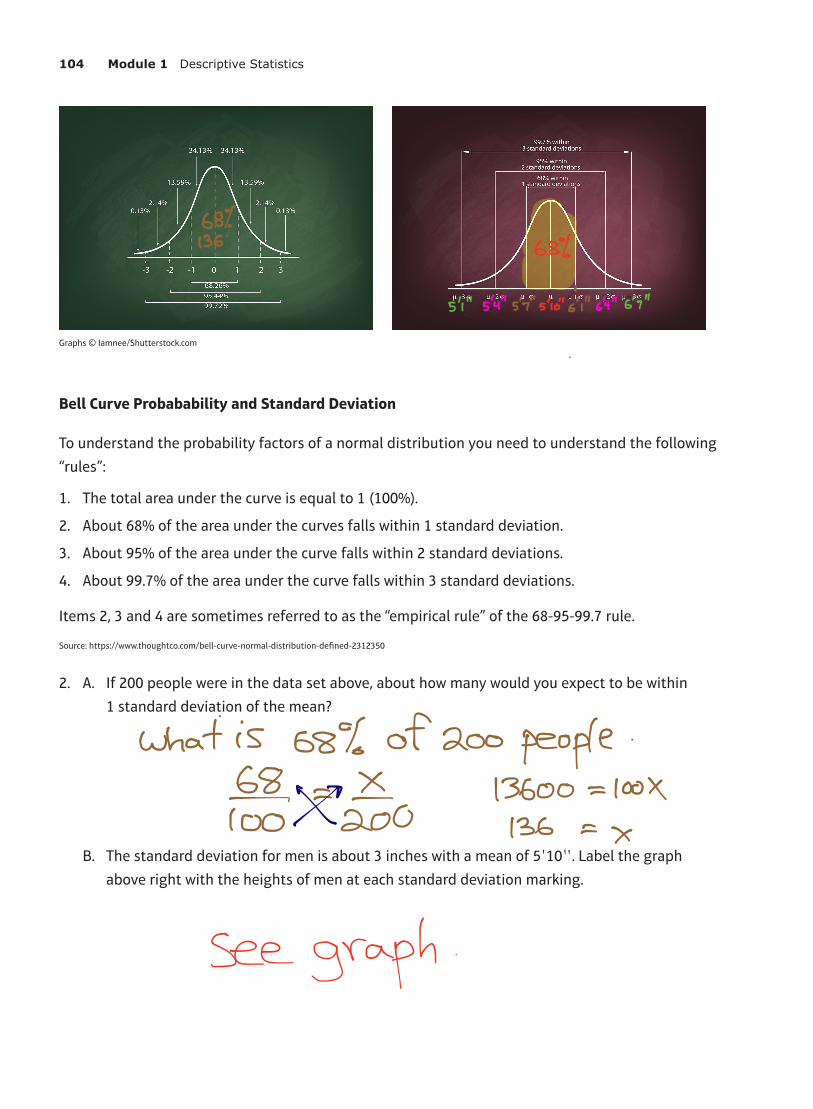
Bell Curve Probabability and Standard Deviation
To understand the probability factors of a normal distribution you need to understand the following “rules”:
1. The total area under the curve is equal to 1 (100%).
2. About 68% of the area under the curves falls within 1 standard deviation.
3. About 95% of the area under the curve falls within 2 standard deviations.
4. About 99.7% of the area under the curve falls within 3 standard deviations.
Items 2, 3 and 4 are sometimes referred to as the “empirical rule” of the 68-95-99.7 rule.
Source: https://www.thoughtco.com/bell-curve-normal-distribution-defined-2312350
2. A. If 200 people were in the data set above, about how many would you expect to be within 1 standard deviation of the mean?
B. The standard deviation for men is about 3 inches with a mean of 5!10!!. Label the graph above right with the heights of men at each standard deviation marking.
68136 68
54 5454sco I 6464
what is 68 of 200 people68TOO 00
13600 look136 X
see graph
Unit 1 Measuring Distributions Lesson 8 Bell Curves and Standard Deviation 105
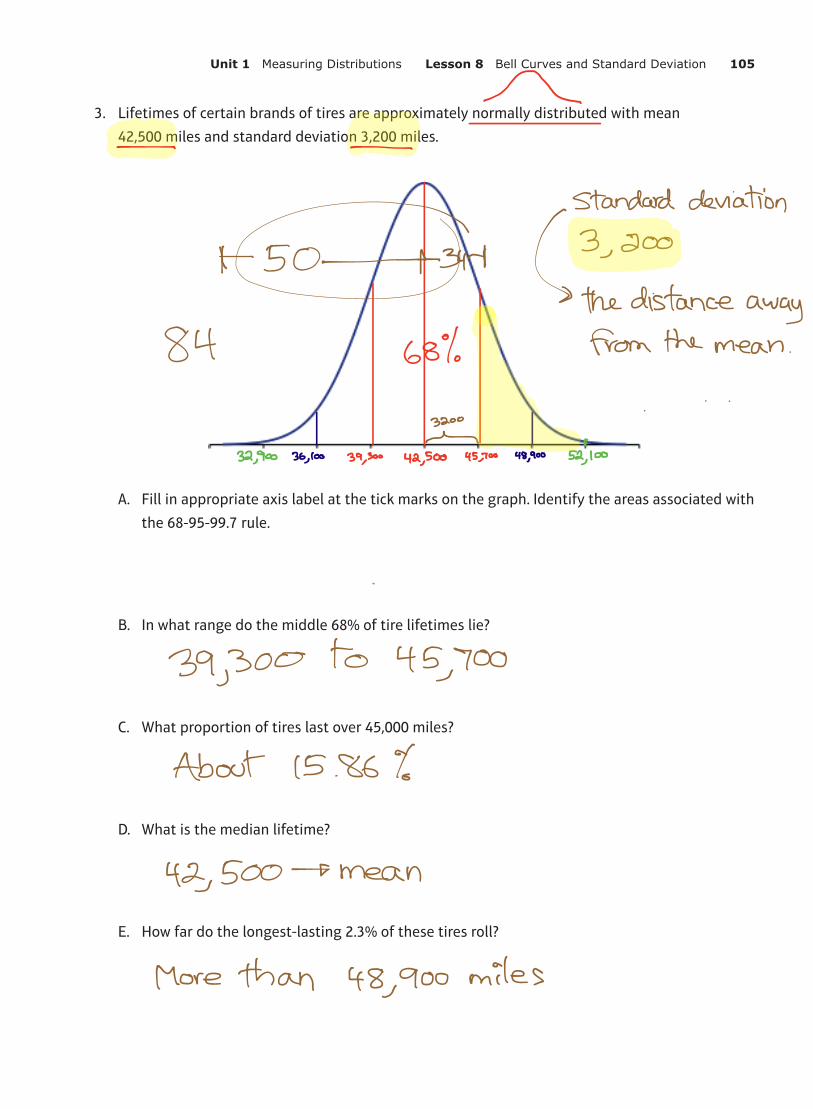
3. Lifetimes of certain brands of tires are approximately normally distributed with mean 42,500 miles and standard deviation 3,200 miles.
A. Fill in appropriate axis label at the tick marks on the graph. Identify the areas associated with the 68-95-99.7 rule.
B. In what range do the middle 68% of tire lifetimes lie?
C. What proportion of tires last over 45,000 miles?
D. What is the median lifetime?
E. How far do the longest-lasting 2.3% of these tires roll?
astandard deviation
K 44 3,200thedistanceaway
84 68 1from the mean
3200
32,90036,1
39,300 42,575,700 48 529100
39,300 to 45,700
About 15.86
42,500 mean
More than 48,900 miles

106 Module 1 Descriptive Statistics
Sketch a normal curve for each distribution. Label the x-axis at one, two, and three standard deviations from the mean.
4. Mean ! 95; Standard Deviation ! 12 5. Mean ! 42; Standard Deviation ! 5.2
6. Mean ! 10; Standard Deviation ! 1.5 7. Mean ! 60; Standard Deviation ! 6
8. Mean ! 23.8; Standard Deviation ! 5.2 9. Mean ! 15; Standard Deviation ! 3.6
Unit 1 Measuring Distributions Lesson 8 Bell Curves and Standard Deviation 107
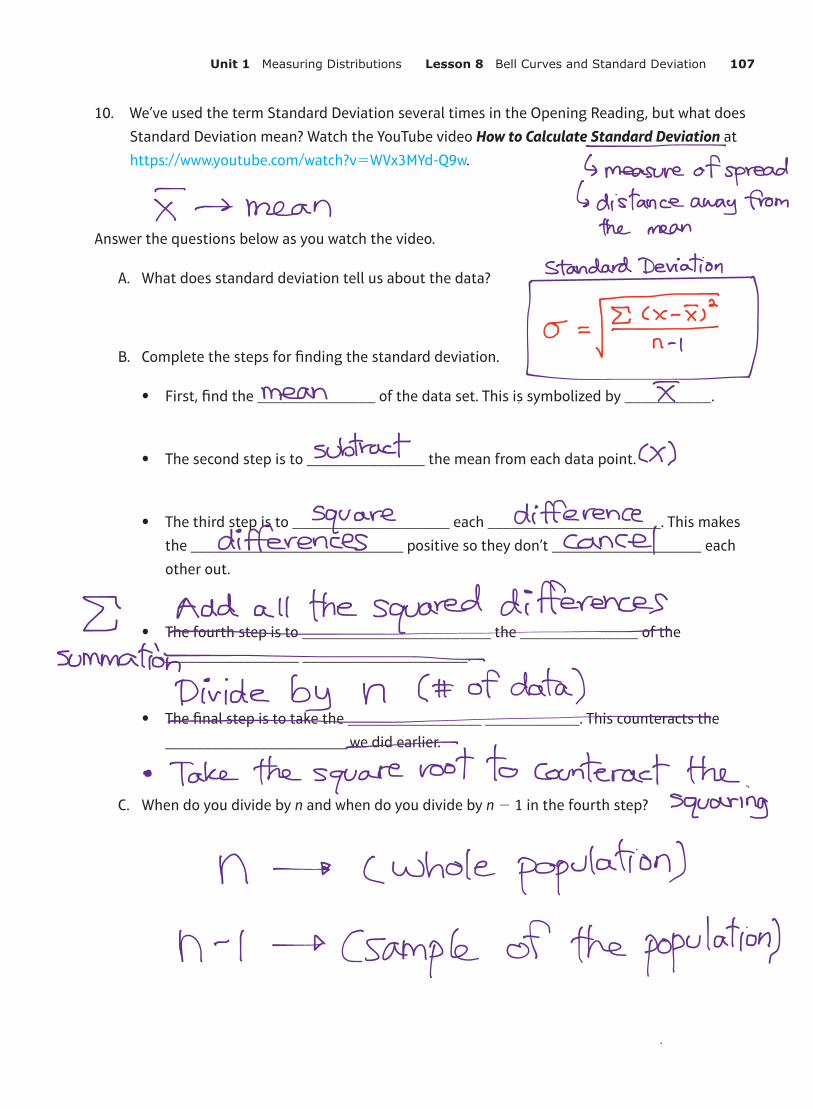
10. We’ve used the term Standard Deviation several times in the Opening Reading, but what does Standard Deviation mean? Watch the YouTube video How to Calculate Standard Deviation at https://www.youtube.com/watch?v!WVx3MYd-Q9w.
Answer the questions below as you watch the video.
A. What does standard deviation tell us about the data?
B. Complete the steps for finding the standard deviation.
ō� First, find the _______________ of the data set. This is symbolized by ___________.
ō� The second step is to _______________ the mean from each data point.
ō� The third step is to ____________________ each ______________________. This makes the ___________________________ positive so they don’t ___________________ each other out.
ō� The fourth step is to ________________________ the _______________ of the _________________ _____________________.
ō� The final step is to take the _________________ ____________. This counteracts the _______________________ we did earlier.
C. When do you divide by n and when do you divide by n " 1 in the fourth step?
measure ofspreadI mean 6distanceawayfrom
the meanstandardDeviation
mean I
subtract x
square differencedifferences cancel
Add all the squared differencesEsumma
Divide by n C of data
Take the square root to counteract thesquaring
n whole population
n I sample of the population
108 Module 1 Descriptive Statistics
Exploratory Challenge 1—Finding the Standard Deviation
You will need: the Lesson 1 data from Station 4—Ruler Drop handout
You’ll be completing the table on the handout with the data from the Ruler Drop station. We are going to follow a multi-step process to calculate the Standard Deviation, which will help us measure how spread out the values are. Only the first column of each table is filled in with your class’ data.
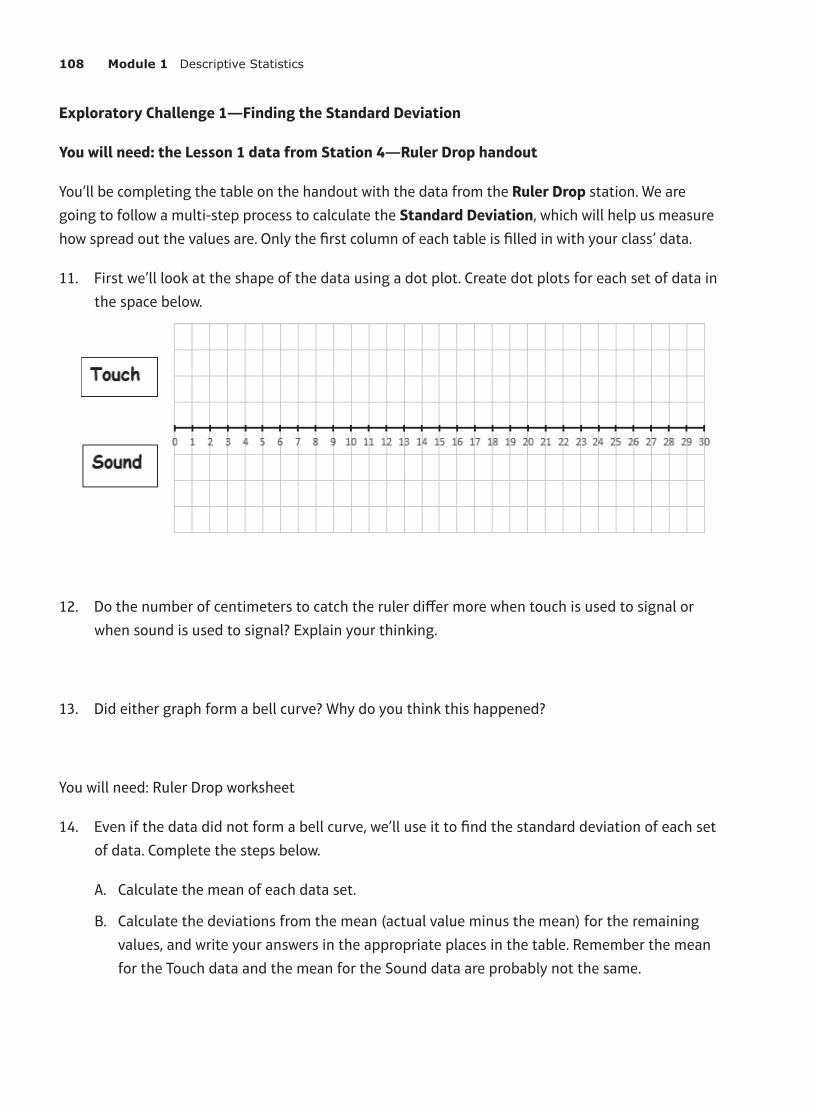
11. First we’ll look at the shape of the data using a dot plot. Create dot plots for each set of data in the space below.
12. Do the number of centimeters to catch the ruler differ more when touch is used to signal or when sound is used to signal? Explain your thinking.
13. Did either graph form a bell curve? Why do you think this happened?
You will need: Ruler Drop worksheet
14. Even if the data did not form a bell curve, we’ll use it to find the standard deviation of each set of data. Complete the steps below.
A. Calculate the mean of each data set.
B. Calculate the deviations from the mean (actual value minus the mean) for the remaining values, and write your answers in the appropriate places in the table. Remember the mean for the Touch data and the mean for the Sound data are probably not the same.

Unit 1 Measuring Distributions Lesson 8 Bell Curves and Standard Deviation 109
C. Square the deviations from the mean for each data set.
D. Add up the squared deviations. This result is the sum of the squared deviations.
For the Touch: _________________
For the Sound: _________________
E. The number of values in the data set is denoted by n. You divide the sum of the squared deviations by n " 1.
For the Touch: _________________
For the Sound: _________________
F. Finally, take the square root of the value you found in Part E. Units for Standard Deviation are the same as the units for the data set (number of centimeters, in this case). What does this answer mean?
For the Touch: _________________
For the Sound: _________________
15. Which set of data had the greatest standard deviation? How can you see this in the graph?
16. Mark off the mean, 1 standard deviation, 2 standard deviations, and 3 standard deviations on the graph. Does this follow the 68-95-99.7 rule?

110 Module 1 Descriptive Statistics
Lesson Summary
Bell Curve
Standard Deviation
The formula for the standard
deviation:
Description of the standard
deviation steps:
� x is a value from the original data set; 1. Calculate the mean
�� −x x is a deviation of the value, x,
from the mean, x;
2. Subtract the mean from each data
point
�� x x 2( )− is a squared deviation from
the mean;
3. Square each difference
�� x x 2∑( )− is the sum of the squared
deviations;
4. Calculate the mean of the squared
differences
��x xn 1
2∑( )−− is the result of dividing the
sum of the squared deviations by n " 1;
5. Take the square root
So, ∑( )−
−x x
n 1
2
is the standard deviation.
Source: https://www.youtube.com/watch?v=WVx3MYd-Q9w
© Iamnee/Shutterstock.com
Unit 1 Measuring Distributions Lesson 8 Bell Curves and Standard Deviation 111
NAME: PERIOD: DATE:
Homework Problem Set
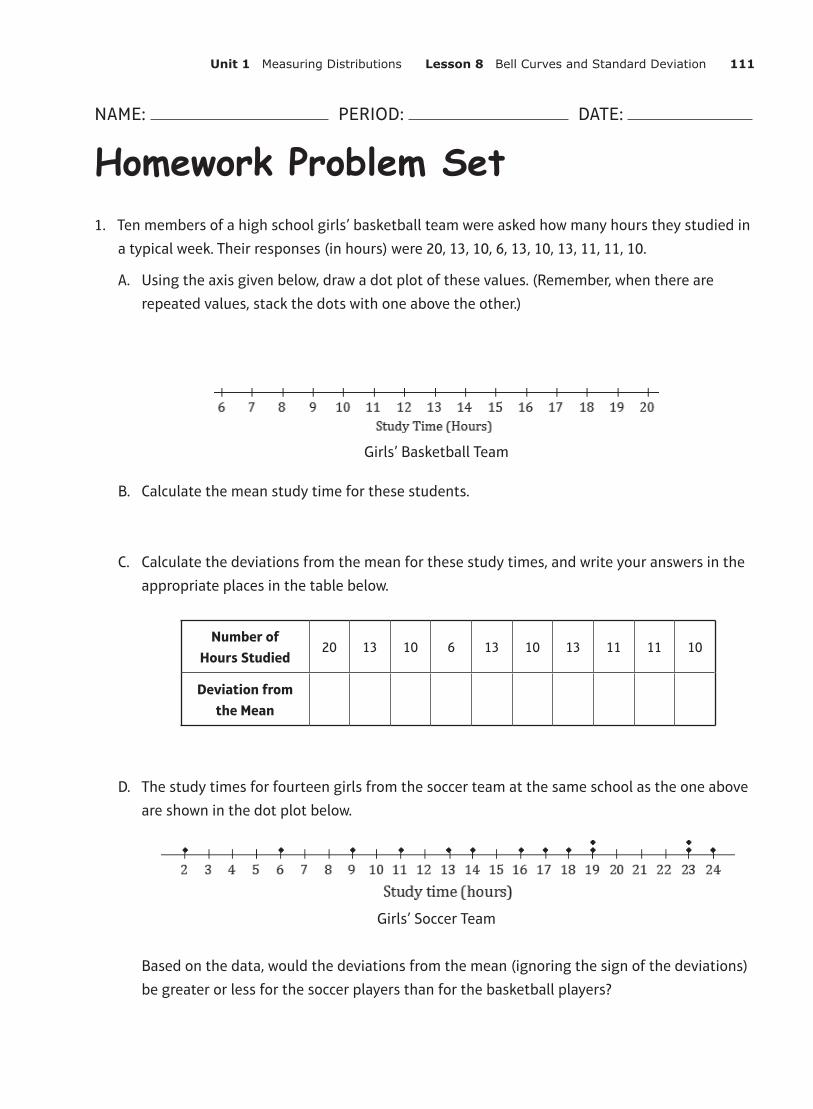
1. Ten members of a high school girls’ basketball team were asked how many hours they studied in a typical week. Their responses (in hours) were 20, 13, 10, 6, 13, 10, 13, 11, 11, 10.
A. Using the axis given below, draw a dot plot of these values. (Remember, when there are repeated values, stack the dots with one above the other.)
Girls’ Basketball Team
B. Calculate the mean study time for these students.
C. Calculate the deviations from the mean for these study times, and write your answers in the appropriate places in the table below.
Number of Hours Studied
20 13 10 6 13 10 13 11 11 10
Deviation from the Mean
D. The study times for fourteen girls from the soccer team at the same school as the one above are shown in the dot plot below.
Girls’ Soccer Team
Based on the data, would the deviations from the mean (ignoring the sign of the deviations) be greater or less for the soccer players than for the basketball players?

112 Module 1 Descriptive Statistics
2. All the members of a high school so!ball team were asked how many hours they studied in a typical week. The results are shown in the histogram below.
Source: The data set in this question comes from NCTM Core Math Tools, http://www.nctm.org/Classroom-Resources/Core-Math-Tools/Data-Sets/
So!ball Team
A. We can see from the histogram that four students studied around 5 hours per week. How many students studied around 15 hours per week?
B. How many students were there in total?
C. Suppose the four students represented by the histogram bar centered at 5 had all studied exactly 5 hours, the five students represented by the next histogram bar had all studied exactly 10 hours, and so on. If you were to add up the study times for all of the students, what result would you get?
D. What is the mean study time for these students?
E. What would you consider to be a typical deviation from the mean for this data set?

Unit 1 Measuring Distributions Lesson 8 Bell Curves and Standard Deviation 113
3. A small car dealership tests the fuel efficiency of sedans on its lot. It chooses 12 sedans for the test. The fuel efficiency (mpg) values of the cars are given in the table below. Complete the table as directed below.
Fuel Efficiency (miles per gallon)
29 35 24 25 21 21 18 28 31 26 26 22
Deviation from the Mean
Squared Deviation from the Mean
A. Calculate the mean fuel efficiency for these cars.
B. Calculate the deviations from the mean, and write your answers in the second row of the table.
C. Square the deviations from the mean, and write the squared deviations in the third row of the table.
D. Find the sum of the squared deviations.
E. What is the value of n for this data set? Divide the sum of the squared deviations by n " 1.
F. Take the square root of your answer to part (E) to find the standard deviation of the fuel efficiencies of these cars. Round your answer to the nearest hundredth.
G. Explain what the standard deviation of the fuel efficiencies of the cars tells you.
Sample
mean I 3,026 25.5
j 3 9 1.5 0.5 4.5 4.5 7.52.5 55 0.5 O5 3.5
25 5
4.78
The standard deviation of 4.78 mpg meanson average 68 of the small cars in the
dealership have the fuel efficiencybetween 28 and 20.92 mpg
114 Module 1 Descriptive Statistics
4. The same dealership decides to test fuel efficiency of SUVs. It selects six SUVs on its lot for the test. The fuel efficiencies (in miles per gallon) of these cars are shown below.
21 21 21 30 28 24
A. Calculate the mean and the standard deviation of these values. Be sure to show your work, and include a unit in your answer.
B. Which of the two data sets (Problem 3 or Problem 4) has the larger standard deviation? What does this tell you about the two types of cars (sedans and SUVs)?
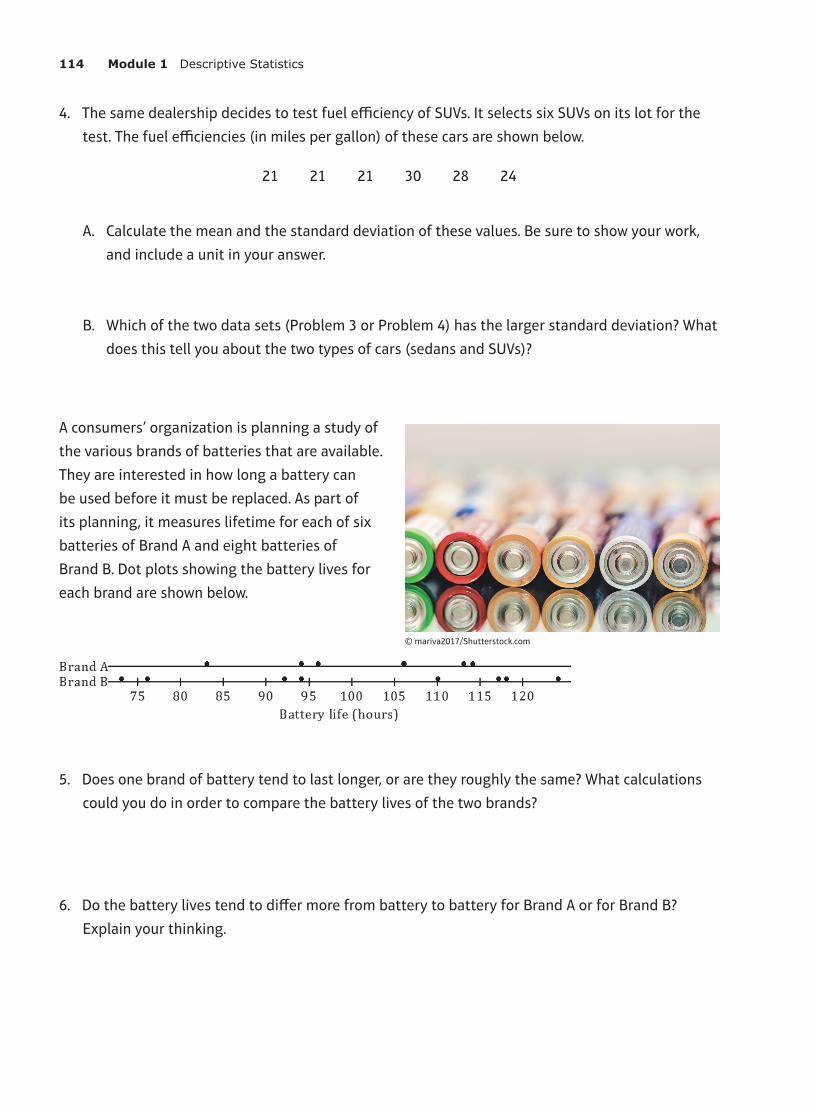
A consumers’ organization is planning a study of the various brands of batteries that are available. They are interested in how long a battery can be used before it must be replaced. As part of its planning, it measures lifetime for each of six batteries of Brand A and eight batteries of Brand B. Dot plots showing the battery lives for each brand are shown below.
5. Does one brand of battery tend to last longer, or are they roughly the same? What calculations could you do in order to compare the battery lives of the two brands?
6. Do the battery lives tend to differ more from battery to battery for Brand A or for Brand B? Explain your thinking.
© mariva2017/Shutterstock.com

Unit 1 Measuring Distributions Lesson 8 Bell Curves and Standard Deviation 115
7. Would you prefer a battery brand that has battery lives that do not vary much from battery to battery? Why or why not?
The table below shows the lives (in hours) of the Brand A batteries. We are going to follow a multi-step process to calculate the Standard Deviation, which will help us measure how spread out the values are—how long can we expect an average Brand A Battery to last. The first value has been done for you.
Life (Hours) 83 94 96 106 113 114
Deviation from the Mean
"18
Squared Deviations from the Mean
324
de·vi·a·tion
1. the action of departing from an established course or accepted standard.
2. Statistics: the amount by which a single measurement differs from a fixed valuesuch as the mean.
8. A. Calculate the mean.
B. Calculate the deviations from the mean (actual value minus the mean) for the remaining values, and write your answers in the appropriate places in the table. The first one has been done for you.
C. Square the deviations from the mean. For example, when the deviation from the mean is "18 the squared deviation from the mean is ("18)2 ! 324.
D. Add up the squared deviations (This result is the sum of the squared deviations).
116 Module 1 Descriptive Statistics
E. The number of values in the data set is denoted by n. In this example, n is 6. You divide the sum of the squared deviations by n " 1, which here is 6 " 1 ! 5.
F. Finally, you take the square root of the value you found in Part E. Units for Standard Deviation are the same as the units for the data set (hours, in this case). What does this answer mean?
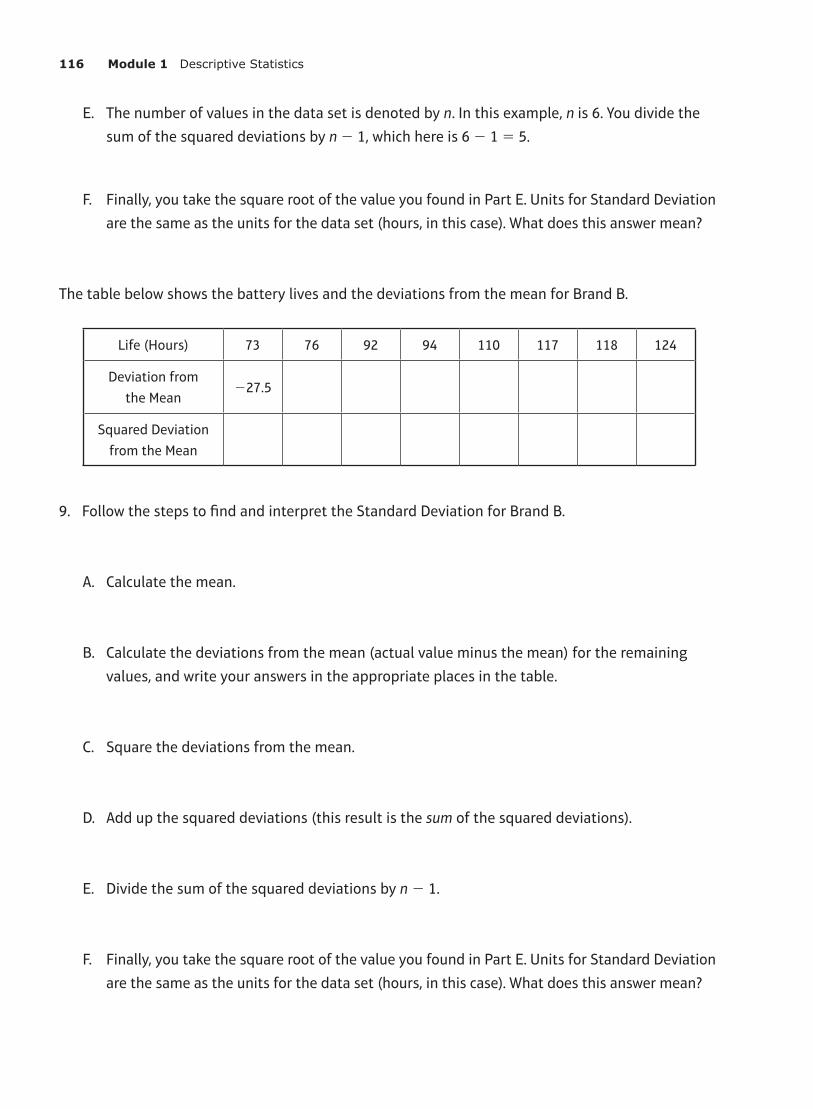
The table below shows the battery lives and the deviations from the mean for Brand B.
Life (Hours) 73 76 92 94 110 117 118 124
Deviation from the Mean
"27.5
Squared Deviation from the Mean
9. Follow the steps to find and interpret the Standard Deviation for Brand B.
A. Calculate the mean.
B. Calculate the deviations from the mean (actual value minus the mean) for the remaining values, and write your answers in the appropriate places in the table.
C. Square the deviations from the mean.
D. Add up the squared deviations (this result is the sum of the squared deviations).
E. Divide the sum of the squared deviations by n " 1.
F. Finally, you take the square root of the value you found in Part E. Units for Standard Deviation are the same as the units for the data set (hours, in this case). What does this answer mean?

Unit 1 Measuring Distributions Lesson 8 Bell Curves and Standard Deviation 117
The lives of five batteries of a third brand, Brand C, were determined. The dot plot below shows the lives of the Brand A and Brand C batteries.
10. Which brand has the greater mean battery life? (You should be able to answer this question without doing any calculations.)
11. Which brand shows greater variability?
12. Which brand would you expect to have the greater standard deviation?
13. Why would we want to know this information? (Quality control, reliability, etc.)
Variability: The extent to
which data points diverge
from the mean and from
each other.
118 Module 1 Descriptive Statistics
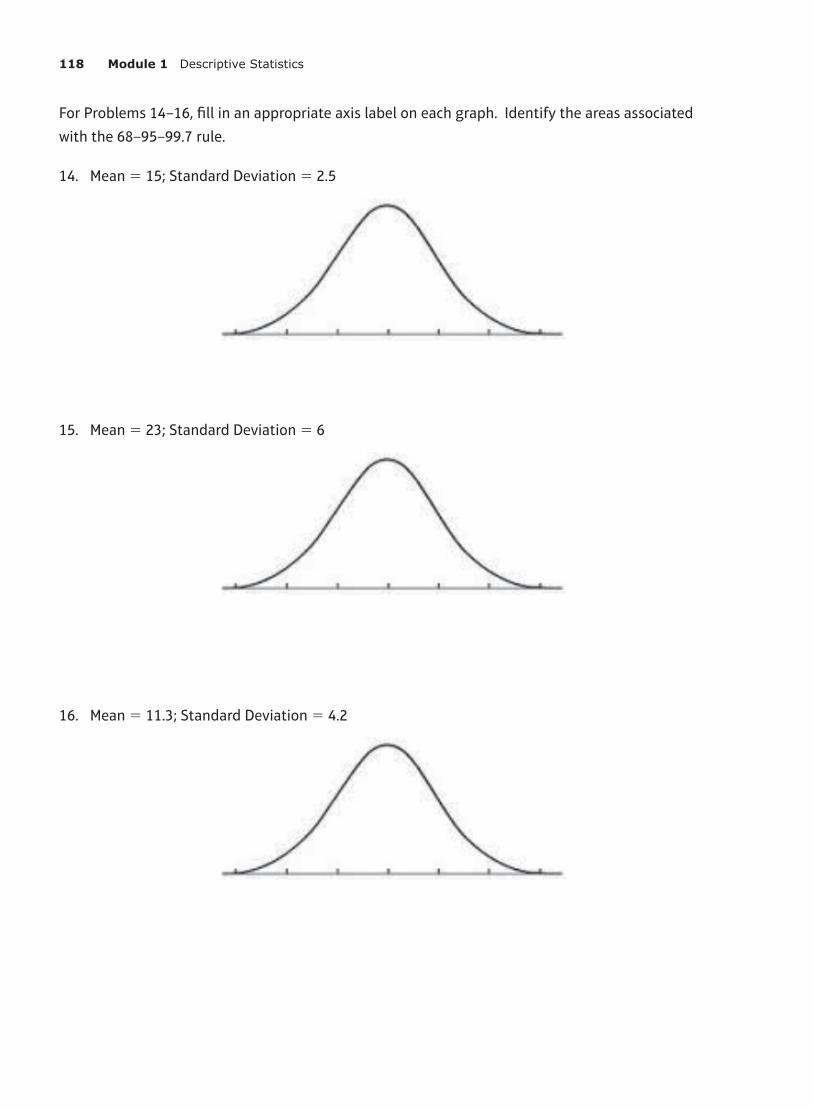
For Problems 14–16, fill in an appropriate axis label on each graph. Identify the areas associated with the 68–95–99.7 rule.
14. Mean ! 15; Standard Deviation ! 2.5
15. Mean ! 23; Standard Deviation ! 6
16. Mean ! 11.3; Standard Deviation ! 4.2
Unit 1 Measuring Distributions Lesson 8 Bell Curves and Standard Deviation 119
REVIEW—Slope17. For each slope and point given below, determine a point that is on the graph of the line
determined by the slope and point. For example, if the slope is 13
and the point is (1, 2), then
(4, 3) or ("2, 1) are also on the line with slope 13
and point (1, 2). There are many possible answers to each one.
A. slope ! 45 and point A (0, 3)
B. slope ! −12 and point B (2, 0)
C. slope ! 3 and point C (2, 3)
D. slope ! "4 and point D ("1, 2)
18. Explain the method you used to complete Problem 17.
