behnam badihi olaeiy modeling, performance · pdf filebehnam badihi olaeiy modeling,...
TRANSCRIPT

BEHNAM BADIHI OLYAEIModeling, Performance Evaluation and Suitability Study ofZigbee Technology for Machine-to-Machine CommunicationsApplicationsMaster of Science Thesis
Examiners: Prof. Mikko Valkama
and Dr. Ali Hazmi
Examiners and topic approved by the
Faculty Council of the Faculty of
Computing and Electrical Engineering
on 5 June 2013.

I
ABSTRACT
TAMPERE UNIVERSITY OF TECHNOLOGY
Master's Degree Programme in Information Technology
BADIHI OLYAEI, BEHNAM: Modeling, Performance Evaluation and Suitability
Study of Zigbee Technology for Machine-to-Machine Communications Applications
Master of Science Thesis, 76 pages
December 2013
Major: Communication Systems and Networks
Examiners: Professor Mikko Valkama, Dr. Ali Hazmi
Keywords: IEEE 802.15.4, Slotted CSMA-CA, Performance analyses, Throughput, En-
ergy consumption, End-to-end delay, System level simulator
The number of nodes in current communication networks, specially in wireless
technology, is increasing day by day. At the same time, the communication concept
is changing from being mainly human to human (H2H) toward machine to machine
(M2M). On the other hand, the objects and devices will become part of future
Internet in which the concept of connectivity will change from anywhere, anytime
for anyone to anywhere, anytime for anything by introducing Internet of Things
(IoT). Therefore, it is expected that billions of objects will communicate to each
other physically and virtually through the Internet. When these numbers of devices,
usually very high, are connected to the Internet to form the IoT network, the �rst
challenge is to adjust the basic connectivity and networking layers between them.
On the other hand, end point users must operate with battery for many years
since replacing them is impossible due to the high number devices. Currently, we
witness an increasing momentum for wireless industry to explicitly take into account
the key M2M requirements, such as lower complexity, reduced implementation and
operation costs, broader coverage range and higher energy e�ciency. The IEEE
802.15.4 standard is presently being used for wireless sensor networks and ZigBee
applications characterized by similar requirements as in IoT and M2M applications.
The ZigBee technology based on IEEE 802.15.4 standard is mainly targeting LR-
WPAN applications.
Due to importance of wireless sensor networks (WSN) in future M2M communi-
cations and because of the lack of comprehensive study of IEEE 802.15.4 in di�erent
frequency bands and di�erent channel scenarios, this thesis evaluate the performance
of the IEEE 802.15.4 using system level simulator developed during this work. The
performance evaluation is carried out in terms of network throughput, energy con-
sumption, and end-to-end delay. In addition, the performance comparison is ac-
complished between slotted IEEE 802.15.4 and IEEE 802.11ah (one of the most
promising candidate standard for the IoT applications).
The results show that the IEEE 802.15.4 is a suitable standard in terms of energy
consumption in congested networks but not in throughput point of view.

II
PREFACE
The research throughout this Master of Science Thesis work, �Modeling, Perfor-
mance Evaluation and Suitability Study of Zigbee Technology for Machine-to-Machine
Communications Applications,� is conducted in the Internet of Things program of
TiViT (Finnish Strategic Center for Science, Technology and Innovation in ICT),
funded by the Finnish Funding Agency for Technology and Innovation (Tekes). The
work is also �nancially supported by Renesas Mobile Europe Ltd. The research
work was accomplished during the year 2012-2013 at the Department of Electronics
and Communications Engineering, Tampere University of Technology.
First of all, I would like to express my gratitude to my supervisor Professor Mikko
Valkama for giving me the opportunity to work in his research group and for his
continuous support of my M.Sc. study and research. I would also like to thank my
supervisor Dr. Ali Hazmi who has always been there to listen and give me advices.
I am also very grateful to my colleagues at o�ce and my friends in Tampere
University of Technology for helping me and supporting me during the work.
I am also thankful for my dear parents Nowruzali and Tabarze for their strong
encouragement, unconditional love and belief in me. Thank you for supporting me
every step of the way and constantly being there for me. I could not thank you
enough for all that you have done for me and sorry for being away from you.
Finally, I would like to express my heartfelt gratitude to Inka for her uncondi-
tional love and being always there for me in ups and downs.
Tampere, October 2013
Behnam Badihi
III
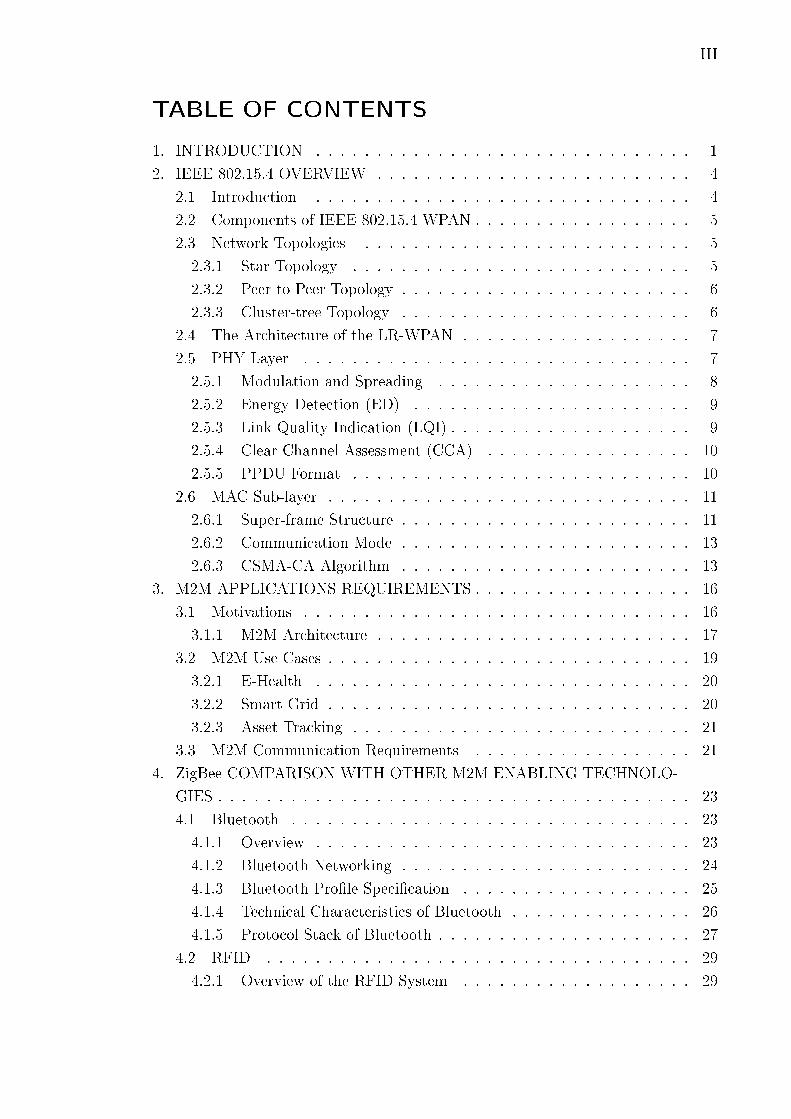
TABLE OF CONTENTS
1. INTRODUCTION . . . . . . . . . . . . . . . . . . . . . . . . . . . . . . . 1
2. IEEE 802.15.4 OVERVIEW . . . . . . . . . . . . . . . . . . . . . . . . . . 4
2.1 Introduction . . . . . . . . . . . . . . . . . . . . . . . . . . . . . . . 4
2.2 Components of IEEE 802.15.4 WPAN . . . . . . . . . . . . . . . . . . 5
2.3 Network Topologies . . . . . . . . . . . . . . . . . . . . . . . . . . . 5
2.3.1 Star Topology . . . . . . . . . . . . . . . . . . . . . . . . . . . . 5
2.3.2 Peer to Peer Topology . . . . . . . . . . . . . . . . . . . . . . . . 6
2.3.3 Cluster-tree Topology . . . . . . . . . . . . . . . . . . . . . . . . 6
2.4 The Architecture of the LR-WPAN . . . . . . . . . . . . . . . . . . . 7
2.5 PHY Layer . . . . . . . . . . . . . . . . . . . . . . . . . . . . . . . . 7
2.5.1 Modulation and Spreading . . . . . . . . . . . . . . . . . . . . . 8
2.5.2 Energy Detection (ED) . . . . . . . . . . . . . . . . . . . . . . . 9
2.5.3 Link Quality Indication (LQI) . . . . . . . . . . . . . . . . . . . . 9
2.5.4 Clear Channel Assessment (CCA) . . . . . . . . . . . . . . . . . 10
2.5.5 PPDU Format . . . . . . . . . . . . . . . . . . . . . . . . . . . . 10
2.6 MAC Sub-layer . . . . . . . . . . . . . . . . . . . . . . . . . . . . . . 11
2.6.1 Super-frame Structure . . . . . . . . . . . . . . . . . . . . . . . . 11
2.6.2 Communication Mode . . . . . . . . . . . . . . . . . . . . . . . . 13
2.6.3 CSMA-CA Algorithm . . . . . . . . . . . . . . . . . . . . . . . . 13
3. M2M APPLICATIONS REQUIREMENTS . . . . . . . . . . . . . . . . . . 16
3.1 Motivations . . . . . . . . . . . . . . . . . . . . . . . . . . . . . . . . 16
3.1.1 M2M Architecture . . . . . . . . . . . . . . . . . . . . . . . . . . 17
3.2 M2M Use Cases . . . . . . . . . . . . . . . . . . . . . . . . . . . . . . 19
3.2.1 E-Health . . . . . . . . . . . . . . . . . . . . . . . . . . . . . . . 20
3.2.2 Smart Grid . . . . . . . . . . . . . . . . . . . . . . . . . . . . . . 20
3.2.3 Asset Tracking . . . . . . . . . . . . . . . . . . . . . . . . . . . . 21
3.3 M2M Communication Requirements . . . . . . . . . . . . . . . . . . 21
4. ZigBee COMPARISON WITH OTHER M2M ENABLING TECHNOLO-
GIES . . . . . . . . . . . . . . . . . . . . . . . . . . . . . . . . . . . . . . . 23
4.1 Bluetooth . . . . . . . . . . . . . . . . . . . . . . . . . . . . . . . . . 23
4.1.1 Overview . . . . . . . . . . . . . . . . . . . . . . . . . . . . . . . 23
4.1.2 Bluetooth Networking . . . . . . . . . . . . . . . . . . . . . . . . 24
4.1.3 Bluetooth Pro�le Speci�cation . . . . . . . . . . . . . . . . . . . 25
4.1.4 Technical Characteristics of Bluetooth . . . . . . . . . . . . . . . 26
4.1.5 Protocol Stack of Bluetooth . . . . . . . . . . . . . . . . . . . . . 27
4.2 RFID . . . . . . . . . . . . . . . . . . . . . . . . . . . . . . . . . . . 29
4.2.1 Overview of the RFID System . . . . . . . . . . . . . . . . . . . 29

IV
4.2.2 Near-�eld RFID . . . . . . . . . . . . . . . . . . . . . . . . . . . 31
4.2.3 Far-�eld RFID . . . . . . . . . . . . . . . . . . . . . . . . . . . . 32
4.3 Wi-Fi . . . . . . . . . . . . . . . . . . . . . . . . . . . . . . . . . . . 33
4.3.1 IEEE 802.11 Architecture . . . . . . . . . . . . . . . . . . . . . . 35
4.3.2 Physical Layer . . . . . . . . . . . . . . . . . . . . . . . . . . . . 36
4.3.3 MAC Sub-layer . . . . . . . . . . . . . . . . . . . . . . . . . . . . 37
4.4 ZigBee Comparison with Bluetooth, RFID, and Wi-Fi . . . . . . . . 38
4.4.1 RF Channels and Bandwidth . . . . . . . . . . . . . . . . . . . . 38
4.4.2 Datarate and Modulation . . . . . . . . . . . . . . . . . . . . . . 38
4.4.3 Network Size and Range . . . . . . . . . . . . . . . . . . . . . . . 39
4.4.4 Transmission Power . . . . . . . . . . . . . . . . . . . . . . . . . 39
5. SIMULATOR DESCRIPTION AND SETTINGS . . . . . . . . . . . . . . 42
5.1 The OMNeT++ Simulation Environment . . . . . . . . . . . . . . . . 42
5.1.1 Available Network Simulators . . . . . . . . . . . . . . . . . . . . 42
5.1.2 Simulation Modeling Concept . . . . . . . . . . . . . . . . . . . . 43
5.1.3 OMNeT++ Introduction . . . . . . . . . . . . . . . . . . . . . . 44
5.1.4 The NED Language . . . . . . . . . . . . . . . . . . . . . . . . . 45
5.1.5 Simple Module . . . . . . . . . . . . . . . . . . . . . . . . . . . . 48
5.1.6 Compound Module . . . . . . . . . . . . . . . . . . . . . . . . . . 49
5.1.7 Gates and Connections . . . . . . . . . . . . . . . . . . . . . . . 49
5.1.8 Messages . . . . . . . . . . . . . . . . . . . . . . . . . . . . . . . 49
5.2 Model Description and Settings . . . . . . . . . . . . . . . . . . . . . 50
5.2.1 Simulation Environment . . . . . . . . . . . . . . . . . . . . . . . 50
5.2.2 Simulation Parameters . . . . . . . . . . . . . . . . . . . . . . . . 52
5.2.3 Energy Consumption Parameters . . . . . . . . . . . . . . . . . 52
5.2.4 Channel and Propagation Loss Model . . . . . . . . . . . . . . . 53
5.2.5 Simulation Scenarios . . . . . . . . . . . . . . . . . . . . . . . . . 54
6. SIMULATION PERFORMANCE . . . . . . . . . . . . . . . . . . . . . . . 57
6.1 Simulator Calibration . . . . . . . . . . . . . . . . . . . . . . . . . . . 57
6.2 Network Throughput . . . . . . . . . . . . . . . . . . . . . . . . . . . 58
6.3 Energy Consumption . . . . . . . . . . . . . . . . . . . . . . . . . . . 62
6.4 Average End-to-end Delay . . . . . . . . . . . . . . . . . . . . . . . . 65
7. CONCLUSIONS . . . . . . . . . . . . . . . . . . . . . . . . . . . . . . . . 67
References . . . . . . . . . . . . . . . . . . . . . . . . . . . . . . . . . . . . . . 69

V
LIST OF FIGURES
2.1 Topology Models . . . . . . . . . . . . . . . . . . . . . . . . . . . . . 5
2.2 LR-WPAN Architecture . . . . . . . . . . . . . . . . . . . . . . . . . 6
2.3 The Signal Spreading in DSSS . . . . . . . . . . . . . . . . . . . . . . 8
2.4 The Spreading and Modulation for the 2.4 GHz . . . . . . . . . . . . 9
2.5 Format of the PPDU . . . . . . . . . . . . . . . . . . . . . . . . . . . 10
2.6 Super-frame Structure . . . . . . . . . . . . . . . . . . . . . . . . . . 12
2.7 The CSMA-CA Algorithm . . . . . . . . . . . . . . . . . . . . . . . . 14
3.1 M2M Architecture . . . . . . . . . . . . . . . . . . . . . . . . . . . . 18
3.2 M2M use cases . . . . . . . . . . . . . . . . . . . . . . . . . . . . . . 20
4.1 piconet and scatternet . . . . . . . . . . . . . . . . . . . . . . . . . . 24
4.2 Bluetooth Products . . . . . . . . . . . . . . . . . . . . . . . . . . . . 25
4.3 Bluetooth chip . . . . . . . . . . . . . . . . . . . . . . . . . . . . . . 27
4.4 Bluetooth protocol stack . . . . . . . . . . . . . . . . . . . . . . . . . 28
4.5 Generic RFID system . . . . . . . . . . . . . . . . . . . . . . . . . . . 29
4.6 Near-�eld mechanism . . . . . . . . . . . . . . . . . . . . . . . . . . . 31
4.7 Far-�eld mechanism . . . . . . . . . . . . . . . . . . . . . . . . . . . . 32
4.8 IBSS and ESS con�gurations . . . . . . . . . . . . . . . . . . . . . . . 36
4.9 The IEEE 802.11 access methods . . . . . . . . . . . . . . . . . . . . 38
5.1 OMNeT++ Model Structure . . . . . . . . . . . . . . . . . . . . . . . 44
5.2 Randomly distributed nodes . . . . . . . . . . . . . . . . . . . . . . . 51
5.3 SINR calculation of a received packet . . . . . . . . . . . . . . . . . 55
6.1 Saturation throughput for Calibration . . . . . . . . . . . . . . . . . 58
6.2 The throughput of IEEE 802.15.4 in 2.4 GHz band . . . . . . . . . . 58
6.3 Fairness measure . . . . . . . . . . . . . . . . . . . . . . . . . . . . . 59
6.4 The throughput of IEEE 802.15.4 in 915 MHz band . . . . . . . . . 60
6.5 The throughput of IEEE 802.15.4 in 868 MHz band . . . . . . . . . 61
6.6 The throughput comparison between IEEE 802.11ah and IEEE 802.15.4 61
6.7 The energy consumption of IEEE 802.15.4 in 2.4 GHz band . . . . . 62
6.8 The energy consumption of IEEE 802.15.4 in 915 MHz band . . . . . 63
6.9 The energy consumption of IEEE 802.15.4 in 868 MHz band . . . . . 63
6.10 Energy comparison between IEEE 802.15.4 and IEEE 802.11ah . . . . 64
6.11 End-to-end delay of IEEE 802.15.4 in 2.4 GHz band . . . . . . . . . . 65
6.12 End-to-end delay of IEEE 802.15.4 in 915 MHz band . . . . . . . . . 66
6.13 End-to-end delay of IEEE 802.15.4 in 868 MHz band . . . . . . . . . 66
VI
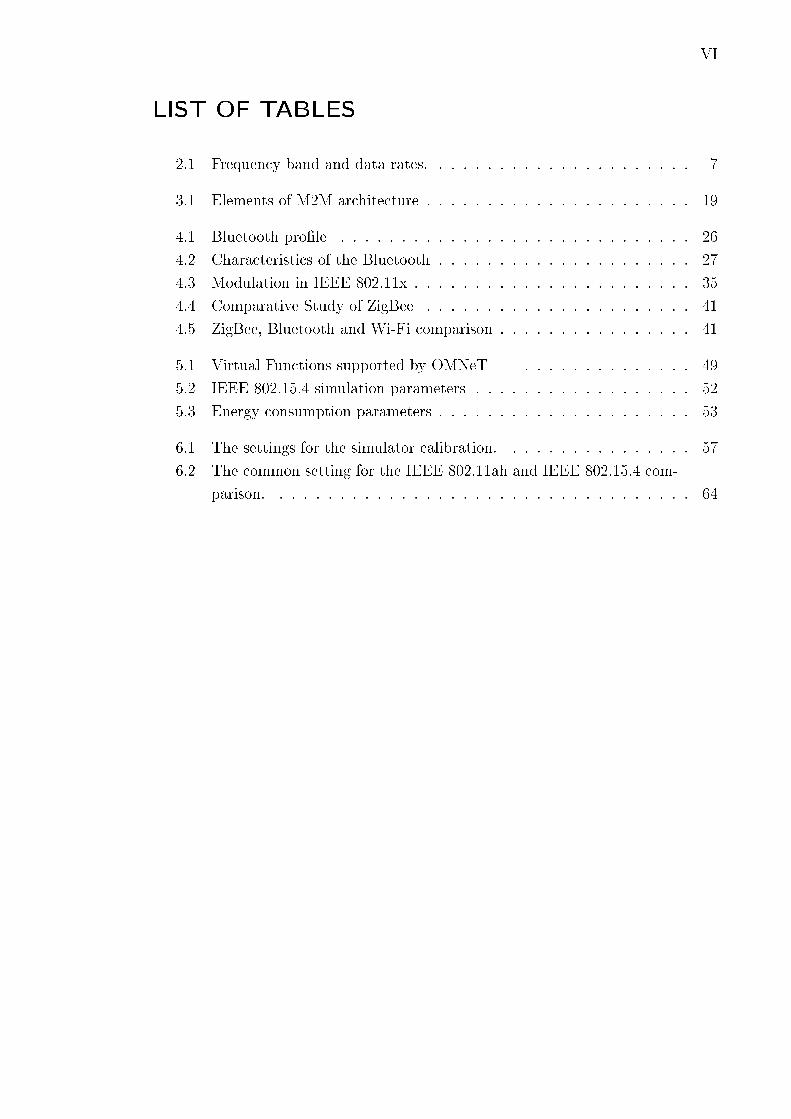
LIST OF TABLES
2.1 Frequency band and data rates. . . . . . . . . . . . . . . . . . . . . . 7
3.1 Elements of M2M architecture . . . . . . . . . . . . . . . . . . . . . . 19
4.1 Bluetooth pro�le . . . . . . . . . . . . . . . . . . . . . . . . . . . . . 26
4.2 Characteristics of the Bluetooth . . . . . . . . . . . . . . . . . . . . . 27
4.3 Modulation in IEEE 802.11x . . . . . . . . . . . . . . . . . . . . . . . 35
4.4 Comparative Study of ZigBee . . . . . . . . . . . . . . . . . . . . . . 41
4.5 ZigBee, Bluetooth and Wi-Fi comparison . . . . . . . . . . . . . . . . 41
5.1 Virtual Functions supported by OMNeT++ . . . . . . . . . . . . . . 49
5.2 IEEE 802.15.4 simulation parameters . . . . . . . . . . . . . . . . . . 52
5.3 Energy consumption parameters . . . . . . . . . . . . . . . . . . . . . 53
6.1 The settings for the simulator calibration. . . . . . . . . . . . . . . . 57
6.2 The common setting for the IEEE 802.11ah and IEEE 802.15.4 com-
parison. . . . . . . . . . . . . . . . . . . . . . . . . . . . . . . . . . . 64

VII
TERMS AND DEFINITIONS OR LIST OF
SYMBOLS AND ABBREVIATIONS
AP Access point
ASK Amplitude shift keying
BI Beacon interval
BO Beacon order
BPSK Binary phase shift keying
BSS Basic service set
CAP Contention access period
CCA Clear channel assessment
CCK Complementary code keying
CFP Contention free period
CSMA-CA Carrier sense multiple access with collision avoidance
CTS Clear to send
CW Contention window
DCF Distributed coordination function
DIFS Distributed interframe space
DS Distributed system
DSSS Direct sequence spread spectrum
ED Energy detection
ESS Extended service set
FFD Full function device
FHSS Frequency hopping spread spectrum
GFSK Gaussian frequency shift keying

VIII
GTS Guaranteed time slot
H2H Human to human
IBSS Independent basic service set
IFS Interframe space or spacing
IoT Internet of things
L2CAP Logical link control and adaption protocol
LIFS Long interframe spacing
LMP Link manager protocol
LR-WPAN Low rate wireless personal area network
LQI Link quality indication
M2M Machine to Machine
MAC Medium access control
NB Number of backo�s
OFDM Orthogonal frequency division multiplexing
OQPSK O�set Quadrature Phase Shift Keying
OSI Open system interconnection
PCF Point coordination function
PDA Personal digital assistant
PHR PHY header
PHY Physical layer
PLC Power line communication
PPDU PHY protocol data unit
RFD Reduced function device
RFID Radio frequency identi�cation
RTS Request to send

IX
SD Super-frame duration
SIFS Short interframe spacing
SHR synchronization header
SSCS Service speci�c convergence sublayer
TDD Time devision duplex

1. INTRODUCTION 1
1. INTRODUCTION
The evolution of the wireless technologies and the remarkable development of the
wireless network services have converted the wireless communications to an ubiq-
uitous means for exchanging data through many di�erent domains. Everything is
turning to wireless. The captivation of mobility, accessibility and �exibility make
wireless technologies a dominant method of exchanging all sort of information. Satel-
lite televisions, cellular phones, cordless telephones, PDAs, and Wi-Fi are widely-
known applications of the wireless technologies. The wireless research �eld is swiftly
developing in the communication area and it provides a wide variety of applications
under di�erent topologies.
During the past decade the number of wireless devices are dramatically increasing.
Recently, the idea of connecting the heterogeneous objects form di�erent networks
has brought the new concept of the connectivity. This new concept named Internet
of Things (IoT) introduces the unique aspect to the communication world in which
connectivity will be available anywhere, any time for any thing. IoT will enable the
interoperability of heterogeneous applications, extending from smart phones and
wireless sensors up to network-enabled physical objects (for instance, RFID, smart
visual tags, smart grid) through universally integrated communications platforms
[1].
In nearly the parallel way, machine-to-machine (M2M) technology has recently
emerged to enable direct communications for heterogeneous devices through existing
mobile operator network infrastructures in the IoT, for instance, Third Generation
Partnership Project's Evolved Packet System (3GPP's EPS). This technology is
highly promising enabler for developing a solution in the area of IoT applications
extending from transportation, health-care, ambient assisted living, smart energy,
smart utility metering, supply and provisioning, city automation, intelligent track-
ing, manufacturing, and so forth [2].
One of the major applications of the M2M system is wireless sensor networks.
Wireless Sensor Networks will enable a wide range of new applications, for instance,
home automation (security, lighting control, access control, temperature control),
consumer electronics (TV/VCR/DVD/CD remote control), industrial automation
(e.g. asset management, process control, environmental control, energy manage-
ment) and personal health care (body sensor networks).

1. INTRODUCTION 2
However, for this to become a reality, many new problems and challenges must
be overcome in WSNs as their paradigm di�ers from traditional wireless networks.
There is the need for low cost devices enabling large-scale networked embedded
systems (as there can be hundreds or thousands of nodes scattered in large regions)
and energy requirements that impose low communication rates and ranges and low
duty cycles. Some of the most important challenges in WSNs are related to energy-
e�ciency, scalability, routing, mobility, reliability, timeliness, security, clustering,
localization and synchronization.
The joint e�orts of the IEEE 802.15.4 Task Group [3] and the ZigBee Alliance [4]
have ended up with the speci�cation of a standard protocol stack. This standard is
intended for Low-Rate Wireless Personal Area Networks (LR-WPANs), an enabling
technology for Wireless Sensor Networks (WSNs) [5], [13].
Investigating throughput, delay and energy consumption of IEEE 802.15.4 net-
works is essential to understand the fundamental characteristics of this protocol in
the context of the IoT and M2M concepts. Several simulations-based studies, for
instance, [6], [7], [8] investigate the delay, throughput, and energy consumption of
IEEE 802.15.4. In addition, more recent analytical works, for example, [9], [10], [11],
[12] are performed in terms of above-mentioned metrics.
However, there is a lack of study in non-ideal channel condition. And it should
also be noticed that the above-mentioned works are performed in 2.4 GHz frequency
band in datarate of 250 kbps. While standard itself support two other frequency
bands operating in two di�erent datarates. These bands are 915 MHz and 868
MHz with datarate of 40 kbps and 20 kbps, respectively. There is therefore lacking
study and investigation of the IEEE 802.15.4 performance in those bands. This
thesis covers the whole frequency bands with di�erent data-rates in both ideal and
non-ideal channels.
In this work, an overview of the IEEE 802.15.4 standard is described in Chapter
1. The basic concepts about this standard specially in PHY and MAC layer are
illustrated. Many technologies like ZigBee use this standard in PHY and MAC
layer as a baseline. In addition, CSMA-CA as an access mechanism of the standard
is discussed in details.
Chapter 3 discuses about the emerging IoT and M2M technologies and essen-
tial requirements for M2M applications. This chapter illustrates the motivation for
having the machine to machine technology and its pros and cons compared to tra-
ditional human to human technology. In addition, the M2M architecture and some
of its corresponding use cases are also explained.
ZigBee as an important M2M enabler technology is compared with other M2M
enabling technologies such as Bluetooth, RFID, and Wi-Fi in Chapter 4. These
technologies are concisely introduced in this chapter and then the comparison study

1. INTRODUCTION 3
is investigated in terms of di�erent metrics. These metrics include RF channel,
bandwidth, datarate, modulation,network size, coverage range, and transmission
power, and etc.
To evaluate the performance of the IEEE 802.15.4, a system-level simulator is
developed using the OMNeT++ tool and by further improving the existing INET-
MANET framework. Hence, the introduction to OMNeT++ is discussed in Chapter
5 in order to illustrate the simulation environment. The remainder of the chapter is
about the simulation model's settings, channel and path loss model.
The performance evaluation of the IEEE 802.15.4 comprises three metrics: through-
put, energy consumption, and end-to-end delay. The above-mentioned metrics are
performed for 2.4 GHz, 915 MHz, and 868 MHz frequency bands with datarate of
250 Kbps, 40 Kbps, and 20 Kbps, respectively. In addition, the performance of
the IEEE 802.15.4 is compared with IEEE 802.11ah in terms of throughput and
energy consumption. These results are investigated in Chapter 6. Finally, Chapter
7 concisely concludes the thesis work.

2. IEEE 802.15.4 OVERVIEW 4
2. IEEE 802.15.4 OVERVIEW
2.1 Introduction
The low-rate wireless personal area networks (LR-WPANs) are characterized by
extremely low power consumption, low data rate, and low complexity where the
network can be easily installed and managed. The IEEE 802.15.4 is a standard which
speci�es the physical layer and medium access control sub-layer for LR-WPANs [14],
[15]. This standard is supported by the IEEE 802.15 working group. It is the basis
for the ZigBee speci�cations by further extending the standard to develop the upper
layers. The higher layers above MAC sub-layer are not speci�ed in the IEEE 802.15.4
[16]. Some of the most important characteristics of LR-WPAN are listed below:
• Data rates of 250 kbps, 40 kbps and 20 kbps.
• Star, peer to peer, and cluster-tree topology.
• Allocation of short address of 16 bit or extended address of 64 bit.
• Guaranteed time slots (GTS) for delay sensitive applications
• Low power consumption
• Acknowledgment support for reliable transfer
• Energy detection (ED)
• Channel access with carrier sense multiple access with collision avoidance
(CSMA-CA)
• Link quality indication (LQI)
• 16 channels available in the 2450 MHz band, 10 channels available in the 915
MHz band, and 1 channel available in the 868 MHz band [17].

2. IEEE 802.15.4 OVERVIEW 5
2.2 Components of IEEE 802.15.4 WPAN
A system using the IEEE 802.15.4 speci�cations includes several components. The
most basic components in this standard are communication devices. Two types of
device are de�ned in the standard: FFD (full-function device) and RFD (reduced-
function device). FFD is able to communicate with other FFDs and RFDs while
RFD can only communicate with FFDs. A network shall have at least one FFD to
operate. FFDs can operate in three modes in the network: as a coordinator, or a
PAN (personal area network) coordinator, or an ordinary device.
2.3 Network Topologies
The LR-WPAN standard supports three network topologies. These topologies are
presented in Figure 2.1.
Figure 2.1: Network topologies of the LR-WPAN system.
2.3.1 Star Topology
In the star topology, the devices communicate with central device called PAN coordi-
nator. Many applications such as home automation, personal computer peripherals,
and games use this topology. The PAN coordinator is normally powered by contin-
uous source of energy while other devices are mostly battery-powered. A network
can be established with a FFD device when it start to be activated for the �rst time.
Each FFD uses a special and unique PAN identi�er which di�erentiate its network
from any other networks in the zone of coverage. The PAN identi�er allows multiple
networks to independently operate in the same zone of radio coverage.

2. IEEE 802.15.4 OVERVIEW 6
2.3.2 Peer to Peer Topology
Peer to peer topology also has a PAN coordinator but it di�ers from star topology
in the sense that each device can talk with any other devices as long as they are
in the coverage range of each other. Peer to peer network employs the multi-hop
communication to send the data from source node to the destination node. This
topology may lead to very complex topologies such as mesh topology. Many applica-
tions, for instance, industrial control and monitoring, wireless sensor networks, asset
and inventory tracking, intelligent agriculture, and security utilize this topology. By
employing the multiple hops, routing messages is possible from any device to any
other device in the network. In addition, this topology has the characteristics of a
self-organizing, and self-healing network which makes this topology more useful for
ad-hoc network.
2.3.3 Cluster-tree Topology
The cluster-tree topology is a special case of peer to peer topology which comprises
of many FFDs. In this topology, RFD can be attached to the network as a leaf
node at the end of the branches. Any of the FFDs can behave like a coordinator
to provide synchronization services to other coordinators and devices, however, the
network only have one PAN coordinator at any time. The coverage area in the
cluster-tree topology can easily be extended but on the other hand, it imposes the
high latency to the delivered packets.
Figure 2.2: LR-WPAN device architecture [IEEE 802.15.4 speci�cations].
2. IEEE 802.15.4 OVERVIEW 7
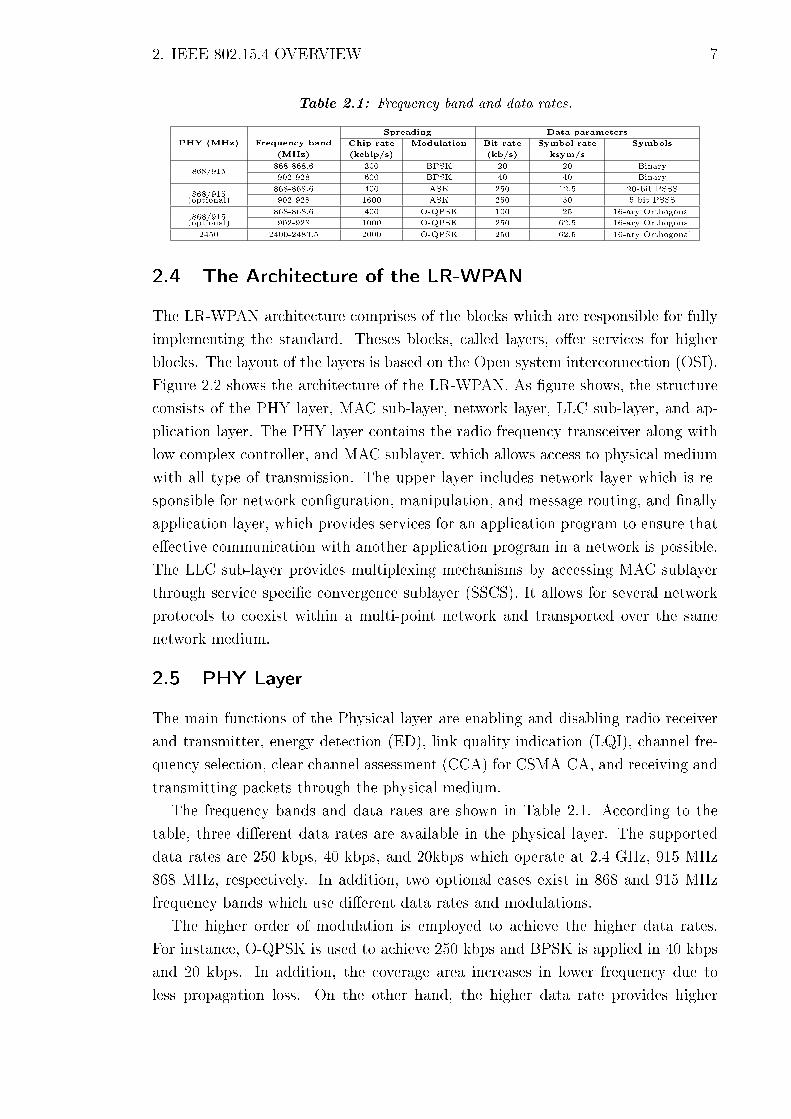
Table 2.1: Frequency band and data rates.
PHY (MHz) Frequency band
Spreading Data parameters
Chip rate Modulation Bit rate Symbol rate Symbols
(MHz) (kchip/s) (kb/s) ksym/s
868/915868-868.6 300 BPSK 20 20 Binary
902-928 600 BPSK 40 40 Binary
868/915868-868.6 400 ASK 250 12.5 20-bit PSSS
(optional) 902-928 1600 ASK 250 50 5-bit PSSS
868/915868-868.6 400 O-QPSK 100 25 16-ary Orthogonal
(optional) 902-928 1000 O-QPSK 250 62.5 16-ary Orthogonal
2450 2400-2483.5 2000 O-QPSK 250 62.5 16-ary Orthogonal
2.4 The Architecture of the LR-WPAN
The LR-WPAN architecture comprises of the blocks which are responsible for fully
implementing the standard. Theses blocks, called layers, o�er services for higher
blocks. The layout of the layers is based on the Open system interconnection (OSI).
Figure 2.2 shows the architecture of the LR-WPAN. As �gure shows, the structure
consists of the PHY layer, MAC sub-layer, network layer, LLC sub-layer, and ap-
plication layer. The PHY layer contains the radio frequency transceiver along with
low complex controller, and MAC sublayer, which allows access to physical medium
with all type of transmission. The upper layer includes network layer which is re-
sponsible for network con�guration, manipulation, and message routing, and �nally
application layer, which provides services for an application program to ensure that
e�ective communication with another application program in a network is possible.
The LLC sub-layer provides multiplexing mechanisms by accessing MAC sublayer
through service speci�c convergence sublayer (SSCS). It allows for several network
protocols to coexist within a multi-point network and transported over the same
network medium.
2.5 PHY Layer
The main functions of the Physical layer are enabling and disabling radio receiver
and transmitter, energy detection (ED), link quality indication (LQI), channel fre-
quency selection, clear channel assessment (CCA) for CSMA-CA, and receiving and
transmitting packets through the physical medium.
The frequency bands and data rates are shown in Table 2.1. According to the
table, three di�erent data rates are available in the physical layer. The supported
data rates are 250 kbps, 40 kbps, and 20kbps which operate at 2.4 GHz, 915 MHz
868 MHz, respectively. In addition, two optional cases exist in 868 and 915 MHz
frequency bands which use di�erent data rates and modulations.
The higher order of modulation is employed to achieve the higher data rates.
For instance, O-QPSK is used to achieve 250 kbps and BPSK is applied in 40 kbps
and 20 kbps. In addition, the coverage area increases in lower frequency due to
less propagation loss. On the other hand, the higher data rate provides higher

2. IEEE 802.15.4 OVERVIEW 8
throughput with low message latency and low duty cycle.
Table 2.1 shows the frequency bands and supported data rates in IEEE 802.15.4
along with modulation type. The available channels for the di�erent frequency bands
in this standard are:
• 1 channel in 868 MHz
• 10 channels in 915 MHz
• 16 channels in 2.4 GHz
2.5.1 Modulation and Spreading
IEEE 802.15.4 employs modulation and spreading technique in PHY layer. In the
following, the modulation and spreading for 2.4 GHz frequency band is explained.
Spreading technique aids the coexistence of the IEEE 802.15.4 with other technolo-
gies utilizing the unlicensed frequency bands. In addition, it improves the receivers
sensitivity and reduces the multipath e�ect, and increases the jamming resistance.
IEEE 802.15.4 employs Direct Sequence Spreading Spectrum (DSSS) as a spreading
method. In this method, every 4 bits of a PPDU are grouped together and mapped
to a symbol. Then each symbol is mapped to a unique 32-bit sequence based on the
lookup table. This 32-bit sequence is called the chip sequence or the pseudo-random
Figure 2.3: The Signal Spreading in DSSS [54]
noise (PN) sequence as well (see Figure 2.3). E�ective bit rate in the air increases
by the factor of eight, since each 4 bits of the actual data are mapped to a 32-bit
chip sequence. By knowing the fact that bandwidth is proportional to bit rate, the
bandwidth will also increase by the factor of eight. For instance, if the data rate is
250 kbps, after the spreading the bandwidth will increase to 2 MHz [54].

2. IEEE 802.15.4 OVERVIEW 9
After despreading signal in the receiver, the energy of the signal will accumulate
on the original bandwidth of 250 kHz, but the despreading will not have any e�ect
on the noise level in the 250 kHz band. The e�ective SNR will increase in the
result of increasing the signal energy without increasing the noise level. The SNR
improvement is known as the processing gain . The processing gain is calculated as
a ratio of the actual data rate to the chip rate . In the case of 2.4 GHz mode in
IEEE 802.15.4, processing gain is equal to [54]:
ProcessingGain = 10× log10
( 2Mbps
250 kbps
)∼= 9 dB (2.1)
Figure 2.4 shows the spreading and modulation for the IEEE 802.15.4 operated
in 2.4 GHz frequency band.
Figure 2.4: The Spreading and Modulation for the 2.4 GHz [54]
2.5.2 Energy Detection (ED)
Energy detection is a mechanism used by the physical layer in order to choose a
proper channel for the network layer. The mechanism is based on the energy esti-
mation of the received signal within the bandwidth of the WPAN channel. Energy
detection is not meant for decoding or signal identi�cation. The minimum ED value
should detect the received power in less than 10 dB above the determined receiver
sensitivity threshold and the maximum tolerance of the received power shall span
at least 40 dB.
2.5.3 Link Quality Indication (LQI)
The quality of the link is sent by the physical layer as a feedback signal.The feedback
contains the quality and the strength of the received packet by the physical layer.

2. IEEE 802.15.4 OVERVIEW 10
Two methods can be applied for implementing this mechanism which are the ED
measurement and signal to noise estimation. However, the combination of these two
method can be employed as well.
2.5.4 Clear Channel Assessment (CCA)
Clear Channel Assessment is a logical function applied by the physical layers which
determines the current state of the wireless medium to prevent collision. CCA can
be implemented in three following methods:
Energy above threshold: The CCA shall utilize Energy detection (ED) measure-
ment as a criterion for deciding whether the medium is free or busy.
Carrier sense only: The CCA shall report a busy medium in the case of detecting
a carrier with the characteristics of the IEEE 802.15.4 standard regardless of
the ED threshold.
Carrier sense with energy above threshold: In this criterion, the CCA shall
report a busy medium in the case of detecting a carrier with the characteristics
of the IEEE 802.15.4 and threshold above ED [17].
2.5.5 PPDU Format
Figure 2.5 indicates the format of a PPDU. The PPDU packet format consists of
the following elements:
• SHR, which contains information about synchronization and it is used to lock
to frame by the receiver.
• PHR, which includes information about the frame length
• Variable payload length, which contains the MAC frame
Figure 2.5: Format of the PPDU frame.

2. IEEE 802.15.4 OVERVIEW 11
2.6 MAC Sub-layer
The medium access control (MAC) sub-layer provides the transmission and reception
of MAC frames through the physical channel. In addition to the data service, it
enables management interface to physical medium. The responsibility of MAC sub-
layer can be described as following:
• management of beacons
• Channel access control
• Frame validation
• GTS management
• Acknowledging of successful frame delivery
• Security services
• Association and disassociation
More details about physical and MAC layer can be found in [17].
2.6.1 Super-frame Structure
The super-frame is an optional structure used by the LR-WPAN. The structure of
the super-frame is determined by PAN coordinator. Super-frame is con�ned be-
tween two successive beacon. Each beacon is divided into 16 equally sections named
slots. As it mentioned earlier, since super-frame is an optional functionality, if a
coordinator does not want to utilize super-frame it may stop beacon broadcast-
ing. Moreover, beacon which is broadcasted in the beginning of the super-frame is
applied for synchronization of associated nodes, PAN identi�cation, and demonstra-
tion of super-frame structure. The super-frame includes active and inactive periods.
The nodes should not communicate with the PAN coordinator during the inactive
periods.
The active period is further divided in two parts: Contention Access Period
(CAP) and Contention Free Period (CFP). Any device which want to communi-
cate with other devices during CAP period should compete with other nodes using
CSMA-CA algorithm to access medium. On the other hand, CFP period employs
guaranteed time slots (GTS) which always come after CAP i.e. at the end of the
active period. The PAN coordinator can assign up to seven GTSs and one GTS can
occupy more than one slot.
The duration of active period of the super-frame can be adjusted by the values of
macBeaconOrder, and macSuperFrameOrder. macBeaconOrder is a value de�ning

2. IEEE 802.15.4 OVERVIEW 12
Figure 2.6: Super-frame Structure.
the length of the beacon interval (BI). Beacon interval is related to macBeaconOrder
(BO) as below equation:
BI = aBaseSuperFrameDuration ∗ 2BO
where 0 ≤ BO ≤ 14(2.2)
If BO = 15, then super-frame is ignored.
On the other hand, the duration of the active period of the super-frame is de-
scribed by the value of macSuperFrameOrder. The super-frame duration (SD) is
linked to macSuperFrameOrder by the following formula:
SD = aBaseSuperFrameDuration ∗ 2SO
where 0 ≤ SO ≤ 14(2.3)
The beacon is broadcasted in the beginning of the �rst slot of the active period
without performing CSMA-CA algorithm. The beacon is followed by the CAP.
All frames excluding acknowledgments and all type of frames which followed after a
data request command shall utilize the slotted CSMA-CA to access the medium. All
frame transmissions in the CAP period should be accomplished before the ending
of the CAP period, otherwise it will defer the frame transmission until the next
CAP period. The structure of a super-frame is illustrated in Figure 2.6. The IFS
is the required time for the physical layer to process a frame. In other words, the
transmitted frame should wait for a limited amount of time called IFS. The length
of the IFS depends on the frame size transmitted over the channel. If the frame
2. IEEE 802.15.4 OVERVIEW 13
length is greater than aMaxSIFSFrameSize then frame shall be followed by a LIFS
otherwise the SIFS shall be applied.
The CFP period should immediately start on a slot boundary after the CAP
period. The CSMA-CA algorithm is not used in the CFP period. Moreover, the
frame transmission shall be ensured that will be �nished before the end of its GTS. If
a PAN coordinator does not utilize the super-frame structure in non-beacon enabled
network, the values of the macSuperFrameOrder, and macBeaconOrder should set
to 15. The GTS and beacon broadcast are not permitted in the non-beacon enabled
network. In addition, for transmitting any frame excluding acknowledgment, the
unslotted CSMA-CA shall be applied [17].
2.6.2 Communication Mode
The MAC sub-layer provides two communication modes in the IEEE 802.15.4: Bea-
con enabled and non-beacon enabled mode. The non-beacon enabled mode is the
simplest method to access the medium. In this mode, nodes obtain the access to
medium by employing CSMA/CA algorithm without using the super-frame struc-
ture. It means that the nodes are not synchronized. The beacon enabled mode
uses super-frame structure. In this mode, all devices are synchronized to beacon
time interval and all activities including transmission and channel sensing are ac-
complished in the beginning of the slots. Using the CAP period of the super-frame,
devices contend to get access by using CSMA/CA algorithm. In the contention free
period, the access is granted to those nodes which are delay sensitive.
2.6.3 CSMA-CA Algorithm
The PAN coordinator will adopt the slotted CSMA-CA algorithm if it uses the super-
frame structure. On the other hand, if the beacon cannot be located or cannot be
broadcasted by the PAN coordinator, unslotted CSMA-CA is used in a non-beacon
enabled network.
In slotted CSMA-CA, all nodes locate the backo� boundary by synchronizing to
the beacon interval of the super-frame. Using this method, all the nodes of a PAN
coordinator are synchronized. In the slotted CSMA-CA, when a device wishes to
transmit a frame, it should locate the boundary of the following backo� period, how-
ever, in unslotted CSMA-CA, synchronization of nodes is not required. The duration
of a backo� implemented by the CSMA-CA algorithm is called aUnitBacko�Period.
Each node should maintain three variables: NB, CW, and BE for each transmis-
sion attempt during the CSMA-CA algorithm. NB is the number of the CSMA-CA
required to backo� for the ongoing transmission. NB is initialized to zero before
the new transmission. BE is the Backo� Exponent to generate a random backo�

2. IEEE 802.15.4 OVERVIEW 14
duration. CW is the Contention Window Length, de�ning the number of backo�
periods that need to be clear of channel activity before the transmission can start.
It is initialized to 2 before each transmission attempt and reseted to 2 when the
medium is sensed busy.
Figure 2.7 presents the CSMA-CA algorithm including the slotted and unslotted
cases. As �gure shows, �rst of all algorithm determines which approach should be
followed ( step 1). In the slotted case, the values of NB, CW, and BE are maintained
but the unslotted CSMA-CA just only tracks the value of NB and BE. In step 2,
the MAC sub-layer should defer till the end of the backo� period which is in the
range of 0 to 2BE − 1.
In the next phase (step 3), MAC requests from PHY layer to perform Clear
Channel Assessment (CCA) on the backo� period boundary in slotted CSMA-CA
mode. The MAC shall check if the time is enough for the remaining CSMA-CA
algorithm including sending frames and acknowledgment before the CAP period,
other wise it shall wait till the next CAP period to repeat the whole process. In
the case of busy channel the MAC sub-layer shall increment NB and BE by one
providing that NB shall not exceed the macMaxCSMABacko�. If NB surpasses the
macMaxCSMABacko� value it will produce channel access failure, otherwise it shall
Figure 2.7: The CSMA-CA Algorithm.

2. IEEE 802.15.4 OVERVIEW 15
return to step 2.
If channel is sensed to be idle, MAC shall check the CW value evaluating to 0,
then it sends the frame but if the value of CW is not 0, the process commences
from step 3. In unslotted CSMA-CA the frame is immediately transmitted after the
medium is sensed to be idle without taking into account the backo� period boundary
[17].
3. M2M APPLICATIONS REQUIREMENTS 16
3. M2M APPLICATIONS REQUIREMENTS
3.1 Motivations
The world is ever connecting and the data exchange is rapidly increasing day by day.
The revolution of the mobile network with the target of connecting whole people
by the cell phone is slowing down. The revolution of the Internet era which was
aimed to connect every computer to each another is slowing down as well. The new
revolution is about to happen which is connecting things around us to create an
Internet of Things (IoT) [18]. The term of Internet of Things (IoT) was introduced
for the �rst time by Kevin Ashton in 1999 [19]. The IoT will change the concept
of connectivity from anywhere, any time for everyone to connectivity for anything
[20]. Not all objects connect in the �rst phase of the implementation but at least
most important objects related to human health and safety will connect to lead the
vision of the Internet of the Important Things (IoIT). This will cause to physical
extension of current Internet [21].
Connecting devices and nodes is a great opportunity in instrumenting and in-
terconnecting the physical world around us. IoT, along with opportunity, imposes
serious challenges. The most important challenges are the interconnecting of a mas-
sive amount of objects with given restraints including power consumption, processing
capabilities, memory and size [22].
Estimations and anticipations about number of connected objects are di�erent.
The WWRF (World Wireless Research Forum) anticipates that 1000 wireless de-
vices will be available for each person by the year 2020 [23]. The ABI Research
[30] predicts that there will be 225 million objects connected through the cellular
links by the year 2014. The ETSI (European Telecommunications Standards In-
stitute) estimates 50 billion communicating devices in the near future. Based on
the Juniper's networks, around 428 million devices will be connected by the year
2014 [24]. Only time can tell the exact number of the objects but it is obvious that
the number of wireless nodes per a person is increasing day by day and they will
be uniquely identi�ed and associated to the network with their known position and
status. In addition, adding services and intelligence to this concept will expand the
future Internet which consequently a�ects the future life and the environment [25].
Recently, Machine-to-Machine (M2M) communications have drawn many inter-
ests in academic and industrial environment because of the potential applications

3. M2M APPLICATIONS REQUIREMENTS 17
of IoT and rapid development of wireless communication technology. The aim of
M2M communications is to achieve ubiquitous communication between heteroge-
neous wireless devices and provide the data exchange between them [26]. M2M
communications support a wide range of complicated and autonomous operations
including advanced sensing, remote controlling, and monitoring technology [27].
The wireless Communication technology can be used for four distinct types of
communication:
• Human-to-human communication
• Human-to-machine communication
• Machine-to-human communication
• Machine-to-machine communication
Human-to-human (H2H) and M2M communications have similar characteristics,
however, there are some characteristics in M2M which are not supported in H2H.
First of all, M2M communications shall support a large number of wireless nodes.
On the other hand, the main tra�c in M2M technology is the uplink tra�c meaning
that wireless devices send their data to an AP rather than receive the data. However,
tra�c in H2H is mainly down-link tra�c due to higher user demand. The other issue
is power consumption which should be as low as possible in M2M due to battery
powered devices. Furthermore, M2M shall support various data transfer delay to
be able to cover di�erent applications and services [28]. There are also another
characteristics belong to M2M technology including the small data transmission,
priority alarm, and infrequent transmissions and so on [26].
3.1.1 M2M Architecture
The M2M architecture is comprised of three main interlinked domains:
• M2M device domain
• Communication network domain
• Application domain
The simple M2M architecture is depicted in Figure 3.1 and the elements of M2M
architecture are tabulated in Table 3.1.
Capillary Networks
Capillary networks is a short range solutions in M2M technology which are mainly
being standardized by various Standard Developing Organizations (SDOs) like IEEE,

3. M2M APPLICATIONS REQUIREMENTS 18
IETF. Capillary network consists of the sensors, wireless nodes, communications and
processing units which behave like the endpoints of the M2M applications. The in-
terconnection between devices occurs via di�erent PAN and LAN technologies in
wireless or wire-line modes. These devices are composed of sensors, processors and
radio transceivers. The most important technologies which enable WPAN networks
are ZigBee, Bluetooth, and RFID. Wi-Fi technology over IEEE 802.11x is the dom-
inant technology enabling WLAN network. The sponsors also play important role
in forming M2M capillary networks used for coordination and transmission of the
collected or aggregated data to the gateway. This smart nodes can form Bluetooth
piconets, ZigBee networks or RFID networks [22],[29].
Figure 3.1: Simple M2M Architecture [41].
M2M Gateway
M2M gateway is a bridge between M2M device domain and network domain. This
module provides control and localization services for collected data. For serving
these domains, M2M gateway should support the standards in the both domains. It
means that it should support ZigBee, Bluetooth, RFID, and Wi-Fi technologies from
M2M device domain and cellular, satellite, power line communication (PLC) tech-
nologies from communication network domain. In addition, M2M gateway increases
the tra�c concentration to the core network [29].
M2M Backhaul
M2M backhaul is a bridge between the gateway and M2M applications which pro-
vides the network access for the M2M system. The M2M backhaul varies from

3. M2M APPLICATIONS REQUIREMENTS 19
Table 3.1: Elements of M2M architecture [29].
Elements of M2M Description
Architecture
• Device consists of sensors, processors, and transceiver
capable of exchanging data autonomously.
• Capillary Network is responsible for enabling
M2M Devices connectivity within M2M devices and also between M2M
devices and gateway.
• Supporting these technologies: ZigBee, Bluetooth,RFID, Wi-Fi, SDR, UWB, M-BUS
M2M Gateway • Interconnecting between backhaul networks and
capillary networks.
• Providing a communication link between gateway and
M2M Backhaul M2M application.
• Including these technologies: xDSL, PLC, Satellite,LTE, GERAN, UTRAN, W-LAN, and WiMAX.
Applications • Consists of middleware executing the M2M businesslogic. It contains a software which enables analyzingdata for the end user.
the wireless cellular solutions, which rely on wide coverage (for instance, GSM,
UMTS, LTE, WiMAX) to wireless short-range solutions working on cheap and
energy-e�cient deployments (WiFi, Bluetooth, Zigbee, RFID) [34].
M2M Applications
It Contains the middleware layer where data passed to various application services
and used by the speci�c business-processing engines.
3.2 M2M Use Cases
M2M has a wide variety of use cases and applications including home M2M network
[31], home health care (Body area network), telematic and vehicles, telemetry, �eet
management, service and maintenance, security and surveillance, and so many other
applications. These use cases have identi�ed by various standard organizations as
well [32], [33]. Figure 3.2 shows the M2M applications in details and divides them
in the same category. In the following, E-Health, smart grid and vehicular telematic
are discussed in details as the most important use case of the M2M technology.

3. M2M APPLICATIONS REQUIREMENTS 20
Figure 3.2: M2M use cases [31].
3.2.1 E-Health
E-health or M-Health is an emerging technology with the objective of improving
the quality of patient care and reducing health care costs. The services encompass
telemedicine improving care system using a fast, accurate, and real time report of
the patient's physical condition, tele-conference between health care centers and
medical groups, laboratories, and pharmacies to exchange medical data in order to
reduce the costs.
The healthcare industry has allocated signi�cant resources on developing telemedicine
in both research and implementation in order to increase healthcare quality and re-
duce medical expenses. One of the most important outcome of this program is the
patient tele-monitoring by using the bio-sensors to record patient's physical condi-
tions and �tness indicators such as blood pressure, body temperature, heart rate
and weight. These sensors transmit the collected data to an M2M device like pa-
tient cell phone. This device acts like a data aggregation which forwards them to
M2M servers in the cloud. The servers collect and forward these data to medical
center. It will trigger an alarm based on the patient's critical condition to perform
an appropriate action in order to cure patient in the emergency cases [31].
3.2.2 Smart Grid
Smart grid is an intelligent system which integrates utility systems (such as electric-
ity, gas, or water), communication technologies and delivery infrastructures. This

3. M2M APPLICATIONS REQUIREMENTS 21
mixture makes the system autonomous in terms of monitoring and control. It also
enables demand response functionality and improves the e�ciency of resource uti-
lization. The main outcomes of smart grid are smart metering, intelligent distributed
network, equipment diagnostics, and monitoring and control.
The M2M smart meters send the usage data of customers using short range com-
munication technologies to M2M servers. M2M servers using 3G or 4G network
collect data and send them to core network. The M2M aggregation data collects
information from many smart meters by using di�erent short range wireless tech-
nologies. These technologies are mainly Wi-Fi, ZigBee, or 3G/4G [31], [35].
3.2.3 Asset Tracking
Asset tracking systems give many opportunities including parameter monitoring,
remote controlling and movement surveillance of the asset to owners or users of
equipments. The assets or cargoes specially the more valuable ones are required
to be tracked using M2M equipments particularly in places where physical access
is di�cult. In addition, in some occasions, protecting the asset against thieves
by human recourses are quite challenging task which needs M2M devices to be
performed more preciously and all the time. On the other hand, in the case of high
mobility assets, M2M technology will ease the monitoring and remote controlling by
minimum costs [36].
3.3 M2M Communication Requirements
M2M communication is sort of communication between two or more machines with-
out direct intervention of the human beings. The M2M services are designed to
perform in a autonomous and automatic manner between entities. Achieving this
objective, some requirements shall be ful�lled in M2M communications. Some of the
requirements to enable consistent, cost e�ective communications for a wide variety
of applications are documented in the following list.
• Scalability:
One of the biggest factors that service providers will need to prepare for is
scalability. As more and more devices and systems connect to each other not
just a few devices but potentially billions of them, the network will need to be
able to scale to meet demand.
• Abstraction of technologies heterogeneity:
The M2M gateway should be able to interface to wide variety of M2M appli-
cations using di�erent wireless technologies.

3. M2M APPLICATIONS REQUIREMENTS 22
• Mobility:
In the case that underlying network provides seamless mobility and roaming,
the M2M system should be compatible with such a mechanism.
• Support of multiple M2M Applications The M2M system should sup-
port multiple applications due to heterogeneity of the wireless nodes and their
applications. This mechanism should support the following principles:
1) The list of the registered M2M applications shall be maintained.
2) The information related to the registered application should be maintained.
3) The newly registered M2M application should be subscribed, and authorized
for the information exchange.
There are other requirements for the M2M communications as well which are con-
cisely mentioned as following:
• Message Delivery for sleeping devices
• Radio transmission activity indication and control
• Message transmission scheduling
• Communication with devices behind a M2M gateway
• Communication failure noti�cation
• M2M Service Capabilities discovery and registration
• Communications integrity
• Device/Gateway integrity check
• Continuous connectivity
• Device/Gateway failure robustness
• Location reporting support
More details about the M2M applications requirements can be found in [37].

4. ZigBee COMPARISON WITH OTHER M2M TECHNOLOGIES 23
4. ZIGBEE COMPARISON WITH OTHER M2M
ENABLING TECHNOLOGIES
Bluetooth (based on IEEE 802.15.3), RFID (over ISO 18000) and Wi-Fi (based on
IEEE 802.11) are three technologies aimed for short range wireless communications
with low power consumption. These technologies are characterized by the similar
requirements needed in Internet of Things (IoT) [23], [20],[19] and M2M [38],[39],[40]
applications, therefore, these technologies are possible candidate for IoT and M2M
use cases in near future. These technologies are introduced and their main char-
acteristics are discussed in this chapter. Moreover, the comparison study of the
aforementioned technologies with ZigBee technology is investigated in the end of
the chapter.
4.1 Bluetooth
4.1.1 Overview
The explosive growing of hand-held devices are rapidly changing our lives. Many
personal devices such as cell phones, laptops, palmtops are surrounding human be-
ings in the new millennium. In most of the cases, these devices have no compatible
data communication interfaces or if they do, the connection between devices are
via problematic cable connection. The idea of removing the extra connection cables
was invented by Ericsson company in 1994 which was an alternative to remove ca-
ble connections of mobile accessories. This technology named Bluetooth was a low
power, low range and low cost radio interface solution for that problem. In 1998
�ve major companies including Nokia, Ericsson, IBM, Intel and Toshiba formed the
Bluetooth Special Interest Group (SIG) to develop the technology and broaden the
market which de�ned the initial speci�cation. At the end, the IEEE 802.15.1 stan-
dard, which Bluetooth is based on it, was published in 2002 [42]. The main features
of the Bluetooth are:
• Minimal hardware dimensions.
• Low cost Bluetooth components (Low cost technology).
• Low power consumption.

4. ZigBee COMPARISON WITH OTHER M2M TECHNOLOGIES 24
• Short range.
The low cost and small size of the Bluetooth enable this technology to be integrated
into many portable devices such as smart phones, PDAs and laptops. On the other
hand, low power consumption aspect of the Bluetooth allows the devices to save
more energy to prolong their battery life. This characteristic of the Bluetooth is
signi�cantly important since most of the devices are limited from energy point of
view.
4.1.2 Bluetooth Networking
Bluetooth enables the communications between device by establishing one device as
a master and other devices as slaves. No di�erence between devices to be chosen as a
master. In other words, each device is able to act as a master device. This property
makes this technology to behave as an ad-hoc network. Master device de�nes the
frequency hopping pattern according to its address [43]. Two di�erent topologies
are de�ned in Bluetooth technology to form a network: piconet and scatternet.
Figure 4.1: Piconet (left) and scatternet (right).
Piconet Piconet is an ad-hoc network in which all the devices have the same syn-
chronized frequency hopping. This network independently works only with
one master and all other devices obey the master. The master device can
be replaced by another slave devices in the case of their request. One of
the important functionality of the master is allocating fair bandwidth to each
slave device. This topology can support up to 8 active devices and 248 parked
4. ZigBee COMPARISON WITH OTHER M2M TECHNOLOGIES 25
devices along with enormous standby devices. Figure 4.1 refers to these topolo-
gies. The left hand side topology refers to piconet and right hand one presents
the scatternet topology supported by Bluetooth technology[43].
Scatternet Scatternet is a topology formed by the overlapped piconet networks.
A master can leave one piconet and jump to another adjacent piconet or it
can simultaneously be a slave device in another piconet network while it is a
master in its own piconet network. In addition, the entire devices use the same
frequency range allocated to Bluetooth technology but each piconet network
employs di�erent frequency hopping scheme to avoid occurring undesirable in-
terference. This topology increases the optimal use of the available bandwidth.
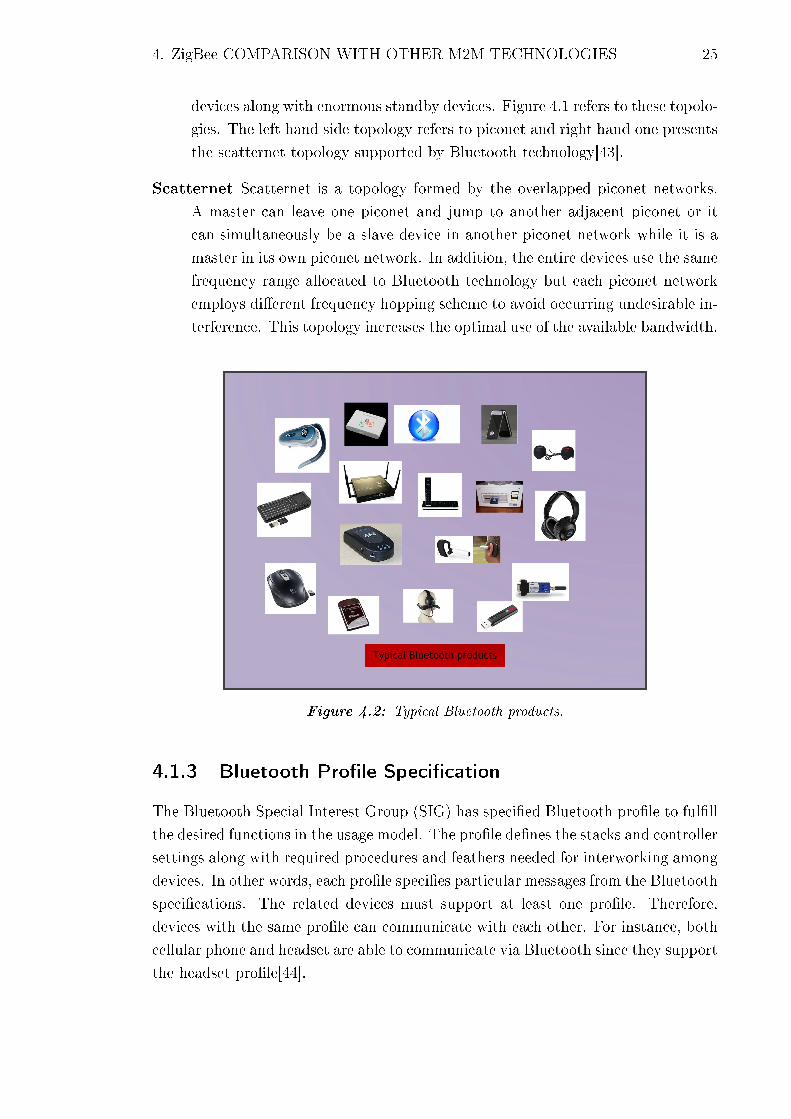
Figure 4.2: Typical Bluetooth products.
4.1.3 Bluetooth Pro�le Speci�cation
The Bluetooth Special Interest Group (SIG) has speci�ed Bluetooth pro�le to ful�ll
the desired functions in the usage model. The pro�le de�nes the stacks and controller
settings along with required procedures and feathers needed for interworking among
devices. In other words, each pro�le speci�es particular messages from the Bluetooth
speci�cations. The related devices must support at least one pro�le. Therefore,
devices with the same pro�le can communicate with each other. For instance, both
cellular phone and headset are able to communicate via Bluetooth since they support
the headset pro�le[44].

4. ZigBee COMPARISON WITH OTHER M2M TECHNOLOGIES 26
Table 4.1: Pro�les speci�ed in Bluetooth speci�cations.
Pro�le DescriptionGeneric access Generic procedures related to discovery and link
management of connecting Bluetooth devices.Service discovery To discover available services and in
the range devices.Cordless telephony To enable using the Bluetooth enabled devices
as a cordless telephone.Serial port To set up emulated serial cable connections using
RFCOMM between two peer devices.Headset To enable audio communications between the
Bluetooth equipped devices.Intercom Requirements to support of the intercom functionality
among the �3-in-1� phone use cases.Dial-up To enable dial-up Internet connection.Fax To support communication between Bluetooth devices
implementing fax services.LAN access To enable local area network over PPP.
Object exchange Requirements for Bluetooth devices to support Objectexchange usage model.
Object push Requirements for Bluetooth devices to supportobject push usage model.
File transfer To support the �le transferring functionality.Synchronization To support synchronization usage model.
The pro�le is meant to reduce the interoperability between di�erent devices from
di�erent vendors. Table 4.1 presents some of the prevalent pro�les which are used
by the di�erent Bluetooth devices. The wide area of the applications is also shown
in Figure 4.2.
4.1.4 Technical Characteristics of Bluetooth
The technical characteristics of the Bluetooth are described in this section. These
characteristics are according to Bluetooth objectives such as low cost, low power
consumption and high data rate which are relatively ful�lled by this technology.
Some of the important characteristics of the Bluetooth are listed in Table 4.2.
As Table 4.2 indicates, the aggregate data rate is 1 Mbps for the approximate
range of 10 meters. The range depends on the class of the devices and, therefore,
on the type of the transmission power. Hence it leads to three class of devices:
1. Class 1: This class is designed to support high range applications such as
Bluetooth access point in the approximate range of 100 meters and with power
of 20 dBm (100 mW).
4. ZigBee COMPARISON WITH OTHER M2M TECHNOLOGIES 27
Table 4.2: Technical characteristics of the Bluetooth[44],[42].
Characteristics BluetoothAverage range 10 meters
Operating frequency 2.4 GHz ISMData rate 1 Mbps
Network Topology Adh oc piconetsNumber of devices per network 8
2. Class 2: This class is meant for moderate range (10 meters) devices such as
PC peripheral accessories with power of 4 dBm (2.5 mW).
3. Class 3: This class works for very low power devices operating in the range of
1 meter with power of 0 dBm (1mW) [45],[44].
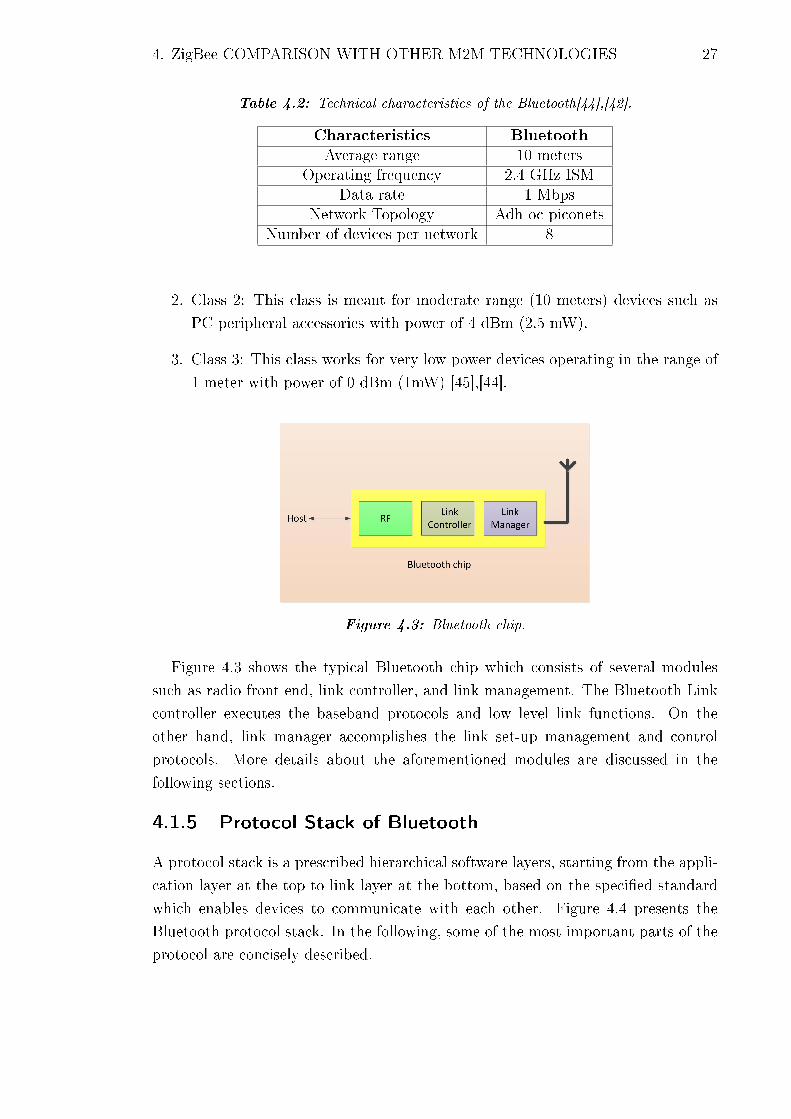
Figure 4.3: Bluetooth chip.
Figure 4.3 shows the typical Bluetooth chip which consists of several modules
such as radio front end, link controller, and link management. The Bluetooth Link
controller executes the baseband protocols and low level link functions. On the
other hand, link manager accomplishes the link set-up management and control
protocols. More details about the aforementioned modules are discussed in the
following sections.
4.1.5 Protocol Stack of Bluetooth
A protocol stack is a prescribed hierarchical software layers, starting from the appli-
cation layer at the top to link layer at the bottom, based on the speci�ed standard
which enables devices to communicate with each other. Figure 4.4 presents the
Bluetooth protocol stack. In the following, some of the most important parts of the
protocol are concisely described.
4. ZigBee COMPARISON WITH OTHER M2M TECHNOLOGIES 28
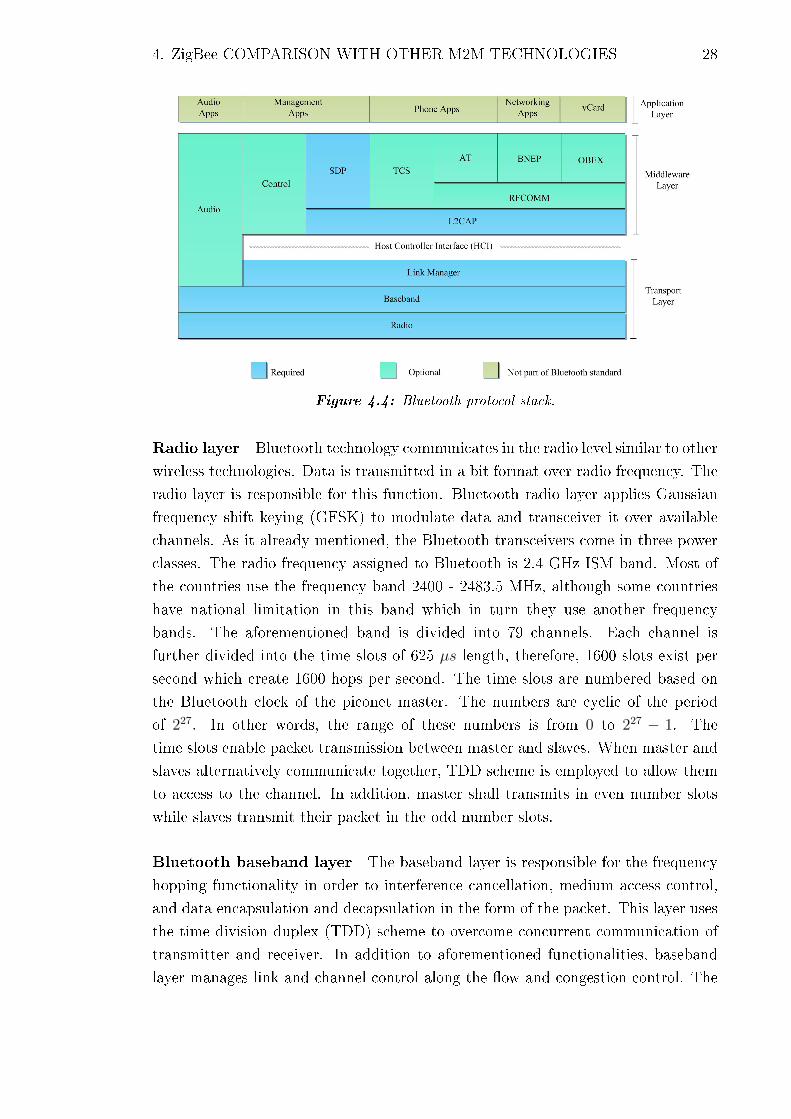
Figure 4.4: Bluetooth protocol stack.
Radio layer Bluetooth technology communicates in the radio level similar to other
wireless technologies. Data is transmitted in a bit format over radio frequency. The
radio layer is responsible for this function. Bluetooth radio layer applies Gaussian
frequency shift keying (GFSK) to modulate data and transceiver it over available
channels. As it already mentioned, the Bluetooth transceivers come in three power
classes. The radio frequency assigned to Bluetooth is 2.4 GHz ISM band. Most of
the countries use the frequency band 2400 - 2483.5 MHz, although some countries
have national limitation in this band which in turn they use another frequency
bands. The aforementioned band is divided into 79 channels. Each channel is
further divided into the time slots of 625 µs length, therefore, 1600 slots exist per
second which create 1600 hops per second. The time slots are numbered based on
the Bluetooth clock of the piconet master. The numbers are cyclic of the period
of 227. In other words, the range of these numbers is from 0 to 227 − 1. The
time slots enable packet transmission between master and slaves. When master and
slaves alternatively communicate together, TDD scheme is employed to allow them
to access to the channel. In addition, master shall transmits in even number slots
while slaves transmit their packet in the odd number slots.
Bluetooth baseband layer The baseband layer is responsible for the frequency
hopping functionality in order to interference cancellation, medium access control,
and data encapsulation and decapsulation in the form of the packet. This layer uses
the time division duplex (TDD) scheme to overcome concurrent communication of
transmitter and receiver. In addition to aforementioned functionalities, baseband
layer manages link and channel control along the �ow and congestion control. The

4. ZigBee COMPARISON WITH OTHER M2M TECHNOLOGIES 29
error correction is another task which is done in this layer.
Link protocols As Figure 4.4 shows, Link Manager Protocol (LMP) and Logical
Link Control and Adaptation Protocol (L2CAP) are responsible for link set-up and
control. These protocols are necessary to manage device pairing, synchronization,
quality of service, and encryption. Bluetooth devices should exchange several con-
trol messages to con�gure and manage the baseband connection. The de�nition
of these messages is part of LMP. On the other hand, LPM performs Link set-up,
authentication, encryption, power control and link con�guration. The L2CAP is
responsible for QoS support, protocol multiplexing, and reassembly of the PDU of
the upper layer. Furthermore, it provides a connection-oriented and connectionless
data services to the higher layers. The Service Discovery protocol (SDP) discovers
services available in the proximity and de�nes the characteristics of the services.
4.2 RFID
Radio Frequency Identi�cation (RFID) is a wireless technology which allows for
short range and remote capturing data from a low cost and compact data source.
This data may provide identi�cation, location information, or speci�c knowledge
about products like the date of production or expiry. More details are presented in
the following sections about the RFID system.
Figure 4.5: Overview of generic RFID system [46].
4.2.1 Overview of the RFID System
The RFID system comprises of a device to access data known as reader (interrogator)
and a data-carrying transponder so called tag. Tags are attached to items which
are monitored or positioned or carried by individuals. Readers collect data from
the tag attached to an asset being passed from a particular location [47]. Figure
4.5 shows the generic overview of a typical RFID system. System is divided to IT
layer and physical layer. As the �gure shows the physical layer consists of Tag,
reader/interrogator and Interrogation zone (IZ) [46].

4. ZigBee COMPARISON WITH OTHER M2M TECHNOLOGIES 30
Tag
Tags has the same functionality as optical bar-cods which are meant to identify the
attached objects and items. Tags which also called transponder, consists of two
main parts: IC cheap and antenna. IC cheaps are able to store data and process
them and antennas can transmit the data whenever it is in the interrogator zone.
There are three main tags from power supply point of view: active, semi passive,
and passive tags. Active tags have a source of energy like battery, whereas passive
tags require no power sources. Hence, active tags work in higher operational range
compared to passive tags. But this attribute comes in trade of higher price for active
tags. Passive tags come in di�erent shapes and packages due to lacking of power
source. These tags operate in LF (low frequency), HF (high frequency), or VHF
(very high frequency) band. On the other hand, active and passive tags are more
expensive and less resistant to mechanical stress and more problematic in the high
temperature environment [48].
Reader
Readers in RFID are similar to the scanners in optical bar-code systems. Readers
have three main functions:
• Support energy for the tag.
• Provide a carrier signal.
• Decode and detect the modulated signal [49].
The reader is able to be read or read/write a device that uses an antenna to send a
radio frequency electromagnetic wave to the tag. Both power and data can be sent.
Once the tag is energized it will either send its stored data or be updated with new
data depending on the wish of the user. The reader is comprised of antenna and
interrogator circuitry. The circuitry is like a intermediate module between antenna
and IT layer. It sends data via readers antenna and receives data and transfers it
to higher layer for further process [46].
Interrogation Zone
Interrogation zone is an area in which reader and tag interact to each other to
exchange data. This zone consists of everything in the vicinity of the tags where
electromagnetic waves travel between them [46].

4. ZigBee COMPARISON WITH OTHER M2M TECHNOLOGIES 31
Figure 4.6: Near-�led power/communication mechanism for RFID system [50].
4.2.2 Near-�eld RFID
The basis of the near-�eld coupling between reader and tag is Faraday principle
of magnetic induction. Passing a large alternating current through a coil in the
reader produces the alternating magnetic �eld in the vicinity of the coil. By using
another small coil in the tag located in the range of this magnetic �eld leads to an
alternating voltage. This voltage is recti�ed by using a recti�er and is stored in a
capacitor which provides enough power to energize the tag chip. Figure 4.6 shows
the near-�eld mechanism of the RFID system. Tag sends its data back to reader
using Load modulation. The induction current �own in the tag coil itself produces
small magnetic �eld which will oppose to reader's magnetic �eld. The reader coil
will detect this small changes as an increased current. This current is proportional to
the data which applied to tag's coil. Employing near-�eld mechanism in passive tags
is very straightforward but it has some drawbacks as well. The range of coverage in
magnetic induction can be approximated by c/2πf , where c is a constant (speed of
light) and f is the frequency. As operating frequency increases, the range between
tag and reader decreases. On the other hand, magnetic �led drops o� as a factor of
1/r3, where r is the distance between the reader and tag [50].

4. ZigBee COMPARISON WITH OTHER M2M TECHNOLOGIES 32
4.2.3 Far-�eld RFID
Tag based on far-�eld communication captures electromagnetic (EM) waves trans-
mitted from the dipole antenna of the reader. Tag absorbs the energy as an alterna-
tive potential di�erence which appears across its dipole antenna. A simple recti�er
like a diode recti�es the potential. The diode is connected to a capacitor which ac-
cumulates the energy required for powering the tag circuitry. Unlike the near-�eld
tags which use load modulation to send data back to readers, far-�eld tags employ
back scattering to transfer data beck to readers. The antenna will absorb the most
energy in the current frequency in the case of designing the appropriate size of the
antenna. However, if an impedance mismatch occurs antenna will re�ect some of the
energy toward reader. By adjusting the impedance mismatch and using a transistor
the amount of back scattering waves can be controlled.
The range of RFID system based on the far-�led mechanism is limited to the
amount of the energy receives to the antenna of the tag. The back scattering waves
received in readers are resulted in two successive attenuations. The attenuation
occurs when EM travels from reader to tag and the second one when it radiates
from the tag to the reader. This attenuation is proportional to 1/r4, where r is the
distance between reader and tag. Hence, the energy of the back scattered wave is so
small. But thanks to improvement in semiconductor industry the amount of energy
required for this circuits is ever decreasing [50].
Figure 4.7: Far-�led power/communication mechanism for RFID system [50].

4. ZigBee COMPARISON WITH OTHER M2M TECHNOLOGIES 33
4.3 Wi-Fi
Wi-Fi is the commercial name for the Wireless Local Area Network (WLAN) based
on IEEE 802.11 standard which o�cially released in 1997 [51]. WLAN was specif-
ically created to operate as a wireless Ethernet. This technology provides wireless
connectivity for end users in local area network. Internet access is provided at
broadband speeds through Wi-Fi to an access point (AP) or in ad-hoc mode.
The IEEE Standard Association is responsible for developing the IEEE 802.11TM.
The main tasks of this organization are designing, developing, and standardizing
the new technologies. The objective of the IEEE 802.11TM is providing the wireless
connectivity between the stations within the wireless local area network.
IEEE 802.11 standard de�nes two ways of transmission of signal through the
air. These two ways can be implemented either optical or radio technology for the
WLANs. Firstly, the original standard de�ned 1 Mbps and 2 Mbps rates by using
Frequency Hopping Spread Spectrum (FHSS) and Direst Sequence Spread Spectrum
(DSSS) as the spread spectrum modulation. The main issue of the 802.11 was low
data rate specially in business environment. To increase the data rate, IEEE 802.11
group developed new amendments of the current standard. In the following, some
of the most important amendments of IEEE 802.11 family are described:
• IEEE 802.11a
• IEEE 802.11b
• IEEE 802.11g
• IEEE 802.11n
• IEEE 802.11ac
• IEEE 802.11ah
Table 4.3 shows the modulations used in IEEE 802.11 standard family.
IEEE 802.11a
IEEE standard 802.11a has been released in 1999 operating in the 5 GHZ spectrum.
The 802.11a standard was designed to improve the data-rate using the higher fre-
quency band and e�cient modulation technique (OFDM). The following sub-carrier
modulations are utilized by this standard: Binary Phase Shift Keying (BPSK) mod-
ulation, Quadrature Phase Shift Keying (QPSK), 16-QAM (Quadrature Amplitude
Modulation) and 64-QAM. The main drawback of this standard is having the lower
coverage range due to higher propagation loss in the higher frequency bands.

4. ZigBee COMPARISON WITH OTHER M2M TECHNOLOGIES 34
IEEE 802.11b
The 802.11b standard improves the data-rate up to 11 Mbps in the 2.4 GHz un-
licensed spectrum using the complementary code keying (CCK) modulation. This
modulation makes e�cient use of the radio spectrum.
IEEE 802.11g
The IEEE 802.11g standard has been rati�ed in 2003. The 802.11g provides higher
bandwidth up to 54 Mbps. This standard is backward compatible with the previous
released standards. This standard utilizes the e�cient modulation technique like
OFDM to improve the performance of the standard in 2.4 GHz ISM band.
IEEE 802.11n
IEEE 802.11n published in 2009 increases the data-rate up to 600 Mbps. This stan-
dard improves the performance by adding multiple-input multiple-output (MIMO)
antennas. IEEE 802.11n operates in both 2.4 GHz and 5 GHz frequency bands
which the latter one is optional. IEEE 802.11n utilizes orthogonal frequency divi-
sion multiplexing (OFDM) method like 802.11a and 802.11g, but it updates many
features of OFDM to obtain higher data rate [62].
IEEE 802.11ac
IEEE 802.11ac is meant to produce very high throughput (VHT) connection for
WLAN. The operating frequency band for this standard is on 5 GHz spectrum.
Achieving very high throughput up to 6 Gbps is possible by utilizing e�cient OFDM
modulation technique, increasing number of MIMO antennas and high density mod-
ulation (256-QAM). In addition, IEEE 802.11ac has many improvement in the phys-
ical and MAC layers compared to the IEEE 802.11n [64].
IEEE 802.11ah
The IEEE 802.11ah standard is on �nal stage of development. It can be one of
the candidate standards for IoT and M2M applications. This standard is being
developed by gathering proposals by the IEEE 802.11ah task group and it is expected
to be published by the year 2014. The IEEE 802.11ah will operate in Sub-1 GHz
unlicensed frequency band enabling the data transmission for the bursty tra�cs [80].
The operating bands for this standard will be one or more from the following
bands: 863-868.6 MHz (Europe), 950.8 MHz -957.6 MHz (Japan), 314-316 MHz,
430-432 MHz, 433.00-434.79 MHz (China), 917-923.5 MHz (Korea) and 902- 928
MHz (USA). The main bene�t of utilizing the above mentioned spectrum is the

4. ZigBee COMPARISON WITH OTHER M2M TECHNOLOGIES 35
Table 4.3: Modulation in IEEE 802.11x
Standard 802.11 802.11b 802.11a 802.11g 802.11n 802.11ac/ah
Modulation FHSS, DSSS OFDM OFDM, OFDM OFDM
DSSS DSSS
improvement of the coverage area for the IoT applications which increases the energy
e�ciency. In addition, by using simpli�ed hardware-structure for the IoT device
components, achieving low cost technology is also possible. All in all, these attributes
make this band interesting for the IoT and M2M applications in near future. The
main functional requirements for IEEE 802.11ah [80], [81] are the following:
• The provided coverage area up to 1000 m.
• Data exchange of 100 kbps and higher.
• maintaining the IEEE 802.11 WLAN user experience for �xed, outdoor, point
to multi-point applications.
The desired coverage area is relatively high compared to the legacy standards but
instead, the required data-rate is quite small.
4.3.1 IEEE 802.11 Architecture
The IEEE 802.11 standard consists of three mode: infrastructure mode, ad-hoc
mode, and mesh mode.
Infrastructure mode is a cellular structure which has at least one AP. The system
is divided into cells called Basic Service Set (BSS). Each cell consists of a set of the
�xed or mobile stations which are controlled by a Base Station or AP. All the stations
share the same wireless medium within a cell and compete to obtain the access to
the medium. The operating range between stations are limited to their power and
propagation conditions like indoor and outdoor environments. The coverage of the
wireless area can be expanded by overlapping multiple BBSs. Each AP in BSS
connects to a distributed system (DS) which allows communication between cells.
The extended version of network built with multiple BSSs is Extended Service Set
ESS (See Figure 4.8) [52], [53].
Stations in ad-hoc mode communicate without any AP. This mode is called inde-
pendent basic service set (IBBS) as well. The formation of the network is possible
without any pre-planning or using infrastructure. Figure 4.8 shows IBSS and ESS
con�gurations of Wi-Fi networks [52], [53].
The third type of network con�guration is mesh mode which is a combination
version of infrastructure mode and ad-hoc mode [52].

4. ZigBee COMPARISON WITH OTHER M2M TECHNOLOGIES 36
Figure 4.8: IBSS and ESS con�gurations of Wi-Fi networks [53].
4.3.2 Physical Layer
The IEEE 802.11 employs several modulation techniques in physical layer which are:
Frequency Hopping Spread Spectrum (FHSS), Direct Sequence Spread Spectrum
(DSSS), and Orthogonal Frequency Division Multiplexing (OFDM). Table 4.3 shows
the modulation techniques used in IEEE 802.11.
Frequency Hopping Spread Spectrum (FHSS) is a method for transmitting
a radio signal by rapidly changing the operating frequency from a set of frequencies.
This frequencies are changed based on a pseudo-random scheme which is known to
both transmitter and receiver [55], [56].
Direct Sequence Spread spectrum (DSSS) is a technique to spread the data
bearing signal over the whole bandwidth using a higher bit rate sequence called
chipping code. The chipping code is a redundant bit pattern for each transmitted
data which makes transmitted signal very resistant against interference. If some
errors happen during transmission, data will be corrected in the received signal by
using the redundancy [57], [58].
Orthogonal Frequency Division Multiplexing (OFDM) is a special case
of multicarrier transmission where data stream is transmitted over lower bit rate
sub-carriers. This method can be used as a modulation or multiplexing. The reason
for using OFDM technique is the robustness against frequency selective fading and
narrow-band interferences [59], [60].
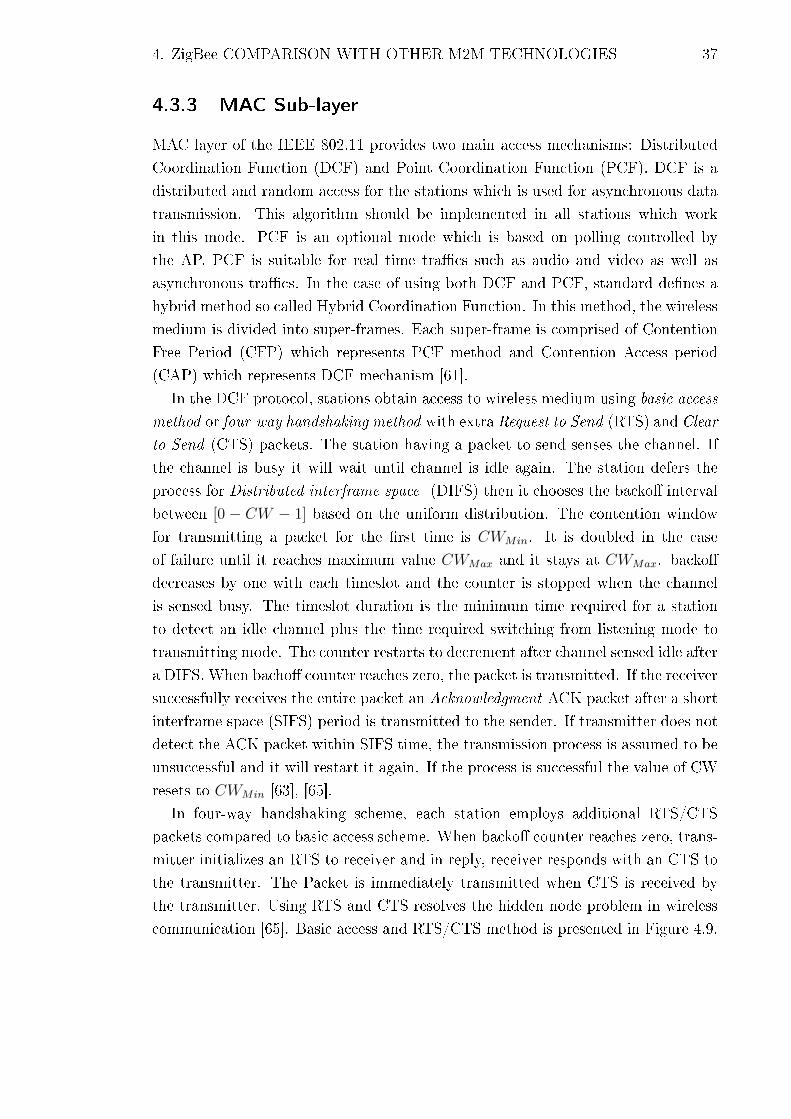
4. ZigBee COMPARISON WITH OTHER M2M TECHNOLOGIES 37
4.3.3 MAC Sub-layer
MAC layer of the IEEE 802.11 provides two main access mechanisms: Distributed
Coordination Function (DCF) and Point Coordination Function (PCF). DCF is a
distributed and random access for the stations which is used for asynchronous data
transmission. This algorithm should be implemented in all stations which work
in this mode. PCF is an optional mode which is based on polling controlled by
the AP. PCF is suitable for real time tra�cs such as audio and video as well as
asynchronous tra�cs. In the case of using both DCF and PCF, standard de�nes a
hybrid method so called Hybrid Coordination Function. In this method, the wireless
medium is divided into super-frames. Each super-frame is comprised of Contention
Free Period (CFP) which represents PCF method and Contention Access period
(CAP) which represents DCF mechanism [61].
In the DCF protocol, stations obtain access to wireless medium using basic access
method or four-way handshaking method with extra Request to Send (RTS) and Clear
to Send (CTS) packets. The station having a packet to send senses the channel. If
the channel is busy it will wait until channel is idle again. The station defers the
process for Distributed interframe space (DIFS) then it chooses the backo� interval
between [0 − CW − 1] based on the uniform distribution. The contention window
for transmitting a packet for the �rst time is CWMin. It is doubled in the case
of failure until it reaches maximum value CWMax and it stays at CWMax. backo�
decreases by one with each timeslot and the counter is stopped when the channel
is sensed busy. The timeslot duration is the minimum time required for a station
to detect an idle channel plus the time required switching from listening mode to
transmitting mode. The counter restarts to decrement after channel sensed idle after
a DIFS. When bacho� counter reaches zero, the packet is transmitted. If the receiver
successfully receives the entire packet an Acknowledgment ACK packet after a short
interframe space (SIFS) period is transmitted to the sender. If transmitter does not
detect the ACK packet within SIFS time, the transmission process is assumed to be
unsuccessful and it will restart it again. If the process is successful the value of CW
resets to CWMin [63], [65].
In four-way handshaking scheme, each station employs additional RTS/CTS
packets compared to basic access scheme. When backo� counter reaches zero, trans-
mitter initializes an RTS to receiver and in reply, receiver responds with an CTS to
the transmitter. The Packet is immediately transmitted when CTS is received by
the transmitter. Using RTS and CTS resolves the hidden node problem in wireless
communication [65]. Basic access and RTS/CTS method is presented in Figure 4.9.

4. ZigBee COMPARISON WITH OTHER M2M TECHNOLOGIES 38
Figure 4.9: The IEEE 802.11 access methods: (a) Basic access method. (b) Four-wayhandshaking access method.
4.4 ZigBee Comparison with Bluetooth, RFID, and Wi-Fi
4.4.1 RF Channels and Bandwidth
Table 4.4 presents some of the main di�erences between Zigbee and other technolo-
gies. As Table 4.4 shows, these technologies operate in wide range of frequency
bands. For instance, RFID operates in 125 KHz (LF), 13 MHz (HF), 900 MHz
(UHF), and 2.45 GHz ( Microwave) [66]. ZigBee operates in 868/915 MHz and
2.4 GHz and Wi-Fi works in 2.4 GHz and 5 GHz. Bluetooth only operates in 2.4
GHz band. It can be observed that all technologies utilize 2.4 GHz frequency band
known as ISM (industrial, scienti�c, and medical ) which is unlicensed in most coun-
tries. Bluetooth employs frequency hopping (FHSS) with 79 channels and 1 MHz
bandwidth, while ZigBee utilizes direct sequence spread spectrum (DSSS) with 16
channels and 2 MHz bandwidth. Wi-Fi uses DSSS in 802.11 standard, complemen-
tary code keying (CCK) in 802.11b , or OFDM modulation in 802.1 1a/g/n with 14
RF channels and 22 MHz bandwidth. RFID systems using ISO18000-6 standards
applies FHSS for the communication between tag and reader [67]. This means that
an RFID reader may hop between channels within the operating band of frequencies
in a pseudo-random manner.
4.4.2 Datarate and Modulation
ZigBee is designed for the low rate and low consumption applications such as wireless
sensors which do not require high rates standards. The ZigBee supported by the
IEEE 802.15.4 standard has a rate of 250 kbps in 2.4 GHz frequency band. However,

4. ZigBee COMPARISON WITH OTHER M2M TECHNOLOGIES 39
data rate of 20 kbps in 868 MHz band and 40 kbps in 915 MHz band are used in
some countries as well. This technology uses the following modulations: BPSK,
ASK and OQPSK.
RFID system operates in di�erent frequency bands from LF to microwave band
and tags work in passive, semi-passive and active class so that di�erent data rates
are available for this technology in the range of 1 kbps to 200 kbps. ASK, PSK and
FSK are the digital modulations which RFID system employs them.
Bluetooth using GFSK modulation operates with 1 Mbps and it has fairly high
data rate in wireless personal area network. In contrast, Wi-Fi has a wide range of
data rates due to di�erent allocated bandwidths and di�erent supported protocols.
Therefore, the range of the data rate and occupied bandwidth is so dynamic in
Wi-Fi technology. For instance, IEEE 802.11b operates in 1 Mbps data rate while
the IEEE 802.11ac ,which is the newest Wi-Fi protocol, can acheive a data rate of 1
Gbps [68]. Di�erent modulations are applied in Wi-Fi technologies including BPSK,
QPSK, OFDM, CCK, M-QAM.
4.4.3 Network Size and Range
The maximum number of nodes per network for Bluetooth is 8 nodes which includes
7 slaves and one master. This number is 2007 nodes for a structured Wi-Fi BSS.
In this regard, ZigBee can have more than 65000 nodes in a star network. These
technologies can be extended to more complicated networks, for instance, ZigBee
can be extended to cluster tree or mesh network, Wi-Fi to ESS and Bluetooth to
scatternet network [69] [70]. Refer to Table 4.5 for comparison study of ZigBee,
Wi-Fi and Bluetooth.
As Table 4.4 presents, ZigBee has a wide variety of coverage range. This range
extends from 10 meters to 100 meters depending on the type of the sensors and class
of transmission. In contrast, the range of Bluetooth is less than ZigBee and it is from
10 meters to 30 meters. This shows that Bluetooth fairly has less coverage range
than ZigBee technology. In RFID technology, the variety of coverage is even more
dynamic than the ZigBee technology. The typical coverage range is 6 meters for
passive tags and 120 meters for the active tags. Wi-Fi relatively has large coverage
range of 100 meters since it is designed for the local area network [69].
4.4.4 Transmission Power
As Table 4.4 shows, ZigBee has the lowest transmission power among the other
technologies . The range of the transmission power for the ZigBee technology is
between -25 dBm to 0 dBm. In RFID technology, the transmit power depends on
the type of the tag. In semi-active and active tags, the range of the transmission

4. ZigBee COMPARISON WITH OTHER M2M TECHNOLOGIES 40
power is changing between 1 mW to 4 W [66]. The transmit power in Bluetooth
technology is in the range of 1 mW to 10 mW and the Wi-Fi has the transmission
power of 100 mW. However, in IEEE 802.11ah technology ,which is meant for the
IoT and M2M applications, the typical transmission power is of 1 mW.

4. ZigBee COMPARISON WITH OTHER M2M TECHNOLOGIES 41
Table
4.4:Comparative
StudyofZigBee
Technology
withother
M2M
enablingtechnologies
[69],[66][24].
Technology
Zigbee
Bluetooth
RFID
Wi-Fi
Standard
IEEE802.15.4
IEEE802.15.1
ISO
18000
802.11a/b/g/n/ac
IEEE802.11ah
Frequency
band
868/915M
Hz;
2.4G
Hz
125kHzto
2.5G
Hz
2.4G
Hz;5G
Hz
Sub-1
GHz
2.4GHz
Datarate
250kbps
1Mbps
1-200kbps
1Mbps-1Gbps
0.65
-7.8Mbps
Typical
Range
10-100
m10
-30m
6m
(Passive)
100m
100-1000
m120m
(Active)
TXpow
er(-25)-0dBm
1-10
mW
1mW
-4W
100mW
1mW
No.of
channels
1/10;16
794(865MHzband)
14(2.4GHz)
4,2
(868
MHzband)
Bandwidth
0.3/0.6;
2MHz
1MHz
200KHz
20;40;80MHz
1,2,4,8,16MHz
(865
MHzband)
Modulation
BPSK(+
ASK),
GFSK
ASK/F
SK/P
SK
BPSK,QPSK,COFDM,
BPSK,QPSK,
OQPSK
CCK,M-Q
AM
16/64/256-QAM
Transm
ission
DSSS
FHSS
FHSS
DSSS,CCK,OFDM
OFDM
technique
Dataprotection
16-bitCRC
16-bitCRC
16-bitCRC
32-bitCRC
32-bitCRC
Table
4.5:ComparisonstudyofZigBee
withWi-FiandBluetooth
[69],[66].
Technology
Zigbee
Bluetooth
Wi-Fi
BasicCell
Star
Piconet
BSS
Extension
ofBasicCell
Cluster
tree,Mesh
Scatternet
ESS
Maximum
Number
ofCellnodes
morethan
65000
82007

5. SIMULATOR DESCRIPTION AND SETTINGS 42
5. SIMULATOR DESCRIPTION AND
SETTINGS
5.1 The OMNeT++ Simulation Environment
OMNeT++ is a modular-structure simulator with open architecture environment
which has powerful graphical user interface support and an embedded simulation
kernel. Simulator is useful for modeling the communication protocols, tra�cs, com-
puter networks, multi-processor and distributed systems [71].
In the following section, di�erent simulators for modeling communication proto-
cols and computer networks are introduced. Then OMNeT++ is introduced and its
functionality is explained in details. In the end, the settings of the simulation are
illustrate in details.
5.1.1 Available Network Simulators
A wide variety of simulators are available with di�erent �exibility and complexity to
model communication systems and network protocols and simulate their behaviors.
Some of the most important simulators are discussed and explained in the following
section. More details about network simulator can be found in [71].
OMNeT++ OMNeT++ is a component-based, modular and open source discrete
event simulation framework which has the strong GUI and embedded simula-
tion kernel. Di�erent application areas such as computer networks and tra�c,
complex IT systems, queuing networks, hardware architectures and distributed
systems can be simulated by this simulator. In addition, OMNeT++ supports
animation and interactive executions. It is an open source simulator and free
of charge in order to use for the academic purposes [72].
OPNET A network simulator which provides a solution for network R& D, capac-
ity, and application performance and network operations management. OP-
NET is specially a development environment that allows to study, design and
deploy communication networks, devices, applications and protocols [73].
The Network Simulator-ns2 A leading simulator that accommodates a substan-
tial means for simulation and modeling of TCP, routing and multi-cast proto-

5. SIMULATOR DESCRIPTION AND SETTINGS 43
cols over the wire and wireless networks including local and satellite commu-
nications. It is developed by University of Southern California (USC) and it
is publicly free by GNU GPLv2 license[74].
NetSim NetSim is a popular simulator developed by Tetcos. It is useful for labo-
ratory experimentations and network researches which has turned to be as a
teaching tool in academic community. Simulation of many protocols such as
aloha, slotted aloha, Ethernet - CSMA/CD, Fast Ethernet, Gigabit Ethernet,
Token Ring, Token Bus, W Lan, X.25 Frame Relay, ATM, TCP, IP, Rout-
ing RIP, OSPF, BGP, MPLS, Wi-Max, Wireless Sensor Networks and Zigbee
802.15.4 are supported by NetSim. A free demo version can be downloaded
from the website [75].
5.1.2 Simulation Modeling Concept
Discrete Event Simulation
Discrete Event Simulation is a simulation in which the state of a model changes
only in discrete and random time. The only events can change the states. It should
be noticed that between consecutive events, no change in the system is assumed to
occur; thus the simulation can directly jump in time from one event to the next
one. The time within the simulation is called simulation time and the time when
the event occurs is referred to event timestamp. Real time indicates the actual
simulation running time which shows how long the simulation takes to completely
run.[76].
On the contrary, the states change all the time in continuous simulation model.
Most of the systems, for instance, manufacturing, transportation, communications,
queuing systems, information processing, and etc can be modeled by applying dis-
crete event simulation. Five di�erent states are investigated in each entity de�ning
the moving unit from one point to another point in the discrete event simulation
model:
1. Active state: The state in which the entity is currently moving.
2. Ready state: The state in which the entity is waiting before entering the active
state. In other word, more than one entity is in ready state waiting for active
state, thus they should move into active state one in a time.
3. Dormant state: Dormant state, hold or sleep state in which the change in the
state of the entity cannot be triggered to transfer state. The logic of the model
should �rst transfer the state of the entity from dormant state to ready state.
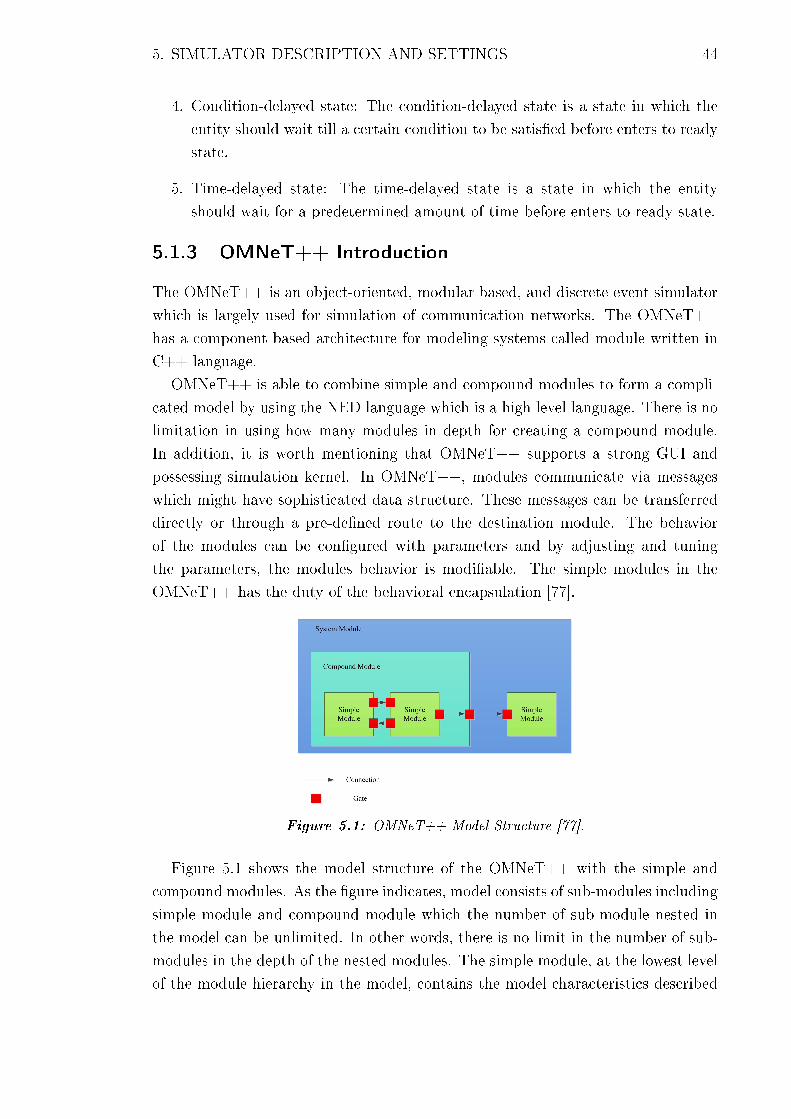
5. SIMULATOR DESCRIPTION AND SETTINGS 44
4. Condition-delayed state: The condition-delayed state is a state in which the
entity should wait till a certain condition to be satis�ed before enters to ready
state.
5. Time-delayed state: The time-delayed state is a state in which the entity
should wait for a predetermined amount of time before enters to ready state.
5.1.3 OMNeT++ Introduction
The OMNeT++ is an object-oriented, modular based, and discrete event simulator
which is largely used for simulation of communication networks. The OMNeT++
has a component based architecture for modeling systems called module written in
C++ language.
OMNeT++ is able to combine simple and compound modules to form a compli-
cated model by using the NED language which is a high level language. There is no
limitation in using how many modules in depth for creating a compound module.
In addition, it is worth mentioning that OMNeT++ supports a strong GUI and
possessing simulation kernel. In OMNeT++, modules communicate via messages
which might have sophisticated data structure. These messages can be transferred
directly or through a pre-de�ned route to the destination module. The behavior
of the modules can be con�gured with parameters and by adjusting and tuning
the parameters, the modules behavior is modi�able. The simple modules in the
OMNeT++ has the duty of the behavioral encapsulation [77].
Figure 5.1: OMNeT++ Model Structure [77].
Figure 5.1 shows the model structure of the OMNeT++ with the simple and
compound modules. As the �gure indicates, model consists of sub-modules including
simple module and compound module which the number of sub-module nested in
the model can be unlimited. In other words, there is no limit in the number of sub-
modules in the depth of the nested modules. The simple module, at the lowest level
of the module hierarchy in the model, contains the model characteristics described

5. SIMULATOR DESCRIPTION AND SETTINGS 45
by the user. The simple modules are written in C++ and by using the OMNeT++
simulation class library.
The OMNeT++ model is called OMNeT++ network as well. The simple and
compound modules are instances of user pre-described module types in a network.
In the other hand, using the module types, makes it possible to de�ne more sophis-
ticated and complex modules. Thus the OMNeT++ is a suitable tool for describing
and modeling the logical structure of an actual system by de�ning and applying the
module types.
5.1.4 The NED Language
NED (NEtwork Description) is a network descriptive language for de�ning the topol-
ogy of a network employed by the OMNeT++. This language is a strong tool for
describing the simple and compound modules and the channels. The component de-
scriptions de�ned by the NED can be reused by the other networks using inherited
properties of this language. The NED �les use the .ned extension and the following
components:
• Import directives
• Channel de�nition
• Simple module de�nition
• Compound module de�nition
• Network de�nition
Import Directives
Using import directives, makes it possible to reuse simple and compound modules
from another network �les . The import directives facilitate using the pre-de�ned
simple modules, compound modules and channel descriptions of another networks
in the current network.
Channel De�nition
NED allows to de�ne di�erent channel types by sub-classing from the pre-de�ned
channel types. Two channel types can be parametrized to describe common channel
attributes. These three types of the channels are described below:
IdealChannel: Ideal channel allows messages to be transferred without delay and
impairment along the path. This type of connection has no parameter to
con�gure.

5. SIMULATOR DESCRIPTION AND SETTINGS 46
DelayChannel: The propagation delay is taken into account in this channel and
two parameters are used to specify the channel attributes:
• delay: to simulate the propagation with the unit of second.
• disabled:All the messages will be dropped in the case of choosing true.
DataRateChannel: Two more parameters are added to DelayChannel to specify
the data rate and error in the channel:
• ber and per: BER (bit error rate) and PER (Packet error rate) in the
range [0, 1].
• datarate: channel bandwidth in bits per second (bps).
The syntax for channel de�nition is described in the below example:
channel ChannelName
// Optional declaration of attributes can be shown here.
Parameterizing the pre-de�ned channel type:
channel ChannelName extends ned.DataRateChannel
{
datarate = 50 Mbps;
ber = 1e�10;
delay = 50 us;
}
Simple Module De�nition
Simple module is the basic unit which contains the network behavior. In the other
hand, simple modules are the active elements creating the compound modules. The
de�nition of simple module in the NED consists of parameter and gate declarations.
An illustrative example in the below presents the simple module de�nition in the
NED:
simple SimpleModuleName
{
parameters:
// Declare the simple module variables here.
gates:
// Declare in, out and inout gates here.
}

5. SIMULATOR DESCRIPTION AND SETTINGS 47
Compound Module De�nition
Compound modules consist of more than one submodule. These submodules can
be simple modules or other compound modules. The most important duty of the
compound modules are their �exibility to built the simulation model to be organized
and structured, however, the compound modules have no active behavior as simple
modules. The de�nition of the compound modules is the same as the simple modules.
The de�nition of the compound modules is presented in the following. As the
�gure shows, compound modules have two extra sections including: submodules
and connections:
module CompoundModule
{ types:
// Declare any channel and module types which are used locally by
// the compound module.
parameters:
// Declare the compound module variables here.
gates:
// Declare in, out and inout gates here.
submodules:
// De�ne the submodules here which the compound module is consisted of.
connections:
// De�ne the connections between all the gates here.
}
In the below, the syntax of submodule de�nition is presented in more details:
module CompoundModule
{
submodules:
submodule1: ModuleType1 {
// De�ne the submodule here .
...
}
submodule2: ModuleType2 {
// De�ne the submodule here.
...
}
}
Furthermore, the connections determine the topology of the gates of the com-
pound module and the gates of its submodules which are connected to. In the
following, the de�nition of connections are elaborated in more details:

5. SIMULATOR DESCRIPTION AND SETTINGS 48
module CompoundModule
{
submodules:
connections:
// Connect output gate with −− >
nodeA.output −− > nodeB.input
// Connect input gate with < −−nodeA.input < −− nodeB.output
// Connect inout gate with < −− >
nodeA.inout < −− > nodeB.inout
Network De�nition
The network de�nition is necessary to obtain a simulation model which has the
executable capability. The network can be instantiated from previously de�ned
compound module. The following example presents the syntax of the network de�-
nition:
network network extend CompoundModuleTypeA
{
parameters:
// Add some parameters
....
}
5.1.5 Simple Module
Simple modules are the active element in the OMNeT++ in which events occur. The
simple modules types are sub-classed from the cSimpleModule of the OMNeT++
class library. The cSimpleModule has several virtual functions required to be rede-
�ned by the user to implement the model behavior.
One of the virtual functions is handleMessage which is called whenever the kernel
simulation receives a message. In fact, the handleMessage is called for every message
received by the kernel simulation and the elapsed simulation time during a call to
the handleMessage is zero.
The simple modules have a method for the future schedules or timers. The simple
simple modules keep themselves busy by sending and receiving a message. Therefore,
whenever a module has a future schedule it sends a message to itself. Such a message
is called self message. Some of the useful virtual functions are shown in Table 5.1.

5. SIMULATOR DESCRIPTION AND SETTINGS 49
Table 5.1: Send functinons supported by OMNeT++.
Function Descriptionsend(..) To send a message through an output gate.sendDelayed(..) To send a message through an output gate after a determined
delay.sendDirect(..) To send a message to a remote destination module without of
using any gates or connections.scheduleAt(..) To send a self message.
5.1.6 Compound Module
Compound modules comprises of the sub-modules including simple modules and
other compound modules. This modules have no active behavior compared to the
simple modules. In addition, the compound modules behave like a black box which
relay messages by the gates. More details about compound module de�nition in
NED language are addressed in section 5.1.4.
5.1.7 Gates and Connections
Two modules are connected via a pair of gates. The gates have three types: input,
output, and inout. Since OMNeT++ only supports one way communication, there-
fore, for each module should be de�ned an inout gate or an input and output gate
in order to send and receive a message.
The gate de�nition is a trivial task by listing their name in the gates section
of module de�nition. In addition, the de�nition of a vector gate which contains a
number of single gates allowed by the OMNeT++. A connection is created between
starting point (output gate of the source module) and the ending point (input gate
of the destination module).
5.1.8 Messages
Messages are the essential concept of the OMNeT++ since each model needs a mes-
sage or packet to communicate between its modules. In OMNeT++, messages are
derived from cMessage class which represent events, packets, commands, frames,
bits, and etc depending on the model domain. One important function which oc-
curs in the message objects is the encapsulation and decapsulation of the packets.
By applying two functions named: encapsulate() and decapsulate(), the above men-
tioned functions can be accomplished. The message �les have .msg extension and
the de�nition of a message can be represent as below:

5. SIMULATOR DESCRIPTION AND SETTINGS 50
message MyMessage
{
int srcAddress;
int destAddress;
int remainingHops= 30
}
5.2 Model Description and Settings
In this work, physical and MAC layer of slotted IEEE 802.15.4 standard is modeled
and simulated with OMNeT++. The physical and MAC layers of the standard are
described in IEEE 802.15.4 speci�cations. In the following, simulation environment
and scenario in addition to settings of the system-level simulator are discussed in
more details.
5.2.1 Simulation Environment
As it mentioned earlier, slotted version of the IEEE 802.15.4 is modeled in this work.
The simulated network is star topology meaning that mesh topology and cluster-
tree topology are not supported. In star network, STAs send the packets directly to
AP without intermediate nodes. It means that, packets arrive to AP in single hop
manner. Multi-hop transmission is not addressed here. It is worth mentioning that
most M2M and IoT applications will utilize the single hop transmissions. Single
hop transmission is superior to multi-hop transmissions in terms of transmission
reliability. In addition, single hop transmission imposes less delay than multi-hop
transmissions which is very critical in delay sensitive applications.
IEEE 802.15.4 MAC and Physical layer are the main modules which are imple-
mented and modeled. PHY layer implements the following functions:
• Radio implemented in two models: First of all, the three-switch-state model
(receiver-on, transmitter-on, turno�) which facilitates the implementation of
MAC-PHY primitives. Second, the four-work-state model (idle, sleep, receiv-
ing, and transmitting) in order to perform the energy measurement and carrier
sensing tasks.
• Receive and transmission of packets with detection of collision.
• Energy Detection (ED) and Clear channel access function (CCA).
• Implementation of ideal and lossy channel.
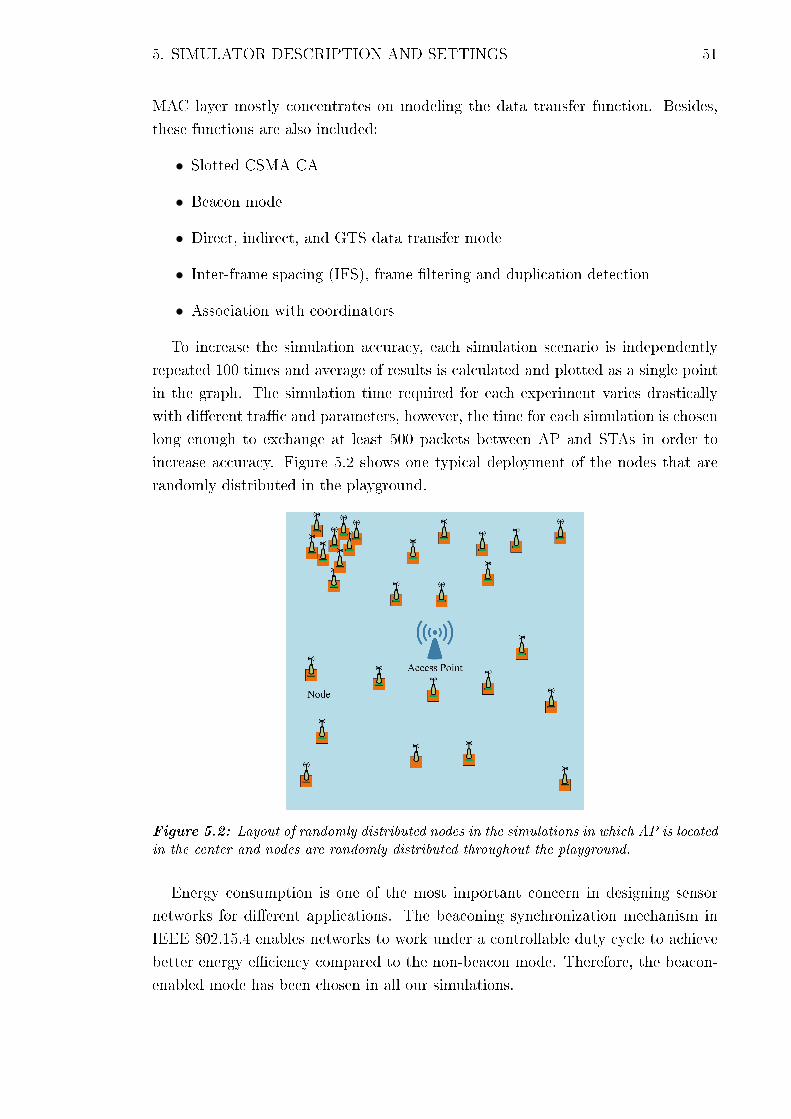
5. SIMULATOR DESCRIPTION AND SETTINGS 51
MAC layer mostly concentrates on modeling the data transfer function. Besides,
these functions are also included:
• Slotted CSMA-CA
• Beacon mode
• Direct, indirect, and GTS data transfer mode
• Inter-frame spacing (IFS), frame �ltering and duplication detection
• Association with coordinators
To increase the simulation accuracy, each simulation scenario is independently
repeated 100 times and average of results is calculated and plotted as a single point
in the graph. The simulation time required for each experiment varies drastically
with di�erent tra�c and parameters, however, the time for each simulation is chosen
long enough to exchange at least 500 packets between AP and STAs in order to
increase accuracy. Figure 5.2 shows one typical deployment of the nodes that are
randomly distributed in the playground.
Figure 5.2: Layout of randomly distributed nodes in the simulations in which AP is locatedin the center and nodes are randomly distributed throughout the playground.
Energy consumption is one of the most important concern in designing sensor
networks for di�erent applications. The beaconing synchronization mechanism in
IEEE 802.15.4 enables networks to work under a controllable duty cycle to achieve
better energy e�ciency compared to the non-beacon mode. Therefore, the beacon-
enabled mode has been chosen in all our simulations.
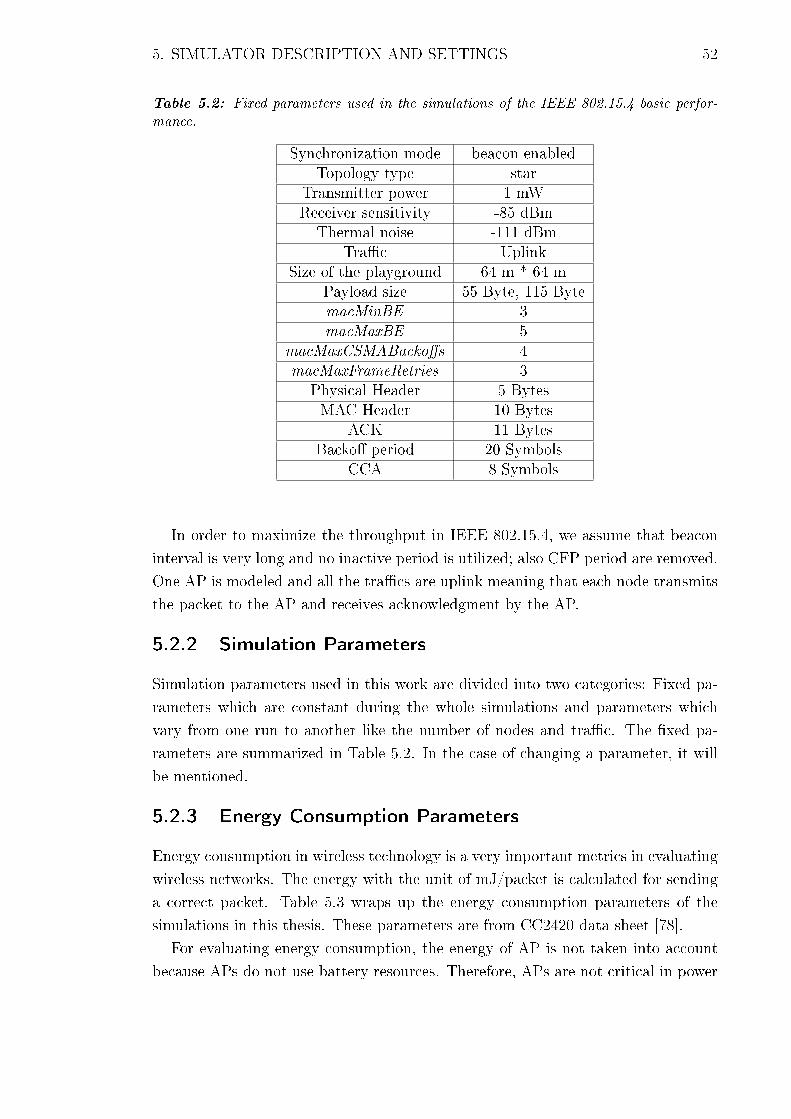
5. SIMULATOR DESCRIPTION AND SETTINGS 52
Table 5.2: Fixed parameters used in the simulations of the IEEE 802.15.4 basic perfor-mance.
Synchronization mode beacon-enabledTopology type star
Transmitter power 1 mWReceiver sensitivity -85 dBm
Thermal noise -111 dBmTra�c Uplink
Size of the playground 64 m * 64 mPayload size 55 Byte, 115 BytemacMinBE 3macMaxBE 5
macMaxCSMABacko�s 4macMaxFrameRetries 3
Physical Header 5 BytesMAC Header 10 Bytes
ACK 11 BytesBacko� period 20 Symbols
CCA 8 Symbols
In order to maximize the throughput in IEEE 802.15.4, we assume that beacon
interval is very long and no inactive period is utilized; also CFP period are removed.
One AP is modeled and all the tra�cs are uplink meaning that each node transmits
the packet to the AP and receives acknowledgment by the AP.
5.2.2 Simulation Parameters
Simulation parameters used in this work are divided into two categories: Fixed pa-
rameters which are constant during the whole simulations and parameters which
vary from one run to another like the number of nodes and tra�c. The �xed pa-
rameters are summarized in Table 5.2. In the case of changing a parameter, it will
be mentioned.
5.2.3 Energy Consumption Parameters
Energy consumption in wireless technology is a very important metrics in evaluating
wireless networks. The energy with the unit of mJ/packet is calculated for sending
a correct packet. Table 5.3 wraps up the energy consumption parameters of the
simulations in this thesis. These parameters are from CC2420 data sheet [78].
For evaluating energy consumption, the energy of AP is not taken into account
because APs do not use battery resources. Therefore, APs are not critical in power
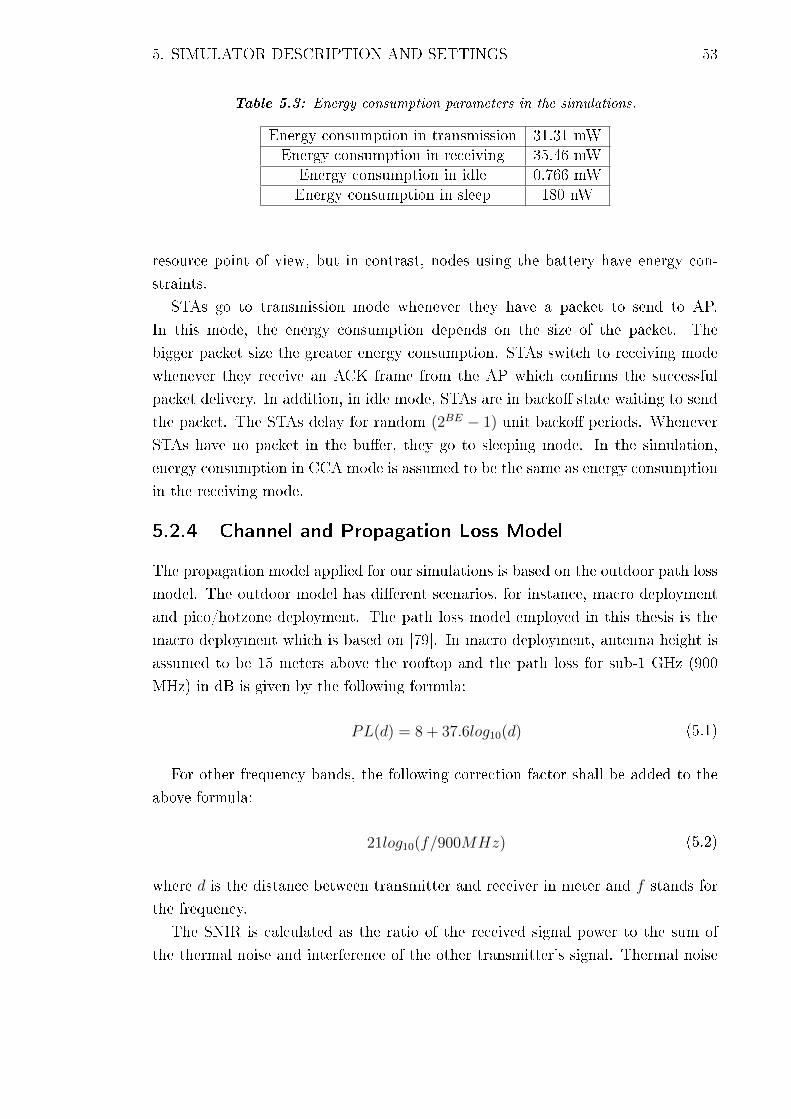
5. SIMULATOR DESCRIPTION AND SETTINGS 53
Table 5.3: Energy consumption parameters in the simulations.
Energy consumption in transmission 31.31 mWEnergy consumption in receiving 35.46 mW
Energy consumption in idle 0.766 mWEnergy consumption in sleep 180 nW
resource point of view, but in contrast, nodes using the battery have energy con-
straints.
STAs go to transmission mode whenever they have a packet to send to AP.
In this mode, the energy consumption depends on the size of the packet. The
bigger packet size the greater energy consumption. STAs switch to receiving mode
whenever they receive an ACK frame from the AP which con�rms the successful
packet delivery. In addition, in idle mode, STAs are in backo� state waiting to send
the packet. The STAs delay for random (2BE − 1) unit backo� periods. Whenever
STAs have no packet in the bu�er, they go to sleeping mode. In the simulation,
energy consumption in CCA mode is assumed to be the same as energy consumption
in the receiving mode.
5.2.4 Channel and Propagation Loss Model
The propagation model applied for our simulations is based on the outdoor path loss
model. The outdoor model has di�erent scenarios, for instance, macro deployment
and pico/hotzone deployment. The path loss model employed in this thesis is the
macro deployment which is based on [79]. In macro deployment, antenna height is
assumed to be 15 meters above the rooftop and the path loss for sub-1 GHz (900
MHz) in dB is given by the following formula:
PL(d) = 8 + 37.6log10(d) (5.1)
For other frequency bands, the following correction factor shall be added to the
above formula:
21log10(f/900MHz) (5.2)
where d is the distance between transmitter and receiver in meter and f stands for
the frequency.
The SNIR is calculated as the ratio of the received signal power to the sum of
the thermal noise and interference of the other transmitter's signal. Thermal noise

5. SIMULATOR DESCRIPTION AND SETTINGS 54
is calculated based on this equation:
P = KTB (5.3)
where K refers to Boltzmann's constant, T is the temperature in Kelvin, and B
stands for the bandwidth.
SNIR can have di�erent values during receiving the packet because a packet
can experience di�erent interferences from other ongoing packet transmissions. For
calculating the SNIR in our model, we take into consideration the minimum SNIR
during receiving the packet. Figure 5.3 presents how the SNIR is calculated in
simulator. As �gure shows, the received packet A in the AP has di�erent SNIRs
in time-lines a, b, c, and d. The smallest SNIR is calculated as the SNIR for
this packet. In addition, AP (receiver) calculates the SNIR values for packet B and
packet C which receive after packet A. The AP detects the packet with higher SNIR.
For instance, during detection packet A, if the packet B would be stronger than A
then AP will neglect packet A and switch to packet B and vice versa.
Based on the IEEE 802.15.4 standard, the SNIR is related to bit error rate (BER)
for the OQPSK modulation in 2.4 GHz frequency band as following:
BER =8
15× 1
16×
16∑k=2
−1k(16
k
)e
(20×SNIR×
(1k−1))
(5.4)
BER for the BPSK in 915 MHz and 868 MHz frequency bands is given by the
formula:
BER = 0.5× exp(−11.25× SNIR) (5.5)
On the other hand, packet error rate (PER) for a packet with length of N bits is
related to BER as following:
PER = 1− (1−BER)N (5.6)
5.2.5 Simulation Scenarios
Two main scenarios are studied in this work: ideal channel and lossy channel. Ideal
channel has no degradation of transmitted signal power when traveling through the
medium. It means that ideal channel does not utilize any path loss model. In
other word, the received power in the receiver is equal to transmit power in the

5. SIMULATOR DESCRIPTION AND SETTINGS 55
Figure 5.3: SINR calculation of a received packet taking into account the interferencecaused by neighboring nodes.
transmitter. In this scenario, hidden node problem does not exist and each node
can hear other nodes in the network.
In lossy channel, the transmission power is faded due to path loss. The path loss
can be calculated from a propagation model. In this thesis, the outdoor scenario
with macro deployment has been considered.
Each channel scenario is simulated with two di�erent tra�c: saturated tra�c (or
full-bu�er tra�c) and non-saturated tra�c. Saturated tra�c means that each node
always has a packet to send. In non-saturated tra�c, nodes generate the packets
with the inter arrival time of 100 ms. The �rst packet for the nodes is generated
with random starting time.
In addition to above mentioned scenarios, the simulations are repeated in three
di�erent frequency bands. Based on the IEEE 802.15.4 standard [17], these frequen-
cies are:
• 868 - 868.6 MHz (in Europe)
• 902 - 928 MHz (in North America)
• 2400 - 2483.5 MHz (worldwide)

5. SIMULATOR DESCRIPTION AND SETTINGS 56
Many literatures, e.g, [6],[7], [8],[9], simulated and evaluated IEEE 802.15.4 stan-
dard in 2.4 GHz but in this work, simulations are performed in all frequency bands
de�ned by the IEEE 802.15.4 standard.

6. SIMULATION PERFORMANCE 57
6. SIMULATION PERFORMANCE
The simulation performance of the IEEE 802.15.4 standard, which ZigBee technol-
ogy uses in its MAC and PHY layers, is comprehensively evaluated in this work.
In the literature, this standard is generally investigated in the 2.4 GHz band. This
band is world-widely allocated for this technology and most countries employ 2.4GHz
frequency. However, other frequency bands exist including 868 MHz allocated in Eu-
rope and 915 MHz used in North America. So far, not many works have been carried
out in those bands. On the other hand, the new emerging technology like IoT and
M2M technologies and demanding requirements such as longer range transmission
and coverage pushes the frequency bands to sub-1 GHZ. The simulations are per-
formed in three aforementioned bands in terms of the network throughput, energy
consumption, and delay. Furthermore, the performance of slotted IEEE 802.15.4
is compared with IEEE 802.11ah [80], [81]. These comparisons are including the
network throughput and energy consumption.
6.1 Simulator Calibration
The entire simulations in this work are accomplished by the OMNeT++. To cali-
brate our simulator, we compared our simulation results with the analytical model
in [82]. The comparison is based on the network throughput in saturated tra�c.
Two di�erent payloads of 55 bytes and 115 bytes are taken into account. In addi-
tion, default parameter value de�ned for 2.4 GHz frequency channel are considered.
Table 6.1 shows the common settings for the calibration.
As Figure 6.1 shows, the simulation results are very closely following the ana-
Table 6.1: The settings for the simulator calibration.
packet payload 55 or 115 bytes
Overhead 15 bytes
ACK length 11 bytes
Channel bit rate 250 kbps
Propagation Delay 0
Backo� unit 10 bytes
CCA time 4 byte

6. SIMULATION PERFORMANCE 58
lytical model. It means that the employed simulator is reliable for the rest of the
simulations.
5 10 15 20 25 30 35 400.05
0.1
0.15
0.2
0.25
0.3
0.35
0.4
0.45
0.5
Number of Nodes
Nor
mal
aize
d T
hrou
ghpu
t
Payload= 55 B, Throughput, AnalysisPayload= 55 B, Throughput, SimulationPayload= 115 B, Throughput, AnalysisPayload= 115 B, Throughput, Simulation
Figure 6.1: Saturation throughput for validating the simulator.
6.2 Network Throughput
The throughput is one of the most important metrics to evaluate the network per-
formance. It is de�ned as the average rate of data packets successfully received at
destination node or AP. In other words, throughput provides the ratio of channel
capacity used for the successful transmission. The throughput is divided into two
main sections of ideal channel and lossy channel. No power degradation exists in
ideal channel and each node can hear any other nodes in the vicinity. However,
transmission power attenuates in lossy channel due to path loss and other channel
impairments. The throughputs are further evaluated in saturated and unsaturated
5 10 15 20 25 30 35 40 45 500
0.1
0.2
0.3
0.4
0.5
0.6
0.7
Number of Nodes
Nor
mal
aize
d T
hrou
ghpu
t
Lossy channel, Payload = 115 BLossy channel, Payload = 55 BIdeal channel, Payload = 115 BIdeal channel, Payload = 55 B
(a) Normalized throughput in saturated tra�c.
5 10 15 20 25 30 35 40 45 5020
40
60
80
100
120
140
160
Number of Nodes
Thr
ough
put K
b/s
Lossy channel, Payload = 115 BLossy channel, Payload = 55 BIdeal channel, Pyload = 115 BIdeal channel, Payload = 55 B
(b) Throughput in low tra�c.
Figure 6.2: The Network throughput of the IEEE 802.15.4 slotted CSMA/CA in the 2.4GHz frequency band in ideal and lossy channels with saturated and low tra�cs.
tra�c. To �nd the maximum throughput in each scenario, the saturated tra�c is
employed. This gives the asymptotic capacity of the MAC layer. On the other hand,

6. SIMULATION PERFORMANCE 59
in IoT and M2M use cases, the tra�c is generally not saturated. Hence, the unsatu-
rated tra�c is studied by assuming that the packet are generated following a Poisson
distribution with an inter-arrival time of 100 ms. It is worth mentioning that nor-
malized throughput is used to study saturated tra�cs. The normalized throughput
is obtained by dividing the normal throughput by data rate. This metric shows how
much of the datarate is used by the entire network to deliver the packets to AP. The
normalized throughput is not a fair metrics to be utilized in the unsaturated tra�c
case.
Figure 6.2 presents the network throughput in the 2.4 GHz frequency band with
datarate of 250 kbps. The network throughput is shown in two sub-�gures. The
normalized throughput in saturated tra�c is presented in Figure 6.2(a) and nor-
mal throughput in unsaturated tra�c is shown in Figure 6.2(b). As �gures show,
1 6 11 16 21 26 31 36 41 46 500
500
1000
1500
2000
2500
Node
Num
ber
of s
ent p
acke
ts
Figure 6.3: Number of sent packets successfully received by AP in non-ideal channel andsaturated tra�c (Network with 50 nodes).
throughputs drastically decrease when the number of nodes increases in ideal chan-
nel scenario in both saturated and unsaturated tra�cs. When the number of nodes
increases and since all of them try to get access the medium, collision increases.
The higher rate of collision drops the rate of successful transmission, therefore, the
throughput drops down. As it obvious from the �gures, the bigger the packet size
the higher throughput. This pattern occurs for both ideal and lossy channel cases
and both saturated and unsaturated tra�cs.
The non-ideal channel has higher throughput than ideal channel in both saturated
and unsaturated tra�c. The reduction rate of the throughput in non-ideal channel
is much less than ideal channel specially in unsaturated tra�c. The reason is that
the closer nodes to AP have higher probability to obtain channel access because they
present higher SNR. This fact will increase the network throughput but in scarifying
the network fairness. The fairness measure is calculated by Raj Jain's equation:

6. SIMULATION PERFORMANCE 60
F (x1, x2, ..., xn) =(∑n
n=1 xi)2
n.∑n
n=1 x2i
(6.1)
where n is the number of the nodes and xi is the throughput of the ith node. The
fairness is alternating between the range of 1/n to 1. 1/n is the worst case of the
fairness and 1 is the best case in which each node obtains the same throughput. For
instance, the fairness measure in the case of a network with 50 nodes and non-ideal
channel and saturated tra�c is 0.4023. Figure 6.3 shows the number of sent packets
for each node. The �gure reveals that some of the nodes ,which are far from AP,
get less opportunity to access channel.
5 10 15 20 25 30 35 40 45 500
0.1
0.2
0.3
0.4
0.5
0.6
0.7
0.8
Number of Nodes
Nor
mal
aize
d T
hrou
ghpu
t
Lossy channel, Payload = 115 BLossy channel, payload = 55 BIdeal channel, Payload = 115 BIdeal channel, Payload = 55 B
(a) Normalized throughput in saturated tra�c.
5 10 15 20 25 30 35 40 45 5012
14
16
18
20
22
24
26
28
30
Number of Nodes
Thr
ough
put K
b/s
Lossy channel, Payload = 115 BLossy channel, Payload = 55 BIdeal channel, payload = 115 BIdeal channel, Payload = 55 B
(b) Throughput in low tra�c.
Figure 6.4: The Network throughput of the IEEE 802.15.4 slotted CSMA/CA in the 915MHz frequency band in ideal and lossy channels with saturated and low tra�cs.
Based on the standard [17], the IEEE 802.15.4 operates in three main frequency
bands: 2.4 GHz, 915 MHz, and 868 MHz. Many works has been done in 2.4 GHz
with 250 kbps datarate but there is not many works in two other frequency bands.
On the other hand, the sub-1 GHz band is an interesting frequency band for IoT
and M2M applications due to longer range of transmission. These issues are a
motivation to conduct the simulations in 915 MHz and 868 MHz frequency bands
with datarate of 40 kbps and 20 kbps, respectively. The throughput results of these
bands are shown in Figure 6.4 and 6.5. As the �gures show, the throughputs change
in the same pattern for these bands. The throughputs in the lossy channel are
better than ideal channel in both bands. The rate of reduction of throughput in
the ideal channel is sever like the 2.4 GHz frequency band. However, comparison
between these sub-1 GHz bands with the 2.4 GHz band reveals one important fact
that channel utilization in the sub-1 GHz band is higher than the 2.4 GHz band. It
can be seen from comparing the normalized throughput in the saturated tra�c in
aforementioned bands.

6. SIMULATION PERFORMANCE 61
5 10 15 20 25 30 35 40 45 500
0.1
0.2
0.3
0.4
0.5
0.6
0.7
0.8
Number of Nodes
Nor
mal
aize
d T
hrou
ghpu
t
Lossy channel, Payload = 115 BLossy channel, Payload = 55 BIdeal channel, Payload = 115 BIdeal channel, Payload = 55 B
(a) Normalized throughput in saturated tra�c.
5 10 15 20 25 30 35 40 45 502
4
6
8
10
12
14
16
Number of Nodes
Thr
ough
put K
b/s
Lossy channel, Payload = 115 BLossy channel, Payload = 55 BIdeal channel, Payload = 115 BIdeal channel, Payload = 55 B
(b) Throughput in low tra�c.
Figure 6.5: The Network throughput of the IEEE 802.15.4 slotted CSMA/CA in the 868MHz frequency band in ideal and lossy channels with saturated and low tra�cs.
The throughput comparison between IEEE 802.15.4 and IEEE 802.11ah is pre-
sented in Figure 6.6 in both ideal and non-ideal channel scenarios. In order to have
a fair comparison, the payload size of 256 bytes is chosen for both standards and
only uplink tra�c is taken into account. More details about the simulation setting
can be found in [83].
The normalized throughput of two standards in saturated tra�c (shown in Figure
6.6(a)) is roughly same for the small number of nodes, however it rapidly drops when
the number of nodes is increasing. The rate of the reduction for the IEEE 802.15.4 is
more severe compared to the IEEE 802.11ah. Since this �gure shows the throughput
normalized by the data rate (250 kbps for IEEE 802.15.4 and 0.65 Mbps for IEEE
802.11ah), the di�erence between two standard is not very sensible. The result for
the low tra�c in ideal channel is shown in Figure 6.6(b). Throughputs of both
standards increases when the number of nodes grows, then it again reduces after
the number of nodes reaches to 15 nodes for saturated case and 20 nodes for non-
5 10 15 20 25 30 35 40 45 500
0.1
0.2
0.3
0.4
0.5
0.6
0.7
0.8
Number of Nodes
Nor
mal
ized
Thr
ough
put
IEEE 802.11ah, Lossy channelIEEE 802.15.4, Lossy channelIEEE 802.11ah, Ideal channelIEEE 802.15.4, Ideal channel
(a) Normalized throughput in saturated tra�c.
5 10 15 20 25 30 35 40 45 500.05
0.1
0.15
0.2
0.25
0.3
0.35
0.4
0.45
Number of Nodes
Thr
ough
put (
Mbp
s)
IEEE 802.11ah, Lossy channelIEEE 802.15.4, Lossy channelIEEE 802.11ah, Ideal channelIEEE 802.15.4, Ideal channel
(b) Throughput in low tra�c.
Figure 6.6: The throughput comparison between IEEE 802.11ah and IEEE 802.15.4 inideal and non-ideal channel with two di�erent tra�cs: Saturated and non-saturated.

6. SIMULATION PERFORMANCE 62
saturated case. As a result, in a very high number of nodes case, IEEE 802.11ah has
better throughput compared to IEEE 802.15.4. The IEEE 802.11ah in lossy channel
has better performance specially for congested network.
6.3 Energy Consumption
Energy e�ciency is an important factor which recently has drawn many attentions
in industry specially in wireless communications. The high number of nodes from
one hand and smaller size of the future devices from other hand, encourages the new
5 10 15 20 25 30 35 40 45 5010
0
101
102
103
Number of Nodes
Ene
rgy
cons
umpt
ion
(uJ/
byte
)
Ideal channel, Saturated traffic, Payload = 115 BIdeal channel, Saturated traffic, Payload = 55 BIdeal channel, Low traffic, Payload = 115 BIdeal channel, Low traffic, Payload = 55 B
(a) Energy consumption to send one byte in idealchannel.
5 10 15 20 25 30 35 40 45 5010
−1
100
101
102
Number of Nodes
Ene
rgy
cons
umpt
ion
(uJ/
byte
)
Lossy channel, Saturated traffic, Payload = 115 BLossy channel, Saturated traffic, Payload = 55 BLossy channel, Low traffic, Payload = 115 BLossy channel, Low traffic, Payload = 55 B
(b) Energy consumption to send one byte inLossy channel.
Figure 6.7: The Average energy consumption (per byte) of the IEEE 802.15.4 slottedCSMA/CA in the 2.4 GHz frequency band in ideal and lossy channel with saturated andlow tra�c.
standards to be more energy e�cient. In order to investigate energy consumption
in this work, the energy consumption of the whole network are taken into account
excluding AP. Since AP is using unlimited source of energy, then energy e�ciency
is not very critical in APs. The energy consumption is determined by the consumed
power of the entire network to send a successful byte to the destination.
The energy consumption of the IEEE 802.15.4 in 2.4 GHz frequency band in
ideal channel is shown in Figure 6.7(a). The energy consumption to send one byte
to destination increases as the number of nodes increases. The increase occurs in
both saturated and non-saturated tra�c, however, the rate of increment in saturated
tra�c is much higher than the unsaturated one. The reason is obviously because
of the collision growth in the congested network. The �gure reveals another fact
regarding energy consumption of the network. The energy e�ciency when using
larger packet sizes is higher than in small packet size cases. In other words, packets
with larger size consumes less energy to send one byte rather than packets with
smaller size.
Figure 6.7(b) presents the energy consumption in non-ideal channel operated in
2.4 GHz frequency band. The energy e�ciency in lossy channel outperforms the ideal

6. SIMULATION PERFORMANCE 63
channel in both saturated and low tra�c scenarios. One explanation is the higher
throughput in non-ideal channel. This means less collision, therefore, less power
consumption. As Figure 6.7(b) shows, larger packets are more energy e�cient in
saturated tra�cs rather than lower tra�cs but in the case of smaller packets, it acts
vice versa.
5 10 15 20 25 30 35 40 45 5010
−3
10−2
10−1
100
101
102
103
Number of Nodes
Ene
rgy
cons
umpt
ion
(uJ/
byte
)
Ideal channel, Saturated traffic, Payload = 115 BIdeal channel, Saturated traffic, Payload = 55Ideal channel, Low traffic, Payload = 115 BIdeal channel, Low traffic, Payload = 55 B
(a) Energy consumption to send one byte in idealchannel.
5 10 15 20 25 30 35 40 45 5010
−2
10−1
100
101
102
Number of Nodes
Ene
rgy
cons
umpt
ion
(uJ/
byte
)
Lossy channel, Saturated traffic, Payload = 115 BLossy channel, Saturated traffic, Payload = 55 BLossy channel, Low traffic, Payload = 115 BLossy channel, Low traffic, Payload = 55 B
(b) Energy consumption to send one byte in Lossychannel.
Figure 6.8: The Average energy consumption (per byte) of the IEEE 802.15.4 slottedCSMA/CA in the 915 MHz frequency band in ideal and lossy channel with saturated andlow tra�c.
5 10 15 20 25 30 35 40 45 5010
−2
10−1
100
101
102
103
Number of Nodes
Ene
rgy
cons
umpt
ion
(uJ/
byte
)
Ideal channel, Saturated traffic, Payload = 115 BIdeal channel, Saturated traffic, Payload = 55 BIdeal channel, Low traffic, Payload = 115 BIdeal channel, Low traffic, Payload = 55 B
(a) Energy consumption to send one byte in idealchannel.
5 10 15 20 25 30 35 40 45 5010
−2
10−1
100
101
102
103
Number of Nodes
Ene
rgy
cons
umpt
ion
(uJ/
byte
)
Lossy channel, Saturated traffic, Payload = 115 BLossy channel, Saturated traffic, Payload = 55 BLossy channel, Low traffic, Payload = 115 BLossy channel, Low traffic, Payload = 55 B
(b) Energy consumption to send one byte in Lossychannel.
Figure 6.9: The Average energy consumption (per byte) of the IEEE 802.15.4 slottedCSMA/CA in the 868 MHz frequency band in ideal and lossy channel with saturated andlow tra�c.
The energy consumption of the IEEE 802.15.4 operated in 915 MHz and 868 MHz
are presented in Figure 6.8 and 6.9. It is assumed the same energy consumption
parameters in the above mentioned frequency bands. It is obvious from the �gures
that in sub-1 GHz more energy is consumed to send one byte to destination compared
to 2.4 GHz band. Since the datarate of the 915 MHz and 868 MHz are 40 kbps and
20 kbps ,respectively. Sending one byte of payload is more time consuming than 2.4

6. SIMULATION PERFORMANCE 64
Table 6.2: The common setting for the IEEE 802.11ah and IEEE 802.15.4 comparison.
Thermal noise -111 dBm
Energy consumption in Transmission 255 mW
Energy consumption in receiving and channel sensing 135 mW
Energy consumption in idle 1 mW
Size of the payload 256 Bytes
Size of the playground 156 m * 156 m
GHz band. However, this results are concluded from the assumption that all bands
use the same power consumption parameters.
5 10 15 20 25 30 35 40 45 500
20
40
60
80
100
120
Number of Nodes
Ave
rage
Ene
rgy
Con
sum
ptio
n to
sen
d a
pack
et (
mJ/
pack
et)
IEEE 802.11ah, Ideal channel, Saturated trafficIEEE 802.15.4, Ideal channel, Saturated trafficIEEE 802.11ah, Ideal channel, Low trafficIEEE 802.15.4, Ideal channel, Low traffic
(a) Average energy consumption to send a packetin ideal channel.
5 10 15 20 25 30 35 40 45 500
5
10
15
20
25
30
35
40
45
Number of Nodes
Ave
rage
Ene
rgy
Con
sum
ptio
n to
sen
d a
pack
et (
mJ/
pack
et)
IEEE 802.11ah, Lossy channel, Saturated trafficIEEE 802.15.4, Lossy channel, Saturated trafficIEEE 802.11ah, Lossy channel, Low trafficIEEE 802.15.4, Lossy channel, Low traffic
(b) Average energy consumption to send a packetin Lossy channel.
Figure 6.10: The energy consumption comparison between IEEE 802.11ah and IEEE802.15.4 in ideal and non-ideal channel with two di�erent tra�cs: Saturated and non-saturated.
Finally, the energy consumption comparison between IEEE 802.15.4 and IEEE
802.11ah is studied in sub-1 GHz in both ideal and non-ideal channel. The common
parameters of the simulation are summarized in Table 6.2. More details about the
comparison settings can be found in [83].
Figures 6.10(a) presents the energy consumption in mJ to send a successful packet
in ideal channel. Energy consumption of IEEE 802.11ah in saturated tra�c is
slightly greater than IEEE 80.15.4 for the number of nodes smaller than 40, But
it is decreasing when the number of the nodes are increasing. However, the energy
consumption in low tra�c behaves di�erently. The IEEE 802.11ah has a slightly
smaller energy consumption for number of nodes less than 17 but after that energy
consumption is drastically increasing in comparison to the IEEE 802.15.4.
In non-ideal channel, the performance of the IEEE 802.15.4 for high number of
nodes is better than IEEE 802.11ah in term of energy consumption. As shown in
Figure 6.10(b), IEEE 802.15.4 consumes less energy to send a successful packet in

6. SIMULATION PERFORMANCE 65
saturated tra�c. It means that this standard is more energy e�cient compared to
IEEE 802.11ah in this scenario with the above mentioned settings. Figure 6.10(b)
also shows the energy consumption in low tra�c which indicates better performance
of the IEEE 802.15.4 for higher number of nodes. In this scenario, IEEE 802.11ah
consumes less energy to send a successful packet.
6.4 Average End-to-end Delay
5 10 15 20 25 30 35 40 45 506
8
10
12
14
16
18
20
22
Number of Nodes
End
to e
nd d
elay
(m
s)
Ideal channel, saturated traffic, Payload = 115 BIdeal channel, saturated traffic, Payload = 55 BIdeal channel, low traffic, Payload = 115 BIdeal channel, low traffic, Payload = 55 B
(a) End-to-end delay in ideal channel.
5 10 15 20 25 30 35 40 45 506
8
10
12
14
16
18
Number of Nodes
End
to e
nd d
elay
(m
s)
Lossy channel, saturated traffic, Payload = 115 BLossy channel, saturated traffic, Payload = 55 BLossy channel, low traffic, Payload = 115 BLossy channel, low traffic, Payload = 55 B
(b) End-to-end delay in Lossy channel.
Figure 6.11: End-to-end delay of the IEEE 802.15.4 slotted CSMA/CA in the 2.4 GHzfrequency band in ideal and lossy channel with saturated and low tra�c.
Average end-to-end delay is an important metric to evaluate the networks. This
becomes more interesting in the delay sensitive applications. There are wide range of
applications such as VOIP which are sensitive to delay. End-to-end delay is de�ned
as the time taken to deliver a packet from source node to the destination node. The
delay metric comprises of the following delays: transfer time, queuing, propagation
delay, and processing time. In other words, it is de�ned as the spending time for
a packet to travel across a network from source node to destination node which
contains all potential delays during propagation delay, processing time, transfer
times and delays of retransmission at the MAC layer.
We calculate end-to-end delay in our simulations by the time di�erence between
the creation time of the packet in the application layer of the source node and
the time of receiving the Acknowledgment packet of the currently delivered packet.
Figure 6.11 present the average end-to-end delay of the IEEE 802.15.4 standard
operated in 2.4 GHz band. The �gure itself is divided in two sub-�gures showing
the results for ideal and non-ideal channel. Delay intuitively increase as the number
of nodes in the network increases. The �gures also reveal that end-to-end delay
increase by using the larger packets to send. For instance, delay starts from 16 ms
for the packet with 115 bytes size in the saturated tra�c and ends to 20 ms. But in
the case of 55 bytes payload, it starts from 14 ms and continues till 21 ms. On the
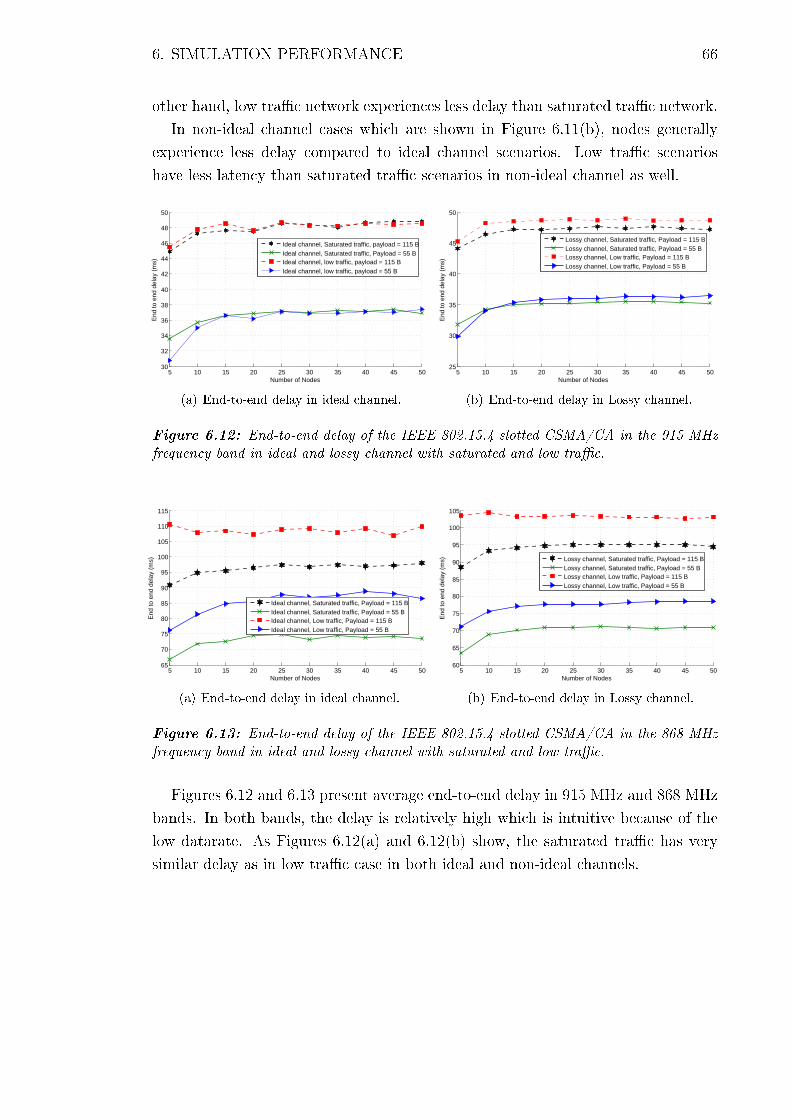
6. SIMULATION PERFORMANCE 66
other hand, low tra�c network experiences less delay than saturated tra�c network.
In non-ideal channel cases which are shown in Figure 6.11(b), nodes generally
experience less delay compared to ideal channel scenarios. Low tra�c scenarios
have less latency than saturated tra�c scenarios in non-ideal channel as well.
5 10 15 20 25 30 35 40 45 5030
32
34
36
38
40
42
44
46
48
50
Number of Nodes
End
to e
nd d
elay
(m
s)
Ideal channel, Saturated traffic, payload = 115 BIdeal channel, Saturated traffic, Payload = 55 BIdeal channel, low traffic, payload = 115 BIdeal channel, low traffic, payload = 55 B
(a) End-to-end delay in ideal channel.
5 10 15 20 25 30 35 40 45 5025
30
35
40
45
50
Number of Nodes
End
to e
nd d
elay
(m
s)
Lossy channel, Saturated traffic, Payload = 115 BLossy channel, Saturated traffic, Payload = 55 BLossy channel, Low traffic, Payload = 115 BLossy channel, Low traffic, Payload = 55 B
(b) End-to-end delay in Lossy channel.
Figure 6.12: End-to-end delay of the IEEE 802.15.4 slotted CSMA/CA in the 915 MHzfrequency band in ideal and lossy channel with saturated and low tra�c.
5 10 15 20 25 30 35 40 45 5065
70
75
80
85
90
95
100
105
110
115
Number of Nodes
End
to e
nd d
elay
(m
s)
Ideal channel, Saturated traffic, Payload = 115 BIdeal channel, Saturated traffic, Payload = 55 BIdeal channel, Low traffic, Payload = 115 BIdeal channel, Low traffic, Payload = 55 B
(a) End-to-end delay in ideal channel.
5 10 15 20 25 30 35 40 45 5060
65
70
75
80
85
90
95
100
105
Number of Nodes
End
to e
nd d
elay
(m
s)
Lossy channel, Saturated traffic, Payload = 115 BLossy channel, Saturated traffic, Payload = 55 BLossy channel, Low traffic, Payload = 115 BLossy channel, Low traffic, Payload = 55 B
(b) End-to-end delay in Lossy channel.
Figure 6.13: End-to-end delay of the IEEE 802.15.4 slotted CSMA/CA in the 868 MHzfrequency band in ideal and lossy channel with saturated and low tra�c.
Figures 6.12 and 6.13 present average end-to-end delay in 915 MHz and 868 MHz
bands. In both bands, the delay is relatively high which is intuitive because of the
low datarate. As Figures 6.12(a) and 6.12(b) show, the saturated tra�c has very
similar delay as in low tra�c case in both ideal and non-ideal channels.

7. CONCLUSIONS 67
7. CONCLUSIONS
M2M technology is aiming at providing interaction between smart objects extending
from sensors, meters, actuators to personal computers, robots, PDAs, and etc with-
out direct intervention of human beings. Furthermore, the number of these devices
is exponentially growing. IoT will conduct the large range applications including
sensing, communications, networking, computing, information processing, and in-
telligent control technologies. To work with such environment, applications should
satisfy the requirements to enable the M2M communications. Some of these factors
are the energy e�ciency, delay requirements, and throughput of the applications.
The M2M applications are very wide and confront a great variety of requirements.
Among the candidate technologies, the IEEE 802.15.4 standard for Low-Rate Wire-
less Personal Area Networks (WPAN) and the IEEE 802.11 standard for Wireless
Local Area Networks (WLAN) are becoming very popular standard in IoT and M2M
area.
To make IoT and M2M technology close to reality, wide variety of research should
be conducted within these technological area. In this regard, due to importance of
the WSNs in future technology and because of the lack of comprehensive research in
IEEE 802.15.4, this thesis conducts a thorough study in the performance evaluation
of this standard. A system level simulator is developed to analyze and evaluate the
performance of this standard in terms of network throughput, energy consumption,
and end-to-end delay. The performance evaluation is conducted in frequency bands
of 2.4 GHz, 915 MHz, and 868 MHz. Most literatures have been studying this
standard in 2.4 GHz and there was a lack of study for Sub-1 GHz band. Sub-1 GHz
bands are gaining interest for M2M Applications as an alternative to overcome the
propagation and interferences issues at the 2.4 GHz.
The results show that network throughput in lossy channel is higher than ideal
channel but in scarifying the network fairness. Due to this fact energy de�ciency
of the lossy channel is higher than ideal channel. In all frequency bands, the net-
work throughput drops by increasing the number of the nodes in the network and
therefore, energy e�ciency decreases.
In addition, the performance comparison between IEEE 802.15.4 and IEEE 802.11
ah is conducted in terms of network throughput and energy consumption.
The results of the throughput for the presented settings show that the IEEE

7. CONCLUSIONS 68
802.11ah outperforms the IEEE 802.15.4 in both idle and non-idle channels with
two di�erent tra�c cases. In addition, It is shown that in the case of non-ideal
channel, both standards have higher throughput compared to ideal channel but in
scarifying the transmission fairness. In other words, the nodes which are closer to
AP have higher probability to send their packets compared to farther nodes. In
term of energy consumption, IEEE 802.15.4 consumes more average energy to send
a successful packet compared with the rival standard in the case of small number of
nodes in low tra�c scenario. In contrast, energy consumption of the IEEE 802.11ah
is relatively higher in congested networks. It is concluded that the performance of
the IEEE 802.11ah is better in term of throughput but in the case of the energy
consumption, the IEEE 802.15.4 still outperforms the IEEE 802.11ah specially in a
dense network and non-saturated tra�c.

69
REFERENCES
[1] XuFei, M.; Chi, Z.; Yuan, H.; Zheng, Y.; Shaojie, T.; Weichao, W., �Guest
editorial: Special issue on wireless sensor networks, cyber-physical systems, and
internet of things,� Tsinghua Science and Technology , vol.16, no.6, pp.559,560,
Dec. 2011
[2] Taleb, T.; Kunz, A., �Machine type communications in 3GPP networks: po-
tential, challenges, and solutions,� Communications Magazine, IEEE , vol.50,
no.3, pp.178,184, March 2012
[3] IEEE 802.15 WPANTM Task Group 4 (TG4), http://grouper.ieee.org/groups/
802/15/pub/TG4.html
[4] ZigBee Alliance (2006), ZigBee Speci�cation 2006, http://www.zigbee.org/
[5] Zheng, J.; Lee, M.J., �Will IEEE 802.15.4 make ubiquitous networking a real-
ity?: a discussion on a potential low power, low bit rate standard,� Communi-
cations Magazine, IEEE , vol.42, no.6, pp.140,146, June 2004
[6] G. Lu, B. Krishnamachari, and C. Raghavendra, �Performance evaluation of
the IEEE 802.15.4 MAC for low-rate low-power wireless networks,� in Proc. of
IEEE IPCCC, 2004
[7] Zheng, J.; Lee, M. L., �A comprehensive performance study of IEEE 802.15.4,�
in IEEE Press Book, 2004
[8] Koubaa, A.; Alves, M.; Tovar, E., �A comprehensive simulation study of slotted
CSMA-CA for IEEE 802.15.4 wireless sensor networks,� in IEEE International
Workshop on Factory Communication Systems, Jun 2006, pp.183,192
[9] Pollin, S.; Ergen, M; Ergen, S. C.; Bougard, B.; Perre, L. V. D.; Catthoor,
F.; Moerman, I.; Bahai, A.; Varaiya, P.,�Performance analysis of slotted carrier
sense IEEE 802.15.4 medium access layer,� in Proc. of IEEE GLOBECOM,
2006, pp.1,6
[10] Mi²ió, J.; Shaf, S.; Mi²ió, V., �Performance of a beacon enabled IEEE 802.15.4
cluster with downlink and uplink tra�c,� in IEEE Trans. Parallel and Dis-
tributed Systems, 2006, pp.361,376
[11] Sahoo, P. K.; Sheu, J. P., �Modeling IEEE 802.15.4 based wireless sensor net-
work with packet retry limits,� in PE-WASUN, 2008, pp.63,70

70
[12] Pollin, S.; Ergen, M.; Ergen, S. C.; Bougard, B.; Catthoor, F.; Bahai, A.;
Varaiya, P., �Performance analysis of slotted carrier sense IEEE 802.15.4 ac-
knowledged uplink transmissions,� in Proc. of IEEEWCNC, 2008, pp.1559,1564
[13] Geer, D., �Users make a Beeline for ZigBee sensor technology,� Computer ,
vol.38, no.12, pp.16,19, Dec. 2005 doi: 10.1109/MC.2005.422
[14] Margono, F. I.; Zolkefpeli, M. A M; Shaaya, S.A., �Performance study on en-
ergy consumption and QoS of wireless sensor network under di�erent MAC
layer protocols: IEEE802.15.4 and IEEE802.11,� Research and Development
(SCOReD), 2009 IEEE Student Conference on , vol., no., pp.65,68, 16-18 Nov.
2009
[15] Baseri, M.; Motamedi, S.A., �Simulation study of packet length for improving
throughput of IEEE 802.15.4 for image transmission in WSNs,� Technologi-
cal Advances in Electrical, Electronics and Computer Engineering (TAEECE),
2013 International Conference on , vol., no., pp.6,9, 9-11 May 2013
[16] Byoung, H.J.; Jo, W.C.; Seong, H.J.; Ho, Y.H.; Su, M.K.; Min, S.K.; Dan,
K.S., �Ubiquitous Wearable Computer (UWC)-Aided Coexistence Algorithm in
an Overlaid Network Environment of WLAN and ZigBee Networks,� Wireless
Pervasive Computing, 2007. ISWPC '07. 2nd International Symposium on ,
vol., no., pp.� 5-7 Feb. 2007
[17] IEEE Standard for Information technology� Local and metropolitan area
networks� Speci�c requirements� Part 15.4: Wireless Medium Access Control
(MAC) and Physical Layer (PHY) Speci�cations for Low Rate Wireless Per-
sonal Area Networks (WPANs), IEEE Std 802.15.4-2006 (Revision of IEEE Std
802.15.4-2003) , vol., no., pp.1,320, Sept. 7 2006
[18] Iera, A.; Floerkemeier, C.; Mitsugi, J.; Morabito, G., �The Internet of things
[Guest Editorial],� Wireless Communications, IEEE, vol.17, no.6, pp.8,9, De-
cember 2010
[19] Kevin, A. �That �Internet of Things� Thing, in the real world things matter
more than ideas,� RFID Journal, June 22, 2009
[20] Gavras, A.; Karila, A.; Fdida, S.; May, M. ; Potts, M. �Future internet research
and experimentation,� ACM SIGCOMM Computer Communication Review,
vol.37, no., pp., 2007
[21] Kortuem, G.; Kawsar, F.; Fitton, D.; Sundramoorthy, V., �Smart objects as
building blocks for the Internet of things,� Internet Computing, IEEE , vol.14,
no.1, pp.44,51, Jan.-Feb. 2010

71
[22] Bartoli, A.; Dohler, M.; Hernandez-Serrano , J.; Kountouris, A.; Barthel, D.,
�Low-Power Low-Rate Goes Long-Range:The Case for Secure and Coopera-
tive Machine-to-Machine Communications,� In proceeding of: NETWORKING
2011 Workshops - International IFIP TC 6 Workshops, PE-CRN, NC-Pro,
WCNS, and SUNSET 2011, Held at NETWORKING 2011, Valencia, Spain,
vol., no., pp. 219,230, May 13, 2011
[23] WWRF (2009) Visions and research direction for the wireless world, July 2009
[24] Singh, M.; Singh, S.; Pancholi, P.; Saxena, N.; Mehrotra, R.K., �Modelling of
machine to machine communication networks,� Information and Communica-
tion Technologies (ICT), 2013 IEEE Conference on , vol., no., pp.258,262, 11-12
April 2013
[25] Coetzee, L.; Eksteen, J., �The Internet of Things - promise for the future?
An introduction,� IST-Africa Conference Proceedings, 2011 , vol., no., pp.1,9,
11-13 May 2011
[26] Changliang, X.; Kwang-Cheng, C.; Xinbing, W., �To hop or not to hop in
massive machine-to-machine communications,� Wireless Communications and
Networking Conference (WCNC), 2013 IEEE , vol., no., pp.1021,1026, 7-10
April 2013
[27] Daeyoung, L.; Jong-Moon, C. ; Garcia, R.C., �Machine-to-machine commu-
nication standardization trends and end-to-end service enhancements through
vertical handover technology,� Circuits and Systems (MWSCAS), 2012 IEEE
55th International Midwest Symposium on , vol., no., pp.840,844, 5-8 Aug. 2012
[28] Shao-Yu, L; Kwang-Cheng, C. ; Yonghua, L., �Toward ubiquitous massive ac-
cesses in 3GPP machine-to-machine communications,� Communications Mag-
azine, IEEE , vol.49, no.4, pp.66,74, April 2011
[29] Krishnan, V.; Sanyal, B. , �M2M Technology:Challenges and Opportunities,�
Tech Mahindra, White paper, 2010
[30] https://www.abiresearch.com/
[31] Zhang, Y. ; Yu, R. ; Xie, S. ; Yao, W. ; Xiao, Y. ; Guizani, M., �Home M2M
networks: Architectures, standards, and QoS improvement,� Communications
Magazine, IEEE , vol.49, no.4, pp.44,52, April 2011
[32] 3rd Generation Partnership Project (3GPP), Study on facilitation of machine-
to-machine communication in 3GPP systems. 3GPP Tech. Rep. 22.868, version
8.0.0, Mar., 2007
72
[33] 3rd Generation Partnership Project (3GPP), Feasibility study on remote man-
agement of USIM application on M2M equipment. 3GPP Tech. Rep. 33.812,
unpublished draft version 1.4.0, May, 2007
[34] Makris, P. ; Skoutas, N.D.; Nomikos, N.; Vouyioukas, D.; Skianis, C, �?
Context-Aware Backhaul Management Solution for combined H2H and M2M
tra�c,� In proceeding of: IEEE International Conference on Computer, Infor-
mation and Telecommunication Systems (CITS), May 2013
[35] Taqqali, W.M.; Abdulaziz, N., �Smart Grid and demand response technology,�
Energy Conference and Exhibition (EnergyCon), 2010 IEEE International ,
vol., no., pp.710,715, 18-22 Dec. 2010
[36] Inhyok, C. ; Shah, Y.; Schmidt, A.U.; Leicher, A.; Meyerstein, M.V., �Trust
in M2M communication,� Vehicular Technology Magazine, IEEE , vol.4, no.3,
pp.69,75, Sept. 2009
[37] �Machine-to-Machine communications (M2M);M2M service requirements,�
ETSI TS, 102 689 V1.1.1, Technical Speci�cation, Aug. 2010
[38] Kim, D. ; Song, J. ; Cha, S. , �Introduction of case study for M2M intelli-
gent machine tools,� Assembly and Manufacturing, 2009. ISAM 2009. IEEE
International Symposium on , vol., no., pp.408,411, 17-20 Nov. 2009
[39] Buonaccorsi, N.; Cicconetti, C.; Mambrini, R.; Podias, N.; Russell, P., �ETSI
M2M release 1 demonstration,� World of Wireless, Mobile and Multimedia
Networks (WoWMoM), 2012 IEEE International Symposium on a , vol., no.,
pp.1,3, 25-28 June 2012
[40] Beale, M., �Future challenges in e�ciently supporting M2M in the LTE stan-
dards,� Wireless Communications and Networking Conference Workshops (WC-
NCW), 2012 IEEE , vol., no., pp.186,190, 1-1 April 2012
[41] Juniper networks, �MACHINE-To-MACHINE (M2M),THE RISE of THE MA-
CHINEs,� white paper, 2011
[42] Bhagwat, P., �Bluetooth: technology for short-range wireless apps,� Internet
Computing, IEEE , vol.5, no.3, pp.96,103, May/Jun 2001
[43] Baker, N., �ZigBee and Bluetooth strengths and weaknesses for industrial appli-
cations,� Computing and Control Engineering Journal , vol.16, no.2, pp.20,25,
April-May 2005

73
[44] IEEE Standard for Telecommunications and Information Exchange Between
Systems - LAN/MAN - Speci�c Requirements - Part 15: Wireless Medium
Access Control (MAC) and Physical Layer (PHY) Speci�cations for Wireless
Personal Area Networks (WPANs), IEEE Std 802.15.1-2002 , vol., no., pp.1,473,
June 14 2002
[45] Gilb, J.P.K., �Bluetooth radio architectures,� Radio Frequency Integrated Cir-
cuits (RFIC) Symposium, 2000. Digest of Papers. 2000 IEEE , vol., no., pp.3,6,
10-13 June 2000
[46] KARMAKAR, N. C., �Handbook of Smart Antennas for RFID Systems,� JOHN
WILEY and SONS, INC., Hoboken, New Jersey, 2010
[47] Srivastava, N., �RFID: RFID Introduction, Present and Future applications and
Security Implications; RFID Introduction, Present and Future applications and
Security Implications,� December 19, 2006
[48] Nemeth, P.; Toth, L.; Hartvanyi, T., �Adopting RFID in supply chains,� Mecha-
tronics, 2006 IEEE International Conference on , vol., no., pp.263,266, 3-5 July
2006
[49] Chen, S.C.Q.; Thomas, V., �Optimization of inductive RFID technology,� Elec-
tronics and the Environment, 2001. Proceedings of the 2001 IEEE International
Symposium on , vol., no., pp.82,87, 2001
[50] Want, R., �An introduction to RFID technology,� Pervasive Computing, IEEE
, vol.5, no.1, pp.25,33, Jan.-March 2006
[51] Perahia, E; Stacey, R., �Next Generations Wireless LANs Throughput Robust-
ness and Reliability in 802.11n,� Cambridge University Press, September 2008
[52] LABIOD, H.; AFIFI, H.; DE SANTIS, C., �Wi-Fi, Bluetooth, ZgBee AND
WiMax,� Springer, Dordrecht, The Netherlands, 2007
[53] Brenner, P., �A Technical Tutorial on the IEEE 802.11 Protocol,� BreezeCom
Wireless communications, 18 July, 1996
[54] Farahani, S., �ZigBee wireless networks and transceivers�, Elsevier Ltd., Newnes
Newton, MA, USA, 2008
[55] Sun, N.; Zhou, Y. ; Yang, Y., �Identi�cation of Frequency-Hopping Spread
Spectrum Signals Using SVMs with Wavelet Kernels,� Intelligent Systems and
Applications (ISA), 2010 2nd International Workshop on , vol., no., pp.1,4,
22-23 May 2010

74
[56] Berder, O.; Bouder, C.; Burel, G., �Identi�cation of Frequency Hopping Com-
munications,� Problem in Modern Applied Mathematics, pp.259,264, 2000
[57] Poisel R.A., �Modern communications jamming proiciples and techniques,�
ARTECH HOUSE,INC, Norwood, MA, USA, 2004
[58] Goldsmith, A., � Wireless Communications�, Cambridge University Press, New
York, NY, USA, 2005
[59] Rholding, H., �OFDM Concept for Future Communication System�, Springer,
Berlin, Heidelberg, Germany, 2011
[60] Kim, S.; Yoon, K.; Jung, R. G.; Son, J; Ryu, H., �Adaptive frequency diver-
sity OFDM (AFD-OFDM) communication system in the narrow-band interfer-
ence channel,� Communications, 2004 and the 5th International Symposium on
Multi-Dimensional Mobile Communications Proceedings. The 2004 Joint Con-
ference of the 10th Asia-Paci�c Conference on , vol.2, no., pp.834,838 vol.2, 29
Aug.-1 Sept. 2004
[61] IEEE Standard for Wireless LAN Medium Access Control (MAC) and Physical
Layer (PHY) Speci�cations : High speed Physical Layer in the 5 GHz Band,
EEE Std 802.11a, 1999, (Dec. 1999)
[62] Ström, J.; Wang, J.; Arapantonis, E.; Talebi, E., �Go Faster WLAN 802.11n,�
Chalmers University of Tecnhology, Göteborg.
[63] Hongqiang, Z.; Younggoo K.; Yuguang F., �Performance analysis of IEEE
802.11 MAC protocols in wireless LANs,� WIRELESS COMMUNICATIONS
AND MOBILE COMPUTING, Published online in Wiley InterScience,
pp.917,931, 2004
[64] Eng Hwee Ong; Kneckt, J.; Alanen, O.; Zheng Chang; Huovinen, T.; Nihtila,
T., �IEEE 802.11ac: Enhancements for very high throughput WLANs,� Per-
sonal Indoor and Mobile Radio Communications (PIMRC), 2011 IEEE 22nd
International Symposium on , vol., no., pp.849,853, 11-14 Sept. 2011
[65] Bianchi, G., �Performance analysis of the IEEE 802.11 distributed coordination
function,� Selected Areas in Communications, IEEE Journal on , vol.18, no.3,
pp.535,547, March 2000
[66] Bridgelall, R., �Enabling mobile commerce through pervasive communications
with ubiquitous RF tags,� Wireless Communications and Networking, 2003.
WCNC 2003. 2003 IEEE , vol.3, no., pp.2041,2046 vol.3, 20-20 March 2003

75
[67] Bolan, C., �A proposal for utilizing active jamming for the defence of RFID
systems against attack,� The 9th Australian Information Security Management
Conference, Edith Cowan University, Perth Western Australia, 5th -7th De-
cember, 2011
[68] 802.11ac: The Fifth Generation of Wi-Fi, Technical White Paper, Cisco and/or
its a�liates, August, 2012
[69] Lee, J.; Su, Y.; Shen, C., �A Comparative Study of Wireless Protocols: Blue-
tooth, UWB, ZigBee, and Wi-Fi,� Industrial Electronics Society, 2007. IECON
2007. 33rd Annual Conference of the IEEE , vol., no., pp.46,51, 5-8 Nov. 2007
[70] Sikora, A.; Groza, V.F., �Coexistence of IEEE802.15.4 with other Systems in
the 2.4 GHz-ISM-Band,� Instrumentation and Measurement Technology Con-
ference, 2005. IMTC 2005. Proceedings of the IEEE , vol.3, no., pp.1786,1791,
16-19 May 2005
[71] Rizzoli, A. E., � A Collection of Modelling and Simulation Resources on the
Internet,� http://www.idsia.ch/ andrea/sim/simnet.html, December 2009
[72] OMNet++ webpage, http://www.omnetpp.org/
[73] OPNET webpage , http://www.opnet.com/
[74] ns2 webpage , http://www.isi.edu/nsnam/ns/
[75] NetSim webpage, http://www.tetcos.com/software.html
[76] Schriber, T.J.; Brunner, D.T., �Inside discrete-event simulation software: how
it works and why it matters,� Simulation Conference, 2001. Proceedings of the
Winter , vol.1, no., pp.158,168 vol.1, 2001
[77] Varga A., �The OMNeT++ Descrete Event Simulation System,� in Proceed-
ings of the European Simulation Multiconference (ESM'2001) Prague, Czech
Republic, 2001
[78] CC2420 data sheet, Chipcon AS SmartRF, 2.4 GHz IEEE 802.15.4/ZigBee-
ready RF Transceiver
[79] Hazmi, A.; Rinne, J.; Valkama, M., �Feasibility study of IEEE 802.11ah radio
technology for IoT and M2M use cases,� Globecom Workshops (GC Wkshps),
2012 IEEE , vol., no., pp.1687,1692, 3-7 Dec. 2012

76
[80] Aust, S.; Prasad, R.V.; Niemegeers, I. G M M, �IEEE 802.11ah: Advantages
in standards and further challenges for sub 1 GHz Wi-Fi,� Communications
(ICC), 2012 IEEE International Conference on , vol., no., pp.6885,6889, 10-15
June 2012
[81] IEEE 802.11ah Speci�cation framework for TGah, doc.: IEEE 802.11-
11/1137r13, January 2013
[82] Zhang, Y.; Xu, P.; Zhang, Z.; GuangguoBi, �Throughput Analysis of IEEE
802.15.4 Slotted CSMA/CA Considering Timeout Period and Its Improve-
ment,� Communication systems, 2006. ICCS 2006. 10th IEEE Singapore In-
ternational Conference on , vol., no., pp.1,5, Oct. 2006
[83] Badihi Olyaei, B.; Pirskanen, J.; Raeesi, O.; Hazmi, A.; Valkama, M., �Perfor-
mance comparison between Slotted IEEE 802.15.4 and IEEE 802.11ah in IoT
based applications,� The 9th IEEE International Conference on Wireless and
Mobile Computing, Networking and Communications (WiMob 2013), Lyon,
France, October, 2013