behaviour of circular sandwich panel under …mekanika/issue...
TRANSCRIPT
Jurnal Mekanikal December 2005, No. 20, 96 - 111
96
BEHAVIOUR OF CIRCULAR SANDWICH
PANEL UNDER DYNAMIC LOADING
Amran Alias Mohd Ruzaimi Mat Rejab Mohd Radzai Mohamad
Hazizan Md Akil Nor Azlan Ahmad Nor
Composite Centre (PUSKOM)
Faculty of Mechanical Engineering Universiti Teknologi Malaysia E-mail: [email protected]
ABSTRACT
In this paper, the dynamic tests were conducted in order to determine the performance, mechanical behaviour, effect of foam type and the correlation between input energy from static and dynamic tests. Emphasis is placed on assessing the failure modes occurred after the dynamic test and the comparison is made with the static test. Same type of failure behaviours were observed for the circular sandwich panels with different PU and R55 foam cores. The load versus displacement diagrams show that dynamic loading requires more input energy to create the same type of failure than that of static loading for circular PU sandwich panels. For circular R55 sandwich panels, it behaves oppositely, where higher loads were recorded in the static cases. Keywords: Circular sandwich panel, PU foam, PVC foam (R55), failure modes, impact
damage 1.0 INTRODUCTION A sandwich panel is constructed of three layers. Two of them are called face sheets forming the external layers and treated as thin shells that are separated by a thick mid-layer playing the role of the core [1]. Whereas the faces are generally made up of high strength materials (steel, aluminium or fibre reinforced plastic), the core layer is made of a low specific weight material (balsa, porous rubber, corrugated metal sheet, polymeric foam, metallic and non-metallic honeycomb) which may be much less stiff and strong than the face sheets [2]. The sandwich panel is widely used in aerospace, marine, automotive and civil constructions. One of the advantages of sandwich panel is its ability to absorb more impacting energy while dynamic loading occurred. In dynamic loading, either at low or high velocity, impact on sandwich panels has been studied by many famous authors [3-12]. Some of the researchers had done the experiments with different skin and core materials with various impact conditions, etc.
Jurnal Mekanikal, December 2005
97
Roach et al. [13-14] had investigated the penetration energy of sandwich panel elements under static and dynamic loading in two series. In part I, they found that the ratio of dynamic penetration energy to static penetration energy rises rapidly initially with velocity. More energy is required to penetrate skins than to penetrate skins with a PVC foam core foundation. In part II, they found that single skins absorbed more energy than foam-backed skins resting on a solid foundation and were more likely to prevent projectile penetration. Foam-backed skins underwent a more local damage process with significantly less energy absorption. Hoo Fatt and Park [15-16] presented dynamic models for low velocity impact damage of composite sandwich panels at deformation and damage initiation. They found that the impact failure modes are similar to static indentation failure modes but inertial resistance and high strain rate material properties of the face sheets and core influence impact damage loads. Xu and Rosakis [17-18] presented a systematic experimental investigation of the generation and subsequent evolution of dynamic failure modes in sandwich structures subjected to low velocity impact. In part I, they found in all cases, inter-layer (interfacial) cracks appeared first at two metal layers sandwiched between polymeric core. These cracks were shear-dominated and were often intersonic even under moderate impact speeds. In part II, they investigated the effects of impact speed and interfacial bond strength on the dynamic failure of model sandwich structures. Hazizan and Cantwell [11-12] had investigated the low velocity impact response of sandwich structure with different core materials, foam based (PVC/PUR/PEI) with aluminium honeycomb. They found a good correlation between the energy-balance model and experimental data, particularly at low energies where damage was localised to the core material immediate to the point of impact. Yu et al. [19] had investigated experimentally on the response and failure of dynamically loaded sandwich beams with an aluminium-foam core. They found that due to large local indentation and damage the energy absorbing capacity of sandwich beams loaded dynamically is lower than that for quasi-static loading. Other researchers like Nguyen et al. [20], Aktay et al. [21], etc used FEA packages such as LS-Dyna, PAM-CRASH, ABACUS, MSC Dytran-Patran, etc to predict the impact behaviour and damage on sandwich panels. This paper is part II of a two-part study into the mechanical behaviour of circular sandwich panel. The issues addressed in this paper are the failure modes and the comparison of the type of deformation and damage inflicted on the circular sandwich panel and the correlation between input energy under static and dynamic loading. 2.0 MATERIAL PREPARATIONS AND EXPERIMENTAL WORKS 2.1 Materials In this project, steel skin and two different types of cellular foam cores, a PU foam and a PVC foam, were used. Polyester resin was selected as the adhesive between
Jurnal Mekanikal, December 2005
98
the skin and the core. The specifications of the materials used in the sandwich panel are: a) Skin : Mild steel sheet metal of thickness 0.9 mm. b) Foams : i) Cellular foam closed cell of rigid PVC foam sheet namely
R55, sheet thickness of 25 mm and density of 61 kg/m3. ii) Polyurethane (PU) foam sheet with thickness of 25 mm and
density of 30 kg/m3. c) Resin : Scott Bader, Crystic 491 PA (pre- accelerated chemical resistant,
isophthalic polyester resin). d) Hardener : Catalyst, methyl ethyl ketone 50% in phlegmatize (1%
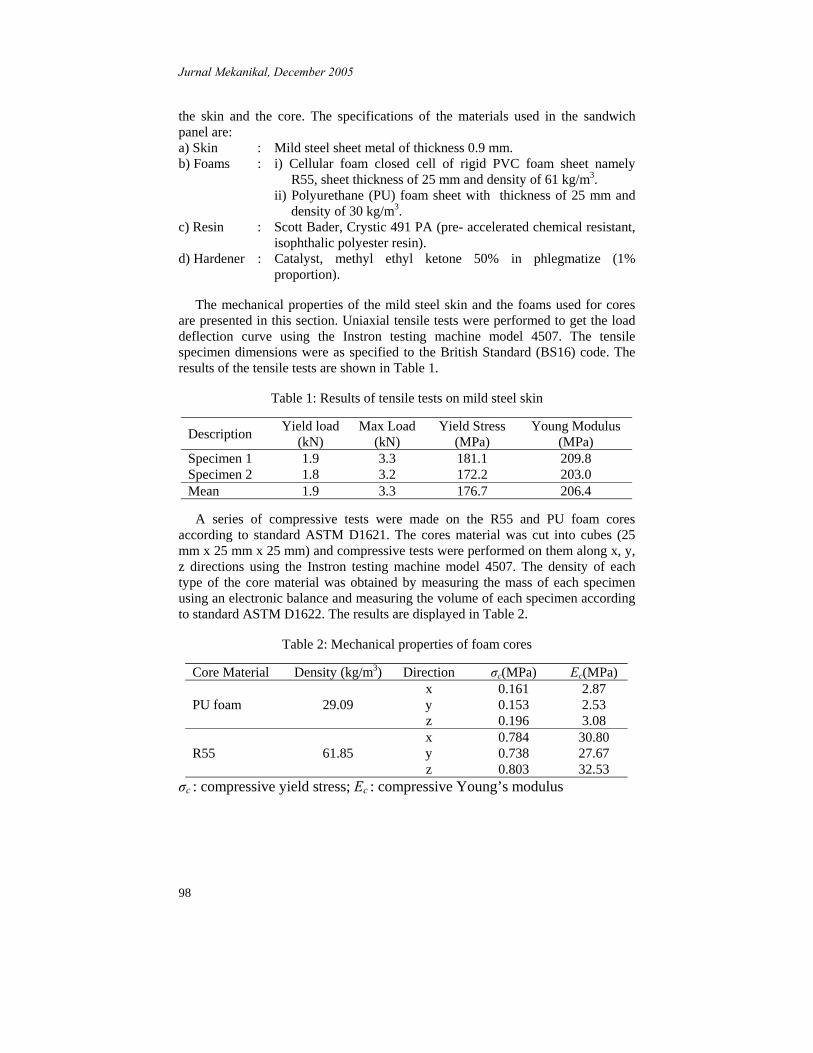
proportion). The mechanical properties of the mild steel skin and the foams used for cores are presented in this section. Uniaxial tensile tests were performed to get the load deflection curve using the Instron testing machine model 4507. The tensile specimen dimensions were as specified to the British Standard (BS16) code. The results of the tensile tests are shown in Table 1.
Table 1: Results of tensile tests on mild steel skin
Description Yield load (kN)
Max Load (kN)
Yield Stress (MPa)
Young Modulus (MPa)
Specimen 1 1.9 3.3 181.1 209.8 Specimen 2 1.8 3.2 172.2 203.0 Mean 1.9 3.3 176.7 206.4
A series of compressive tests were made on the R55 and PU foam cores according to standard ASTM D1621. The cores material was cut into cubes (25 mm x 25 mm x 25 mm) and compressive tests were performed on them along x, y, z directions using the Instron testing machine model 4507. The density of each type of the core material was obtained by measuring the mass of each specimen using an electronic balance and measuring the volume of each specimen according to standard ASTM D1622. The results are displayed in Table 2.
Table 2: Mechanical properties of foam cores
Core Material Density (kg/m3) Direction σc(MPa) Ec(MPa) x 0.161 2.87 PU foam 29.09 y 0.153 2.53 z 0.196 3.08 x 0.784 30.80 R55 61.85 y 0.738 27.67 z 0.803 32.53
σc : compressive yield stress; Ec : compressive Young’s modulus
Jurnal Mekanikal, December 2005
99
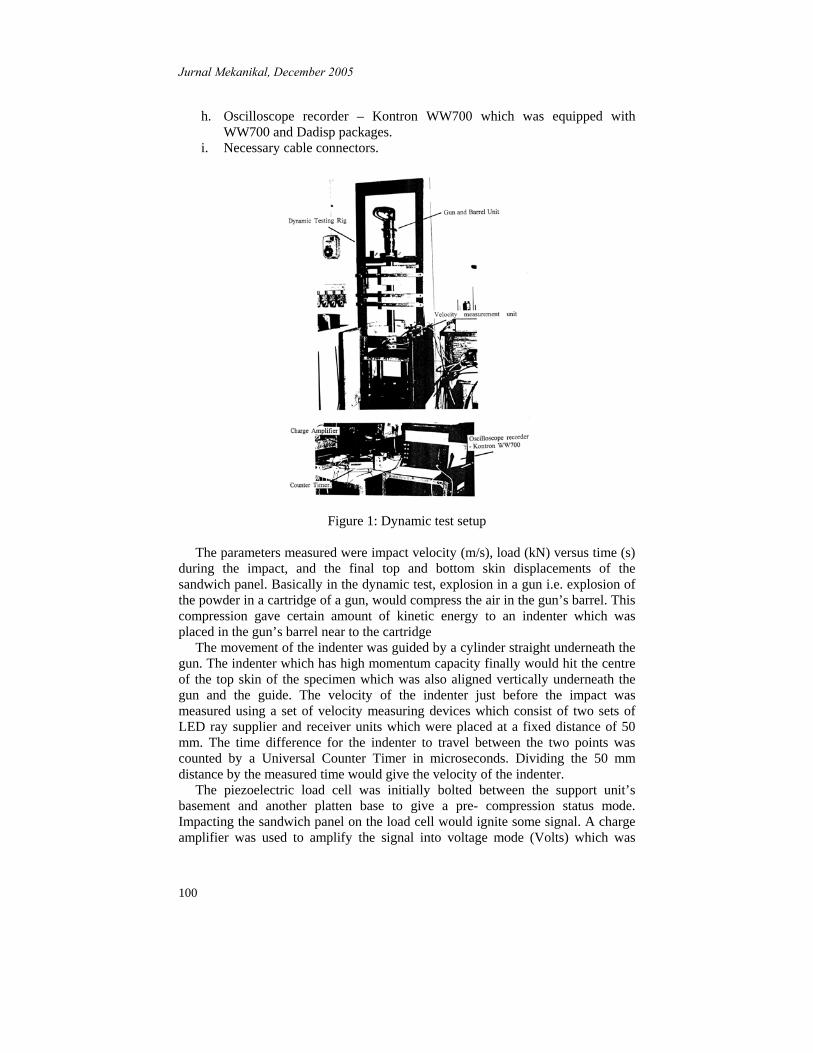
2.2 Test Samples The manufacturing procedure consisted of making the skin first. For the circular plate (300 mm diameter), the circular panels were further cut into an ‘almost’ circular shape using the press machine. They were then machined to the correct size using a lathe. One face of the circular steel plates were then roughened manually using rough sandpaper and ‘sandstone’. The rough surface is required to give adequate bonding between the core and the steel skin. The R55 and PU core sheets (25 mm thickness) were measured and cut into the required size (circular 300 mm diameter) using a band saw. The adhesive was prepared by mixing and stirring the hardener with the polyester resin at 1% composition i.e. 1 ml catalyst to 100 ml resin. Both faces of the cores being coated evenly with the resin using a brush and allowed to partially cure for 5 minutes. During that time, the roughened surface of the steel plates was also coated with the resin. The respective surfaces of the cores and the skin were then stuck together to each other. Careful attention was given to align the skins and the core to prevent skins and the core of the sandwich panel slipping on each other. Finally the complete circular sandwich panel was held between two clamping plates, with special plastic sheets placed in between two clamping plates to prevent them from sticking to each other, before a sufficient number of weights were put on top of the assembly. The weights were to provide enough pressure for the foam to stick on the skin properly as well as to extrude the air bubbles and excess resin between the skin and the foam core. The weights should be moderate to avoid the deformation of foam core. A weight of approximately 5 kg was used for panels with 25 mm thick PU foam. 2.3 Experimental Work The circular sandwich panels on their respective supports were struck centrally by hemispherical-ended or flat faced projectiles with an initial velocity of 20-60 m/s. The arrangement of the dynamic test setup is displayed in Figure 1. The equipments that were required to do the dynamic test were:
a. Dynamic testing rig – vertically configured rig from a previous project was used with modifications to the barrel and the clamping units.
b. Gun and barrel unit – Tornado type T6, supplied by Tornado Co. Ltd., Leeds.
c. Powdered cartridge – size 10 mm calibre cartridges, supplied with different strength which was recognized by the colour of the cap, ranging from green (week), yellow, blue, red, and black (most powerful). Supplied by Tornado Co.Ltd.
d. Hemispherical (170 g) and flat indenters (171 g) – the indenters were made out of mild steel with diameter of 25 mm.
e. Velocity measurement unit – consist of LED units, fibre optic receiver unit, Apollo 100 Universal Counter Timer.
f. Load cell – Piezoelectric load cell, Kristler Type 9091, SN 223410, range: 1 000 000 N, sensitivity 2.25 pC/N.
g. Charge amplifier type 5008 – Kristler.
Jurnal Mekanikal, December 2005
100
h. Oscilloscope recorder – Kontron WW700 which was equipped with WW700 and Dadisp packages.
i. Necessary cable connectors.
Figure 1: Dynamic test setup The parameters measured were impact velocity (m/s), load (kN) versus time (s) during the impact, and the final top and bottom skin displacements of the sandwich panel. Basically in the dynamic test, explosion in a gun i.e. explosion of the powder in a cartridge of a gun, would compress the air in the gun’s barrel. This compression gave certain amount of kinetic energy to an indenter which was placed in the gun’s barrel near to the cartridge The movement of the indenter was guided by a cylinder straight underneath the gun. The indenter which has high momentum capacity finally would hit the centre of the top skin of the specimen which was also aligned vertically underneath the gun and the guide. The velocity of the indenter just before the impact was measured using a set of velocity measuring devices which consist of two sets of LED ray supplier and receiver units which were placed at a fixed distance of 50 mm. The time difference for the indenter to travel between the two points was counted by a Universal Counter Timer in microseconds. Dividing the 50 mm distance by the measured time would give the velocity of the indenter. The piezoelectric load cell was initially bolted between the support unit’s basement and another platten base to give a pre- compression status mode. Impacting the sandwich panel on the load cell would ignite some signal. A charge amplifier was used to amplify the signal into voltage mode (Volts) which was
Jurnal Mekanikal, December 2005
101
precalibrated earlier to load values (kN). The signal was then loaded instantaneously to the Kontron WW700 oscilloscope. 2.4 Experimental Procedures for Dynamic Tests using High Speed Camera This is an extra feature of the dynamic tests. The experimental procedures were the same as in the ordinary dynamic tests with an addition of a high speed camera used to capture the displacement profile of the top skin and the bottom skin during the impact. Four set of 16 mm x 100 ft. films (Ilford HP5 Plus Type 782) were used to get the profile of the four different specimens; circular PU, circular R55, square PU and square R55. The speed of the camera was set up to 3000 frame per second. The camera was set to run for a certain time before the firing of the gun took place to give time for the camera to reach its constant specified speed (which is 3000 f/s). Line markings were drawn at the indenter to ease the measurement of the top skin’s profile. A small, light rod with line markings was glued to the bottom skin for the same reason on the bottom skin. The captured results on the film were then bRought to a high speed film analyzer to get the displacement profile versus time.
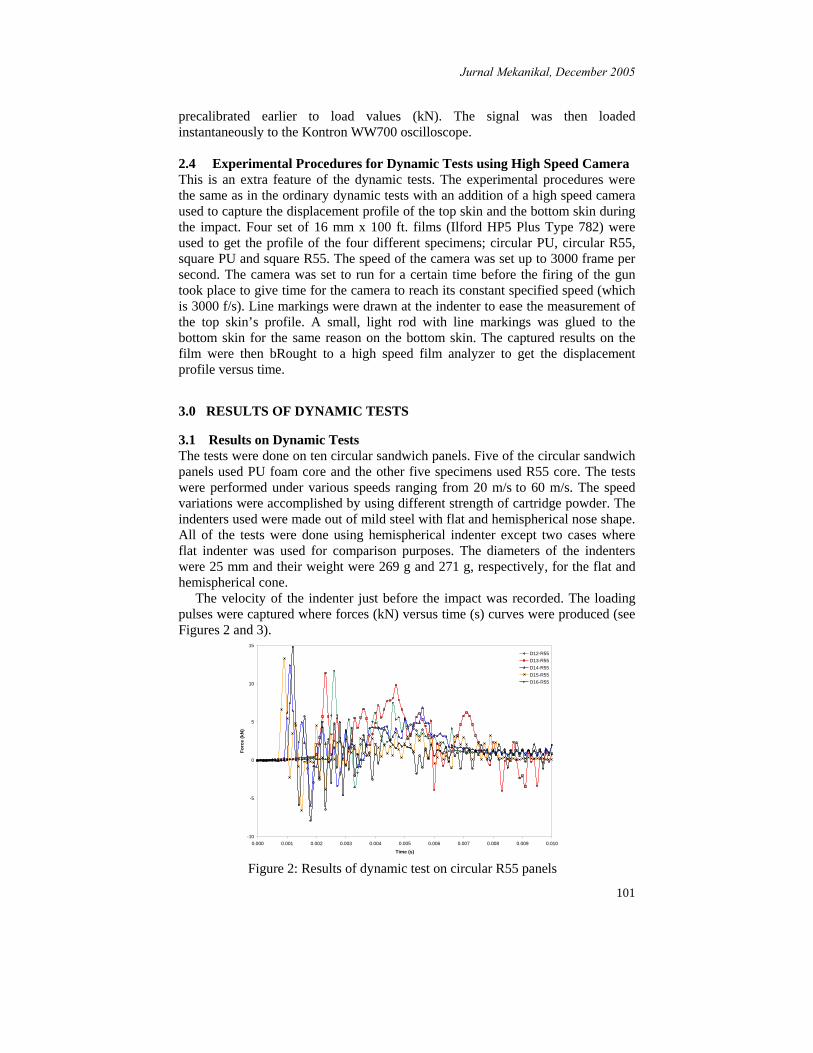
3.0 RESULTS OF DYNAMIC TESTS 3.1 Results on Dynamic Tests The tests were done on ten circular sandwich panels. Five of the circular sandwich panels used PU foam core and the other five specimens used R55 core. The tests were performed under various speeds ranging from 20 m/s to 60 m/s. The speed variations were accomplished by using different strength of cartridge powder. The indenters used were made out of mild steel with flat and hemispherical nose shape. All of the tests were done using hemispherical indenter except two cases where flat indenter was used for comparison purposes. The diameters of the indenters were 25 mm and their weight were 269 g and 271 g, respectively, for the flat and hemispherical cone. The velocity of the indenter just before the impact was recorded. The loading pulses were captured where forces (kN) versus time (s) curves were produced (see Figures 2 and 3).
-10
-5
0
5
10
15
0.000 0.001 0.002 0.003 0.004 0.005 0.006 0.007 0.008 0.009 0.010
Time (s)
Forc
e (k
N)
D12-R55D13-R55D14-R55D15-R55D16-R55
Figure 2: Results of dynamic test on circular R55 panels
Jurnal Mekanikal, December 2005
102
-4
-2
0
2
4
6
8
0.000 0.001 0.002 0.003 0.004 0.005 0.006 0.007 0.008 0.009 0.010
Time (s)
Forc
e (k
N)
D17-PUD18-PUD19-PUD20-PU
Figure 3: Results of dynamic test on circular PU panels
Table 3: Results of dynamic tests on circular panels using hemispherical indenter
(mass=269.8 g, 25 mm diameter)
Sample
Impact velocity
(m/s)
Kinetic energy
(J)
Load pulse (Ns)
Max load (kN)
Top skin disp
(mm)
Bottom skin disp
(mm)
Failure modes
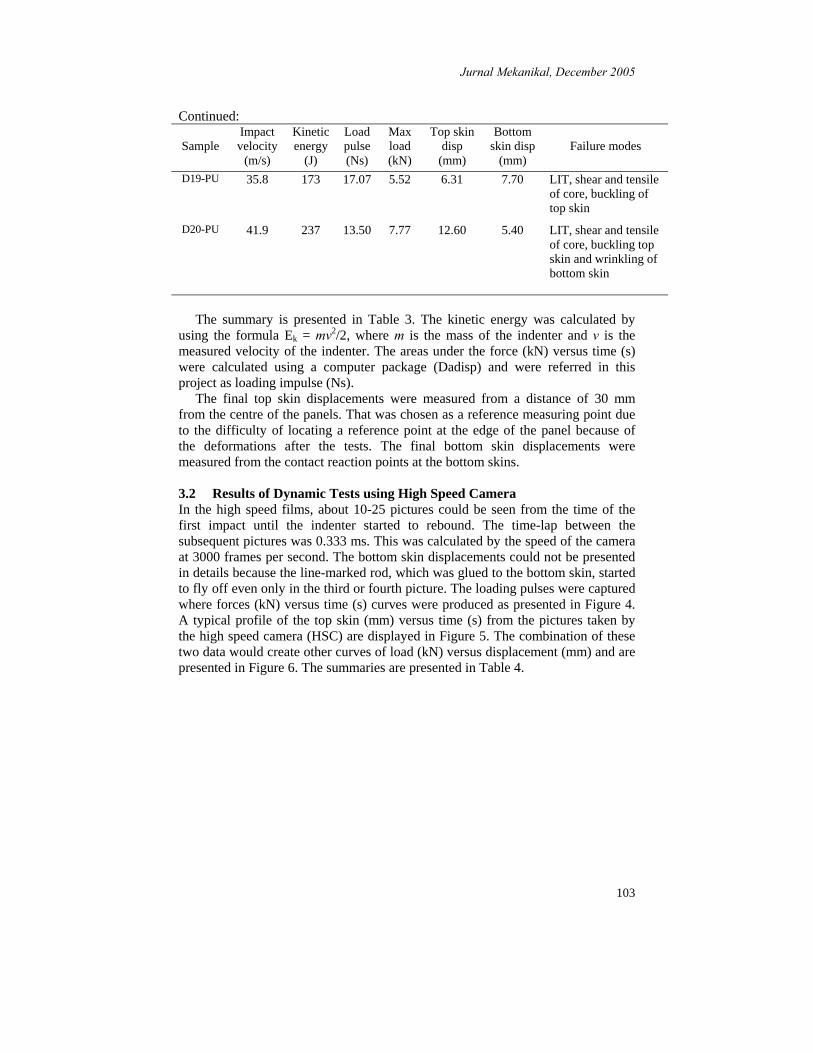
D12-R55
28.9
113
23.50
11.69
8.79
0.80
Local indentation (LI) at point of impact of top skin (LIT)
D13-R55 32.6 143 18.13 11.42 9.63 1.66 LIT
D14-R55 40.6 223 14.07 12.46 12.17 1.82 LIT, shear and tensile of core
D15-R55 43.8 259 15.08 13.25 13.43 8.18 LIT, shear and tensile of core
D16-R55
56.1
424
11.76
14.82
35.55
15.60
Penetration of top skin, no shear or tensile of core, local indentation at reaction points of bottom skins
D17-PU 28.4 109 11.58 4.05 8.67 3.25 LIT, shear and tensile of core
D18-PU 32.6 143 16.90 5.52 9.90 2.52 LIT, shear and tensile of core
Jurnal Mekanikal, December 2005
103
Continued: Sample
Impact velocity
(m/s)
Kinetic energy
(J)
Load pulse (Ns)
Max load (kN)
Top skin disp
(mm)
Bottom skin disp
(mm)
Failure modes
D19-PU 35.8 173 17.07 5.52 6.31 7.70 LIT, shear and tensile
of core, buckling of top skin
D20-PU 41.9 237 13.50 7.77 12.60 5.40 LIT, shear and tensile of core, buckling top skin and wrinkling of bottom skin
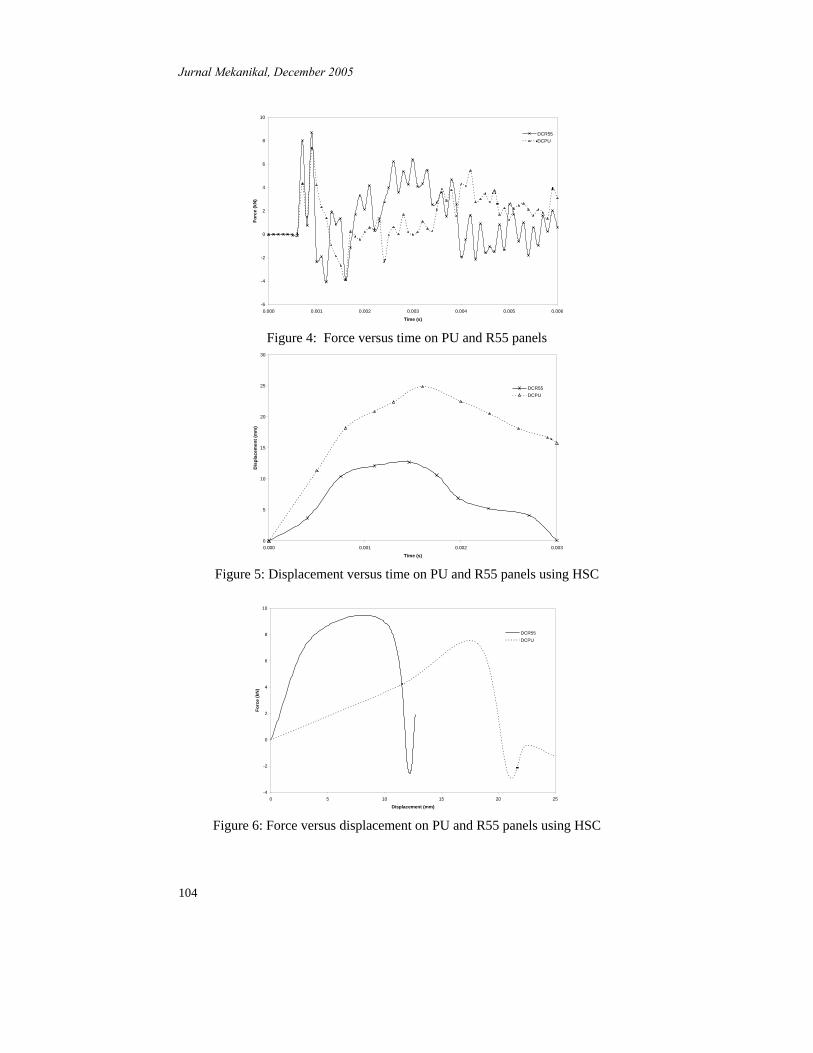
The summary is presented in Table 3. The kinetic energy was calculated by using the formula Ek = mv2/2, where m is the mass of the indenter and v is the measured velocity of the indenter. The areas under the force (kN) versus time (s) were calculated using a computer package (Dadisp) and were referred in this project as loading impulse (Ns). The final top skin displacements were measured from a distance of 30 mm from the centre of the panels. That was chosen as a reference measuring point due to the difficulty of locating a reference point at the edge of the panel because of the deformations after the tests. The final bottom skin displacements were measured from the contact reaction points at the bottom skins. 3.2 Results of Dynamic Tests using High Speed Camera In the high speed films, about 10-25 pictures could be seen from the time of the first impact until the indenter started to rebound. The time-lap between the subsequent pictures was 0.333 ms. This was calculated by the speed of the camera at 3000 frames per second. The bottom skin displacements could not be presented in details because the line-marked rod, which was glued to the bottom skin, started to fly off even only in the third or fourth picture. The loading pulses were captured where forces (kN) versus time (s) curves were produced as presented in Figure 4. A typical profile of the top skin (mm) versus time (s) from the pictures taken by the high speed camera (HSC) are displayed in Figure 5. The combination of these two data would create other curves of load (kN) versus displacement (mm) and are presented in Figure 6. The summaries are presented in Table 4.
Jurnal Mekanikal, December 2005
104
-6
-4
-2
0
2
4
6
8
10
0.000 0.001 0.002 0.003 0.004 0.005 0.006
Time (s)
Forc
e (k
N)
DCR55DCPU
Figure 4: Force versus time on PU and R55 panels
0
5
10
15
20
25
30
0.000 0.001 0.002 0.003
Time (s)
Dis
plac
emen
t (m
m)
DCR55DCPU
Figure 5: Displacement versus time on PU and R55 panels using HSC
-4
-2
0
2
4
6
8
10
0 5 10 15 20 25
Displacement (mm)
Forc
e (k
N)
DCR55DCPU
Figure 6: Force versus displacement on PU and R55 panels using HSC

Jurnal Mekanikal, December 2005
105
Table 4: Results of dynamic tests using high speed camera
Sample Core Initial velocity
(m/s) Max load (kN) Final top skin disp
(mm) DCR55 R55 39.6 4.94 8.72 DCPU PU 40.2 7.52 10.7 The profiles of the circular PU panel during the dynamic tests are presented in Figure 7. The pictures were taken by the high speed camera.
Figure 7: Profile of circular PU panels during dynamic test using HSC
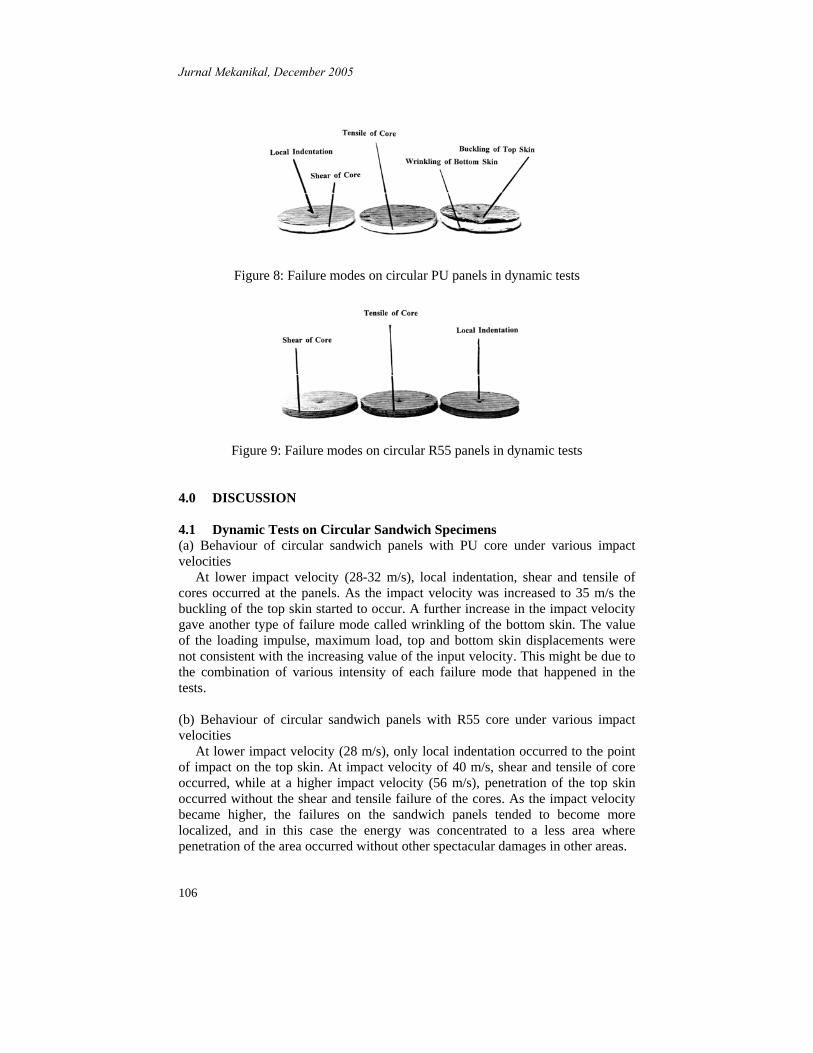
3.3 Failure Modes in Dynamic Tests The final failure modes for the various panels are listed in Table 3. The types of failure modes occurred in the dynamic tests are described in Figures 8 and 9.
Jurnal Mekanikal, December 2005
106
Figure 8: Failure modes on circular PU panels in dynamic tests
Figure 9: Failure modes on circular R55 panels in dynamic tests
4.0 DISCUSSION 4.1 Dynamic Tests on Circular Sandwich Specimens (a) Behaviour of circular sandwich panels with PU core under various impact velocities At lower impact velocity (28-32 m/s), local indentation, shear and tensile of cores occurred at the panels. As the impact velocity was increased to 35 m/s the buckling of the top skin started to occur. A further increase in the impact velocity gave another type of failure mode called wrinkling of the bottom skin. The value of the loading impulse, maximum load, top and bottom skin displacements were not consistent with the increasing value of the input velocity. This might be due to the combination of various intensity of each failure mode that happened in the tests. (b) Behaviour of circular sandwich panels with R55 core under various impact velocities At lower impact velocity (28 m/s), only local indentation occurred to the point of impact on the top skin. At impact velocity of 40 m/s, shear and tensile of core occurred, while at a higher impact velocity (56 m/s), penetration of the top skin occurred without the shear and tensile failure of the cores. As the impact velocity became higher, the failures on the sandwich panels tended to become more localized, and in this case the energy was concentrated to a less area where penetration of the area occurred without other spectacular damages in other areas.
Jurnal Mekanikal, December 2005
107
4.2 Effects of Foam’s Type PU panels failed by shear and tensile of cores at a lower impact velocity than that of R55 panels. This showed that PU foams had less resistant to those types of failures under the same impact velocity. The failures on R55 panels seemed to be more localized than that of PU panels. This was due to the higher resistant to any deformation from the denser foams (R55). These phenomena are because higher density foam would give a better distribution of load throughout the area when applied with load, which would lead to lower localized mean load. Higher density foams (R55) also showed a higher transmitted maximum load cell but permitted less deformations on their top and bottom skins. R55 cores had higher modulus of rigidity (E) value if compared to PU cores, this also gave a higher modulus for the respective panels. Time differences from peak to peak values in dynamic tests on PU and R55 panels were quite the same at 0.7 ms (see Figures 2 and 3). From stress wave point of view, the travelling wave speed in PU specimen was less than that of R55 by equation c = (E/ρ)1/2 , where c is the wave speed, E is the Young modulus of the materials and ρ is the density of the materials. For PU, cPu= 325 m/s, while for R55, cR55= 725 m/s. The modulus and density for the respective materials were deducted from the experimental values. Therefore, this oscillation mode may not have to do with the stress wave phenomena. Another way is to look at the vibration of the sandwich panels. Natural frequency of the respective materials can be calculated using equation ϖ = (k/m)1/2, where k and m are the stiffness and mass of the respective materials. The stiffness k can be calculated using equation k = D = (Eh3)/12(1-ν2), where E is the Young modulus, h is the thickness of the material, and ν is the Poisson’s ratio. Individually, for instance, square R55 foam with E = 32.53 MPa, thickness h = 25 mm, density of 61.8 kg/m3 and an assumed poisson’s ratio ν = 0.3, gives k = D = 46.54, m = 0.13927 kg, ϖ = 18.2 cycles/s which would give a tempo (peak to peak time) ∆T = 1/ϖ = 0.054 s. For square PU foam the same equation would give ∆T = 0.0121 s. A rough estimation on the natural frequency of a sandwich panel can be calculated by equation ϖ = (ke/me)1/2, where ke and me are the equivalent stiffness and mass of the sandwich panels. For example k of the square R55 panel can be estimated by ke = ktop skin + kcore+ kbottom skin, while me = m top skin + mcore + mbottom skin. For square R55 sandwich panel, the rough estimation of the natural frequency is ϖR55 = 7.2 cycles/s which gives an estimated tempo ∆T, peak to peak time is about 0.138 s. For the square PU panel, the rough estimation on the tempo ∆T, peak to peak time is about 0.21 s. Again, the oscillation mode in the results of the dynamic test on the sandwich panels could not possibly be associated with the vibration of the panels alone since the experimental peak to peak time was about 0.7 ms. Another possible explanation, thus, it may come from the vibration of the panel and the support unit together. This requires complex calculation. Such analysis is not considered here. 4.4 Relationships between Static and Dynamic Tests Theoretically, dynamic loading requires more input energy to produce the same type of failure than that of static loading. In actual, it was very hard to classify the
Jurnal Mekanikal, December 2005
108
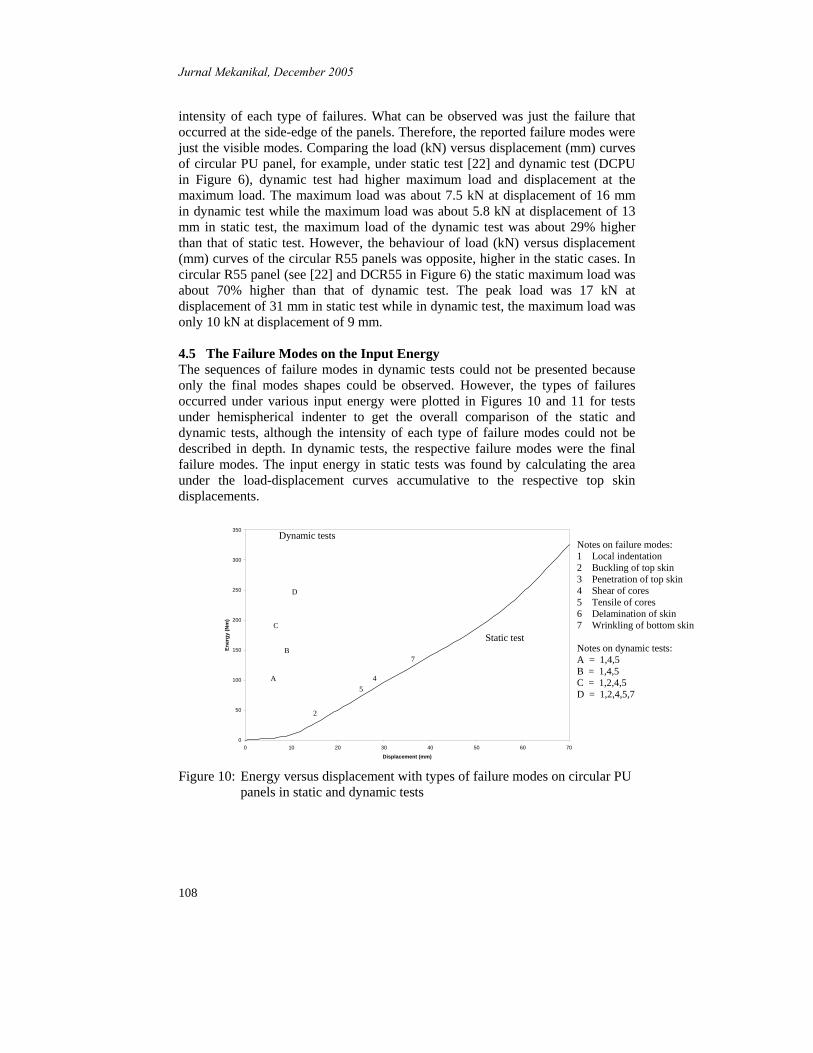
intensity of each type of failures. What can be observed was just the failure that occurred at the side-edge of the panels. Therefore, the reported failure modes were just the visible modes. Comparing the load (kN) versus displacement (mm) curves of circular PU panel, for example, under static test [22] and dynamic test (DCPU in Figure 6), dynamic test had higher maximum load and displacement at the maximum load. The maximum load was about 7.5 kN at displacement of 16 mm in dynamic test while the maximum load was about 5.8 kN at displacement of 13 mm in static test, the maximum load of the dynamic test was about 29% higher than that of static test. However, the behaviour of load (kN) versus displacement (mm) curves of the circular R55 panels was opposite, higher in the static cases. In circular R55 panel (see [22] and DCR55 in Figure 6) the static maximum load was about 70% higher than that of dynamic test. The peak load was 17 kN at displacement of 31 mm in static test while in dynamic test, the maximum load was only 10 kN at displacement of 9 mm. 4.5 The Failure Modes on the Input Energy The sequences of failure modes in dynamic tests could not be presented because only the final modes shapes could be observed. However, the types of failures occurred under various input energy were plotted in Figures 10 and 11 for tests under hemispherical indenter to get the overall comparison of the static and dynamic tests, although the intensity of each type of failure modes could not be described in depth. In dynamic tests, the respective failure modes were the final failure modes. The input energy in static tests was found by calculating the area under the load-displacement curves accumulative to the respective top skin displacements.
0
50
100
150
200
250
300
350
0 10 20 30 40 50 60 70
Displacement (mm)
Ener
gy (N
m)
Figure 10: Energy versus displacement with types of failure modes on circular PU
panels in static and dynamic tests
A
B
C
Dynamic tests
D
2
4
Static test
5
7
Notes on failure modes: 1 Local indentation 2 Buckling of top skin 3 Penetration of top skin 4 Shear of cores 5 Tensile of cores 6 Delamination of skin 7 Wrinkling of bottom skin Notes on dynamic tests: A = 1,4,5 B = 1,4,5 C = 1,2,4,5 D = 1,2,4,5,7

Jurnal Mekanikal, December 2005
109
0
50
100
150
200
250
300
350
400
450
500
0 10 20 30 40 50 60 70
Displacement (mm)
Ener
gy (N
m)
Figure 11: Energy versus displacement with types of failure modes on circular
R55 panels in static and dynamic tests In dynamic test, the input energy was calculated by the equation Ek = mv2/2, where m is the mass of the indenter and v is the impact velocity. The displacements in the static tests are the respective top skin displacement during the test while the displacements in dynamic tests are the final top skin displacements. One observation, for example, was made on the spring-back effect in the static test on square PU panel, the top skin moved upward at a distance ~10 mm after the load by the indenter was removed. In circular PU panels (see Figure 10), the first failure mode to occur under least input energy was buckling of top skin, followed by tensile and shear of cores, local indentation and wrinkling of top skins. The same failure mode required a higher input energy in dynamic tests than that of static tests. The first failure mode to occur in circular R55 panels with the least input energy was local indentation, followed by shear and tensile of cores, penetration of top skin and wrinkling of bottom skin (see Figure 11). 6.0 CONCLUSION Dynamic loading required more input energy to produce the same type of failure modes than that of static loading. The common failure modes on circular sandwich panels are local indentation, buckling of top skin, shear and tensile of cores, penetration of top skin, delamination of top or bottom skin and wrinkling of bottom skin. The behaviour of the circular sandwich panels under dynamic loadings depends on the property of the core materials. The two different core materials gave different performance under dynamic loading compared with static data. For circular PU panels, the dynamic loading gave higher maximum load than static loading however for circular R55 panels, the opposite way was showed,
A
B
C
Dynamic tests
D
E
3
4
Static test
67
Notes on failure modes: 1 Local indentation 2 Buckling of top skin 3 Penetration of top skin 4 Shear of cores 5 Tensile of cores 6 Delamination of skin 7 Wrinkling of bottom skin Notes on dynamic tests: A = 1 B = 1 C = 1,4,5 D = 1,4,5 E = 1,3

Jurnal Mekanikal, December 2005
110
higher in static cases. Successful design on sandwich panels has to consider the type of core, skin and load to withstand either the static or dynamic loading.
REFERENCES
1. Librescu, L. and Hause, T., (2000), “Recent developments in the modelling and behaviour of advanced sandwich constructions: A survey”, Composite Structure 48, 1-17.
2. Allen, H.G., (1969), Analysis and Design of Structural Sandwich Panels, Pergamon Press, Oxford, UK.
3. Rhodes, M.D., (1975), “Impact fracture of composite sandwich structures”, 16th Structure, Structural Dynamics and Materials Conference, AIAA paper No. 75-748, Denver.
4. Steinmann, A.E., (1977), “Damage tolerance of thin skin sandwich panels”, In AFML-TR-76-185, Air Force Materials Lab, Wright-Patterson AFB.
5. Bernard, M.L., (1987), “Impact resistance of composite sandwich plates”, 2nd Technical Conference of the American Society of Composites, Newark.
6. Shih, W.K. and Jang, B.Z., (1989), “Instrumental impact testing of composite sandwich panel”, J. Reinforce Plastic Composites 8, 270-278.
7. Sun, C.T. and Wu, C.L., (1991), “Low velocity impact response of composite sandwich panels”, 32th AIAA/ASME/ASCE/AHS/ASC Structure, Structural Dynamics and Materials Conference, 1123-1129.
8. Wu, C. L. and Sun, C. T., (1996), “Low velocity impact damage in composite sandwich beams”, Composite Structures 34, 21-27.
9. Mines, R.A.W., Worrall, C.M. and Gibson, A.G., (1998), “Low velocity perforation behaviour of polymer composite sandwich panels”, Int. J. of Impact Engineering, 855-879.
10. Kenny, J.M. and Torre, L., (1999), “Impact testing and simulation of sandwich structures”, 44th Int. SAMPE Symposium, 2368-2381.
11. Hazizan, M.A. and Cantwell, W.J., (2002), “The low velocity impact response of foam-based sandwich structures”, Composites: Part B 33, 193-204.
12. Hazizan, M.A. and Cantwell, W.J., (2003), “The low velocity impact response of an aluminium honeycomb sandwich structure”, Composites: Part B 34, 679-687.
13. Roach, A.M., Evans, K.E. and Jones, N., (1998), “The penetration energy of sandwich panel elements under static and dynamic loading. Part I”, Composite Structures 42, 119-134.
14. Roach, A.M., Evans, K.E. and Jones, N., (1998), “The penetration energy of sandwich panel elements under static and dynamic loading. Part II”, Composite Structures 42, 135-152.
15. Hoo Fatt, M.S. and Park, K.Y., (2001), “Dynamic models for low-velocity impact damage of composite sandwich panels – Part A: Deformation”, Composite Structures 52, 335-351.
Jurnal Mekanikal, December 2005
111
16. Hoo Fatt, M.S. and Park, K.Y., (2001), “Dynamic models for low-velocity impact damage of composite sandwich panels – Part B: Damage initiation”, Composite Structures 52, 353-364.
17. Xu, L.R. and Rosakis, A.J., (2002), “Impact failure characteristics in sandwich structures. Part I: Basic failure mode selection”, Int. J. of Solids and Structures 39, 4215-4235.
18. Xu, L.R. and Rosakis, A.J., (2002), “Impact failure characteristics in sandwich structures. Part II: Effects of impact speed and interfacial strength”, Int. J. of Solids and Structures 39, 4237-4248.
19. Yu. J.L., Wang, X., Wei, Z.G. and Wang, E.H., (2003), “Deformation and failure mechanism of dynamically loaded sandwich beams with aluminium-foam core”, Int. J. of Impact Engineering 28, 331-347.
20. Nguyen, M.Q., Jacombs, S.S., Thomson, R.S., Hachenberg, D. and Scott, M.L., (2005), “Simulation of impact on sandwich structures”, Composite Structures 67, 217-227.
21. Aktay, L., Johnson, A.F. and Holzapfel, M., (2005), “Prediction of impact damage on sandwich compote panels”, Computational Science 32, 252-260.
22. Alias, A., (1993), Mechanical Behaviour of Sandwich Panels under Static and Dynamic Loading, M.Sc Thesis, UMIST, UK.