behaviour and fate of soluble silver added to soils › dspace › bitstream › ...chapter 1...
TRANSCRIPT

Behaviour and fate of soluble silver added to soils
A thesis submitted to the University of Adelaide
In fulfilment of the requirements for the degree of Doctor of Philosophy
LARA SETTIMIO
School of Agriculture, Food and Wine
University of Adelaide
23rd October 2014

TABLE OF CONTENTS
ii
Abstract …………………………………………………………………..……… iv
Declaration ………………………………………………………………………. vii
Acknowledgements ……………………………………………………………… viii
Structure of this thesis ………………………………………………………….. ix
Publications arising from this thesis……………………………………………. x
Chapter 1. Review of the literature ……………………………………………. 1
Introduction……………………………………………………………………….. 3
Environmental chemistry of silver………………………………………………... 5
Geochemical occurrence………………………………………………….. 5
Chemical properties and reactivity……………………………………….. 6
Sources of silver into environment………………………………………... 9
Mining…………………………………………………………….. 9
Silver scrap waste…………………………………………………. 10
Wastewater treatment……………………………………………... 10
Biological reaction and effects of silver…………………………………………... 11
Antibacterial mechanism………………………………………………….. 12
Toxicity and Uptake……………………………………………………….. 13
Microorganisms…………………………………………………… 13
Plants ……………………………………………………………... 14
Invertebrates………………………………………………………. 15
Behaviour and fate of soluble silver in soil……………………………………….. 19
Sorption…………………………………………………………………… 19
Partitioning……………………………………………………………….. 21
Lability…………………………………………………………………….. 24
Ageing……………………………………………………………………... 25
Complexation between Ag+ and soil DOM……………………………….. 27
Methods for assessing the availability, speciation and fate of Ag in soils………... 29
Chemical extraction techniques…………………………………………... 30
Isotopic dilution…………………………………………………………… 32
Solid phase speciation by X-ray absorption near edge structure
spectroscopy………………………………………………………………. 35
Spectroscopic characterisation of soil DOM……………………………... 36
Objectives of this research………………………………………………………... 38

TABLE OF CONTENTS
iii
References………………………………………………………………………… 39
Chapter 2. A method to determine silver partitioning and lability in soils….. 45
Abstract…………………………………………………………………… 49
Introduction……………………………………………………………….. 49
Materials and methods…………………………………………………….. 50
Results and discussion…………………………………………………….. 52
Conclusions……………………………………………………………….. 55
References………………………………………………………………… 56
Supporting Information…………………………………………………… 58
Chapter 3. Fate and lability of silver in soils: effect of ageing………………... 59
Abstract…………………………………………………………………… 63
Introduction……………………………………………………………….. 63
Materials and methods…………………………………………………….. 64
Results and discussion…………………………………………………….. 65
References………………………………………………………………… 68
Chapter 4. Complexation of silver and dissolved organic matter in soil water
extracts…………………………………………………………………………… 71
Abstract…………………………………………………………………… 75
Introduction……………………………………………………………….. 75
Materials and methods…………………………………………………….. 79
Results and discussion…………………………………………………….. 88
Conclusions……………………………………………………………….. 100
References………………………………………………………………… 102
Supporting Information…………………………………………………… 106
Chapter 5. Summary, conclusions and future research priorities……………. 111
Development of a method to measure partitioning and lability of silver in
soils………………………………………………………………………... 114
Effect of ageing on the fate and lability of silver in soils ………………… 117
Complexation of silver and dissolved organic matter in soil water
extracts…………………………………………………………………….. 118
Conclusions……………………………………………………………….. 121
Future research directions...………………………………………………. 122
References………………………………………………………………… 125

ABSTRACT
iv
Silver (Ag) and silver nanoparticles (AgNPs) are increasingly being used in solar
energy production, water purification, medicine and applications of nanotechnology.
The antibacterial properties of Ag and AgNPs are the key reason for their addition to a
range of consumer products. But these properties also represent a potential risk when
Ag and or AgNPs are released into the environment by loss during mining processes,
disposal of consumer and industrial products to wastewater, the residues of which
(biosolids) are directly applied to land, and through application of Ag containing
pesticides. Once in the soil environment, Ag (including Ag released from AgNP) may
partition itself between the solid and liquid phases. But only a fraction of the total Ag
concentration in soil may be in a labile or available form. The speciation and fate of Ag
in soils will also be important for understanding what influences the amount of labile
metal available for uptake by soil dwelling organisms.
This thesis presents the partitioning and lability of Ag added to a wide range of soils by
measurement of the partition coefficient (Kd value) and concentration of labile metal
(E-value) using an isotope dilution method. This initial method development, which
was optimised for Ag, provided the basis for further evaluation of the long term aging
of Ag and its impact on the labile metal pool, speciation of Ag over time and the
significant interactions between Ag and dissolved organic matter (DOM).
An isotopic dilution method to simultaneously measure the Kd-value and E-value of Ag
in soils was developed using the 110mAg radioisotope. E-values were corrected for
possible interferences from non-isotopically exchangeable Ag associated with soil
colloids in suspension (Er-value). Measurement of Kd values for Ag in a range of soils
indicated strong partitioning to the solid phase is positively associated with soil cation-

ABSTRACT
v
exchange capacity or total organic carbon and pH. Measurements of labile Ag after a
two week incubation period indicated rapid conversion of soluble Ag into non-
isotopically exchangeable forms, either irreversibly adsorbed or precipitated in the soil.
This indicated that measurements of labile Ag will be important to estimate toxicity
risks to soil organisms or to predict bioaccumulation through the food chain.
The fate and lability of added soluble Ag in soils over time was examined by isotopic
dilution and the solid-phase speciation of Ag by X-ray absorption near edge structure
(XANES) spectroscopy. After two weeks of ageing the E-values for Ag decreased by
20-90% with a further decrease of 10-40% after six months. The overall decrease in
labile Ag for all soils after the six month ageing period was 50-100%. The ageing was
more rapid and pronounced in the alkaline soils. XANES results for Ag in soils
indicated that for the majority of soils the added Ag+ was reduced to metallic Ag over
time, and associations with Fe-oxohydroxides and reduced S groups in organic matter
also decreased Ag lability. Strong positive correlations were found between metallic
Ag and non-labile Ag and between organic carbon and Ag bonded with S species.
There remains uncertainty in important aspects of Ag speciation in soils. In particular,
the complexation of Ag+ with dissolved organic matter (DOM) appears complicated. It
is not known whether DOM quality or quantity is more important. Complexed Ag
across a wide range of soil water extracts with natural varying concentrations of
dissolved organic carbon (DOC) was measured and was normalized to DOC
concentration in order to observe differences in DOM affinity or strength of
complexation with Ag+. Characterization of the DOM in the soil water extracts, was
also carried out by size fractionation and elemental analysis, and spectroscopic analysis

ABSTRACT
vi
using UV-Visible, fluorescence and mid infra-red. Then using statistical analysis these
qualities of DOM were used to explain the amount of complexed Ag measured in the
soil water extracts. Overall the results indicated that up to 70% of Ag was strongly
complexed in solution. The variability in Ag+ binding by DOM across different soils
was most closely related (R2= 0.8) to the MIR spectra of the extracts. The normalised
Ag complexation values indicated that humic content and overall aromaticity increased
Ag’s affinity to DOM. Spectroscopic information from UV-Visible, mid infra-red and
fluorescence spectroscopy was also shown to potentially be more useful in measuring
and characterizing DOM than only chemical measurements. Silver’s demonstrated
affinity and ability to complex with DOM could result in increased mobilization of this
metal in the soil environment.

DECLARATION
vii
This work contains no material which has previously been accepted for the award of
any degree or diploma in any university or other tertiary institution and, to the best of
my knowledge and belief, contains no material previously published or written by any
other person, except where due reference has been made in text.
I give consent to this copy of my thesis when deposited in the University Library, being
made available for loan and photocopying, subject to the provisions of the Copyright
Act 1968.
The author acknowledges that copyright of published work contained within this thesis
(as named in “Publications arising from this thesis”) resides with the copyright
holder(s) of those works.
I also give permission for the digital version of my thesis to be made available on the
web, via the University’s digital research repository, the Library catalogue, the
Australian Digital Theses Program (ADTP) and also through web engines, unless
permission has been granted by the University to restrict access for a period of time.
Lara Settimio Date

ACKNOWLEDGEMENTS
viii
Firstly, I would like to thank my supervisors, Mike McLaughlin, Jason Kirby and Kate
Langdon for their guidance and support. They have all inspired me to maintain
scientific excellence and integrity in developing, conducting and communicating my
research. I am grateful for the considerable time and effort they have spent helping me
to complete this project and supporting me through the wonderful opportunities I have
experienced throughout my candidature.
I am particularly grateful for the assistance given by my collaborators and colleagues,
for giving me opportunities to learn and develop new skills and broaden my scientific
knowledge. I also acknowledge and thank Cathy Fiebiger, Gill Cozens, Bogumila
Tomczak and Claire Wright for always providing me with expert technical assistance.
I would like to acknowledge the generous funding I have received from the CSIRO
Minerals Down Under Flagship, Australian Federation of Women – South Australia
Branch and the Australian Land and Groundwater Association to support my travel to
international conferences and an overseas laboratory stay.
Heartfelt thanks goes to all my Soils Research Group colleagues for creating a
supportive and happy environment and especially to Courtney, Daniela and Cuicui for
sharing an office with me and all the trials and tribulations that presented themselves
along the way. I am also grateful for the support of my family and close friends who
supported me and always knew when it was time for me to take a break and enjoy
myself.
Lastly, very special thanks go to Stel, for always keeping me on track, inspiring me and
for knowing when to distract me. Thank you for your endless support and
encouragement.

STRUCTURE OF THIS THESIS
ix
This thesis is presented as a combination of papers that have been published or
submitted for publication.
Chapter 1 provides an overview of the literature on environmental chemistry of silver,
reactivity and behaviour in soils and methods for the determination of available silver.
This chapter also includes the proposed objectives of the research presented in this
thesis.
Chapter 2 comprises a paper published in Environmental Chemistry. It describes the
development of an isotope dilution method for the measurement of partitioning and
lability of silver in soils.
Chapter 3 comprises a paper published in Environmental Pollution. It describes an
ageing experiment to determine the long term fate and availability of silver in soils. It
combines chemical lability measurements with solid phase speciation data collected by
X-ray absorption near edge structure spectroscopy.
Chapter 4 comprises a paper that has been submitted for publication in Environmental
Pollution. It describes an isotope labelling and cation exchange resin experiment to
examine the complexation between complexed silver ions and dissolved organic matter
in soil solutions.
Chapter 5 provides a synthesis of the findings contained in this thesis and includes
recommendations for future work.

PUBLICATIONS ARISING FROM THIS THESIS
x
Settimio, L., McLaughlin, M.J., Kirby, J.K., Langdon, K.A., 2014. A method to
determine silver partitioning and lability in soils. Environmental Chemistry 11, 63-71.
Settimio, L., McLaughlin, M.J., Kirby, J.K., Langdon, K.A., Lombi, E., Donner, E.,
Scheckel, K.G., 2014. Environmental Pollution 191, 151-157.

CHAPTER 1
REVIEW OF THE LITERATURE
1

2

1. Introduction
Silver (Ag) is a precious metal that is actively mined to supply 75% of the total world
demand for Ag (30,000 t) (Thomson Reuters GFMS 2013). The highest demand is for
industrial applications, a direct result of the desirable properties of Ag: strength,
malleability and ductility, electrical and thermal conductivity, sensitivity to and high
reflectance of light and the ability to endure extreme temperature ranges.
The strong antibacterial properties of Ag have resulted in its increasing addition to a
range of readily available consumer products, as both ionic Ag (Ag+) and in the form of
Ag nanoparticles (AgNPs) (Morones et al. 2005; Benn et al. 2010). Examples of
consumer products containing Ag+ and AgNPs include personal hygiene products,
textiles, plastics, and electrical items. The antibacterial properties of Ag+, and Ag+
released from AgNPs, may pose a risk to the terrestrial environment. The release of Ag
to the terrestrial environment can occur during mining processes but the major
contamination pathway is from urban areas (e.g. consumer products and industries)
through wastewater treatment plants (WWTPs), predominately via land application of
biosolids (Johnson et al. 2005; Oliver et al. 2005).
The presence of Ag+ in the terrestrial environment is of concern due to its potential
toxicity to a range of biota such as microorganisms, plants and invertebrates living in
the soil (Ratte 1999). It is well established for metal contaminants in soils that the total
metal concentration is often a poor measure of the bioavailable metal fraction (Hamon
et al. 2008). In soils, there are many processes or transformations of metals that can
take place, for example sorption, partitioning and ageing, that can result in changes in
metal bioavailability and toxicity (Degryse et al. 2009; Tack 2010). Although these
3

processes have been well studied for many other metals (e.g. cadmium (Cd), copper
(Cu), nickel (Ni), lead (Pb) and zinc (Zn)), to date there is little known about how these
processes affect the bioavailability of Ag in soils.
Previous studies of sorption and desorption of Ag in soils found the controlling factors
to be soil organic matter (SOM) or humus materials via complexation or exchange
mechanisms (Jacobson et al. 2005). There is limited information on partitioning of Ag
in soils, but one recent study found that it was strongly influenced by pH, clay content,
organic matter content and chloride concentration (Cornelis et al. 2012). The effect of
SOM on partitioning was further highlighted when the concentration of free Ag+ ion in
soil solution was found to be lower for a soil with high organic matter content
compared to a soil with lower organic matter content (Benoit et al. 2013). The
conclusions from these studies investigating Ag+ have been further supported by
studies investigating the behaviour of AgNPs in soils. A comparison of different AgNP
coatings (citrate stabilised and uncoated) and soluble Ag (as AgNO3), found all Ag
types examined to be more mobile in a mineral soil compared to an organic matter rich
soil (Coutris et al. 2012). In this study, after two days, only trace concentrations of Ag
were extractable from the soil. After five weeks for the uncoated AgNPs, the
bioaccessible form was eight to nine times greater than the AgNO3 and citrate-
stabilised AgNP treatments. These results indicate that longer term ageing reactions are
taking place over time and that differences in nanoparticle coating may also influence
the fate of Ag, aside from soil properties. In another study, ageing for Ag and AgNPs
was found to increase in soils following additions of sewage sludge, which tends to be
relatively high in SOM (Whitley et al. 2013).
4

To fully understand the behaviour and fate of Ag in the terrestrial environment, its
chemical nature needs to be understood. This review summarises the environmental
chemistry of Ag relevant to soils, the exposure routes of Ag to the terrestrial
environment, the biological effect of Ag to soil dwelling organisms, the soil processes,
mechanisms and reactions that control the behaviour and fate of Ag in soil. In addition,
it outlines the methods available to measure the bioavailable fraction of Ag in soils as
well as characterising the speciation and interactions of Ag with various soil
components.
2. Environmental chemistry of silver
2.1 Geochemical occurrence
Silver is a rare, naturally occurring element found in the earth’s crust (Evans and
Barabash 2010) with average concentrations ranging from 0.1 to 0.2 mg kg-1 (Petering
and McClain 1991; Kabata-Pendias and Mukherjee 2007). Silver is often found with
compounds containing arsenic (As), bismuth (Bi), sulfur (S), antimony (Sb), selenium
(Se), tellurium (Te) and is widely distributed as minerals such as argentite (Ag2S),
cerargyrite (AgCl), Ag arsenide (Ag3As), pyrargyrite (Ag3SbS3), proustite (Ag3AsS)
and native metallic Ag (Petering and McClain 1991; Evans and Barabash 2010). Such
compounds often have a metallic lustre, are semi-conductors and can be found as
impurities in ores of Cu, Pb and Zn. Trace concentrations may be present in sulfide
minerals such as sphalerite (ZnS), pyrite (FeS2), chalcopyrite (CuFeS2) and galena
(PbS). In soils, the geochemical occurrence of Ag is between <0.01 to 5 mg kg-1 with
most reported values below 0.1 mg kg-1 (Purcell and Peters 1998; Evans and Barabash
2010). Silver has two naturally occurring stable isotopes 107Ag and 109Ag with
abundances of 48% and 52% respectively (Petering and McClain 1991).
5

2.2 Chemical properties and reactivity
Silver is a group 11 element in the periodic table with gold (Au) and Cu. Silver has an
atomic mass of 107.87 M, an electronic configuration of [Kr]4d105s1, a density of 10.5
g cm-3, a melting point of 960 oC and a boiling point of 2170 oC (Petering and McClain
1991; Elvers et al. 1993). As a transition metal, Ag has coordinating properties,
commonly forming linear complexes with a coordination number of two (Petering and
McClain 1991; Evans and Barabash 2010). There are four oxidation states of Ag; 0, +1,
+2 and +3, with 0 and +1 the most common valences found in nature (Lindsay 1979;
Etris 1997).
The Ag ion is a soft metal cation and tends to complex soft bases (Evans and Barabash
2010). Soft and hard acid and base theory can predict metal bond formation and is
useful for understanding the complexation of metal ions in soils (Wolt 1994; Evangelou
1998). As explained by Pearson (1963) the characterization of soft, hard or borderline
‘Lewis acids or bases’ is decided by ion electronegativity, ion polarizability and
oxidation potential. For Ag+, a soft ‘Lewis acid’, it is characterised by its relatively
small size, low electronegativity and high polarizability. Hence, Ag is highly
chalcophilic and has a strong affinity for S. Silver also forms strong multihalide
complexes at relatively low halide concentrations which predominate over a large pH
range (Evans and Barabash 2010). These multihalide complexes can be soluble e.g.
[AgCl4]3- (Jacobson et al. 2005).
Silver will bind strongly with inorganic and organic S groups with high formation
constants (log K) for inorganic sulfides ranging from 14 to 21 and organic S from 12 to
15 (Evans and Barabash 2010). With such a strong affinity for S, Ag should
6

outcompete most other metals for the available sulfide ions (mercury (Hg)2+ > Ag+ >
Cu+ > Pb+ > Zn2+) (Adams and Kramer 1998). As a result (with the exceptions of Cu+
and Hg2+), Ag can rapidly sorb onto and into colloidal or particulate sulfides even at
low nanomolar concentrations to form Ag2S(s) (Bell and Kramer 1999). With sufficient
Ag+ and S present, Ag2S(s) will be the ultimate product formed since other transition
metals will be displaced. Silver and inorganic S chemistry is described by Bell and
Kramer (1999) as being mononuclear (AgLn) or polynuclear (AgmLn) where L = HS-,
S2- and HS. In this model, under the usually low concentration of Ag+ in natural
solutions, the predominance of various complexes increases from simple
(mononuclear) to polynuclear with increasing concentrations of Ag+ and S2-. Adams
and Kramer (1998) also demonstrate Ag’s affinity for S showing the ability for Ag+ to
adsorb rapidly onto to amorphous FeS.
Precipitates formed by Ag include AgCl(s) and Ag2S(s) which are common in oxidising
and anaerobic environments, respectively (Evans and Barabash 2010). The formation
of these precipitates will be dependent on the relative amounts of chloride and sulfide
in the given system. The Ag+ ion is well known to form a range of insoluble
compounds with the halides (Br-, Cl-, F-, I-) as well as sulfates and sulfides as
previously mentioned (Jacobson et al. 2005). In some cases, the concentrations of these
halides and sulfates may be too low for such complexes to precipitate from solution.
Alternatively, at very high concentrations of Cl- e.g. during aqua regia soil digestion,
the opposite occurs, where Ag remains solubilised as multihalide complexes: AgCl2-,
AgCl32- or AgCl4
3-.
7

Redox chemistry is highly relevant to the behaviour and reactivity of Ag. Given the
common oxidation states of Ag are +1 and 0 in most natural waters and soil, the
standard electrode potential for the Ag+/Ag0 couple is calculated as 0.799 V (Evans and
Barabash 2010). This can be compared to other important electrochemical reactions
occurring in soil and their corresponding redox potentials such as O2/H2O, NO3/NO2,
MnO2/Mn2+ and Fe(OH)3/Fe2+ with Eh of 0.82, 0.54, 0.41 and 0.17 V, respectively.
Given the highly positive value of the redox potential for Ag+/Ag0 in comparison to
these other redox couples, in aerobic soil environments, Ag would be found present in
soils solutions as Ag+ (Figure 1). The pH of the soil solution and redox potential (Eh)
directly and indirectly influence all chemical processes in soil (Tack 2010),
consequently influencing the chemical behaviour of trace elements such as Ag. Figure
1 shows an Eh - pH diagram for the Ag-S-O-H system and demonstrates that in the
presence of sulfide ions, Ag can precipitate as Ag2S(s), especially in anoxic systems
where sulfides may control speciation, at pH < 6. Metallic Ag(s) dominates a large
portion of the diagram under reducing conditions at pH > 6. In aerobic environments
(high Eh values) Ag oxidises to Ag+ in the pH range commonly found in most soils
(e.g. pH 4-8).
Figure 1. Eh- pH diagram for the system Ag-S-O-H (Evans and Barabash 2010).
8

2.3 Sources of silver into the environment
The unique properties of Ag include strength, malleability and ductility, electrical and
thermal conductivity, sensitivity to and high reflectance of light, the ability to endure
extreme temperature ranges and antimicrobial activity. As a result, applications of Ag
range from traditional (coinage, silverware), industrial (bearings, catalysts), medicinal
(wound dressings), environmental (solar energy, water purifications) and agricultural
(biocides and pesticides) (Elvers et al. 1993; The Silver Institute 2011; Innovotech
2014). Silver and increasingly AgNPs are now minor or major constituents in a range
of consumer products including textiles, electrical appliances, personal hygiene
products, cosmetics and plastics (Nowack et al. 2011).
2.3.1 Mining
Silver is actively mined with the most recent World Silver Survey reporting mine
supply was 22,000 t in 2012 (Thomson Reuters GFMS 2013). The top two producing
countries are Mexico and Peru, a result of Pb/Zn operations. During the mining
process, specific losses of Ag to the environment occur via tailings, slag, smelting, dust
and leachates (Eckelman and Graedel 2007). It is estimated by Eckelmen and Graedel
(2007) that the total global losses of Ag to the environment were more than 1.3 x 10⁷ kg
annually with tailings and landfills accounting for three-quarters of the total amount.
During Ag extraction, it is estimated that 20% of Ag is returned as tailings to the
lithosphere (Johnson et al. 2005). This is unfavourable because wind and water can
transport contaminated material into the soil environment. Mine tailings can have high
concentrations of metals, low concentrations of plant nutrients and unusual pH values
(Cano-Resendiz et al. 2011). Silver is commonly mined as a by-product from the
9

extraction of Au, Cu, Pb, tin (Sn) and Zn ores (Petering and McClain 1991; Elvers et al.
1993) and this contributes to the high percentage of Ag in mine tailings.
During the mining and milling process there is a fraction of Ag that can become
airborne as dust particles, which contribute to the source of Ag air emissions
(Eckelman and Graedel 2007). Other sources of Ag air emissions are primarily
particulates formed during ore processing and burning of fossil fuels, especially coal
(Purcell and Peters 1998). The methods of Ag separation after extraction results in Ag
losses as follows: 10% for tank leaching, 11% for thiosulfate leaching, 63% for heap
leaching, 0.12% for smelting and 0.02% lost in slag during the refining process
(Johnson et al. 2005).
2.3.2 Silver scrap waste
Approximately one fifth of Ag production comes from recycling of used and unwanted
Ag scrap including silverware, jewellery, photographic chemicals, and computers
(Evans and Barabash 2010). Silver waste is generated from commercial uses such as
photographic processing and is often discharged to urban treatment plants. The
photographic industry contributed 26% of the total Ag disposed to land in 1978 (Purcell
and Peters 1998). This has now almost ceased due to developments and widespread use
of digital photography.
2.3.3 Wastewater treatment
In urban areas, there is the potential for Ag to enter wastewater treatment plants
(WWTPs) via the sewage system, as a result of the use and disposal of consumer
products containing Ag. An additional input of Ag into WWTPs is through inputs of
10

industrial wastes from facilities producing such consumer products. Urban wastewaters
are treated at WWTPs to remove impurities and contaminants so that the remaining
liquid fraction, referred to as effluent, can be reused (e.g. through irrigation) or released
into surface waters (Di Bonito 2008). During the wastewater treatment process, the
solid fraction (sewage sludge) is separated from the liquid fraction and treated by a
combination of physical, chemical and biological processes. The term biosolids refers
to sewage sludge that has been treated via these processes to reduce pathogens and
volatile organic matter. Biosolids tend to have high organic carbon content and high
nutrient loads and therefore can be applied to land as a fertiliser. During wastewater
treatment processes, a large proportion of the Ag+ or AgNPs present is likely to be
associated with the solid fraction. Silver can become concentrated in biosolids due to
its strong affinity to S and organic carbon and under the reduced and S-rich
environment, results in the formation of Ag sulfides (Kim et al. 2010). As a result,
these biosolids may contain elevated concentrations of Ag from 1 to 6 mg kg-1
(Gottschalk et al. 2009) and are a direct route of transfer for Ag into the soil
environment.
3. Biological reactions and effects of silver
Silver when in its ionic form (Ag+) is one of the most toxic metal contaminants,
surpassed only by mercury (Hg) (Ratte 1999). This is attributed to the antibacterial
mechanism of the Ag+ ion. Aside from bacteria, Ag+ has also been found to exhibit
toxicity to other microorganisms, plants and invertebrates. Although Ag+ has been
found to show a high degree of toxicity to organisms, transformations of this ion by
reactions with various soil components may alter its bioavailability and toxicity to
terrestrial organisms.
11

3.1 Antibacterial mechanism
The singly charged cation, Ag+, is directly responsible for the antibacterial,
antifungicidal and antimicrobial action of Ag. There may however be differences
between these mechanisms for Ag and AgNPs since the nanometer size may interact
with the cell differently to Ag+. The main mechanism is thought to be the interaction of
Ag+ with the thiol groups of vital enzymes rendering them inactive (Percival et al.
2005). The Ag+ ion may also target other SH groups within the cell. Evidence suggests
that bacterial DNA loses its ability to replicate upon exposure to Ag+. Structural
changes in cell membranes and formation of small electron-dense granules of Ag and S
also contribute to the bactericidal mechanism of Ag (Russell and Hugo 1994). Overall
it is the surface binding and damage to the membrane that are fundamental to the toxic
action (Percival et al. 2005).
The mechanism of toxicity of AgNPs to gram-negative bacteria was found to occur by
1-10 nm size NPs attaching to the cell membrane and disrupting permeability and
respiration. The NPs are able to penetrate into the cell where they interact with S- and
P-containing compounds like DNA and finally by release of Ag+ (Morones et al. 2005).
A recent study also attributed the release of Ag+ (responsible for the toxic effect on
Arthrobacter globiformis bacteria) from AgNPs to particle size, surface area or whether
the NPs were in metallic or oxide form (Engelke et al. 2014). The EC50 values for
inhibition of Arthrobacter globiformis dehydrogenase activity with and without soil are
reported in Table 1.
12

3.2 Toxicity and Uptake
Aside from bacteria, the Ag+ ion is highly toxic to a range of organisms, including
other microorganisms, plants and invertebrates (Ratte 1999). In soil environments, the
ionic form of Ag is expected to interact with the surrounding matrix altering its
speciation and potentially making it less bioavailable and therefore less toxic. The
toxicity of a metal must be assessed experimentally usually by acute, chronic or long-
term toxicity tests. To quantify toxicity, an effect threshold that corresponds to the
percentage of a population that is affected for a given endpoint (e.g. mortality or
reproduction) is often determined. Common measures of toxicity include the LC50
(lethal concentration for 50% of test organisms) and EC50 (effective concentration for
50% of test organisms). Toxicity can also be quantified by using hypothesis-based
testing, for example the no observable effect concentrations (NOEC), which is equal to
the highest test concentration that produces a response that is not significantly different
from the control, and the lowest observable effect concentrations (LOEC), which is the
lowest concentration that produces a response that is significantly different from the
control.
3.2.1 Microorganisms
Assessing the effects of trace metals on soil microorganisms can include a combination
of microbial activities, population measurements and a consideration of kinetics of the
investigated process (Johansson et al. 1998). In soils there is evidence for Ag’s
inhibitory effects on nitrification, denitrification, respiration and activities of soil
exoenzymes (Johansson et al. 1998; Throback et al. 2007; Langdon et al. 2012; Shin et
al. 2012). In particular, the toxicity of Ag+ to nitrification processes across a range of
soils was found to vary by several orders of magnitude depending on soil type, with a
13

stimulatory response observed at lower concentrations (Langdon et al. 2014). Soil pH
and organic carbon were the most influential properties mitigating toxicity changes in
these properties and were found to account for approximately 90% of the variability in
the toxicity data. The EC50 values are reported in Table 1.
3.2.2 Plants
Plants are known to absorb nutrients through their roots from the soil solution and can
take up metals in the same way. The uptake mechanisms for many metals are poorly
understood. It is unlikely that plants have developed specific uptake mechanisms for
non-essential metals such as Ag (McLaughlin et al. 2000). The uptake mechanism for
non-essential metal contaminants would be across the root membrane as a substitute for
nutrients using the same transport mechanisms or through breaks in the endodermal
barrier at sites of lateral root initiation or root apices (McLaughlin et al. 2000).
Silver uptake has been investigated for a variety of higher plant species using soluble
Ag and AgNPs treatments. In some cases, plants have been shown to internally
transform soluble Ag up taken from roots into metallic AgNPs, for example the uptake
of Ag+ by Brassica juncea grown hydroponically resulted in reduction of Ag+ to
AgNPs at sites of high reducing sugars (fructose and glucose) in plant chloroplasts
(Beattie and Haverkamp 2011). Another study showed that alfafa sprouts were able to
uptake Ag(0) NPs from an agar medium (Gardea-Torresdey et al. 2003). The effects of
soluble Ag and AgNPs with different coatings have been assessed for Lolium
multiflorum and other common wetland plant species (Yin et al. 2011; Yin et al. 2012).
Overall there is reduced growth from both forms of Ag but this varies for species and
the effect of AgNP properties like coating or size. Toxicity endpoints that are
14

commonly measured for plants include inhibition of germination, root growth and
overall decrease in biomass. Roots are generally more sensitive than shoots. The uptake
of soluble Ag (as AgNO3 and AgSO4) has been shown to decrease biomass of wheat
seedlings and inhibit rhizosphere proteins and uptake of nutrients and trace elements
(Shtangeeva et al. 2011).
Toxicity will be greatly influenced by other interactions in the soil environment as
demonstrated by the influence of humic and fulvic acids on Ag uptake by perennial rye
grass, which have been shown to alleviate toxicity (Jones and Peterson 1986). Plant
toxicity has been measured in a variety of microflora and higher plants. Microflora
includes marine and freshwater algal species. Some EC50 and NOEC values are
reported in Table 1 for green algae, Selenastrum capricornutum and Gymnodium sp.
The toxicity of Ag was higher (lower EC50 values) when applied in a soluble Ag form
(e.g. AgNO3 or NaAgS2O) compared with the less soluble forms such as Ag2S or AgCl.
The toxicity of Ag to cowpea seedlings determined by solution culture experiments are
also reported in Table 1 as EC50 values (Blamey et al. 2010). These results showed that
Ag was rapidly rhizotoxic to the cowpea seedlings after four hours of exposure
showing a similar effect as other trace metals: Cu and Al. Other terrestrial plants tested
include lettuce, ryegrass, radish, marigold and maize and their NOEC values are
reported in Table 1 showing lettuce to be the most sensitive and ryegrass and marigold
to be the most tolerant (Ewell et al. 1993).
3.2.3 Invertebrates
In comparison with plants and microbes, soil invertebrates have uptake routes through
the skin, the gut wall (soil ingestion), via drinking or specific organs such as the ventral
15

tubulus in springtails (Peijnenburg et al. 1997). Uptake depends largely on a particular
species, taking into account its preference for certain soil layers, whether it be weak
bodied and able to absorb through its skin or hard bodied and surface active with
uptake through the gut wall. Earthworms are considered to be a suitable test organism
and studies with Ag and AgNPs are common.
The toxicity of soluble Ag and AgNPs in an earthworm reproduction test using Eisenia
andrei was measured along with the uptake and accumulation of Ag by adult
earthworms (Schlich et al. 2013). Similar toxicities were found between soluble Ag and
AgNP treatments in the earthworm reproduction test (EC50 values are reported in
Table 1). This study found uptake of Ag from AgNPs was slightly higher than the
uptake of Ag from AgNO3. Spiked soils showed a concentration-dependent effect on
reproduction, but there was no concentration-dependent increase in the amount of Ag in
earthworm tissues. An important finding was that the inhibition seemed to reflect Ag
released into the soil pore water, which affected cocoons and juveniles in the soil rather
than uptake by the earthworms.
Another study compared the effects of soluble Ag and AgNPs on the earthworm,
Eisenia fetida (Shoults-Wilson et al. 2011). The soluble Ag treatment caused
significant reduction of growth and reproduction at 7.41±0.01 mg Ag kg−1 in the sandy
loam, where reproduction was less sensitive at a concentration of 94±3 mg Ag kg−1 in
an artificial soil (relatively higher CEC, organic matter and clay content than the sandy
loam). In the artificial soil, significant reproductive toxicity was only observed in
organisms exposed to the AgNPs at concentrations approximately eight times higher
than those at which the effects from Ag+ were observed. Eisenia fetida exposed to
16

either AgNO3 or AgNPs in the sandy loam accumulated higher concentrations of Ag
than those exposed in the artificial soil and had higher bioaccumulation factors. These
results suggest Ag was more bioavailable in the sandy loam soil compared to the
artificial soil due to its lower CEC, organic matter and clay content. Earthworms
exposed to soluble Ag also accumulated significantly higher concentrations of Ag than
those exposed to AgNPs. It was suggested that Ag+ was responsible for the effects on
growth and development caused by exposure to AgNPs and overall their results also
suggest that soil type is a more important determinant of Ag accumulation than the
particle size of AgNPs.
17

Table 1. Examples of silver toxicity data for bacteria, microbes, plants and soil
invertebrates
Test organism Medium EC50 NOEC Reference
Bacteria/Microbes
Soil nitrification
processes
Soil 0.43 - >640 mg
kg-1
Langdon et al
(2014)
Basal respiration Soil 61 mg kg-1 15 mg kg-1 Johansson et al
(1998)
Arthrobacter
globiformis
(dehydrogenase
activity)
Soil
Solution
culture
7.9 mg kg-1
1.4 mg kg-1
Engelke et al
(2014)
Microflora
Marine algae
(Gymnodium sp.)
Solution
culture
0.002-0.01 mg L-1 Wilson and
Freeberg (1980)
Freshwater algae
(Selenastrum
capricornutum)
Solution
culture >0.13 mg L-1 10 mg L-1
Schmittschmitt et
al (1996), Ewell
et al (1993)
Terrestrial plants
Vigna unguiculata
[L.] Walp. cv.
Caloona (Cowpea)
Solution
culture
0.0011-0.0023
mg L-1
Blamey et al
(2010)
Lactuca sativa
(Lettuce)
Soil
0.75-771 mg L-1
(germination) Ewell et al (1993)
Lolium perenne
(Ryegrass)
Soil
75-771 mg L-1
(germination) Ewell et al (1993)
Rhaphanus sativas
(Radish)
Soil
7.5-771 mg L-1
(germination) Ewell et al (1993)
Tagetes patula
(Marigold)
Soil
75-771 mg L-1
(growth) Ewell et al (1993)
Zea mays (Maize) Soil
7.5-771 mg L-1
(growth) Ewell et al (1993)
Soil Invertebrates
Earth worm
(Eisenia andrei)
Soil 15-84 mg kg-1 <15 mg kg-1
Schlich et al
(2013)
18

4. Behaviour and fate of soluble silver in soil
There are a number of reactions or processes that soluble Ag may undergo once it is
introduced into the soil environment. Transformations of Ag+ in the soil may heavily
impact the bioavailability of this contaminant. Importantly a measure of the total
exchangeable metal fraction in soils is desirable to quantitatively assess the availability
of Ag and how this may change with time. The speciation of Ag in soil and interactions
with soil components like dissolved organic matter (DOM) also provide valuable
information on what controls Ag+ availability in soils.
4.1. Sorption
Sorption is the general term for the partitioning of a solute from an aqueous solution to
solid phases and for soils this is the accumulation of matter at a surface without
formation of a three dimensional structure (Tack 2010). Sorption encompasses both
adsorption (solute clings to solid surfaces) and absorption (solute diffuses into a porous
solid and clings to interior surfaces) processes. For metals, sorption is important in
controlling the ion activity in the solution phase of soils. In addition, precipitation
reactions may also remove ions from the soil solution by formation of a three
dimensional structure. Precipitates commonly include oxides, oxyhydroxides,
hydroxides, carbonates, phosphates and silicates (Tack 2010). As previously
mentioned, AgCl(s) and Ag2S(s) are the most commonly formed precipitates, where
formation is highly dependent on concentrations of chloride and sulfide, respectively
(Evans and Barabash 2010). Other factors contributing to their precipitation will be the
pH and solubility products of these precipitates.
19

Sorption reactions generally control the ion activity in the solution phase. For instance,
sorption curves of Cd, Co, Cu, Ni, Pb and Zn in four soils suggested that solubility of
these metals was controlled by sorption and complexation processes, rather than
precipitation (Welp and Brummer 1999). Similarly, Cd, Cu, Pb and Zn solubilities in
moderately contaminated soils were found to be controlled by sorption reactions
(McBride et al. 1997). Silver sorption in soils has been previously modelled with
Freundlich isotherms, a soil adsorption model. Specifically the adsorption of soluble
Ag by various contaminated and uncontaminated soils were modelled (Jones et al.
1986). Evidence was found for a strong association between SOM and Ag, suggesting
that humus may control the partioning and availability of Ag in the short term. Silver
sorption at trace levels has also been evaluated using short-term and long-term sorption
isotherms generated under batch conditions for three illite-rich mineral soils (silt loam
and fine sandy loam), a peaty-muck soil drained for agricultural use, and soil minerals
(ferrihydrite and birnessite) (Jacobson et al. 2005). Silver was more strongly sorbed to
the peaty-muck soil than the mineral soils, and Ag sorption to soils was found to be
dominated by SOM either through exchange or complexation reactions.
Desorption of Ag has also been measured using illite-rich mineral soils with differing
textures and an organic peaty-muck soil (Jacobson et al. 2005). A strong cation
exchange resin (Duolite G-73) containing thiol functional groups was used to desorb
Ag from the soils. The study monitored desorption over time (one hour to four weeks)
from soils previously equilibrated with Ag+ for 24 h and up to one year. Silver could
not be effectively recovered from the resin. However, qualitatively the study found that
more Ag was desorbed after the 24 h sorption period than after a one-year period. More
Ag desorbed from the sandy soil than from the peaty-muck soil or the mineral soils
20

with higher clay contents. These results suggest Ag sorption may be a reversible
process, and that soil properties and time will play an important role in the release of
Ag.
4.2 Partitioning
The behaviour and fate of metals in soils can be described by their solid-liquid
partitioning, which is a measure of the degree of sorption. While sorption is a
mechanistic process, solid-liquid partitioning, describes the distribution of an added
metal between the soil solid phase and the soil solution. This partitioning greatly affects
metal mobility and availability in soils. The partitioning of metals in soils can be
quantified by the distribution coefficient, Kd, expressing distribution of an element
between the solid phase and solution phase (Degryse et al. 2009):
Kd = Msolid / [M] (1)
Where, Msolid is the solid phase concentration, expressed on a soil-weight basis (mg kg-
1), and [M] the (total or free ion) concentration in solution, expressed on a solution-
volume basis (mg L-1). As a result, the units for Kd are normally L kg-1.
The different mechanisms of metal partitioning in soils between solid and liquid phases
are illustrated in Figure 2, adapted from Degryse et al. (2009). Figures 2a-c are in order
of increasing mechanistic complexity. In Figure 2a, the most simple Kdtot is a measure
of the distribution of metal between solid (Msolid) and solution (Msol) phases. Figure 2b
divides the solid phase (Msolid) into Minert (cannot be released into solution, non-
exchangeble) and Mlabile (adsorbed on solid phase but exchangeable with metal in soil
solution). In this scenario, partitioning occurs between the solid and solution phases by
exchange between Mlabile and Msol, described by the Kdlab. In Figure 2c, the solution
21

phase is now separated into the free metal ion (Mn+) and metal complex (ML) in soil
solutions, showing that the free ion may form complexes with other soil solution
ligands and this complexation is reversible. The Kdlab/free represents similar partitioning
to Figure 2b, but the Mn+ concentration may change with Mn+ in equilibrium with ML.
Overall, the distribution coefficients represent the concentration ratio of total metal on
the solid phase to total metal in solution (Kdtot
), or the concentration ratios of labile
metal on the solid phase to the total metal in solution (Kdlab) or the free metal ion
(Kdlab/free). It is important to note that while Kd values imply an equilibrium, they are
operationally defined (by a set time frame and procedure) and can change over time for
example with ageing the Kd values can increase.
Figure 2. Schematic representation of the partitioning of metals in soil between the solid phase and solution, in increasing order of complexity, (a) metal on solid phase (Msolid) and metal in solution (Msol), (b) exchangeable metal (Mlabile) and Msol and (c) Mlabile and the free metal ion (Mn+) in solution (assumed to be in equilibrium with complexed metal (ML)) from Degryse et al. (2009).
Mlabile Msol Minert
Solid phase Solution
Kdlab
Msolid Msol
Solid phase Solution
Kdtot
(a) (b) (c) Mlabile Mn+ Minert ML
Solid phase Solution
Kdlab/free
22

Kd values can vary by several orders of magnitude for the same metal depending on soil
type and metal loading. For metals Cd, Cu, Pb, Ni and Zn, the Kd values have been
compiled from over 70 studies (Sauvé et al. 2000). The relationships between the
reported values to variations in soil solution pH, SOM, and the total soil metal
concentrations were investigated. Multiple linear regressions showed that the best
prediction of Kd values was achieved using empirical linear regressions with pH (R2
values of 0.29-0.58) or pH and log of SOM or log of total metal (R2 values of 0.42-
0.76). The best tool, however, was a semi-mechanistic model based on competitive
adsorption of metal and H+, where there is dependence on pH, total metal content and
log(SOM) where R2 values increased to 0.61-0.88 (except Pb: 0.35). The median Kd
values for Cd, Cu, Pb, Ni and Zn reported by Sauvé et al. (2000) were 390, 2120,
102410, 2333 and 1731 L kg-1, respectively.
Previous reports of Ag partitioning in the literature are limited. In soils, Allison and
Allison (2005) reported Kd values to range from 10-32000 L kg-1 but they do not link
these results to specific peer reviewed literature. Another study reports Kd values for
Ag in geogenic and soluble Ag treatments for 5 different soil types to be 48-212 L kg-1
and 35-1816 L kg-1, respectively (Cornelis et al. 2010). These data indicate that there is
large variability of Kd values across different soil types. This partitioning of Ag in soil
was thought to be strongly influenced by pH, clay content, organic matter content and
chloride concentration. Another recent study examining Ag partitioning in soils found
less free Ag+ ion concentrations in soil solution for soils with high organic carbon (OC)
content compared to a soils with low OC content (Benoit et al. 2013).
23

4.3 Lability
Lability refers to the metal fraction that is in rapid exchange on solid phases and in
solution (Young et al. 2005). The total ‘labile’ or ‘exchangeable’ metal fraction
consists of Mlabile adsorbed on solid phase plus the Mn+ and ML of the solution phase
(Figure 2). An E-value is a measure of this total exchangeable metal fraction in soil and
is generally considered to be the concentration of metal that is “available” and therefore
potentially taken up by soil dwelling organisms (Young et al. 2005; Hamon et al.
2008). In risk assessments for metals this is the most important metal concentration that
should be measured in the soil. The importance of E-values is that they provide
information on the availability of metals, hence they can be used to investigate various
management options like in situ remediation using soil amendments (Hamon et al.
2002; Lombi et al. 2003) and to investigate the ageing process for soil metals such as
Ag (Nakhone and Young 1993; Crout et al. 2006; Ma et al. 2006; Ma et al. 2006).
E-values are commonly expressed as a percentage of the total metal concentration of
the soil, assisting in comparison between soils, various metals and different metal
loadings of soils. An E-value can be presented as an E% value, defined as the
percentage of labile metal relative to the total concentration in the soil. The E% values
reported in the literature vary greatly and for a given metal can range from 0-100%. For
Cd, the labile fraction has been measured for a wide range of contaminated soils
(Nakhone and Young 1993). It was found that labile Cd was pH dependent and at pH >
5 approximately 5% of Cd was labile. Another study on Cd and Zn found that the E%
values ranged from 9% to 92% (mean: 61%) and from 3% to 72% (mean: 33%),
respectively (Degryse et al. 2004). For Cd there was no correlation between soil
properties and E% but for Zn, E% was negatively correlated with soil pH. This study
24

also found that the source of the contamination may control the exchangeable metal
fractions of Cd and Zn.
4.4 Ageing
When soluble metals are added to soils there are initial fast sorption reactions which
remove metals from soil solution (adsorption and precipitation), followed by slower
reactions that continue to remove metals from the exchangeable fraction. The decrease
in metal lability that occurs with time after metal addition to soil is thought to occur
through the following general mechanisms: micropore diffusion, cavity entrapment,
occlusion in solid phases by co-precipitation and co-flocculation and surface
precipitation (Kabata-Pendias and Pendias 2000; Fendorf et al. 2004; Ma et al. 2006).
These processes are generally referred to as “ageing”. As a consequence the
bioavailability and toxicity of the metal to soil organisms may decrease with time as the
bioavailability decreases.
The ageing of a range of soluble cationic and anionic metals in soils has been studied
(e.g. As, Cd, Cu, Mo, Ni and Zn) by measuring metal lability after various periods of
time up to 28 months (Fendorf et al. 2004; Crout et al. 2006; Ma et al. 2006; Ma et al.
2006; Buekers et al. 2007; Kirby et al. 2012). These studies have shown that the extent
of ageing is dependent on the soil type, soil physical and chemical properties, source
(e.g. soluble, oxides, etc.) and concentration of the metal, as well as environmental
conditions such as temperature (Barrow 1998). A study over an ageing period of 850
days was conducted with 28 soils to assess the role of iron-oxyhydroxides and
carbonates on fixation of Cu, Cd, Zn and Ni (Buekers et al. 2007). After 850 days of
ageing, the labile fraction of added metal (by calculating E-values) was averaged over
25

28 soils, with the results as follows: 57% for Cu, 59% for Zn, 59% for Ni and 72% for
Cd. The ageing observed was most pronounced in alkaline soils or in soils with
elevated concentrations of iron oxyhydroxides.
To date, little is known of the extent of ageing of soluble Ag in soils. There is a lack of
understanding regarding the solid phase speciation and lability of Ag and its ageing in
natural soils. There are a few recent studies that have examined the fate of Ag over time
but without measurement of the exchangeable metal fraction in soils. One study
compared the behaviour of three forms of Ag: soluble Ag (as AgNO3), citrate stabilised
AgNPs and uncoated AgNPs, in two soils with contrasting organic matter content
(Coutris et al. 2012). They measured binding strength over time periods of two hours,
two days, five weeks and ten weeks, followed by a sequential extraction method. A
110mAg radio-tracer was used to measure Ag through the different sequential extraction
fractions. The authors found all types of Ag to be more mobile in the mineral soil
compared to the organic matter rich soil, indicating that the organic matter content is
highly influential to Ag mobility. After two days, over 20% of the citrate stabilised
AgNPs were extractable with water for both soils (compared to 1-3% for soluble Ag
and uncoated AgNPs treatments) however, this decreased to trace levels thereafter. For
the uncoated AgNPs the extractable fraction was eight to nine times greater than the
other Ag treatments after 70 days.
In another study, soluble Ag and AgNPs (citrate and PVP coated) treatments, were
aged in un-amended and sewage sludge amended soil (1% and 3% w/w) for up to six
months. The concentrations of dissolved Ag in extracted soil pore waters in each
treatment were then determined (Whitley et al. 2013). For the soluble Ag treatment,
26

there was no significant decrease in Ag concentrations in pore water over time in the
unamended soil, but a significant decrease was observed in both the 1% and 3% sewage
sludge amended soils attributed to the formation of Ag2S. For both nanoparticle
treatments there were significant decreases in Ag concentration in soil pore water by
six months for the 1% and 3% sludge amended soils. The PVP-coated AgNP treatment
exhibited an increase in Ag concentration in the unamended soil’s pore water after six
months, while the Ag concentration in the pore water of the citrate-coated treatment
remained constant.
4.5 Complexation between Ag+ and soil DOM
Kd values and E-values can be used to provide important information on the
partitioning and lability of metals in soils. However, metal uptake and toxicity may
still be dependent of the concentration and speciation of the metal in soil solution
(Parker and Pedler 1997). In solution, metal ions are in equilibrium with other soil
solution ligands and these interactions may play a pivotal role in assessing potential
metal uptake and toxicity to soil dwelling organisms (Figure 2c). In particular, the
complexation of Ag+ with dissolved organic matter (DOM) in soil solution may occur
and there is a lack of understanding of the strength of binding and underlying
mechanisms. Indeed other aquatic studies have shown that Ag+ forms complexes with
DOM, with humic and fulvic acids and there is a strong emphasis placed specifically on
the reduced S binding sites of DOM (Adams and Kramer 1998; Bell and Kramer 1999;
Chen et al. 2012; Chen et al. 2013). This also occurred in wastewater effluents where
Ag+ was shown to be strongly complexed with S2- (Adams and Kramer 1999). There is,
however, a limited understanding of this interaction when considering DOM in soil
solution. The only other study from the literature simply stated that the free ion
27

concentration of Ag+ was significantly lower in an organic matter rich soil compared to
a low organic matter soil (Benoit et al. 2013).
Defining DOM in soils is difficult due to its complex and heterogeneous nature. The
distinction between DOM and particulate organic matter (POM) is not clear-cut in a
chemical sense, although the usual operational definition is that DOM is the organic
matter fraction less than 0.45 µm (Bolan et al. 2011). In addition, the concentration of
DOM is not usually directly quantified, but rather its concentration inferred through
measurement of dissolved organic carbon (DOC), which usually represents the bulk of
its elemental composition (~67%) (Bolan et al. 2011). Dissolved organic matter
generally consists of a mixture of carbohydrates, carboxylic acids, amino acids,
hydrocarbons and potentially other unknown compounds (~20%) as well as humic and
fulvic substances which are residues of plant materials (~80%) (Ravichandran 2004).
Although DOM represents a small proportion of the total OM in soils, it is considered
to be the most mobile and actively cycling fraction and as a result is highly significant
to a range of biogeochemical processes in the soil environment.
When considering complexation, it is the functional groups of DOM that are the
reactive sites that may bind metal cations like Ag+ and therefore influence their
behaviour and fate in the soil environment. The transport and bioavailability of metals
can be influenced by their ability to form soluble or insoluble complexes with soil
DOM (Bolan et al. 2011). Metals including As, Cu, Cd, Hg and Pb have all shown
affinity for DOM, although this affinity is stronger for some than for others (McBride
et al. 1997; Weng et al. 2002). Copper in particular has been extensively studied and it
is well established that DOM has the ability to mobilise Cu in soils, which is
28

specifically based on the DOM quality, aromatic carbon content (Amery et al. 2008).
The humic/fulvic content of DOM is another quality measure and contains a significant
amount of aromatic carbon, carboxylic acid, alcohol, sulfhydryl or amine functional
groups that are influential to metal complexation (Chen et al. 1978; Weng et al. 2002).
5. Methods for assessing the availability, speciation and fate of silver in soils
It is well established that the total metal concentration of the soil is not an appropriate
measure of the potentially bioavailable metal concentration. Two relatively common
approaches to characterising metal availability are chemical extraction and isotopic
dilution. Chemical extraction procedures are classified as single or sequential,
implementing one or multiple chemical extractants, respectively, to release available
metals from soil. Isotopic dilution can be used to measure an E-value which represents
the isotopically exchangeable metal fraction and therefore the fraction that is
potentially bioavailable to organisms. In addition to the concentration of exchangeable
metal, the speciation of Ag in solid or solution phases is important in understanding the
processes that control the exchangeable metal fraction. The speciation technique, X-ray
absorption near edge structure spectroscopy (XANES) is appropriate for this and
provides information on the oxidation state and coordination environment.
The presence of DOM in the soil solution is potentially very important in understanding
how the concentration of free Ag+ varies between soils therefore characterisation of the
DOM from soils should also be considered. Spectroscopic techniques like UV-visible,
fluorescence and infrared spectroscopy are commonly employed techniques and can
provide information on structure and functional groups of DOM.
29

5.1 Chemical extraction techniques
Chemical extraction procedures using a single or sequential approach have been widely
applied to characterising the availability of metals in soils, sludges and sediments. The
extractants used in chemical extraction are classified as weak (e.g. water, calcium
chloride), reductive (e.g. sodium ascorbate), weak acids (e.g. diluted acetic acid),
strong complexing agents (e.g. ethylenediamine tetra-acetate (EDTA)), combined salt-
acid (e.g. ammonium oxalate-oxalic acid) and dilute or concentrated strong acids (e.g.
nitric or hydrochloric) (Peijnenburg et al. 2007).
For single extraction the end result is separation of the sorbed phase into labile and
non-labile fractions. Single extraction methods commonly use dilute calcium solutions
to remove weakly complexed metals from the surface of solid phases. As a result
studies using 0.1 M CaCl2, NaNO3 and NH4NO3 have often been found to have good
relationships between the extractable metal concentration and plant content of metals,
independent of soil characteristics (Novozamsky et al. 1993). In the case of estimating
Cu bioavailability to maize in soils, four extractants were used : EDTA, diethylene
triamine pentaacetic acid (DTPA), ammonium acetate and 0.01 CaCl2. In this case the
metal concentrations in the stronger chelating and ammonium acetate extractants from
soils correlated better to plants metal concentrations than using CaCl2 (Brun et al.
2001). In single extraction procedures, careful choice must be made for selecting the
right extractant at the right concentration to measure the availability of a given metal.
The use of these tests is limited to a general assessment of potentially available or
soluble metal fraction in the soil.
30

Sequential extraction procedures (SEPs) are used to examine metals associated with
various soil components. They can involve a number of steps and elaborate extraction
schemes isolating up to 10 identifiable elemental fractions. In particular, the procedure
proposed by Tessier et al. (1979) is widely applied and often with various
modifications. This method fractionates metals into exchangeable, carbonate bound, Fe
and Mn oxide bound, organic matter bound and residual (bound to primary mineral
structure) fractions (Tessier et al. 1979). This SEP has been developed to investigate
the partitioning of trace metals: Cd, Co, Cu, Ni, Pb, Zn, Fe and Mn. Another example is
the BCR fractionation procedure employing three-steps that fractionates metals into
three operationally defined fractions: CH3COOH, NH2OH.HCl and H2O2/CH3COONH4
exchangeable plus a residual fraction. This technique is standardised by the European
Community Bureau of Reference in Brussels (Peijnenburg et al. 1997).
Sequential extraction procedures can become complex and tedious, employing a range
of harsh chemical extractants. The main concerns with SEP procedures are in their lack
of selectivity and that the amount of metal obtained is still considered to be
“operationally defined” (Peijnenburg et al. 1997). In addition, dissolution of other soil
components may occur, metals liberated can become resorbed among the remaining
solids or speciation of metals can be altered during handling prior to extraction (e.g.
oxidation of reduced species in anoxic soils) (Peijnenburg et al. 1997; Young et al.
2005; Hooda 2010). Unfortunately all operational aspects of the procedure can be a
potential source of variability, including but not limited to soil preparation, solid-
solution ratio, extraction time and temperature, concentration of extractants and
shaking duration. Particularly in the case of Ag, a redox sensitive metal, the reducing
31

extractants that release metals bound to Fe-Mn oxides may be of particular concern, as
Ag+ will likely become reduced to Ag0.
5.2 Isotopic dilution
Isotopic dilution is a widely applied technique to examine the exchangeability of metals
in soils, in particular to investigate the fate and availability of different elements in soils
(Hamon et al. 2002; Hooda 2010). Isotopic dilution is a method that reflects the
isotopically exchangeable fraction of metals in soil and is applied with minimal
disturbance to solid phases. It was first used in 1947 to study reactions, fixation and
residual availability of fertilizer nutrients with the radioisotopes of Ca, K and P
(McAuliffe et al. 1947). Isotopic dilution was then applied to trace elements or
potentially toxic metals like As, Cd, Hg, Ni and Zn. The benefit of radioisotopes is their
ability to examine the trace elements’ partitioning into isotopically and non-isotopically
exchangeable fractions, labile and non-labile, respectively. The elements in the
isotopically exchangeable fraction are considered potentially available to organisms
and their reactions or activities.
One approach to isotopic dilution is the E-value method. This tracks depletion of an
isotope from solution in a soil suspension to determine the amount of isotopically
exchangeable element at a given time following the addition of an isotope (Hamon et
al. 2002). When the isotope of interest is introduced to the soil, it readily redistributes
itself among the solution and exchangeable phases, which are in dynamic equilibrium,
as would other isotopes of the same element:
𝑟𝑠𝑜𝑙∗
𝑟𝑒𝑥𝑐ℎ∗ =
𝑀𝑠𝑜𝑙
𝑀𝑒𝑥𝑐ℎ
32

Where, sol and exch represent the radioactivity (r*) of the isotope, or the concentration
of the metal (M), in solution phase and exchangeable metals (Mexch) adsorbed on the
solid phase, respectively.
The amount of depletion of isotope from solution relative to the quantity of element at a
given time can be used to determine specific elemental compartments in the soil. The
E-value can be used to determine the size of the isotopically exchangeable and hence
the potentially available metal fraction (Hamon et al. 2002). The E-value can be
calculated with the following equation adapted from Hamon et al (2008):
𝐸 =𝑆
𝑟∗× 𝐼𝑅 ×
𝑣
𝑚
Where, S is the solution Ag concentration (mg L-1), r* is the 110mAg solution
radioactivity after equilibration (Bq), IR is the initial spiked 110mAg radioactivity (Bq),
v is the solution volume (L) and m is the sample mass (kg). As a result the units for E-
value are mg kg-1.
According to Hamon et al (2008) the isotopic dilution method and measurement of the
E-value are only valid if certain conditions are satisfied. Firstly, the isotope introduced
into the system (usually as a small amount) must behave exactly as the natural element
in soil without disrupting the equilibrium of the system. Secondly, the metal species
measured in solution (Msol) should all be isotopically exchangeable; as a result the
introduced isotope will be physically mixed with all isotopically exchangeable metal in
the labile fraction. The time allowed to reach this equilibrium is also important, since it
is time dependent for the introduced isotope to mix uniformly with the entire soil metal
pool. This time frame is operationally limited to one to three days (Hamon et al. 2008).
Thirdly, any change to the conditions of the soil such as pH or salinity may cause
33

differences to or exchange between the labile and non-labile fractions. Therefore these
conditions must remain constant during the experiment e.g. before or after isotope
addition, and the suspension matrix should not cause any chemical interference e.g.
precipitation of metal of interest.
There is also a potential error in E-value determinations that can occur as a result of the
presence of non-isotopically exchangeable elements associated with colloidal material
in soil suspensions for example with Cu (Ma et al. 2006). This potential error can be
corrected by a resin purification step, commonly with Ca-form Chelex 100, to bind all
free metal cations in solution, thus removing non-exchangeable forms from the E-value
calculation (Hamon et al. 2002).
In isotopic dilution experiments, radioactive isotopes have typically been used.
Suitability of the radioisotope depends on the half-life. When a half-life is very short
e.g. 64Cu (t1/2 = 12.7 hours) the use in longer term studies is not possible (Hamon et al.
2008). Alternatively, the half-life can be relatively long e.g. 63Ni (t1/2 = 100 years)
causing issues with disposal upon completion of the study. Enriched stable isotopes are
now readily utilised due to the increasing availability of sensitive analytical techniques
(Tongtavee et al. 2005). Despite the use of stable isotopes being analytically more
demanding, they have an indefinite “shelf-life” and can prove useful when the
radioisotopes required are unavailable, decay rapidly, hazardous, or unaffordable
(Hamon et al. 2008). Isotopic dilution methods have great potential when coupled with
speciation techniques such as high performance liquid chromatography-inductively
coupled plasma mass spectrometry and X-ray absorption spectroscopy to understand
34

the fate and availability of metals in complex soil environments (Hill et al. 2004;
Young et al. 2005).
Specific examples of isotopic dilution experiments with stable or radioactive Ag
isotopes, 109Ag (48% natural abundance) or 110mAg (t1/2=250 days) respectively, in the
literature are limited. Reported applications of Ag isotopes include: Ag isotope
fractionation, ratios or measurement thereof in geologic materials coupled with MC-
ICP-MS (Schonbachler et al. 2007; Yang et al. 2009; Luo et al. 2010), nature of 110mAg
binding to soils as a result of Chernobyl (Szabo et al. 1993), Ag uptake experiments
with 110mAg in a green alga (Fortin and Campbell 2000) and recently a study with
AgNPs used the 110mAg tracer to follow the partitioning of 110mAg across different
sequential extraction soil fractions (Coutris et al. 2012). There has been no reported use
of isotope dilution methods to examine the exchangeability of Ag in soils.
5.2 Solid state speciation in soils by X-ray absorption near edge structure spectroscopy
X-ray absorption spectroscopy (XAS) and in particular XANES spectroscopy using
synchrotron radiation can be used to provide information on the oxidation state and
coordination environment (hereby referred to as solid phase speciation) of metal
contaminants in complex matrices such as soil, generally by analysing the resulting
spectra using principle components analysis (PCA) and linear combination fitting
(LCF) (Lombi and Susini 2009). Many studies have already demonstrated the ability of
this technique to provide solid phase speciation data for a range of metal contaminants
in soils e.g. As, Co, Cr, Cu, Mn, Ni, Pb (Nolan et al. 2003; Lombi and Susini 2009).
35

Examples of XANES spectroscopy applied to Ag can be found for a variety of media
but has most commonly been used to assess the fate of AgNPs in a WWTP scenario
and subsequent speciation in biosolids (Kaegi et al. 2011; Lombi et al. 2013; Whitley et
al. 2013; Ma et al. 2014). Many of these studies have shown that soluble Ag and
AgNPs are commonly converted to Ag2S or other Ag-S species in WWTPs. Other
examples involving XANES spectroscopy include Ag speciation in liver tissue of
marine mammals (Nakazawa et al. 2011), ageing of AgNPs in kaolin suspensions
(Scheckel et al. 2010), reduction of Ag+ to metallic Ag in plants (Beattie and
Haverkamp 2011) and speciation of AgNPs added to microcosms with freshwater
sediments (Bone et al. 2012). Overall these studies have shown that there is a tendency
for Ag+ or AgNPs (following dissolution) to form Ag-S bonded species or to be
converted to metallic Ag.
5.3 Spectroscopic characterisation of soil DOM
Many techniques have been applied to characterise DOM, including nuclear magnetic
resonance (NMR), UV-visible absorption, infrared (IR), fluorescence and X-ray
absorption spectroscopy (Preston 1996; Ellerbrock and Gerke 2013; Nebbioso and
Piccolo 2013). These techniques all provide information on the composition and
functional groups of DOM. While NMR and synchrotron powered X-ray absorption
spectroscopy can provide detailed information, they are also relatively time consuming,
inaccessible and costly. On the other hand, recent advances in IR spectroscopy and
fluorescence spectroscopy mean these techniques can provide efficient, sensitive and
effective characterisation of DOM (Janik et al. 2007; Andrade-Eiroa et al. 2013).
36

Excitation-emission matrix (EEM) fluorescence coupled with parallel factor analysis
(PARAFAC) of the spectra has been used to characterise DOM from aquatic systems
(Al-Reasi et al. 2011), soils (Fellman et al. 2008; Ohno et al. 2008) and wastewaters
(Cohen et al. 2014). The EEMs collected are used to visualise fluorophores or
fluorescent components as a function of excitation-emission pairs of wavelengths.
Handling the EEMs with PARAFAC has improved the identification of the components
and their abundance and contribution to the total fluorescence. Fluorescent components
identified in this way are normally classified as proteinaceous or humic/fulvic-like and
the end result is a fluorescent “fingerprint” made up of the various components for each
DOM sample.
Infrared spectra of soils contain extensive information on the molecular composition of
DOM (Gholizadeh et al. 2013). There are different IR techniques for recording spectra,
of which attenuated total reflectance (ATR) spectroscopy is best suited for DOM
characterisation (Soriano-Disla et al. 2014). The FTIR-ATR technique has been
successfully applied as a screening tool for DOM quality in rainwater (Santos et al.
2009) and regenerated peat soils (Artz et al. 2008) but has many more applications for
environmental samples (Jarusutthirak and Amy 2006; Sharma et al. 2010). FTIR-ATR
spectra can be related to sample properties and therefore is useful for extracting
relevant components from large data sets (Janik et al. 2007; Janik et al. 2010;
Gholizadeh et al. 2013).
37

6. Objectives of this research
The use of Ag (and AgNPs) in consumer products and industrial applications continues
to increase. Once in the terrestrial environment, there is potential for Ag+ and Ag+
released from AgNPs or other Ag compounds to pose a risk to soil-dwelling organisms.
At present, there is a limited understanding of the behaviour and fate of Ag in soils. A
comprehensive understanding of how this metal contaminant behaves in soils and a
method for measuring the potentially bioavailable metal fraction is required. This
involves development of a quantitative method to measure the concentration of
exchangeable metal in soils, solution and solid-phase speciation techniques to examine
reactions, processes and transformations of Ag in soils and soil solutions, soil physical
and chemical properties on fate and availability of Ag and an understanding of the
effect of ageing on Ag exchangeability in soils.
Generating new information in this field will improve our current understanding on the
behaviour and fate of Ag in soils. The main objectives of this research were therefore
to:
1) Develop and optimise a sensitive method for measuring the partitioning (Kd-value)
and exchangeable (labile) metal fraction (E-value) of Ag in soils;
2) Assess the effect of long term ageing of soluble Ag added to soils by monitoring E-
values and speciation with time; and
3) Determine the effect of DOM quantity and quality on Ag complexation in soil water
extracts by relating complexation to various chemical and spectroscopic measurements.
38

7. References
Adams, N. W. H. and J. R. Kramer (1998). "Reactivity of Ag+ ion with thiol ligands in the presence of iron sulfide." Environ. Toxicol. Chem. 17(4): 625-629.
Adams, N. W. H. and J. R. Kramer (1999). "Determination of silver speciation in wastewater and receiving waters by competitive ligand equilibration/solvent extraction." Environ. Toxicol. Chem. 18(12): 2674-2680.
Al-Reasi, H. A., C. M. Wood and D. S. Smith (2011). "Physicochemical and spectroscopic properties of natural organic matter (NOM) from various sources and implications for ameliorative effects on metal toxicity to aquatic biota." Aquat. Toxicol. 103(3-4): 179-190.
Amery, F., F. Degryse, K. Cheyns, et al. (2008). "The UV-absorbance of dissolved organic matter predicts the fivefold variation in its affinity for mobilizing Cu in an agricultural soil horizon." Eur. J. Soil Sci. 59(6): 1087-1095.
Andrade-Eiroa, A., M. Canle and V. Cerda (2013). "Environmental applications of excitation-emission spectrofluorimetry: An in depth review I." Appl. Spectrosc. Rev. 48(1): 1-49.
Artz, R. R. E., S. J. Chapman, A. H. J. Robertson, et al. (2008). "FTIR spectroscopy can be used as a screening tool for organic matter quality in regenerating cutover peatlands." Soil Biol. Biochem. 40(2): 515-527.
Barrow, N. J. (1998). "Effects of time and temperature on the sorption of cadmium, zinc, cobalt, and nickel by a soil." Aust. J. Soil Res. 36(6): 941-950.
Beattie, I. R. and R. G. Haverkamp (2011). "Silver and gold nanoparticles in plants: sites for the reduction to metal." Metallomics. 3(6): 628-632.
Bell, R. A. and J. R. Kramer (1999). "Structural chemistry and geochemistry of silver-sulfur compounds: Critical review." Environ. Toxicol. Chem. 18(1): 9-22.
Benn, T., B. Cavanagh, K. Hristovski, et al. (2010). "The release of nanosilver from consumer products used in the home." J. Environ. Qual. 39(6): 1875-1882.
Benoit, R., K. J. Wilkinson and S. Sauvé (2013). "Partitioning of silver and chemical speciation of free Ag in soils amended with nanoparticles." Chem. Cent. J. 7.
Blamey, F. P. C., P. M. Kopittke, J. B. Wehr, et al. (2010). "Rhizotoxic effects of silver in cowpea seedlings." Environ. Toxicol. Chem. 29(9): 2072-2078.
Bolan, N. S., D. C. Adriano, A. Kunhikrishnan, et al. (2011). Dissolved organic matter: biogeochemistry, dynamics and environmental significance in soils. Adv. Agron. Vol 110. D. L. Sparks. 110: 1-75.
Bone, A. J., B. P. Colman, A. P. Gondikas, et al. (2012). "Biotic and abiotic interactions in aquatic microcosms determine fate and toxicity of Ag nanoparticles: part 2-toxicity and Ag speciation." Environ. Sci. Technol. 46(13): 6925-6933.
Brun, L. A., J. Maillet, P. Hinsinger, et al. (2001). "Evaluation of copper availability to plants in copper-contaminated vineyard soils." Environ. Pollut. 111(2): 293-302.
Buekers, J., L. Van Laer, F. Amery, et al. (2007). "Role of soil constituents in fixation of soluble Zn, Cu, Ni and Cd added to soils." Eur. J. Soil Sci. 58(6): 1514-1524.
Cano-Resendiz, O., G. de la Rosa, G. Cruz-Jimenez, et al. (2011). "Evaluating the role of vegetation on the transport of contaminants associated with a mine tailing using the Phyto-DSS." J. Hazard Mater. 189(1-2): 472-478.
Chen, Y., N. Senesi and M. Schnitzer (1978). "Chemical and physical characteristics of humic and fulvic acids extracted from soils of mediterranean region." Geoderma. 20(2): 87-104.
Chen, Z., P. G. C. Campbell and C. Fortin (2012). "Silver binding by humic acid as determined by equilibrium ion-exchange and dialysis." J. Phys. Chem. A. 116(25): 6532-6539.
Chen, Z., C. Porcher, P. G. C. Campbell, et al. (2013). "Influence of humic acid on algal uptake and toxicity of ionic silver." Environ. Sci. Tech. 47(15).
Cohen, E., G. J. Levy and M. Borisover (2014). "Fluorescent components of organic matter in wastewater: Efficacy and selectivity of the water treatment." Water Res. 55.
39

Cornelis, G., C. Doolette, M. Thomas, et al. (2012). "Retention and dissolution of engineered silver nanoparticles in natural soils." Soil Sci. Soc. Am. J. 76(3): 891-902.
Cornelis, G., J. K. Kirby, D. Beak, et al. (2010). "A method for determination of retention of silver and cerium oxide manufactured nanoparticles in soils." Environ. Chem. 7(3): 298-308.
Coutris, C., E. J. Joner and D. H. Oughton (2012). "Aging and soil organic matter content affect the fate of silver nanoparticles in soil." Sci. Total Environ. 420: 327-333.
Crout, N. M. J., A. M. Tye, H. Zhang, et al. (2006). "Kinetics of metal fixation in soils: Measurement and modeling by isotopic dilution." Environ. Toxicol. Chem. 25(3): 659-663.
Degryse, F., J. Buekers and E. Smolders (2004). "Radio-labile cadmium and zinc in soils as affected by pH and source of contamination." Eur. J. Soil Sci. 55(1): 113-121.
Degryse, F., E. Smolders and D. R. Parker (2009). "Partitioning of metals (Cd, Co, Cu, Ni, Pb, Zn) in soils: concepts, methodologies, prediction and applications - a review." Eur. J. Soil Sci. 60(4): 590-612.
Di Bonito, M. (2008). Sewage Sludge in Europe and the UK: Environmental Impact and Improved Standards for Recycling and Recovery to Land. Environmental Geochemistry: Site Characterization, Data Analysis and Case Histories. B. De Vivo, H. B. Belkin and A. Lima. Amsterdam, Elsevier: 251-286.
Eckelman, M. J. and T. E. Graedel (2007). "Silver emissions and their environmental impacts: A multilevel assessment." Environ. Sci. Technol. 41(17): 6283-6289.
Ellerbrock, R. H. and H. H. Gerke (2013). Characterization of organic matter composition of soil and flow path surfaces based on physicochemical principles - A review. Adv. Agron. Vol 121. D. L. Sparks. 121: 117-177.
Elvers, B., S. Hawkins, W. Russey, et al. (1993). Silver, silver compounds and silver alloys. Ullmann's Encyclopedia of Industrial Chemistry. H. Renner. Weinham, Germany, VCH.
Engelke, M., J. Koser, S. Hackmann, et al. (2014). "A miniaturised solid contact test with arthrobacter globiformis for the assessment of the environmental impact of silver nanoparticles." Environ. Toxicol. Chem. 33(5): 1142-1147.
Etris, S. (1997). Kirk-Othmer Encyclopedia of Chemical Technology New York, John Wiley and Sons.
Evangelou, V. P. (1998). Environmental soil and water chemistry: Principles and applications. Canada, John Wiley and Sons, Inc.
Evans, L. J. and S. J. Barabash (2010). Molybdenum, silver, thallium and vanadium. Trace Elements in Soils. P. S. Hooda. Wiltshire, Blackwell Publishing Ltd: 516-549.
Ewell, W. G., J. W. Gorsuch, M. Ritter, et al. (1993). Ecotoxicological effects of silver compounds. 1st Argentum International Conference on the Transport, Fate and Effects of Silver in the Environment, Madison, WI, USA.
Fellman, J. B., D. V. D'Amore, E. Hood, et al. (2008). "Fluorescence characteristics and biodegradability of dissolved organic matter in forest and wetland soils from coastal temperate watersheds in southeast Alaska." Biogeochem. 88(2): 169-184.
Fendorf, S., M. J. La Force and G. C. Li (2004). "Temporal changes in soil partitioning and bioaccessibility of arsenic, chromium, and lead." J. Environ. Qual. 33(6): 2049-2055.
Fortin, C. and P. Campbell (2000). "Silver uptake by the green alga chilamydomonas reinhardtii in relation to chemical speciation: influence of chloride." Environ. Toxicol. Chem. 19(11): 2769- 2778.
Gardea-Torresdey, J. L., E. Gomez, V. Peralta, Jr., et al. (2003). "Alfalfa sprouts: A natural source for the synthesis of silver nanoparticles." Langmuir. 19(4): 1357-1361.
Gholizadeh, A., L. Boruvka, M. Saberioon, et al. (2013). "Visible, near-infrared, and mid-infrared spectroscopy applications for soil assessment with emphasis on soil organic matter content and quality: state-of-the-art and key issues." Appl. Spectrosc. 67(12): 1349-1362.
40

Gottschalk, F., T. Sonderer, R. W. Scholz, et al. (2009). "Modeled environmental concentrations of engineered nanomaterials (TiO2, ZnO, Ag, CNT, Fullerenes) for different regions." Environ. Sci. Tech. 43(24): 9216-9222.
Hamon, R. E., I. Bertrand and M. J. McLaughlin (2002). "Use and abuse of isotopic exchange data in soil chemistry." Aust. J. Soil Res. 40(8): 1371-1381.
Hamon, R. E., M. J. McLaughlin and G. Cozens (2002). "Mechanisms of attenuation of metal availability in in situ remediation treatments." Environ. Sci. Technol. 36(18): 3991-3996.
Hamon, R. E., D. R. Parker and E. Lombi (2008). Advances in isotopic dilution techniques in trace element research: A review of methodologies, benefits and limitations. Adv. Agron. Vol 99. 99: 289-343.
Hill, S. J., A. Fisher and M. Cave (2004). Inductively Coupled Plasma Spectrometry. Soil and Environmental Analysis: Modern Instrumental Techniques, Marcel Dekker Inc.
Hooda, P. S. (2010). Assessing Bioavailability of Soil Trace Elements. Trace Elements in Soils. P. S. Hooda. Wiltshire, Wiley: 230-265.
Innovotech. (2014). "Products ~ Agress® / AgreGuard™ Crop Protection." Retrieved 15th April, 2014, from http://www.innovotech.ca/agress.php.
Jacobson, A. R., S. Klitzke, M. B. McBride, et al. (2005). "The desorption of silver and thallium from soils in the presence of a chelating resin with thiol functional groups." Water Air and Soil Pollution. 160(1-4): 41-54.
Jacobson, A. R., M. B. McBride, P. Baveye, et al. (2005). "Environmental factors determining the trace-level sorption of silver and thallium to soils." Sci. Total Environ. 345(1-3): 191-205.
Janik, L., S. Forrester, J. K. Kirby, et al. (2010). Silver. Predicting metal partitioning in soils of the GEMAS sampling program using isotopic dilution and infrared spectroscopic techniques. Adelaide, CSIRO Land and Water.
Janik, L. J., J. O. Skjemstad, K. D. Shepherd, et al. (2007). "The prediction of soil carbon fractions using mid-infrared-partial least square analysis." Aust. J. Soil Res. 45(2): 73-81.
Jarusutthirak, C. and G. Amy (2006). "Role of soluble microbial products (SMP) in membrane fouling and flux decline." Environ. Sci. Tech. 40(3): 969-974.
Johansson, M., M. Pell and J. Stenstrom (1998). "Kinetics of substrate-induced respiration (SIR) and denitrification: Applications to a soil amended with silver." Ambio. 27(1): 40-44.
Johnson, J., J. Jirikowic, M. Bertram, et al. (2005). "Contemporary anthropogenic silver cycle: A multilevel analysis." Environ. Sci. Technol. 39(12): 4655-4665.
Jones, K. C., B. E. Davies and P. J. Peterson (1986). "Silver in Welsh soils - Physical and chemical distribution studies." Geoderma. 37(2): 157-174.
Jones, K. C. and P. J. Peterson (1986). "The influence of humic and fulvic acids on silver uptake by perennial ryegrass and its relevance to the cycling of silver in soils." Plant and Soil. 95(1): 3-8.
Kabata-Pendias, A. and A. B. Mukherjee (2007). Soils. Trace Elements from Soil to Human. Berlin, Springer 9-38.
Kabata-Pendias, A. and H. Pendias (2000). Trace elements in soils and plants. Boca Raton, Fla, CRC Press.
Kaegi, R., A. Voegelin, B. Sinnet, et al. (2011). "Behavior of metallic silver nanoparticles in a pilot wastewater treatment plant." Environ. Sci. Technol. 45(9): 3902-3908.
Kim, B., C. S. Park, M. Murayama, et al. (2010). "Discovery and characterization of silver sulfide nanoparticles in final sewage sludge products." Environ. Sci. Technol. 44(19): 7509-7514.
Kirby, J. K., M. J. McLaughlin, Y. B. Ma, et al. (2012). "Aging effects on molybdate lability in soils." Chemosphere. 89(7): 876-883.
Langdon, K., M. J. McLaughlin, L. Settimio, et al. (2012). Phase 1: Selection and characterisation of project soils, preliminary ecotoxicology and silver partitioning results. Evaluation of toxicity and bioavailability of silver in soils. Adelaide, CSIRO.
41

Langdon, K. A., M. J. McLaughlin, J. K. Kirby, et al. (2014). "The effect of soil properties on the toxicity of silver to the soil nitrification process." Environ. Toxicol. Chem. 33(5): 1170-1178.
Lindsay, W. L. (1979). Chemical Equilibria in Soils. New Jersey, Blackburn Press: 300-312. Lombi, E., E. Donner, S. Taheri, et al. (2013). "Transformation of four silver/silver chloride
nanoparticles during anaerobic treatment of wastewater and post-processing of sewage sludge." Environ. Pollut. 176: 193-197.
Lombi, E., R. E. Hamon, S. P. McGrath, et al. (2003). "Lability of Cd, Cu, and Zn in polluted soils treated with lime, beringite, and red mud and identification of a non-labile colloidal fraction of metals using isotopic techniques." Environ. Sci. Technol. 37(5): 979-984.
Lombi, E. and J. Susini (2009). "Synchrotron-based techniques for plant and soil science: opportunities, challenges and future perspectives." Plant and Soil. 320(1-2): 1-35.
Luo, Y., E. Dabek-Zlotorzynska, V. Celo, et al. (2010). "Accurate and precise determination of silver isotope fractionation in environmental samples by multicollector-ICPMS." Anal. Chem. 82(9): 3922-3928.
Ma, R., C. Levard, J. D. Judy, et al. (2014). "Fate of zinc oxide and silver nanoparticles in a pilot wastewater treatment plant and in processed biosolids." Environ. Sci. Tech. 48(1): 104-112.
Ma, Y. B., E. Lombi, A. L. Nolan, et al. (2006). "Determination of labile Cu in soils and isotopic exchangeability of colloidal Cu complexes." Eur. J. Soil Sci. 57(2): 147-153.
Ma, Y. B., E. Lombi, A. L. Nolan, et al. (2006). "Short-term natural attenuation of copper in soils: Effects of time, temperature, and soil characteristics." Environ. Toxicol. Chem. 25(3): 652-658.
Ma, Y. B., E. Lombi, I. W. Oliver, et al. (2006). "Long-term aging of copper added to soils." Environ. Sci. Technol. 40(20): 6310-6317.
McAuliffe, C. D., N. S. Hall, L. A. Dean, et al. (1947). "Exchange reactions between phosphates and soils: Hydroxylic surfaces of soil minerals." Soil Sci. Soc. Proc. 12: 119-123.
McBride, M., S. Sauvé and W. Hendershot (1997). "Solubility control of Cu, Zn, Cd and Pb in contaminated soils." Eur. J. Soil Sci. 48(2): 337-346.
McLaughlin, M. J., B. A. Zarcinas, D. P. Stevens, et al. (2000). "Soil testing for heavy metals." Commun. Soil Sci. Plan. 31(11-14): 1661-1700.
Morones, J. R., J. L. Elechiguerra, A. Camacho, et al. (2005). "The bactericidal effect of silver nanoparticles." Nanotech. 16(10): 2346-2353.
Nakazawa, E., T. Ikemoto, A. Hokura, et al. (2011). "Silver speciation in liver of marine mammals by synchrotron X-ray absorption fine structure and X-ray fluorescence spectroscopies." J. Environ. Monit. 13(6): 1678-1686.
Nakhone, L. N. and S. D. Young (1993). "The significance of (radio-) labile cadmium pools in soil." Environ. Pollut. 82(1): 73-77.
Nebbioso, A. and A. Piccolo (2013). "Molecular characterization of dissolved organic matter (DOM): a critical review." Anal. Bioanal. Chem. 405(1): 109-124.
Nolan, A. L., E. Lombi and M. J. McLaughlin (2003). "Metal bioaccumulation and toxicity in soils - Why bother with speciation?" Aust. J. Chem. 56(2-3): 77-91.
Novozamsky, I., T. M. Lexmond and V. J. G. Houba (1993). "A single extraction procedure of soil for evaluation of uptake of some heavy metals by plants." Int. J. Environ. Anal. Chem. 51(1-4): 47-58.
Nowack, B., H. F. Krug and M. Height (2011). "120 years of nanosilver history: Implications for policy makers." Environ. Sci. Tech: null-null.
Ohno, T., A. Amirbahman and R. Bro (2008). "Parallel factor analysis of excitation-emission matrix fluorescence spectra of water soluble soil organic matter as basis for the determination of conditional metal binding parameters." Environ. Sci. Tech. 42(1): 186-192.
42

Oliver, I. W., M. J. McLaughlin and G. Merrington (2005). "Temporal trends of total and potentially available element concentrations in sewage blosolids: a comparison of biosolid surveys conducted 18 years apart." Sci. Total Environ. 337(1-3): 139-145.
Parker, D. R. and J. F. Pedler (1997). "Reevaluating the free-ion activity model of trace metal availability to higher plants." Plant and Soil. 196(2): 223-228.
Peijnenburg, W., L. Posthuma, H. J. P. Eijsackers, et al. (1997). "A conceptual framework for implementation of bioavailability of metals for environmental management purposes." Ecotoxicol. Environ. Safe. 37(2): 163-172.
Peijnenburg, W., M. Zablotskaja and M. G. Vijver (2007). "Monitoring metals in terrestrial environments within a bioavailability framework and a focus on soil extraction." Ecotox. Environ. Safe. 67(2): 163-179.
Percival, S. L., P. G. Bowler and D. Russell (2005). "Bacterial resistance to silver in wound care." J. Hosp. Infect. 60(1): 1-7.
Petering, H. G. and C. J. McClain (1991). Silver. Metals and their compounds in the environment: occurrence, analysis and biological relevance. E. Merian. Weinheim, VCH
Preston, C. M. (1996). "Applications of NMR to soil organic matter analysis: History and prospects." Soil Sci. 161(3): 144-166.
Purcell, T. W. and J. J. Peters (1998). "Sources of silver in the environment." Environ. Toxicol. Chem. 17(4): 539-546.
Ratte, H. T. (1999). "Bioaccumulation and toxicity of silver compounds: a review." Environ. Toxicol. Chem. 18(1): 89-108.
Ravichandran, M. (2004). "Interactions between mercury and dissolved organic matter - a review." Chemosphere. 55(3): 319-331.
Russell, A. D. and W. B. Hugo (1994). "Antimicrobial activity and action of silver." Progr. Med. Chem. 31: 351-370.
Santos, P. S. M., M. Otero, R. Duarte, et al. (2009). "Spectroscopic characterization of dissolved organic matter isolated from rainwater." Chemosphere. 74(8): 1053-1061.
Sauvé, S., W. Hendershot and H. E. Allen (2000). "Solid-solution partitioning of metals in contaminated soils: Dependence on pH, total metal burden, and organic matter." Environ. Sci. Technol. 34(7): 1125-1131.
Scheckel, K. G., T. P. Luxton, A. M. El Badawy, et al. (2010). "Synchrotron speciation of silver and zinc oxide nanoparticles aged in a kaolin suspension." Environ. Sci. Technol.
Schlich, K., T. Klawonn, K. Terytze, et al. (2013). "Effects of silver nanoparticles and silver nitrate in the earthworm reproduction test." Environ. Toxicol. Chem. 32(1): 181-188.
Schonbachler, M., R. W. Carlson, M. E. Horan, et al. (2007). "High precision Ag isotope measurements in geologic materials by multiple-collector ICPMS: An evaluation of dry versus wet plasma." International Journal of Mass Spectrometry. 261(2-3): 183-191.
Sharma, P., J. Ofner and A. Kappler (2010). "Formation of binary and ternary colloids and dissolved complexes of organic matter, Fe and As." Environ. Sci. Tech. 44(12): 4479-4485.
Shin, Y. J., J. I. Kwak and Y. J. An (2012). "Evidence for the inhibitory effects of silver nanoparticles on the activities of soil exoenzymes." Chemosphere. 88(4): 524-529.
Shoults-Wilson, W. A., B. C. Reinsch, O. V. Tsyusko, et al. (2011). "Role of particle size and soil type in toxicity of silver nanoparticles to earthworms." SOIL SCI. SOC. AM. J. 75(2): 365-377.
Shtangeeva, I., S. Venalainen, H. Hartikainen, et al. (2011). "Silver induced changes in the nutrient and trace element uptake by wheat and amount of the rhizosphere proteins." J. Plant Nutr. 34(9-11): 1497-1506.
Soriano-Disla, J. M., L. J. Janik, R. A. V. Rossel, et al. (2014). "The performance of visible, near-, and mid-infrared reflectance spectroscopy for prediction of soil physical, chemical, and biological properties." Appl. Spectrosc. Rev. 49(2): 139-186.
Szabo, G., J. Guczi, A. Kerekes, et al. (1993). "Investigations into the nature of the binding of 110mAg, K, Ca, Al and Fe in soil." Sci. Tot. Environ. 130: 359-374.
43

Tack, F. M. G. (2010). Trace Elements: General Soil Chemistry, Principles and Processes. Trace Elements in Soils. P. S. Hooda. Wiltshire, Blackwell Publishing Ltd: 9-38.
Tessier, A., P. G. C. Campbell and M. Bisson (1979). "Sequntial extraction procedure for the speciation of particulate trace metals." Anal. Chem. 51(7): 844-851.
The Silver Institute. (2011). "Silver Uses." Retrieved 29th May, 2011, from http://www.silverinstitute.org/silver_uses.php.
Thomson Reuters GFMS (2013). World Silver Survey 2013 - A Summary, The Silver Institute: 1-9.
Throback, I. N., M. Johansson, M. Rosenquist, et al. (2007). "Silver (Ag+) reduces denitrification and induces enrichment of novel Nir-k genotypes in soil." FEMS Microbiol. Lett. 270(2): 189-194.
Tongtavee, N., J. Shiowatana, R. G. McLaren, et al. (2005). "Assessment of lead availability in contaminated soil using isotope dilution techniques." Sci. Total Environ. 348(1-3): 244-256.
Welp, G. and G. W. Brummer (1999). "Adsorption and solubility of ten metals in soil samples of different composition." J. Plan. Nutr. Soil Sci. 162(2): 155-161.
Weng, L. P., E. J. M. Temminghoff, S. Lofts, et al. (2002). "Complexation with dissolved organic matter and solubility control of heavy metals in a sandy soil." Environ. Sci. Tech. 36(22): 4804-4810.
Whitley, A. R., C. Levard, E. Oostveen, et al. (2013). "Behavior of Ag nanoparticles in soil: Effects of particle surface coating, aging and sewage sludge amendment." Environ. Pollut. 182: 141-149.
Wolt, J. D. (1994). Soil Solution Chemistry: Applications to Environmental Science and Agriculture. New York, John Wiley and Sons, Inc.
Yang, L., E. Dabek-Zlotorzynska and V. Celo (2009). "High precision determination of silver isotope ratios in commercial products by MC-ICP-MS." J. Anal. Atom. Spectrom. 24(11): 1564-1569.
Yin, L. Y., Y. W. Cheng, B. Espinasse, et al. (2011). "More than the ions: The effects of silver nanoparticles on Lolium multiflorum." Environ. Sci. Tech. 45(6): 2360-2367.
Yin, L. Y., B. P. Colman, B. M. McGill, et al. (2012). "Effects of silver nanoparticle exposure on germination and early growth of eleven wetland plants." Plos One. 7(10).
Young, S. D., N. M. J. Crout, J. Hutchinson, et al. (2005). Section 1. Techniques for Measuring Attentuation: Isotopic Dilution Methods. In Natural Attenuation of Trace Element Availability in Soils. Pensacola, USA Society of Environmental Toxicology and Chemistry (SETAC)
Young, S. D., H. Zhang, A. M. Tye, et al. (2005). "Characterizing the availability of metals in contaminated soils. I. The solid phase: sequential extraction and isotopic dilution." Soil Use Manage. 21: 450-458.
44

CHAPTER 2
A METHOD TO DETERMINE SILVER PARTITIONING AND LABILITY IN SOILS
The work contained in this chapter has been published in Environmental Chemistry.
Settimio, L., McLaughlin, M.J., Kirby, J.K., Langdon, K.A., 2014. A method to determine silver partitioning and lability in soils. Environmental Chemistry 11, 63-71.
45

Statement of Authorship Title of Paper
Publication Status Published, Accepted for Publication, Submitted for Publication, Publication style
Publication Details
Author Contributions By signing the Statement of Authorship, each author certifies that their stated contribution to the publication is accurate and that permission is granted for the publication to be included in the candidate’s thesis.
Name of Principal Author (Candidate)
Contribution to the Paper
Signature Date
Name of Co-Author
Contribution to the Paper
Signature Date
Name of Co-Author
Contribution to the Paper
Signature Date
Name of Co-Author
Contribution to the Paper
Signature Date
A method to determine partitioning and lability of silver in soils
●
Settimio, L., McLaughlin, M.J., Kirby, J.K., Langdon, K.A., 2014. A method to determine silver partitioning and lability in soils. Environmental Chemistry 11, 63-71.
Lara Settimio
Experimental development, performed analysis on all samples, data analysis and critical interpretation, wrote manuscript.
Mike McLaughlin
Supervised development of work, data analysis and interpretation, reviewed manuscript.
Jason Kirby
Supervised development of work, data analysis and interpretation, reviewed manuscript.
Kate Langdon
Supervised development of work, data analysis and interpretation, reviewed manuscript.
20-10-2014
20-10-2014
47

Settimio, L., McLaughlin, M.J., Kirby, J.K. and Langdon, K.A. (2014). A method to
determine silver partitioning and lability in soils.
Environmental Chemistry, 11(1), 63-71.
NOTE: This publication is included in the print copy of the thesis
held in the University of Adelaide Library.
It is also available online to authorised users at:
http://dx.doi.org/10.1071/EN13163

CHAPTER 3
FATE AND LABILITY OF SILVER IN SOILS: EFFECT OF AGEING
The work contained in this chapter has been published in Environmental Pollution.
Settimio, L., McLaughlin, M.J., Kirby, J.K., Langdon, K.A., Lombi, E., Donner, E.,
Scheckel, K.G., 2014. Environmental Pollution 191, 151-157.
59

60

Statement of Authorship Title of Paper
Publication Status Published, Accepted for Publication, Submitted for Publication, Publication style
Publication Details
Author Contributions By signing the Statement of Authorship, each author certifies that their stated contribution to the publication is accurate and that permission is granted for the publication to be included in the candidate’s thesis.
Name of Principal Author (Candidate)
Contribution to the Paper
Signature Date
Name of Co-Author
Contribution to the Paper
Signature Date
Name of Co-Author
Contribution to the Paper
Signature Date
Name of Co-Author
Contribution to the Paper
Signature Date
Fate and lability of silver in soils: Effect of ageing
●
Settimio, L., McLaughlin, M.J., Kirby, J.K., Langdon, K.A., Lombi, E., Donner, E., Scheckel, K.G., 2014. Environmental Pollution 191, 151-157.
Lara Settimio
Experimental development, performed analysis on all samples, data analysis and critical interpretation, wrote manuscript.
Mike McLaughlin
Supervised development of work, data analysis and interpretation, reviewed manuscript.
Jason Kirby
Supervised development of work, data analysis and interpretation, reviewed manuscript.
Kate Langdon
Supervised development of work, data analysis and interpretation, reviewed manuscript.
20-10-2014
20-10-2014
61

Statement of Authorship Title of Paper
Publication Status Published, Accepted for Publication, Submitted for Publication, Publication style
Publication Details
Author Contributions By signing the Statement of Authorship, each author certifies that their stated contribution to the publication is accurate and that permission is granted for the publication to be included in the candidate’s thesis.
Name of Principal Author (Candidate)
Contribution to the Paper
Signature Date
Name of Co-Author
Contribution to the Paper
Signature Date
Name of Co-Author
Contribution to the Paper
Signature Date
Name of Co-Author
Contribution to the Paper
Signature Date
Fate and lability of silver in soils: Effect of ageing
●
Settimio, L., McLaughlin, M.J., Kirby, J.K., Langdon, K.A., Lombi, E., Donner, E., Scheckel, K.G., 2014. Environmental Pollution 191, 151-157.
Lara Settimio
Experimental development, performed analysis on all samples, data analysis and critical interpretation, wrote manuscript.
Enzo Lombi
Assisted with collection and interpretation of synchrotron data, reviewed manuscript.
Erica Donner
Assisted with collection of synchrotron data, reviewed manuscript.
Kirk Scheckel
Assisted with collection of synchrotron data, reviewed manuscript.
62

lable at ScienceDirect
Environmental Pollution 191 (2014) 151e157
Contents lists avai
Environmental Pollution
journal homepage: www.elsevier .com/locate/envpol
Fate and lability of silver in soils: Effect of ageing
Lara Settimio a,*, Mike J. McLaughlin a,b, Jason K. Kirby b, Kate A. Langdon b, Enzo Lombi c,Erica Donner c, Kirk G. Scheckel d
aWaite Research Institute, School of Agriculture, Food and Wine, University of Adelaide, Waite Rd, SA 5064, AustraliabCSIRO Land and Water, Contaminant Chemistry and Ecotoxicology Program, Minerals Down Under Flagship, Waite Campus, Waite Rd, SA 5064, AustraliacCentre for Environmental Risk Assessment and Remediation, University of South Australia, Mawson Lakes, SA 5095, AustraliadNational Risk Management Research Laboratory, US EPA, Cincinnati, US
a r t i c l e i n f o
Article history:Received 2 February 2014Received in revised form15 April 2014Accepted 23 April 2014Available online xxx
Keywords:SilverLabilitySpeciationAgeing
* Corresponding author.E-mail addresses: [email protected], l
(L. Settimio).
http://dx.doi.org/10.1016/j.envpol.2014.04.0300269-7491/� 2014 Elsevier Ltd. All rights reserved.
a b s t r a c t
The fate and lability of added soluble Ag in soils over time was examined by measurement of labile metal(E-value) by isotopic dilution using the 110mAg radioactive isotope and the solid-phase speciation of Ag byX-ray absorption near edge structure (XANES) spectroscopy. After two weeks of ageing the E-values forAg decreased by 20e90% with a further decrease of 10e40% after six months. The overall decrease inlabile Ag for all soils after the 6 month ageing period was 50e100%. The ageing was more rapid andpronounced in the alkaline soils. XANES results for Ag in soils indicated that for the majority of soils theadded Agþ was reduced to metallic Ag over time, and associations with Fe-oxohydroxides and reduced Sgroups in organic matter also decreased Ag lability. Strong positive correlations were found betweenmetallic Ag and non-labile Ag and between organic carbon and Ag bonded with S species.
� 2014 Elsevier Ltd. All rights reserved.
1. Introduction
The use of silver (Ag) and silver nanoparticles (AgNPs) in ap-plications such as solar energy, water purification, medicine andnanotechnology is rapidly increasing (Elvers et al., 1993).Commonly exploited for their antibacterial properties, Ag andincreasingly AgNPs are being used in a range of consumer productsbut this may also lead to environmental risks following their po-tential release into the environment (Morones et al., 2005; Bennet al., 2010).
Apart frommining processes, the exposure pathways for Ag intothe environment from urban areas (e.g. consumer products andindustry) will be from wastewater treatment plants (WWTPs),predominantly via land application of biosolids (Johnson et al.,2005; Oliver et al., 2005) and through agriculture by applicationof Ag containing pesticides such as Agress� (Marques et al., 2011;Innovotech Products w Agr). As a result of these exposure path-ways, soil environments may be one of the major sinks for Ag in theenvironment. Elevated concentrations of Ag may pose a risk to soilenvironments due to the potential toxicity of Ag to a range of or-ganisms such as plants, invertebrates, microbes and bacteria living
63
in soil (Ratte, 1999; Roh et al., 2009; Blamey et al., 2010; Throbacket al., 2007; Murata et al., 2005).
When soluble metals are added to soils there are initial fastreactions which remove metals from soil solution (adsorption andprecipitation), followed by slower reactions that continue toremove metals from the labile (i.e. exchangeable) pool. Thedecrease in metal lability that occurs with time after metal additionto soil is thought to occur through the following general mecha-nisms: micropore diffusion, cavity entrapment, occlusion in solidphases by co-precipitation and co-flocculation and surfaceprecipitation (Ma et al., 2006a; Fendorf et al., 2004; Kabata-Pendiasand Pendias, 2000). These processes are generally referred to as“aging”. As a consequence the bioavailability and toxicity of themetal to soil organisms may decrease with time as the actualexposure concentration decreases. The ageing of other metals insoils has been studied (e.g. As, Cu, Mo, and Zn) by measuring metallability after various periods of time up to 27 months (Ma et al.,2006a; Fendorf et al., 2004; Ma et al., 2006b; Crout et al., 2006;Kirby et al., 2012). These studies have shown that the extent ofageing is dependent on the soil type and chemical properties of themetal, as well as environmental conditions such astemperature (Barrow, 1998). To date, little is known of the extent ofageing of soluble Ag in soils and with the predicted increase in Agconcentrations in the environment (due to increased use of Ag- andAgNP-containing products), it is important to examine the fate andpotential bioavailability (lability) of soluble Ag in soils over time.

Table
1Se
lected
phy
sicalan
dch
emical
properties
ofthesoils
.
Soillocation
pHwater
Totalo
rgan
iccarbon
DOCb
CEC
cOxa
late
extractable
Particle
size
analysis
Water-
extractableCl
Water
holding
capacity
Totalad
ded
ag
Al
FeClay
Silt
Sand
%mgL�
1cm
olckg
�1mgkg
�1mgkg
�1
%%
%mgL�
1%
mgkg
�1
Kinga
roy
6.1
0.9
313
2500
2300
6017
190.6
3710
0�
7Charleston
6.0
6.9
6512
410
2500
1412
633.1
3219
0�
1Balak
lava
8.5
1.9
2127
1200
650
3020
473.0
3518
0�
9Po
rtKen
nya
8.8
1.8
3613
480
300
124.2
212.3
2620
0�
30Millicen
t6.9
11.8
7542
2300
1500
195.2
488.1
3939
0�
20Inman
Valley
6.0
5.3
110
2515
0037
0042
2226
5.0
4877
0�
10
aNotethat
particlesize
distribution
forPo
rtKen
nyis
equal
to37
.2%dueto
thehighco
ncentrationof
CaC
O3that
ispresentin
this
soil(60%
).bDissolved
orga
nic
carbon
.cCationex
chan
gecapacity.
L. Settimio et al. / Environmental Pollution 191 (2014) 151e157152
64
The total concentration of metals in soils is known to be a poorindicator of the potential bioavailable fraction (McLaughlin et al.,2000). Isotopic dilution (ID) is an established method used tomeasure the total labile metal fraction in soils (in soil solution andon solid phases in rapid exchange with soil solution) and it isdetermined by calculating an E-value (Young et al., 2005; Nolanet al., 2004; Wendling et al., 2009). An ID method for Ag wasrecently developed to measure E-values for soils with a range ofchemical and physical properties and added Agconcentrations (Settimio et al., 2014). This initial study found thatnot all soluble Ag added to the soil remained in the labile pool andsignificant ageing occurred after a relatively short period of time(two weeks). A similar result was also observed when AgNO3 wasadded to soils and analysed by sequential extraction whereby sol-uble Ag was found to be rapidly immobilised in soil (Coutris et al.,2012). Although the amount of labile metal can be determined atvarious ageing periods using the ID method, there is still a lack ofunderstanding in the chemistry associated with the labile and non-labile metal pools within the soil solid phase.
X-ray absorption spectroscopy (XAS) and in particular X-rayabsorption near edge structure (XANES) spectroscopy using syn-chrotron radiation can be used to provide information on theoxidation state and coordination environment (hereby referred toas solid phase speciation) of metal contaminants in complexmatrices such as soil, generally by analyzing the resulting spectrausing principle components analysis (PCA) and linear combinationfitting (LCF) (Lombi and Susini, 2009). Many studies have alreadydemonstrated the ability of this technique to provide solid phasespeciation data for a range of metal contaminants in soils e.g. As, Co,Cr, Cu, Mn, Ni, Pb (Lombi and Susini, 2009; Nolan et al., 2003).Examples of XANES spectroscopy applied to Ag can be found for avariety of media but has most commonly been used to assess thefate of AgNPs in a WWTP scenario and subsequent speciation inbiosolids (Kaegi et al., 2011; Lombi et al., 2013; Ma et al., 2014;Whitley et al., 2013). Many of these studies have shown thatAgNO3 and AgNPs are commonly converted to Ag2S or other AgeSspecies in WWTPs. Other examples involving XANES spectroscopyinclude Ag speciation in liver tissue of marine mammals (Nakazawaet al., 2011), ageing of AgNPs in kaolin suspensions (Scheckel et al.,2010), reduction of Agþ to metallic Ag in plants (Beattie et al., 2011)and speciation of AgNPs added to microcosms with freshwatersediments (Bone et al., 2012). Overall these studies have shown thatthere is a tendency for Agþ or AgNPs (following dissolution) to formAgeS bonded species or to be converted to metallic Ag.
There is a lack of understanding regarding the solid phasespeciation and lability of Ag and its ageing in natural soils. There-fore the aim of this study was to examine the fate and lability ofadded soluble Ag over time by measuring labile Ag (E-value) con-centrations and the solid-phase speciation of Ag (XANES) in soils.This will provide an insight into the long-term fate of Agþ ion addedto soils and the mechanisms or interactions with soil componentsthat can affect its lability and bioavailability to soil organisms.
2. Materials and methods
2.1. Soil sampling and characterisation
This study used soils that were sourced from six locations in Queensland andSouth Australia, Australia: Kingaroy, Charleston, Balaklava, Port Kenny, Millicent andInman Valley. The soils were collected from 0 to 10 cm depth, air-dried, homoge-nised and sieved to <2 mm. Selected physical and chemical properties for theexperimental soils can be found in Table 1. Soil pH was measured using a soil:so-lution ratio of 1:5 (m/v), with ultrapure deionised water (Milli-Q, Millipore) andshaking for 1 h. Total organic carbon (TOC) content, cation exchange capacity (CEC),particle size and oxalate-extractable aluminium (Alox) and iron (Feox) were deter-mined according to standard methods (Gee and Bauder, 1986; Rayment andHigginson, 1992). Concentrations of dissolved organic carbon (DOC) (ShimadzuTOC-VCSH/CSN þ TNM-1) and chloride (Cl�) (Dionex ICS-2500) were determined

L. Settimio et al. / Environmental Pollution 191 (2014) 151e157 153
using a 1:5 soil:solution ratio (m/v) with ultrapure deionised water (Milli-Q) andshaking for 1 h, with the suspension filtered through 0.2-mm cellulose acetate filter(Sartorius, Germany). Total Ag concentrations in soils were determined using amicrowave-assisted aqua regia (US-EPA 3051A) procedure. This was conducted byweighing 0.25 g soil into Teflon� vessels and adding 10 ml of nitric (HNO3) andhydrochloric (HCl) acid at a ratio of 1:3 (v/v). The soils were open vessel digested atroom temperature for 12 h, then sealed and heated for 45 min at 175 �C (after a10 min ramp period) in a microwave oven (Mars Express, 1600 W). After digestion,samples were filtered through 0.2-mm cellulose acetate filters (Sartorius, Germany)and Ag concentrations determined by inductively coupled plasma-optical emissionspectroscopy (ICP-OES) (Spectro ARCOS) or ICP-mass spectroscopy (ICP-MS) (Agilent7500ce). The limit of Ag detection of the method was 0.04 mg kg�1. A digest blankand a certified reference material (NRC-CNRC PACS-2) with an Ag concentration of1.22 � 0.14 mg kg�1 were included for quality control in all sample batches. Blanksolutions were consistently <0.03 mg Ag L�1 and the measured concentration of Agin the certified reference material was 1.15 � 0.16 mg kg�1 in close agreement withthe certified value.
2.2. Soil spiking with soluble silver and incubation conditions for ageing
Soils were spiked to the desired Ag concentration using AgNO3 (SigmaeAldrich,�99%) in ultrapure deionised water (Milli-Q). The nominal soil Ag concentrationsused in this study were 100 mg kg�1 for the Kingaroy soil, 200 mg kg�1 for theCharleston, Balaklava and Port Kenny soils, 400 mg kg�1 for the Millicent soil and800 mg kg�1 for the Inman Valley soil. Soils were spiked with soluble Ag at effectiveconcentrations determined during preliminary experiments to inhibit barley growthby 50% (EC50). The Ag spiking solutions in 20 ml of ultrapure deionised water wereaspirated onto dry soils (400 g) using a glass nebulizer. The soils were then leachedusing artificial rainwater (Oorts et al., 2007), air dried and sieved< 2 mm. The watercontent of soils was then increased to 50% of field capacity (FC) (determined at pF 2.0using a tension plate technique (Marshall et al., 1979)) (Table 1) and incubated at22 �C in the dark, with daily aeration. The samples were maintained at 50% FC byweight for two weeks and six months prior to measuring the labile Ag concentra-tions and determining solid state speciation of Ag in the samples. Total Ag con-centrations in the spiked soils after leaching were determined using the microwaveassisted aqua regia digest method outlined above (Table 1).
Fig. 1. Labile Ag represented as a percentage of total Ag added to soils (E%)(mean � standard deviation of 5 replicates) at time zero, two week and six monthageing periods. E% values with different letters within soils are significantly different atP � 0.05.
2.3. Isotopically exchangeable silver (E-value) concentrations in soils with time
E-values for Ag in soils (after soil spiking and incubation) were measured ac-cording to the method published by Settimio et al. (Settimio et al., 2014). Soils(N ¼ 5) were weighed (4.0 � 0.02 g) into 50 mL polypropylene centrifuge tubes(LabServ) and mixed end-over-end for 48 h with 40 mL of 0.01 M calcium nitrate(CaNO3)2. Following this initial equilibration period, each sample was spiked with100 kBq of 110mAg in 200 mL carrier-free solution (in the form of 110mAgNO3 (t1/2 ¼ 250 days)). The 110mAg spiked soil suspensions were mixed on an end-over-endshaker for a further 72 h, followed by centrifugation at 1200 g for 20 min and thesupernatants filtered through 0.2-mm cellulose acetate filters (Sartorius, Germany).The pH of soil suspensions was determined before 110mAg addition and after thespike equilibration period (no significant changes in pH were observed). A 30-mLaliquot of the <0.2 mm soil suspensions was transferred into 50 ml centrifugetubes, with approximately 0.15 g of Chelex 100 resin (Bio-Rad Laboratories). Theresin had previously been converted from a sodium to a calcium form usingCa(NO3)2 (SigmaeAldrich). The 0.2 mm filtered samples with resin were mixed end-over-end for 12 h, centrifuged at 1200 g for 20 min and the supernatants discarded.The resins were rinsed twice with ultrapure deionised water (Mill-Q) and elutedwith 6 ml of 1 M HNO3. The eluted solutions were analyzed for 110mAg activity bygamma spectroscopy and total Ag concentrations by ICP-OES or ICP-MS. The E-values accounting for the possible presence of non-exchangeable Ag in soil solutions(E-value) was determined using the following equation:
E � value ¼ Sr*
� IR � v
m
where, E-value ¼ resin-corrected isotopically labile Ag concentration in the soil inmg kg�1; S ¼ solution Ag concentration in resin eluate in mg L�1; r* ¼ 110mAg so-lution radioactivity in resin eluate in Bq; IR ¼ initial spiked 110mAg radioactivity inBq; v ¼ solution volume in L; and m ¼ sample mass in kg.
The change in lability of added soluble metals usually requires consideration ofthe lability of background metals in the native soil, but in all the soils used in thisstudy the background concentrations of Ag were below instrumental detectionlimits (<0.04 mg kg�1). Hence the lability of added soluble Agþ was calculated as apercentage of total Ag in soil (E%).
The time zero E-values for Ag were determined in soils after simultaneouslyspiking soil suspension, following initial equilibration with 0.01 M Ca(NO3)2, with200 ml of the 110mAg spike and 200 ml of the required soluble Agþ concentration. TheAg concentration of the spiking solution for each soil was measured by ICP-OES toconfirm total Ag spike concentrations in soils at time zero.
65
2.4. Solid phase speciation of Ag in soils by X-ray absorption spectroscopy (XAS)
In this study we used the specific signature of various Ag species as assessed byXANES spectroscopy to investigate the behaviour and transformation of addedsoluble Ag in soils. The XANES data were collected at the Materials ResearchCollaborative Access Team (MRCAT) beamline 10-ID, Sector 10 located at theAdvanced Photon Source (APS), Argonne National Laboratory (ANL), Argonne, IL.(Segre et al., 2000) The electron storage ring was operating at 7 GeV in top-upmode.A liquid N2 cooled double crystal Si(111) monochromator was used to select incidentphoton energies and a platinum-coated mirror was used for harmonic rejection. Themonochromator was calibrated by assigning the first derivative inflection point ofthe absorption K-edge of Ag metal at 25,514 eV and an Ag metal foil spectrum wascollected congruently with each sample scan. Samples were pressed into pellets andthree XANES scans were collected for each sample in transmission and fluorescencemode using a Gemultielement detector (Canberra). The possibility of beam-inducedphoto-reduction was investigated by repeating three scans at the same location inselected samples. No indication of an increase in metallic Ag was observed; never-theless repeat scans were collected at different locations of the samples to reducethis risk of photo-reduction. The Ag standards analysed included: Ag carbonate(Ag2CO3), Ag oxide (Ag2O), Ag sulfide (Ag2S), Ag chloride (AgCl), metallic Ag, Agsulphate (Ag2SO4), Ag glutathione (Ag-GSH), Ag-humic acid and Ag sorbed by fer-rihydrite, cystine and acetate. The standardmaterials were analysed as finely groundpowders (diluted in boron nitride to approximately 1000 mg kg�1). Principalcomponent analysis (PCA) of the normalised sample spectra was used to estimatethe likely number of species contained in the samples, whilst target transformation(TT) was used to identify relevant standards for linear combination fitting (LCF) ofthe sample spectra (Malinowski, 1991). The PCA and TT were performed usingSixPack (Webb, 2005) while data normalisation and LCF were performed usingAthena (Ravel et al., 2005). Fitting range was �30 to þ100 eV relative to the Ag K-edge. For each sample, the combination of standards with the lowest residualparameter was chosen as the most likely set of components.
2.5. Statistical analysis
Analyses of variance (ANOVA) were conducted using Genstat 11 to determine ifsignificant differences in labile Ag concentrations were present between samplesaged for different durations of time. All statistical analyses were conducted at asignificance level of 0.05.
3. Results and discussion
3.1. Changes in labile Ag (E%) concentrations in soils with time
The labile concentration of Ag in the soils was found to signifi-cantly decrease after the twoweek ageing period by approximately20e90%, followed by an additional significant decrease of 10e40%after the six month ageing period (Fig. 1). The overall decrease inlabile Ag in soils after 6 month ageing was approximately 50e100%.After two weeks the decrease in labile Ag was similar for theKingaroy, Charleston and Inman Valley soils where approximately80% of the total added Ag was labile in soils. The Balaklava and PortKenny soils experienced the most rapid ageing after two weeks

L. Settimio et al. / Environmental Pollution 191 (2014) 151e157154
with the greatest decreases in labile Ag (E% was 12% and 32%,respectively). After six months ageing the Kingaroy and Charlestonsoils had similar decreases in labile Ag where approximately halfthe added Ag was non-labile, while in the Millicent and InmanValley soils approximately three quarters of the added Ag was non-labile. The decrease in Ag lability was the most pronounced in theBalaklava and Port Kenny soils, where greater than 90% of theadded Ag was removed into non-labile forms in these soils (Fig. 1).
The rapid ageing observed after two weeks in this study con-firms previous findings that suggested rapid ageing of soluble Ag insoils (Settimio et al., 2014). The six month ageing results suggestslower processes and reactions are taking place in the soilsremoving Ag further from the labile pool over a longer time period.The Balaklava and Port Kenny soils, which showed the most rapidageing throughout the experiment, are distinguishable from theother soils tested due to their high pH (8.5e8.8) (Table 1). Theseresults are similar to those found for other metals (i.e. Co,(Wendling et al., 2009) Cu13 and Ni (Ma et al., 2013)) which alsoexperienced a rapid and largely pH-dependent initial ageing (2e3weeks) in soils followed by longer term ageing (�6 months) atslower rates.
Fig. 2. Normalised Ag K-edge XANES spectra of the standards investigated.
3.2. Solid-phase speciation of Ag in soils with time
Of the standards examined, TT identified six standard Ag specieswith SPOIL values <3 (Malinowski, 1979), and thus consideredsuitable for LCF of Ag speciation in the soil samples: Ag adsorbed onferrihydrite, AgCl, metallic Ag, Ag2S, Ag-cystine and Ag-GSH (Fig. 2).Furthermore, PCA showed that the majority of variability in thespectra could be explained by a mixture of four components.Therefore, a maximum combination of up to four standards wasselected for LCF analysis. Examination of the XANES spectra of thestandards (Fig. 2) showed that the metallic Ag, AgCl and Ag sorbedon ferrihydrite have characteristic spectra that could be easilydistinguished from the Ag bonded with S standards and each other.The Ag-cystine, Ag-sulfide and Ag-GSH spectra were similar sotheir percentage contributions to the sample model fits werecombined (Table 2).
The Ag K-edge XANES spectra of all soil samples and time pe-riods are shown in Fig. 3, where it is also apparent that the LCFanalysis provided good fits to all experimental data. The speciationdata are summarised in Table 2, showing the percentage contri-bution of each Ag species for each soil and time period. A visualinspection of the spectra for samples reported in Fig. 3 immediatelysuggests that metallic Ag was a dominant species in the Balaklava,Port Kenny and Inman Valley soils at the six month time period.There is an obvious (e.g. Balaklava) or more subtle (e.g. Charleston)change in spectra from time zero to six months for all soils thatwould suggest some formation of metallic Ag over time. In fact,analysis of the LCF results indicates that metallic Ag formationincreased over time for all soils except Kingaroy and Millicent(Table 2). The metallic Ag observed in the Kingaroy soil at time zerois likely a result of rapid reduction of soluble Ag in this soil thatoccurred prior to XAS analysis during the two hour delay betweenthe soil samples being spiked with the concentrated Ag solutionand collection of the spectra. In addition to the metallic Ag for-mation, there was a significant amount of Ag bonded with S speciesand this was consistent across all soils. The presence of AgCl wasalso observed but mostly at the time zero or two week period withthe exception of Millicent. Silver sorbed on ferrihydrite (a model fora variety of iron oxohydroxide minerals) was most dominant in theKingaroy soil but was also present in the Charleston and Balaklavasoils at two weeks and in the Port Kenny and Inman Valley soils attwo weeks and six months.
66
3.3. Relating labile Ag concentrations and solid phase speciation ofAg in soils with time
Of the standards that contributed to the Ag speciation in thesesamples (Table 2) it was assumed that metallic Ag and AgCl wouldbe non-labile forms of Ag (i.e. not readily isotopically exchange-able), with the remainder (Ag bonded with S species) thought to bea mixture of labile and non-labile Ag.
It is evident that immediately after spiking the soils with solubleAg, the predominant form of Ag in the samples was Ag bound toreduced S groups; most likely, given the aerobic conditions of thesoils, those found associated with organic matter (represented hereby the Ag-cystine and Ag-GSH standards). The exception to thisfinding was the Millicent soil, which was found to contain a higherpercentage of AgCl, possibly due to its higher water-soluble Clconcentrations and precipitation following addition of soluble Ag tothe surface of this soil (Table 1). The strong association of Ag withsoil organic matter has been known for some time (Jones et al.,1986; Szabo et al., 1995). Over time the percentage of Ag bondedwith S species decreased in all soils except Charleston andMillicent(higher organic matter soils) where Ag bonded with S speciesincreased with time (Table 2). The percentage of metallic Ag

Table 2Silver solid phase speciation as identified by LCF of K-edge XANES spectra. Silver species abundances are presented as percentages and the values in brackets show thepercentage variation in the calculated values. Goodness of fit is indicated by the R-factor.
Sample Ag sorbed on Fe-oxohydroxides Ag bonded with S species AgCl Metallic Ag R-factor � 1000
KingaroyTime zero (þ2 h) 18 (3) 38 (4) 29 (2) 16 (6) 0.102 weeks 41 (5) 30 (6) 23 (3) 6 (8) 0.206 months 59 (3) 0 (5) 13 (3) 29 (1) 0.19CharlestonTime zero (þ2 h) 75 (14) 25 (2) 0.142 weeks 22 (2) 55 (3) 13 (2) 11 (1) 0.076 months 72 (11) 29 (1) 0.07BalaklavaTime zero (þ2 h) 79 (15) 21 (2) 0.172 weeks 17 (3) 60 (13) 23 (1) 0.076 months 1 (0) 11 (0) 88 (0) 0.15Port KennyTime zero (þ2 h) 72 (15) 29 (2) 0.172 weeks 21 (3) 58 (13) 21 (1) 0.076 months 13 (2) 20 (9) 67 (1) 0.13MillicentTime zero (þ2 h) 3 (5) 40 (3) 57 (3) 0.252 weeks 71 (12) 30 (1) 0.096 months 72 (7) 15 (2) 14 (1) 0.08Inman ValleyTime zero (þ2 h) 16 (4) 52 (9) 31 (3) 0.182 weeks 11 (3) 73 (7) 17 (2) 0.096 months 12 (3) 35 (15) 53 (1) 0.06
Fig. 3. Normalised Ag K-edge XANES spectra of the soils at time zero (þ2 h), 2 weekand 6 month ageing periods (50% FC). The red lines show the best 4-component linearcombination fit of standard spectra. (For interpretation of the references to colour inthis figure legend, the reader is referred to the web version of this article.)
L. Settimio et al. / Environmental Pollution 191 (2014) 151e157 155
increased in all soils with time, except the Millicent soils, with thehighest amount occurring in the alkaline pH soils (Balaklava andPort Kenny) (Table 2).
Sulfidisation of Agþ ion with reduced S groups or reductiveprecipitation to Ag0 (metallic Ag) has not been reported in naturalsoils previously but Ag0 has been reported to form upon titration ofAgþ with a purified humic acid from soil (Maurer et al., 2012) andAg2S has been observed to form in wastewater treatment plants(WWTPs) where biosolids can contain Ag2S nanoparticles (Kimet al., 2010). Conditions in WWTPs are commonly anaerobic (fordenitrification to occur and for production of methane) so there areoften high concentrations of reduced S in WWTP liquors. In aerobicsoils, the presence of reduced S is unlikely except in anaerobicmicrosites and Agþ ion will combine readily with this reduced S toprecipitate as Ag2S. Soils rich in organic matter are also likely tohave higher levels of microbial respiration and hence a greaterlikelihood of having reduced S in anaerobic microsites (van der Leeet al., 1999). Reductive precipitation of Agþ ion in soils is highlylikely, given the standard electrode potential for the Agþ/Ag0
couple is 0.799 V (Evans et al., 2010). In the soil with the lowestcontent of organic matter and the highest clay content (Kingaroy),iron oxohydroxide sorbed Ag was the predominant form. The twosoils with the greatest decreases in labile Ag over the 6-monthageing period as determined by ID (Fig. 1: Balaklava and PortKenny) had the highest amount of metallic Ag formed as deter-mined by XAS. The metallic Ag would not be readily isotopicallyexchangeable unless it could be oxidised during the measurementof labile Ag and it is evident from the 6 month aged samples fromPort Kenny and Balaklava that this did not occur e there wastherefore reasonable agreement between the lability as determinedby ID and the solid-phase speciation of Ag as determined by XAS.
An examination of the lability and solid phase speciation resultsshows that generally there was an increase in the percentage ofmetallic Ag as labile Ag concentrations decreased in soils (Fig. 4a). Itis important to note that the percentage of metallic Ag in each soildoes not account for all non-labile Ag. The summary of the pro-posed transformations of Ag from labile to non-labile pools in soilsis summarised in Fig. 5. Based on the labile Agmeasured (Fig.1) and
67

Fig. 4. Relationship between (a) the percentage of non-labile Ag in soils determined byisotope dilution and the percentage of metallic Ag present in soil determined by XAS.For the fitted line: R2 ¼ 0.93. The point circled in (a) is the Millicent soil with very highorganic matter content (excluded from the regression); and (b) the percentage oforganic carbon in soils and the percentage of Ag bonded with S species formed 6months after addition of soluble Agþ to soils. For the fitted line: R2 ¼ 0.84.
L. Settimio et al. / Environmental Pollution 191 (2014) 151e157156
the percentage contributions of each species (Table 2), whenmetallic Ag does not account for all non-labile Ag, there must be acontribution from the other species. This means that some ironoxohydroxide sorbed Ag may be irreversibly sorbed or surfaceprecipitated, it may also be fixed within crystal lattices of oxides(Fig. 5). Although iron oxohydroxide sorbed Ag is not as strongly
Fig. 5. Summary schematic of the possible transformations of labile Ag to non-labileAg fractions in soils according to speciation data collected by XANES. The dottedoval represents all labile forms of Ag: Agþ, reversibly sorbed Agþ to Fe-oxohydroxidesand organic S of organic matter, Agþ weakly complexed with other soil solution ligands(L). Non-labile Ag is solids: metallic Ag, AgCl and Ag2S and Ag irreversibly bound toorganic S and Fe-oxohydroxides (surface precipitated or fixed within crystal lattices).
68
sorbed as Ag to soil organic matter, it is thought that over timeoxides are important for retaining Ag in soils (Jacobson et al., 2005).For Ag bonded with S species, it is likely that the Ag2S is non-labiledue to its extremely low solubility (Levard et al., 2012), but therecould also be non-labile Ag associated with the Ag-cystine and Ag-GSH if Ag is strongly bound rather than reversibly sorbed to solidphase organic matter (thiols and disulfides) (Fig. 5). There was apositive correlation (R2 ¼ 0.84) found between the organic carboncontent in the soils and the percentage of the sum of all Ag bondedwith S species (Fig. 4b). It is well established that Ag is stronglyassociated with S groups, (Smith et al., 2002; Kramer et al., 2007;Bell and Kramer, 1999) so this relationship shows that the associ-ation of Ag with soil organic carbon is likely through the organic Sin soil organic matter. Further work is required to establish theextent of these AgeS interactions in soil and their effect on Aglability. When considering the non-labile forms of Ag: metallic Ag,Ag2S and AgCl (Fig. 5), it is important to remember that the for-mation of these solid phases is still a reversible reaction, eventhough their dissolution may be minimal and slow especially formetallic Ag and Ag2S (Ksp ¼ 5.92 � 10�51) but more likely for AgCl(Ksp ¼ 1.77 � 10�10) (Levard et al., 2012). The data presented heresuggests that all these species to some degree are capable of thesereverse reactions in the time frame between two weeks to sixmonths based on the speciation data collected for soils: Charleston,Balaklava, Port Kenny and Millicent (Table 2). It is unknown if Agcomplexed with soil solution ligands such as DOC (Adams andKramer, 1999) or polysulfide complexes (Fig. 5) are labile (Belland Kramer, 1999). Further work is required to establish whetherAg complexed with soil solution ligands can be regarded as labileand potentially available for uptake by soil organisms. It is alsoimportant to consider that formation of metallic Ag may be a sec-ondary reaction occurring once all sites of the soil organic matter(SOM) are saturated and this may be more prominent in soils withhigher Ag exposure concentrations or lower SOM.
This study has shown that there is a significant decrease in labileAg over time for all soils. There was rapid ageing within the firsttwo weeks of addition of soluble Ag, suggesting that Ag ageingneeds to be considered in any risk assessments for Ag in theterrestrial environment where this is likely to be a relevant sourcespecies. Speciation data showed that Agþ is reduced to metallic Agover time in soils and associations with S and iron oxides in soil canalso lead to reductions in Ag lability.
Acknowledgement
The authors thank the Precious Metals and Rhenium Con-sortium and Minerals Down Under Flagship (CSIRO) for financialsupport and acknowledge support from the Australian ResearchCouncil (FT100100337, FT130101003 and DP120101115). We alsothank Cathy Fiebiger, Gill Cozens and Claire Wright for experttechnical assistance.
References
Adams, N.W.H., Kramer, J.R., 1999. Silver speciation in wastewater effluent, surfacewaters, and pore waters. Environ. Toxicol. Chem. 18 (12), 2667e2673 http://dx.doi.org/10.1002/etc.5620181203.
Barrow, N.J., 1998. Effects of time and temperature on the sorption of cadmium,zinc, cobalt, and nickel by a soil. Aust. J. Soil. Res. 36 (6), 941e950 http://dx.doi.org/10.1071/s98048.
Beattie, I.R., Haverkamp, R.G., 2011. Silver and gold nanoparticles in plants: sites forthe reduction to metal. Metallomics 3 (6), 628e632. http://dx.doi.org/10.1039/c1mt00044f.
Bell, R.A., Kramer, J.R., 1999. Structural chemistry and geochemistry of silver-sulfurcompounds: critical review. Environ. Toxicol. Chem. 18 (1), 9e22 http://dx.doi.org/10.1002/etc.5620181203.

L. Settimio et al. / Environmental Pollution 191 (2014) 151e157 157
Benn, T., Cavanagh, B., Hristovski, K., Posner, J.D., Westerhoff, P., 2010. The release ofnanosilver from consumer products used in the home. J. Environ. Qual. 39 (6),1875e1882 http://dx.doi.org/10.2134/jeq2009.0363.
Blamey, F.P.C., Kopittke, P.M., Wehr, J.B., Kinraide, T.B., Menzies, N.W., 2010. Rhizo-toxic effects of silver in cowpea seedlings. Environ. Toxicol. Chem. 29 (9), 2072e2078 http://dx.doi.org/10.1002/etc.236.
Bone, A.J., Colman, B.P., Gondikas, A.P., Newton, K.M., Harrold, K.H., Cory, R.M.,Unrine, J.M., Klaine, S.J., Matson, C.W., Di Giulio, R.T., 2012. Biotic and abioticinteractions in aquatic microcosms determine fate and toxicity of Ag nano-particles: part 2-toxicity and Ag speciation. Environ. Sci. Technol. 46 (13),6925e6933 http://dx.doi.org/10.1021/es204683m.
Coutris, C., Joner, E.J., Oughton, D.H., 2012. Aging and soil organic matter contentaffect the fate of silver nanoparticles in soil. Sci. Total Environ. 420, 327e333http://dx.doi.org/10.1016/j.scitotenv.2012.01.027.
Crout, N.M.J., Tye, A.M., Zhang, H., McGrath, S.P., Young, S.D., 2006. Kinetics of metalfixation in soils: measurement and modeling by isotopic dilution. Environ.Toxicol. Chem. 25 (3), 659e663 http://dx.doi.org/10.1897/05-069r.1.
Elvers, B., Hawkins, S., Russey, W., Schulz, G., 1993. Silver, silver compounds andsilver alloys. In: Renner, H. (Ed.), Ullmann’s Encyclopedia of Industrial Chem-istry, fifth ed. VCH: Weinham, Germany.
Evans, L.J., Barabash, S.J., 2010. Molybdenum, silver, thallium and vanadium. In:Hooda, P.S. (Ed.), Trace Elements in Soils. Blackwell Publishing Ltd, Wiltshire,pp. 516e549.
Fendorf, S., La Force, M.J., Li, G.C., 2004. Temporal changes in soil partitioning andbioaccessibility of arsenic, chromium, and lead. J. Environ. Qual. 33 (6), 2049e2055 http://dx.doi.org/10.2134/jeq2004.2049.
Gee, G.W., Bauder, J.W., 1986. Particle-Size Analysis, pp. 383e411.Innovotech Products w Agress�/AgreGuard� Crop Protection. http://www.
innovotech.ca/agress.php (accessed 15th April).Jacobson, A.R., McBride, M.B., Baveye, P., Steenhuis, T.S., 2005. Environmental factors
determining the trace-level sorption of silver and thallium to soils. Sci. TotalEnviron. 345 (1e3), 191e205 http://dx.doi.org/10.1016/j.scitotenv.2004.10.027.
Johnson, J., Jirikowic, J., Bertram, M., Van Beers, D., Gordon, R.B., Henderson, K.,Klee, R.J., Lanzano, T., Lifset, R., Oetjen, L., Graedel, T.E., 2005. Contemporaryanthropogenic silver cycle: a multilevel analysis. Environ. Sci. Technol. 39 (12),4655e4665 http://dx.doi.org/10.1021/es048319x.
Jones, K.C., Davies, B.E., Peterson, P.J., 1986. Silver in Welsh soils e physical andchemical distribution studies. Geoderma 37 (2), 157e174. http://dx.doi.org/10.1016/0016-7061(86)90028-5.
Kabata-Pendias, A., Pendias, H., 2000. Trace Elements in Soils and Plants. CRC Press,Boca Raton, Fla.
Kaegi, R., Voegelin, A., Sinnet, B., Zuleeg, S., Hagendorfer, H., Burkhardt, M.,Siegrist, H., 2011. Behavior of metallic silver nanoparticles in a pilot wastewatertreatment plant. Environ. Sci. Technol. 45 (9), 3902e3908 http://dx.doi.org/10.1021/es1041892.
Kim, B., Park, C.S., Murayama, M., Hochella, M.F., 2010. Discovery and character-ization of silver sulfide nanoparticles in final sewage sludge products. Environ.Sci. Technol. 44 (19), 7509e7514 http://dx.doi.org/10.1021/es101565j.
Kirby, J.K., McLaughlin, M.J., Ma, Y.B., Ajiboye, B., 2012. Aging effects on molybdatelability in soils. Chemosphere 89 (7), 876e883. http://dx.doi.org/10.1016/j.chemosphere.2012.05.013.
Kramer, J.R., Bell, R.A., Smith, D.S., 2007. Determination of sulfide ligands and as-sociation with natural organic matter. Appl. Geochem. 22 (8), 1606e1611 http://dx.doi.org/10.1016/j.apgeochem.2007.03.026.
Levard, C., Hotze, E.M., Lowry, G.V., Brown Jr., G.E., 2012. Environmental trans-formations of silver nanoparticles: impact on stability and toxicity. Environ. Sci.Technol. 46 (13), 6900e6914 http://dx.doi.org/10.1021/es2037405.
Lombi, E., Susini, J., 2009. Synchrotron-based techniques for plant and soil science:opportunities, challenges and future perspectives. Plant Soil 320 (1e2), 1e35.http://dx.doi.org/10.1007/s11104-008-9876-x.
Lombi, E., Donner, E., Taheri, S., Tavakkoli, E., Jamting, A.K., McClure, S., Naidu, R.,Miller, B.W., Scheckel, K.G., Vasilev, K., 2013. Transformation of four silver/silverchloride nanoparticles during anaerobic treatment of wastewater and post-processing of sewage sludge. Environ. Pollut. 176, 193e197 http://dx.doi.org/10.1016/j.envpol.2013.01.029.
Ma, Y.B., Lombi, E., Oliver, I.W., Nolan, A.L., McLaughlin, M.J., 2006. Long-term agingof copper added to soils. Environ. Sci. Technol. 40 (20), 6310e6317 http://dx.doi.org/10.1021/es060306r.
Ma, Y.B., Lombi, E., Nolan, A.L., McLaughlin, M.J., 2006. Short-term natural attenu-ation of copper in soils: effects of time, temperature, and soil characteristics.Environ. Toxicol. Chem. 25 (3), 652e658 http://dx.doi.org/10.1897/04-601r.1.
Ma, Y., Lombi, E., McLaughlin, M.J., Oliver, I.W., Nolan, A.L., Oorts, K., Smolders, E.,2013. Aging of nickel added to soils as predicted by soil pH and time. Chemo-sphere 92 (8), 962e968. http://dx.doi.org/10.1016/j.chemosphere.2013.03.013.
Ma, R., Levard, C., Judy, J.D., Unrine, J.M., Durenkamp, M., Martin, B., Jefferson, B.,Lowry, G.V., 2014. Fate of zinc oxide and silver nanoparticles in a pilot waste-water treatment plant and in processed biosolids. Environ. Sci. Technol. 48 (1),104e112 http://dx.doi.org/10.1021/es403646x.
Malinowski, E.R., 1979. Theory of error for target factor analysis with applications tomass spectrometry and nuclear magnetic resonance spectrometry. Anal. Chim.Acta Comput. Tech. Optim. 103 (4), 339e354.
Malinowski, E.R., 1991. Factor Analysis in Chemistry. John Wiley, New York.Marques, L.L., Olson, M.E., Harding, M.W., 2011. Compositions and Methods
Comprising High Valency Silver for Increasing Seed Germination.US20110275518 A1.
69
Marshall, T.J., Holmes, J.W., Rose, C.W., 1979. Soil Physics. Cambridge UniversityPress, Cambridge.
Maurer, F., Christl, I., Hoffmann, M., Kretzschmar, R., 2012. Reduction and reox-idation of humic acid: influence on speciation of cadmium and silver. Environ.Sci. Technol. 46 (16), 8808e8816 http://dx.doi.org/10.1021/es301520s.
McLaughlin, M.J., Hamon, R.E., McLaren, R.G., Speir, T.W., Rogers, S.L., 2000. Review:a bioavailability-based rationale for controlling metal and metalloid contami-nation of agricultural land in Australia and New Zealand. Aust. J. Soil. Res. 38 (6),1037e1086 http://dx.doi.org/10.1071/sr99128.
Morones, J.R., Elechiguerra, J.L., Camacho, A., Holt, K., Kouri, J.B., Ramirez, J.T.,Yacaman, M.J., 2005. The bactericidal effect of silver nanoparticles. Nanotech-nology 16 (10), 2346e2353. http://dx.doi.org/10.1088/0957-4484/16/10/059.
Murata, T., Kanao-Koshikawa, M., Takamatsu, T., 2005. Effects of Pb, Cu, Sb, In andAg contamination on the proliferation of soil bacterial colonies, soil dehydro-genase activity, and phospholipid fatty acid profiles of soil microbial commu-nities. Water Air Soil Pollut. 164 (1e4), 103e118 http://dx.doi.org/10.1007/s11270-005-2254-x.
Nakazawa, E., Ikemoto, T., Hokura, A., Terada, Y., Kunito, T., Yamamoto, T.,Yamada, T.K., Rosas, F.C.W., Fillmann, G., Tanabe, S., Nakai, I., 2011. Silverspeciation in liver of marine mammals by synchrotron X-ray absorption finestructure and X-ray fluorescence spectroscopies. J. Environ. Monit. 13 (6), 1678e1686 http://dx.doi.org/10.1039/c1em10115c.
Nolan, A.L., Lombi, E., McLaughlin, M.J., 2003. Metal bioaccumulation and toxicity insoils e why bother with speciation? Aust. J. Chem. 56 (2e3), 77e91 http://dx.doi.org/10.1071/ch02226.
Nolan, A.L., Ma, Y.B., Lombi, E., McLaughlin, M.J., 2004. Measurement of labile Cu insoil using stable isotope dilution and isotope ratio analysis by ICP-MS. Anal.Bioanal. Chem. 380 (5e6), 789e797 http://dx.doi.org/10.1007/s00216-004-2816-6.
Oliver, I.W., McLaughlin, M.J., Merrington, G., 2005. Temporal trends of total andpotentially available element concentrations in sewage biosolids: a comparisonof biosolid surveys conducted 18 years apart. Sci. Total Environ. 337 (1e3), 139e145 http://dx.doi.org/10.1016/j.scitotenv.2004.07.003.
Oorts, K., Ghesquiere, U., Smolders, E., 2007. Leaching and aging decrease nickeltoxicity to soil microbial processes in soils freshly spiked with nickel chloride.Environ. Toxicol. Chem. 26 (6), 1130e1138 http://dx.doi.org/10.1897/06-533r.1.
Ratte, H.T., 1999. Bioaccumulation and toxicity of silver compounds: a review. En-viron. Toxicol. Chem. 18 (1), 89e108 http://dx.doi.org/10.1002/etc.5620180112.
Ravel, B., Newville, M., 2005. Athena, Artemis, Hephaestus: data analysis for X-rayabsorption spectroscopy using IFEFFIT. J. Synchrotron Radiat. 12, 537e541http://dx.doi.org/10.1107/s0909049505012719.
Rayment, G.E., Higginson, F.R., 1992. Australian Laboratory Handbook of Soil andWater Chemical Methods. Inkata Press, Melbourne.
Roh, J.Y., Sim, S.J., Yi, J., Park, K., Chung, K.H., Ryu, D.Y., Choi, J., 2009. Ecotoxicity ofsilver nanoparticles on the soil nematode Caenorhabditis elegans using func-tional ecotoxicogenomics. Environ. Sci. Technol. 43 (10), 3933e3940 http://dx.doi.org/10.1021/es803477u.
Scheckel, K.G., Luxton, T.P., El Badawy, A.M., Impellitteri, C.A., Tolaymat, T.M., 2010.Synchrotron speciation of silver and zinc oxide nanoparticles aged in a kaolinsuspension. Environ. Sci. Technol. http://dx.doi.org/10.1021/es9032265.
Segre, C.U., Leyarovska, N.E., Chapman, L.D., Lavender, W.M., Plag, P.W., King, A.S.,Kropf, A.J., Bunker, B.A., Kemner, K.M., Dutta, P., Duran, R.S., Kaduk, J., 2000. TheMRCAT insertion device beamline at the Advanced Photon Source. AIP Conf.Proc. 521, 419e422.
Settimio, L., McLaughlin, M.J., Kirby, J.K., Langdon, K., 2014. A method to determinesilver partitioning and lability in soils. Environ. Chem. 11 (1), 63e71 http://dx.doi.org/10.1071/EN13163.
Smith, D.S., Bell, R.A., Kramer, J.R., 2002. Metal speciation in natural waters withemphasis on reduced sulfur groups as strong metal binding sites. Comp. Bio-chem. Physiol. C Pharmacol. Toxicol. 133 (1e2), 65e74 http://dx.doi.org/10.1016/s1532-0456(02)00108-4.
Szabo, G., Guczi, J., Valyon, J., Bulman, R.A., 1995. Investigations of the sorptioncharacteristics of radiosilver on some natural and artificial soil particles. Sci.Total Environ. 172 (1), 65e78 http://dx.doi.org/10.1016/0048-9697(95)04781-6.
Throback, I.N., Johansson, M., Rosenquist, M., Pell, M., Hansson, M., Hallin, S., 2007.Silver (Agþ) reduces denitrification and induces enrichment of novel Nir-kgenotypes in soil. FEMS Microbiol. Lett. 270 (2), 189e194 http://dx.doi.org/10.1111/j.1574-6968.2007.00632.x.
van der Lee, G.E.M., de Winder, B., Bouten, W., Tietema, A., 1999. Anoxic micrositesin Douglas fir litter. Soil Biol. Biochem 31 (9), 1295e1301. http://dx.doi.org/10.1016/s0038-0717(99)00048-6.
Webb, S.M., 2005. SIXpack: a graphical user interface for XAS analysis using IFEFFIT.Phys. Scr. T115, 1011e1014 http://dx.doi.org/10.1238/Physica.Topical.115a01011.
Wendling, L.A., Ma, Y.B., Kirby, J.K., McLaughlin, M.J., 2009. A predictive model of theeffects of aging on cobalt fate and behavior in soil. Environ. Sci. Technol. 43 (1),135e141 http://dx.doi.org/10.1021/es801322r.
Whitley, A.R., Levard, C., Oostveen, E., Bertsch, P.M., Matocha, C.J., von derKammer, F., Unrine, J.M., 2013. Behavior of Ag nanoparticles in soil: effects ofparticle surface coating, aging and sewage sludge amendment. Environ. Pollut.182, 141e149 http://dx.doi.org/10.1016/j.envpol.2013.06.027.
Young, S.D., Zhang, H., Tye, A.M., Maxted, A., Thums, C., Thornton, I., 2005. Char-acterizing the availability of metals in contaminated soils. I. The solid phase:sequential extraction and isotopic dilution. Soil Use Manage. 21, 450e458http://dx.doi.org/10.1079/sum2005348.

70

CHAPTER 4
COMPLEXATION OF SILVER AND DISSOLVED ORGANIC MATTER IN SOIL WATER EXTRACTS
The work contained in this chapter has been submitted to Environmental Pollution.
71

72

Statement of Authorship Title of Paper
Publication Status Published, Accepted for Publication, Submitted for Publication, Publication style
Publication Details
Author Contributions By signing the Statement of Authorship, each author certifies that their stated contribution to the publication is accurate and that permission is granted for the publication to be included in the candidate’s thesis.
Name of Principal Author (Candidate)
Contribution to the Paper
Signature Date
Name of Co-Author
Contribution to the Paper
Signature Date
Name of Co-Author
Contribution to the Paper
Signature Date
Name of Co-Author
Contribution to the Paper
Signature Date
Complexation of silver and dissolved organic matter in soil water extracts
●
Submitted to Environmental Pollution
Lara Settimio
Experimental development, performed analysis on all samples, data analysis and critical interpretation, wrote manuscript.
Mike McLaughlin
Supervised development of work, data analysis and interpretation, reviewed manuscript.
Jason Kirby
Supervised development of work, data analysis and interpretation, reviewed manuscript.
Kate Langdon
Supervised development of work, data analysis and interpretation, reviewed manuscript.
20-10-2014
20-10-2014
73

Statement of Authorship Title of Paper
Publication Status Published, Accepted for Publication, Submitted for Publication, Publication style
Publication Details
Author Contributions By signing the Statement of Authorship, each author certifies that their stated contribution to the publication is accurate and that permission is granted for the publication to be included in the candidate’s thesis.
Name of Principal Author (Candidate)
Contribution to the Paper
Signature Date
Name of Co-Author
Contribution to the Paper
Signature Date
Name of Co-Author
Contribution to the Paper
Signature Date
Name of Co-Author
Contribution to the Paper
Signature Date
Complexation of silver and dissolved organic matter in soil water extracts
●
Submitted to Environmental Pollution
Lara Settimio
Experimental development, performed analysis on all samples, data analysis and critical interpretation, wrote manuscript.
Les Janik
Supervised development of work, data analysis and interpretation, reviewed manuscript.
Scott Smith
Supervised development of work, data analysis and interpretation, reviewed manuscript.
08/10/2014
22/10/2014
74

Abstract
There is increasing interest in understanding the behaviour and fate of silver (Ag) in
soils due to an increased use of this metal in consumer and industrial products. In soil
solutions and leachates, dissolved organic matter (DOM) and other soil colloids will
play a critical role in the availability of the Ag+ ion, but little is known about the
complexation and strength of binding between Ag+ and DOM. This study examined
and modelled the complexation and strength of binding of Ag+ with DOM in soil
extracts based on a range of chemical and quality DOM measurements. Silver ion
binding was measured by addition of soil water extracts spiked with the 110mAg
radioisotope to a cation exchange resin which was used to bind free and rapidly
exchangeable 110mAg+ in solutions. Up to 70% of Ag was found to be strongly
complexed in solution and therefore is not readily bioavailable. Characterization of the
DOM in the soil water extracts was carried out by size fractionation and elemental
analysis, and spectroscopic analysis using ultraviolet/visible (UV/Vis), fluorescence
and mid infrared (MIR) spectroscopy. This was followed by the development of a
partial least-squares regression model to predict Ag complexation with DOM in soil
water extracts. The variability in Ag+ binding by DOM across different soils was
closely related (R2= 0.8) to the MIR spectra of the extracts. The affinity of Ag+ for
DOM was stronger in solutions containing DOM with a greater content of humic
species and aromatic structures. The demonstrated affinity and ability of Ag+ to
complex with DOM could result in increased mobilisation of this metal in the soil
environment.
Introduction
Silver (Ag) and Ag nanoparticles (AgNPs) are used in solar energy production, water
purification, medicine and commercial products (e.g. socks and washing machines).[1]
75

The antibacterial properties of Ag and AgNPs are the key reason for their addition to a
range of consumer products and also represent a potential risk if released to the
environment.[2, 3] Exposure pathways include releases during mining and processing,
disposal of consumer and industrial products to wastewater, land application of
biosolids and through application of Ag-containing agricultural products, such as
Agress®, used for crop protection as a seed treatment and foliar spray to target
bacterial and fungal infestations.
While most studies on the environmental effects of Ag have focused on the aquatic
environment,[4-7] there is increasing need for information on the impacts of Ag in
terrestrial environments. Recent studies have shown that soluble Ag+ is rapidly
immobilised in soils (50% in 14d) and then undergoes slower long term aging, that
further reduces its lability, influenced by soil properties such as cation exchange
capacity, organic carbon and pH.[8-10] Solid phase speciation using X-ray absorption
near edge structure (XANES) spectroscopy showed that soluble Ag+ is reduced to
metallic Ag over time in soils and that this transformation, as well as associations of
Ag+ with Fe-oxohydroxides and reduced sulfur groups in organic matter, decrease Ag
lability.[11]
The Ag present in soil solutions is considered the most bioavailable fraction. In soil
solutions, Ag can be present as free Ag+ ions or inorganic and organic complexes.[12]
Settimio et al. (2014) found that the fraction of total Ag present in soil solutions as
soluble Ag+ (bound by a cation exchange resin) decreased (100% to 10%) with
increasing dissolved organic carbon (DOC) concentrations of 10 to 140 mg C L-1. The
authors suggested that this finding supported the hypothesis of strong binding of Ag by
76

DOC in soil water extracts (defined by the ability of Chelex resin to complex Ag+ with
a logK value of 7[6]). There is little information available in the literature on the
strength of binding and complexation of Ag+ with dissolved organic matter (DOM) in
soils. In aquatic environments, Ag+ can form complexes with DOM, especially with
humic and fulvic acids[12-15] but there is still limited understanding of this interaction in
soils.
The characterisation of DOM in soils is difficult due to its complex and heterogeneous
nature. The usual operational definition is that DOM is the organic matter fraction in
solution with a diameter less than 0.45 µm. Dissolved organic matter concentrations in
soil solutions are not usually directly quantified, but rather its concentration inferred
through measurement of DOC, which usually represents the bulk of its elemental
composition (~67%).[16] DOM consists of a mixture of carbohydrates, carboxylic acids,
amino acids, hydrocarbons and other unknown organic compounds (~20%) as well as
humic and fulvic substances (~80%).[17] Although DOM represents a small proportion
of the total organic matter content in soils it is considered to be the most mobile and
actively cycling fraction and as a result is highly significant to a range of
biogeochemical processes in the soil environment.[16]
Techniques used to characterize the DOM fraction present in soil solutions, include
nuclear magnetic resonance (NMR), ultraviolet/visible (UV/Vis) absorption, mid
infrared (MIR), fluorescence and X-ray absorption spectroscopy.[18-20] These techniques
provide information on the composition and functional groups of DOM. Techniques
such as NMR and synchrotron based X-ray absorption spectroscopy can provide
detailed characterisation information, however they are often inaccessible, costly,
77
require experienced operators and data collection or analysis can be slow. On the other
hand, IR, fluorescence and UV-Vis absorption instruments are commonly found in soil
chemistry laboratories and can provide rapid, efficient, sensitive and inexpensive
techniques for the characterisation of DOM in soil solutions.[21, 22]
Excitation-emission matrix (EEM) fluorescence coupled with parallel factor analysis
(PARAFAC) is increasingly being used as a powerful tool to characterise DOM from
aquatic systems,[23] soils[24, 25] and wastewater.[26] The EEMs collected are depicted as
three dimensional contour plots that visualize fluorophores or fluorescent components
as a function of excitation-emission pairs of wavelengths. Data handling of EEMs with
PARAFAC analysis has improved the identification of fluorescent DOM components
and their abundance and contribution to the total fluorescence. Fluorescent components
identified in this way are normally classified as proteinaceous or humic/fulvic-like.[23]
Mid infrared analysis can be used to provide information on the composition of DOM
in soil solutions.[27] Attenuated total reflectance (ATR) spectroscopy, which utilizes the
absorption of radiation from the interface between a high refractive index, reflecting
crystal (e.g. diamond) or fibre and the sample surface, in conjunction with IR
spectroscopy, has successfully been used for DOM characterisation.[28] The MIR-ATR
technique has been successfully applied for the characterisation of DOM in
rainwater[29], regenerated peat soils[30] and environmental samples.[31, 32] The MIR-ATR
spectra can be related to sample properties by partial least squares regression (PLSR), a
multivariate method, commonly used to predict sample properties (e.g. pH, cation
exchange capacity) from multivariate data (including spectra).[21, 27, 33]
78

The transport and bioavailability of metals can be influenced by their ability to form
soluble or insoluble complexes with soil DOM.[16] Metals including Cu, Cd, Pb, Hg and
As have all been shown to have a strong affinity for DOM.[34, 35] Copper in particular
has been extensively studied and it is well established that DOM has the ability to
mobilise Cu in soils which is based on the DOM composition or quality (principally
aromatic carbon content).[36] Aromaticity of DOM can be measured by specific UV-
Visible absorbance at 254 nm (SUVA254) and has been shown to be significantly
positively correlated with the Cu-mobilising potential of DOM.36 The humic/fulvic
component of DOM is another quality measure and contains aromatic carbon,
carboxylic acid, alcohol, sulfhydryl or amine functional groups that are influential to
metal complexation.[34, 37]
The aims of this study are to develop a better understanding of the complexation of Ag
and DOM in soil water extracts using rapid, accessible and sensitive laboratory
methods (e.g. UV, fluorescence and IR spectroscopy and elemental analysis) and the
development of a partial least-squares regression model to predict Ag complexation
with DOM in soil water extracts. These findings will enable a better understanding of
the mobility and bioavailability of Ag in soil environments.
Materials and Methods
Soil sampling and general characterisation
This study used 18 Australian soils and two soils from Europe. The soils were collected
from a depth of 0-10 cm, air-dried, homogenized and sieved to <2 mm. Selected
physical and chemical properties for the experimental soils can be found in Table 1.
79

Soil pH was measured using a soil:solution ratio of 1:5 (m v-1), with ultrapure
deionized water (Milli-Q, Millipore) and shaking for 1 h. Total organic carbon (TOC)
content, cation exchange capacity (CEC), particle size and oxalate-extractable
aluminium (Alox) and iron (Feox) were determined according to standard methods.[38, 39]
Background Ag concentrations in soils were determined by inductively coupled
plasma-mass spectrometry (ICPMS) (Agilent 7700) following a microwave-assisted
aqua regia (US-EPA 3051A) digestion procedure. After digestion, samples were
filtered through 0.2-µm cellulose acetate filters (Sartorius, Germany) and Ag
concentrations determined by ICP-MS. The quantification limit of Ag in soils on a soil
basis was 0.04 mg kg-1. A certified reference material (NRC-CNRC PACS-2) was
included for quality control in all sample batches. The measured concentration of Ag in
the certified reference material was 1.15 ± 0.16 mg kg-1 (n=6), which was in close
agreement with the certified value of 1.22 ± 0.14 mg kg-1.
80

Tab
le 1. G
enera
l soil p
rop
erties.
Soil Soil
number
O
xalate Extractable
pHw
ater Total
organic carbon
CEC
§ A
l Fe
Clay
Silt Sand
Geogenic A
g (< 2µm
) (2-20 µm
) (20-2000 µm
)
%
cm
olc kg-1
mg kg
-1 m
g kg-1
%
%
%
mg kg
-1
Charleston
1 6.0
6.9 12
410 2500
14 12
63 bd
Port Kenny
2 7.8
1.8 13
483 295
12 4
21 bd
Inman V
alley 3
6.1 5.3
25 1460
3680 42
22 26
bd M
illicent 4
6.9 12
42 2300
1500 19
5 48
bd Tepko
5 6.8
1.0 5
180 200
8 3
89 bd
Thorpedale 6
4.9 4.6
14 4800
6600 50
34 16
0.05 Siekm
ann Trial 7
4.8 4.3
5 2200
3500 23
10 67
bd C
larke Hill
8 5.4
4.9 15
2180 3500
28 40
32 bd
Mintaro
9 5.7
2.6 20
7850 8300
41 22
37 bd
Ingham
10 4.7
1.7 7
920 1400
30 26
44 bd
Bordeaux
11 5.4
1.9 6
910 400
3 2
93 bd
Houthalen
12 4.8
1.5 5
483 762
1 2
93 bd
Kingaroy
13 7.3
0.9 13
2350 2500
60 17
19 0.10
Balaklava
14 7.1
1.9 27
1240 648
30 20
47 bd
Berrigan
15 6.1
0.4 3
230 300
7 5
88 bd
Emerald B
lack 16
7.4 0.9
66 2500
1800 59
14 27
bd M
innipa 17
7.4 0.2
2 110
100 1
<1 99
bd Pinnaroo
18 8.1
0.7 14
670 400
19 4
77 bd
Tully 19
4.9 2.7
5 6300
700 32
11 57
0.05 B
ute 20
6.9 0.5
4 190
200 5
2 92
bd *N
ote that particle size distribution for Port Kenny is equal to 37.2%
due to the high concentration of CaC
O3 that is present in this soil (60%
); §C
ation exchange capacity; bd indicates soils where total A
g concentrations were below
the detection limit: <0.04 m
g kg-
81

Determination of complexed Ag in soil water extracts
The percentage of Ag complexed by DOM in soil water extracts was determined using
the 110mAg radioactive tracer and a cation exchange resin procedure. Soil water extracts
(n=3) for 20 test soils were obtained using a 1:5 soil:solution ratio (m v-1) with
ultrapure deionized water (Milli-Q, Millipore), shaking end-over-end for 1 h and the
resulting suspensions filtered through a 0.2-µm polyethersulfone membrane (Sartorius,
Germany). Following filtration (~50 ml), 15 mL triplicate samples from each soil water
extract were transferred into 50 mL polypropylene centrifuge tubes (LabServ) and 50
µL of a soluble stock Ag+ solution (as AgNO3) was added to each sample to achieve a
final Ag+ concentration of 20 µg L-1 (to simulate an environmentally relevant soil pore
water concentration). Simultaneously with the soluble Ag spike, 12 kBq of 110mAg in
50 µL of carrier-free solution (in the form of 110mAgNO3 (t1/2 = 250 days)) was also
added to each sample. The 110mAg/Ag spiked soil suspensions were mixed on an end-
over-end shaker for 12 h. The 110mAg activity in the samples (4 ml) was then
determined by gamma spectroscopy (WIZARD2, Perkin Elmer) without any further
treatment.
The strength of complexation of Ag in soil water extracts was examined using a strong
cation exchange resin procedure. A 10-mL aliquot from each 0.2 µm filtered sample
was transferred into 50 ml centrifuge tubes, with approximately 0.1 g of Ca-form
Chelex 100 resin (Bio-Rad Laboratories). The extracts with the resin were mixed end-
over-end for 12 h to allow the free Ag+ and weakly complexed Ag in samples to bind to
the resin resulting in only the strong or irreversible ‘complexed Ag’ remaining in
solutions. The strong complexed Ag is defined by the Chelex resin’s ability over 12 h
to complex Ag+ (log K value of 7),[6] outcompeting all complexes that are weaker e.g.
82

N, O interactions (log K < 6) but not stronger e.g. inorganic sulfide interactions (log K
≈ 13).[40] The samples were then centrifuged at 1200 g for 20 min, supernatant removed
and the 110mAg activity in 4 ml of supernatant sample measured by gamma
spectroscopy. Blank solutions of ultrapure deionized water spiked with 12 kBq of
110mAg were also measured to ensure that the resin effectively bound all free 110mAg+ in
solution. The resin was found to bind 98±0.03 % of the 110mAg+ spiked into solution in
the absence of DOC.
The percentage of strong or irreversible complexed Ag in soil water extracts was
determined using the following equation:
% complexed Ag = 𝑟 𝑅⁄ × 100 Equation 1
where, % complexed Ag is the fraction of total Ag in soil water extracts that did not
bind to the resin in 12 h; r = 110mAg radioactivity in solutions after resin extraction for
12 h in Bq; and R = initial spiked 110mAg radioactivity (total 110mAg added to the
sample) in Bq.
Characterisation of 3 kDa to 0.2 µm size fractions in soil water extracts
Soil water extracts (n=3) were split into duplicates and analyzed independently to
characterize the 3 kDa to 0.2 µm colloidal size fraction in soil water extracts. The first
duplicate was filtered through a 0.2-µm polyethersulfone membrane (Sartorius,
Germany) and the second duplicate filtered through a 3 kDa centrifugal device with
Omega membrane (modified polyethersulfone) (Pall, USA) for 30 minutes at 2000 g.
The 0.2 µm and 3 kDa filtered extracts were analyzed in triplicate as three independent
samples, for total Al, Fe, P and S (ICP-OES) (Spectro ARCOS), dissolved organic
83

carbon (DOC) (Shimadzu TOC-VCSH/CSN + TNM-1) and anion (Br-, Cl-, F-, NO3-,
SO42-) (Dionex ICS-2500) concentrations.
Following analysis of the 3 kDa and 0.2 µm filtrates, colloidal concentrations were
calculated by subtraction of the 3 kDa concentrations from the 0.2 µm concentrations.
The elemental concentrations for Al, Fe and P are reported in Table S1, supplementary
information. The S calculated from sulfate anion concentrations was subtracted from
the total elemental S in the soil extracts to calculate “reduced S” values shown in Table
S2, supplementary information (note that there may be other S species remaining e.g.
disulfides). The total S and DOC concentrations were used to calculate a molar C:S
ratio of the 3 kDa-0.2 µm colloidal material (Table 2).
All further data analyses conducted to explain complexed Ag in the soil water extracts
were carried out with colloidal concentrations since Ag was only detected in this size
fraction (3 kDa to 0.2 µm fraction).
84

Table 2. Colloidal concentration of dissolved organic carbon (representing
dissolved organic matter concentration) and sulfur (S) and the molar C:S ratio
with standard deviation in brackets.
Soil DOC
(mg L-1) Total S (mg L-1) C:S ratio
1 39(4) 0.85(0.05) 123(9) 2 13(3) 0.33(0.10) 110(17) 3 43(9) 1.26(0.08) 90(13) 4 28(1) 1.21(0.25) 61(2) 5 22(4) 0.60(0.06) 100(4) 6 33(1) 0.75(0.03) 127(47) 7 59(4) 0.90(0.22) 175(2) 8 33(4) 0.49(0.06) 180(27) 9 31(4) 0.97(0.01) 88(18) 10 20(5) 0.56(0.01) 98(32) 11 3(1) 0.03(0.03) 262(103) 12 6(0) 0.07(0.04) 234(38) 13 0(0) <0.03 - 14 6(1) 0.29(0.04) 51(8) 15 7(1) <0.03 - 16 3(1) 0.10(0.04) 94(44) 17 2(1) <0.03 - 18 11(1) 0.17(0.01) 172(22) 19 12(1) 0.15(0.09) 154(16) 20 12(4) 0.14(0.01) 148(32)
Spectroscopic characterisation of DOM in soil water extracts
Characterisation of the DOM in the 0.2 µm filtered soil water extracts was carried out
with independent triplicate samples. Absorbance (UV), fluorescence and mid infrared
measurements were performed to measure the quality parameters of DOM such as
aromatic carbon content, fluorescent components and functional groups.
To measure absorbance and fluorescence, the soil water extracts were diluted using
ultrapure deionized water to DOC concentrations of 10 mg C L-1 or below to prevent
the need for an inner filter correction of the samples during PARAFAC analysis of
85

data. All absorbance and fluorescence scans of the extracts were performed in a 1-cm
quartz cuvette (Helma Canada Ltd., Concord, ON, Canada). The cuvette was pre-rinsed
thoroughly with ultrapure deionized water (Milli-Q), followed by washing with the
extract to be measured. For each extract, absorbance and fluorescence scans were
conducted using a Varian Cary 40 UV/visible spectrophotometer and Varian ECLIPSE
Cary fluorescence spectrophotometer (Varian Incorporation, Old Oak, NJ, USA),
respectively. The absorbance of the extracts was determined at a wavelength range of
200-800 nm. Specific UV absorbance at 254 nm, defined as: SUVA254 (L g-1cm-1), was
measured (SUVA254=Abs254/DOC) to estimate the aromaticity of the DOM.
The fluorescence of DOM in samples was measured using excitation wavelengths
between 200 and 450 nm, with 10-nm increments, and emission intensities were
collected for wavelengths of 250-600 nm every 1-nm increment. To conduct the
excitation-emission fluorescence measurements, ultrapure deionized water, standard
solutions of tryptophan (0.5 µM) and tyrosine (1.0 µM) (Sigma Aldrich, St. Louis, MO,
USA) and a mixed solution (10 mg C L-1 of a well characterised DOM isolate plus 0.5
µM tryptophan and 1.0 µM tyrosine) were scanned along with the samples to check for
instrument drift, which did not occur during the collection of spectra.
Excitation-emission matrices (EEMs) obtained from fluorescence measurements were
summarised into contour plots to identify the fluorescent components or peaks present
in each sample. DOM fluorescence is characterised by broad intensities when
excitation occurs between 200 and 450 nm.[41] Fulvic-like and humic-like components
are characterised by longer emission wavelengths (400-550 nm) whereas tryptophan-
like and tyrosine-like components are characterised by shorter emission wavelengths
86

(300-400 nm).[42] In order to quantify the relative abundance of each component for
every sample, the EEMs were modelled using PARAFAC as implemented in the PLS
toolbox (Eigenvectors Research Inc. WA, USA), which resulted in estimates of the
relative concentrations of five fluorescent components.
The MIR spectroscopy of the extracts was performed using a Varian Excalibur 3100
FTIR spectrometer (Agilent, Santa Clara, CA, USA) equipped with a 9 reflection ZnSe
crystal multiple attenuated total reflectance (MATR) accessory. For the triplicate liquid
extracts, spectra were scanned for 60 seconds over a spectral range of 7500-375 cm-1, at
a resolution of 8 cm-1. The 1.5 mL aliquots of each extract were spread onto the ATR
crystal plate with even distribution and dried at 60oC for 12 minutes, resulting in a thin
film. This procedure was repeated for each sample in order to have sufficient thickness
of DOM film on the ATR plate. Prior to addition of each liquid extract, a background
reference spectrum was collected from the clean ZnSe crystal without any sample.
Statistical Analysis
The EEM spectra were analysed with the PLS toolbox (Eigenvectors Research Inc.) to
determine the relative fluorescent concentration of each component. A 5 component
model was selected as it explained 99% of the the variance in the EEM spectra. The
MIR spectra were analysed by partial least squares regression (PLSR) using
Unscrambler multivariate analysis software (Camo Trondheim, Norway). The PLSR
regression models were derived by combining the ATR spectra and laboratory analysis
values and analysing these models with the PLSR software to determine the
contribution of each input variable to the total variance in Ag binding. Analyses of
variance (ANOVA), correlation matrices and principle component biplot analysis were
87

conducted using Genstat 15 (VSN International Ltd) to determine significant statistical
differences and correlations between samples and or variables (i.e. for the biplot
analysis). A significance level of 0.05 was implemented in all ANOVA and correlation
matrix analysis.
Results and Discussion
Complexed Ag in soil water extracts
The proportion of strong complexed Ag in the 0.2 µm filtered soil water extracts from
20 soils ranged from 2 – 67% over a DOC concentration range of 0 – 59 mg C L-1 (Fig.
1). There was a significant positive (p<0.001) relationship between the proportion of
complexed Ag (%) in the soil water extracts and the DOC concentration (Fig. 1).
Figure 1. Variation in the percentage of complexed Ag measured and the concentration of dissolved organic carbon in the 20 soil water extracts (n=3).
Normalisation of the complexed Ag (%) data to the concentration of DOC allows for
comparisons (complexed Ag % per mg C L-1) between soils (Fig. 2). The normalized
data varied considerably across the 20 soils, indicating that DOC concentration alone
could not explain the proportion of Ag complexation in the soil water extracts. For
example, soil 7 had the highest DOC concentration, however similar complexed Ag %
per mg C L-1 to other soils with significantly lower DOC concentrations (e.g. soils 9
0
20
40
60
80
0 20 40 60
Co
mp
lexe
d A
g (%
)
Dissolved organic carbon (mg C L-1)
88

and 19). Moreover for soils with similar DOC concentrations in soil water extracts
there were significant differences in the proportion of Ag complexation (e.g. soils 11,
12 and 16) (range = 0.9 to 2.2 complexed Ag % per mg C L-1). This finding suggests an
influence of DOM composition or quality on complexation capacity with Ag+ in soil
water extracts. Soils with the highest normalised complexed Ag values are thought to
have DOM that is optimal for Ag+ complexation. These results indicate that DOM from
soils 11, 14 and 16 has the greatest affinity for Ag+ with values of 2.1, 1.8 and 1.8
complexed Ag % per mg C L-1, respectively, which are greater than the mean value of
0.8 for the data set.
Figure 2. Comparison between complexed Ag % per mg C L-1 (unfilled vertical bars) to the concentration of DOC for the soil water extracts of the 20 soils (filled squares), error bars represent standard deviation of 3 replicates. Spectroscopic characterisation of the soil water extracts
The SUVA254 values determined from soil water extracts ranged from 7 to 40 L g-1 cm-1
representing a diverse range of aromaticity in the DOM across these soils (Fig.3).
These values are consistent with previous reported values for DOM from soils and at
the higher end comparable to that of Suwanee River Fulvic Acid (37 L g-1 cm-1).[36]
.
0
10
20
30
40
50
60
70
0.0
0.5
1.0
1.5
2.0
2.5
1 2 3 4 5 6 7 8 9 10 11 12 13 14 15 16 17 18 19 20
Dis
solv
ed
org
anic
car
bo
n
(mg
C L
-1)
Co
mp
lexe
d A
g %
p
er
mg
C L
-1
Soil Number
89

Figure 3. SUVA254nm (L g-1 cm-1) values across the 20 soils, error bars represent standard deviation of 3 replicates.
Five unique fluorescent components were identified using PARAFAC analysis on EEM
spectra for soil water extracts (Fig. 4). The proteinaceous components tryptophan (Trp)
and tyrosine (Tyr) are identified by their emission peaks at ~350 – 375 nm and 300 nm,
respectively. There are three humic-like components, HS1, HS2 and HS3, distinguished
by their excitation/emission peaks. Component HS1 has a primary excitation peak at
~250 nm and a secondary peak at ~325 nm. This component also has a broad emission
peak from 375 to 500 nm. Component HS2 has a primary excitation peak at just below
450 nm and a secondary peak around 250-300 nm. Its emission is similar at a
wavelength of 400–500 nm. Component HS3 has a primary excitation peak between
250-300 nm and a secondary peak between 350-400 nm. It has a very broad emission
peak at a longer wavelength than HS1 and HS2 from 450-550 nm. These humic-like
components that emit over slightly different emission wavelengths may reflect
differences in molecular weights, where larger molecular weight humic substances emit
at longer wavelengths (i.e. the HS3 component). These excitation-emission wavelength
pairs are similar to those previously reported.[43-45]
0
10
20
30
40
50
1 2 3 4 5 6 7 8 9 10 11 12 13 14 15 16 17 18 19 20
SUV
A2
54
(L g
-1cm
-1)
Soil Number
90

Figure 4. Parallel factor analysis (PARAFAC) components HS1, HS2, HS3, Trp and Tyr identified from the excitation–emission matrix (EEM) fluorescence spectra of DOM from all soil water extracts. Contour lines represent increasing fluorescence intensity in arbitrary units.
The relative content of these fluorescent components differed greatly among the DOM
from the soil water extracts (Fig. 5). The humic-like components dominated (75-95%)
the soil water extracts, while the proteinaceous components (Trp and Tyr) represented
approximately 2-25% of the total fluorescence in samples. The component with the
most variation across the 20 soil water extracts is HS3, suggesting that the larger
molecular weight humic substances were most variable across soils. Out of the three
humic components, the HS1 component was the most dominant (42-60%), accounting
for the majority of humic substances present.
91
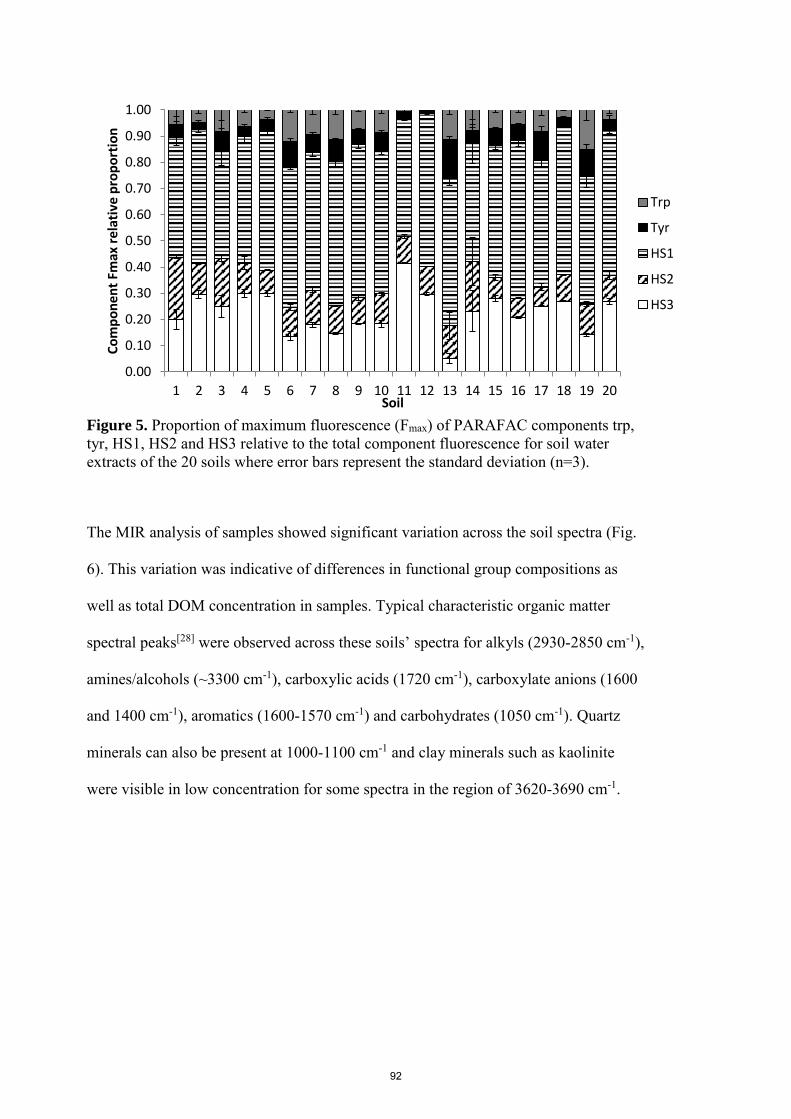
Figure 5. Proportion of maximum fluorescence (Fmax) of PARAFAC components trp, tyr, HS1, HS2 and HS3 relative to the total component fluorescence for soil water extracts of the 20 soils where error bars represent the standard deviation (n=3). The MIR analysis of samples showed significant variation across the soil spectra (Fig.
6). This variation was indicative of differences in functional group compositions as
well as total DOM concentration in samples. Typical characteristic organic matter
spectral peaks[28] were observed across these soils’ spectra for alkyls (2930-2850 cm-1),
amines/alcohols (~3300 cm-1), carboxylic acids (1720 cm-1), carboxylate anions (1600
and 1400 cm-1), aromatics (1600-1570 cm-1) and carbohydrates (1050 cm-1). Quartz
minerals can also be present at 1000-1100 cm-1 and clay minerals such as kaolinite
were visible in low concentration for some spectra in the region of 3620-3690 cm-1.
0.00
0.10
0.20
0.30
0.40
0.50
0.60
0.70
0.80
0.90
1.00
1 2 3 4 5 6 7 8 9 10 11 12 13 14 15 16 17 18 19 20
Co
mp
on
ent
Fmax
rel
ativ
e p
rop
ort
ion
Soil
Trp
Tyr
HS1
HS2
HS3
92

Figure 6. Mid infrared spectra collected with the ATR accessory for the 20 soil water extracts, showing one replicate per soil.
Relationship between complexed Ag and DOM properties
The amount of complexed Ag (%), was significantly positively (p<0.001) correlated
with both colloidal total S and “reduced S” and DOC concentrations in soil water
extracts (total S results are shown in Table 2 and reduced S in Table S2 of
Supplementary Information). Reduced S concentrations were calculated for most soils
except in the case of some colloidal concentrations when the there was no S remaining
after subtraction of the 3 kDa fraction from the 0.2 µm. In all cases the reduced S
concentrations were less than the total S concentrations across the soil water extracts.
These findings are in agreement with the strong affinity Ag+ has for ligands with S(II-)
groups reported by Bell et al.[12] While these relationships highlight the importance of
DOC and S in complexation of Ag in soil water extracts, they do not provide an overall
explanation of the variation observed in the data across all soil extracts.
Partial least-squares regression (PLSR) analysis is a multivariate method commonly
used to predict sample properties from multivariate data, including infrared spectra.
0.0
0.1
0.2
0.3
0.4
0.5
0.6
0.7
0.8
650 900 1150 1400 1650 1900 2150 2400 2650 2900 3150 3400 3650 3900
Inte
nsi
ty
Wavenumber (cm-1)
1 2 3 4 5 6 7
8 9 10 11 12 13 14
15 16 17 18 19 20
93

The resulting PLSR models of regression coefficients and PLS loadings (weighted with
respect to the analyte concentrations) for each of the analytes can, in principle, be used
for the subsequent prediction of complexed Ag (%) in the soil water extracts.[21] The
reference analytical data used for the first PLSR model included colloidal DOC
concentrations, colloidal elemental concentrations, colloidal C:S ratios, fluorescence
data and SUVA254 values in order to assess their relative significance toward
understanding complexed Ag (%) in these soil water extracts. It is important to note
that, initially, a range of soil physicochemical properties were analysed, including pH.
They were not found to be of significant weighting in the prediction of complexed Ag
in soil solution. The main focus of this paper was to investigate the properties of DOM
that may control the complexation of Ag. We acknowledge that while pH is not
discussed further, it is still an important property in controlling the amount of DOM in
solution and the presence of complexation sites within DOM. The second PLSR model
included only the MIR spectra since it was found that combining them with the
previous model did not improve the result of the analysis, and overall, MIR spectra
alone are very suitable as analytical data for a PLSR model.
The PLS score plot (PC1 versus PC2) and the corresponding loading weights of the
first and second PCs are shown in Figs. 7a and 7b, respectively. In Fig 7a, the relative
distance between the symbols is indicative of how similar the samples were. For
example, the relative distance of the symbols for soils 12 and 17, suggest that these two
samples were similar to each other. In contrast, the symbols for soils 7 and 13 were
further apart indicating they were positively and negatively correlated with complexed
Ag (%) i.e. soil 7 has a high amount of complexed Ag (%) and soil 13 low complexed
Ag (%) measured in solution. The different symbols in Fig. 7a represent the three
94

replicates of each of the 20 soil water extracts analysed. Fig. 7b shows that DOC
concentration, total fluorescence, HS1, HS3 and C:S ratio had the most significant
contribution to complexed Ag (%) according to the first component explaining 44% of
the variation. Thus, soil extracts with higher DOM, fluorescence, HS1, HS3 and C:S
ratio will have a greater percentage of complexed Ag.
Figure 7. Partial least squares regression analysis results (a) PCA score-2 versus score-1 plot for complexed Ag modelled with test variables: DOC, SUVA, fluorescence, elemental concentrations and C:S ratio where each soil extract in triplicate is represented by a different symbol and (b) the loadings of the first and second principal component scores which explain 44% and 12% of the variation respectively.
-150
-100
-50
0
50
100
-80 -60 -40 -20 0 20 40 60 80 100
PC-01
PC-02
1 2 3 4 5 6 7 8 9 10
11 12 13 14 15 16 17 18 19 20
(a)
-1.0
-0.8
-0.6
-0.4
-0.2
0.0
0.2
0.4
0.6
0.8
Load
ing
wei
ghts
of
vari
able
s
PC1 (44%)
PC2 (12%)
(b)
95

Considering the PC-1 axis in Fig. 7a, which separates soils based on the correlation
between analyte concentrations and complexed Ag (i.e. mainly fluorescence, DOM,
HS1 and HS3 in decreasing importance), soil extracts in the positive region of this axis
had high positive contribution to loading weight 1, while those in the negative region of
the axis were negatively correlated with loading weight 1. Principal component 2 which
explained 12% of the variation, weights C:S ratio and SUVA as the most significant.
While SUVA had a positive contribution to PC-2, C:S was strongly negative and thus
negatively correlated with complexed Ag and this strong negative contribution in effect
cancels out what was observed in PC-1. The concentrations of Al, Fe, P, S and reduced
colloidal S did not contribute significantly to the variation in complexed Ag.
Each replicate was analysed by PLSR separately and then an average (N=3) was taken.
The final regression plot (Fig. 8) shows measured complexed Ag (%) versus predicted
complexed Ag (%) with an R2 value equal to 0.71 as determined by PLSR cross-
validation. The significance of fluorescence, aromaticity and humic components in the
regression has shown that humic acids can complex Ag+ in soil solution through N and
S groups.[46, 47] Despite no significant weighting of S or reduced S in the regression, it
does not imply that Ag+ complexation will not proceed via other S-containing
functional groups. Sulfur speciation by sulfur K-edge XANES has found that the
fraction of reduced S in humic substances (oxidation state <1) can range from 20 - 60%
and comprises thiol groups, thioethers and organic disulfides.[48] In addition, the strong
negative correlation with C:S ratio indicated that as the ratio increases (i.e. less S per
mole of DOC) there is less Ag complexation. The “reduced S” measurements in this
study may also contain a significant amount of disulfides (which cannot bind Ag+)
96

which may explain why this property did not have a significant weighting in the
regression.
Figure 8. Partial least squares regression plot for the prediction of complexed Ag (%) in soil water extracts. The predictor variables are DOC concentration, fluorescence data, C:S ratio and SUVA254. For the fitted line R2 is 0.71, with the dashed 1:1 line also shown. Error bars represent the standard deviation (n=3) of the measured (horizontal) and predicted (vertical) percentages of complexed Ag in soil water extracts which was modelled separately for each replicate then averaged. The results of PLSR cross-validation of Ag complexation in soil water extracts, using
only the MIR spectra as predictor variables, are illustrated in Figs. 9a and 9b. The PCA
plot (Fig. 9a) showed more clustering of soils than was observed in Fig 7a. In particular
soils 3 and 7 were close together along PC-1 and far from the rest of the soils. There
was also a cluster near the origin (0,0) for soils 1, 5, 6, 8 and 20, and then in the
negative region of PC-1 for soils 10,11,12,13 and 15. The remainder fell close to these
clusters, except for soils 2 and 4 which were far from each other and separated from the
rest of the soils. Samples 2 and 4, and samples 3 and 7, may have a strong influence on
the PLSR loading weight 1 calculation. In such cases, the PLSR calibration may
actually derive a PC based on just these samples, rather than the rest of the population.
0
10
20
30
40
50
60
70
80
0 20 40 60 80
Pre
dic
ted
Co
mp
lexe
d A
g (%
)
Measured Complexed Ag (%)
97

The analysis was performed again in the absence of these soil samples and found to
have no significant effect on the PLSR calibration. Hence the soils were not excluded
from the data set.
Figure 9. Partial least squares regression analysis results (a) PCA score-2 versus score-1 plot for complexed Ag modelled using the MIR spectra of the 20 soil water extracts in triplicate as the test variables and (b) the spectral loading of the first principal component scores explaining 74% of the variation.
-1.2
-1
-0.8
-0.6
-0.4
-0.2
0
0.2
0.4
0.6
0.8
1
-3 -2 -1 0 1 2 3 4 5
PC-02
PC-1
1 2 3 4 5 6 7 8 9 10
11 12 13 14 15 16 17 18 19 20
(a)
0.0
0.1
0.2
0.3
0.4
0.5
0.6
0.7
0.8
0.9
650 1150 1650 2150 2650 3150 3650
Inte
nsi
ty
Wavenumber (cm-1)
(b)
98

The most significant spectral loading, PC-1, explained 74% of the variation in Ag
complexation followed by PC-2 which only explained 4%. Soils 2 and 4 were distanced
from the other soils as a result of PC-2 which only accounted for 4% of the variation in
Ag complexation. For this set of spectral data, the most important features in the
spectra resulted from PC-1 (Fig 9b) and were primarily due to absorption peaks at 1050
and 1080 cm-1 (carbohydrates), 1400 and 1600 cm-1 (together account for the
carboxylate anion as well as aromatic groups), 2900 cm-1 (alkyl groups) and 3325 cm-1
(amine or alcohol groups).[21, 28] These peak assignments highlight the important
spectral features that relate to Ag complexation in the soil water extracts. However,
overall the MIR spectra are DOM concentration dependent. The final regression plot
showing measured complexed Ag (%) versus predicted complexed Ag (%) has an R2
value of 0.80 (Fig.10) which was modelled separately for each replicate and then
averaged.
Figure 10. Partial least squares regression plot for the prediction of complexed Ag (%) in soil water extracts. The predictor variables are the MIR spectra. For the fitted line R2 is 0.80, with the dashed 1:1 line also shown. Error bars represent the standard deviation (n=3) of the measured (horizontal) and predicted (vertical) percentages of complexed Ag in soil water extracts which was modelled separately for each replicate then averaged.
0
10
20
30
40
50
60
70
80
90
0 20 40 60 80
Pre
dic
ted
Co
mp
lexe
d A
g (%
)
Measured Complexed Ag (%)
99

Finally, considering the potential for describing a relationship between the normalised
complexed Ag values (complexaed Ag % per mg C L-1), with the quality of DOM
measured, no highly significant model could be generated using the PLSR method.
Instead a principal components biplot analysis (see supporting information) which
accounted for 60% of the variation (from the first and second principle components) in
the data set showed that the normalised complexed Ag is strongly correlated with the
HS3 component, total fluorescence, and SUVA254 values. This finding suggests that the
strength of Ag complexation is influenced by the aromatic properties of the DOM
which could directly result from humic substances. Silver complexation was also found
to be negatively correlated to C:S ratio, an indication that, as the ratio increases (i.e.
less S per mole of DOC) the strength of Ag complexation is weaker. This suggests that
complexation of Ag could still occur through the S- groups that are present within
aromatic and humic substances.
Conclusions
This study highlighted the significance of quantity and quality of soil DOM to Ag
complexation in soil water extracts. While DOC concentration alone gave an indication
of Ag complexation (R2=0.5), the model was strengthened by adding quality
information through fluorescence, UV-Visible, and C:S ratio data to explain 71% of the
variability in the data. The PLSR model using MIR data alone highlighted that
carbohydrate, carboxylate, aromatic, amine and alcohol functional groups were
important for Ag complexation to DOM in soil water extracts with an overall improved
model explaining 80% of the data variability.
100

In conclusion, DOM is important for the strong/irreversible complexation of Ag in soil
water extracts. The normalised Ag complexation values point towards larger molecular
weight humic substances and overall aromaticity increasing the affinity of Ag to DOM
with the underlying mechanism being that this could still occur via S-groups present on
the aromatic and humic substances. Spectroscopic information from UV-Visible, MIR
and fluorescence spectroscopy may be more useful in measuring and characterising
DOM than only chemical measurements. Knowledge of the affinity of Ag to complex
with DOM could have implications for the mobility and bioavailability of this metal in
the soil environment where up to 70% of Ag was found to be strongly complexed.
While this complexed Ag is not considered to be bioavailable, there is potential through
mobilisation in the terrestrial environment for dissociation to occur upon changing
conditions of the surrounding environmental matrix and this should be considered in
future studies.
ACKNOWLEDGMENT
The authors thank the Precious Metals and Rhenium Consortium and Minerals Down
Under Flagship (CSIRO) for financial support. We would like to acknowledge and
thank Professor Peter Campbell for insightful and useful advice on the complexation of
Ag with DOC. We also thank Bogumila Tomczak (University of Adelaide) and the
research group under Associate Professor Scott Smith at WLU for expert technical
assistance.
101

References [1] Elvers, B., Hawkins, S., Russey, W., Schulz, G., in Ullmann's Encyclopedia of
Industrial Chemistry (Ed. H Renner) 1993, (VCH: Weinham, Germany).
[2] Morones, J.R., Elechiguerra, J.L., Camacho, A., Holt, K., Kouri, J.B., Ramirez, J.T., et
al., The bactericidal effect of silver nanoparticles. Nanotech. 2005, 16(10), 2346-53. doi:
10.1088/0957-4484/16/10/059
[3] Benn, T., Cavanagh, B., Hristovski, K., Posner, J.D., Westerhoff, P., The release of
nanosilver from consumer products used in the home. J. Environ. Qual. 2010, 39(6), 1875-82.
doi: 10.2134/jeq2009.0363
[4] Erickson, R.J., Brooke, L.T., Kahl, M.D., Venter, F.V., Harting, S.L., Markee, T.P., et
al., Effects of laboratory test conditions on the toxicity of silver to aquatic organisms. Environ.
Toxicol. Chem. 1998, 17(4), 572-8. doi:
[5] Allen, H.E., Hall, R.H., Brisbin, T.D., Metal speciation - Effects on aquatic toxicity.
Environ. Sci. Tech. 1980, 14(4), 441-3. doi:
[6] Herrin, R.T., Andren, A.W., Armstrong, D.E., Determination of silver speciation in
natural waters. 1. Laboratory tests of Chelex-100 chelating resin as a competing ligand.
Environ. Sci. Tech. 2001, 35(10), 1953-8. doi:
[7] Herrin, R.T., Andren, A.W., Shafer, M.M., Armstrong, D.E., Determination of silver
speciation in natural waters. 2. Binding strength of silver ligands in surface freshwaters.
Environ. Sci. Tech. 2001, 35(10), 1959-66. doi:
[8] Coutris, C., Joner, E.J., Oughton, D.H., Aging and soil organic matter content affect the
fate of silver nanoparticles in soil. Sci. Total Environ. 2012, 420, 327-33. doi:
10.1016/j.scitotenv.2012.01.027
[9] Coutris, C., Hertel-Aas, T., Lapied, E., Joner, E.J., Oughton, D.H., Bioavailability of
cobalt and silver nanoparticles to the earthworm Eisenia fetida. Nanotoxicology. 2012, 6(2),
186-95. doi: 10.3109/17435390.2011.569094
[10] Settimio, L., McLaughlin, M.J., Kirby, J.K., Langdon, K., A method to determine
silver partitioning and lability in soils. Environ. Chem. 2014, 11(1), 63-71. doi:
10.1071/EN13163
[11] Settimio, L., McLaughlin, M.J., Kirby, J.K., Langdon, K.A., Lombi, E., Donner, E., et
al., Fate and lability of silver in soils: Effect of ageing. Environ. Pollut. 2014, 191, 151-7. doi:
10.1016/j.envpol.2014.04.030
[12] Bell, R.A., Kramer, J.R., Structural chemistry and geochemistry of silver-sulfur
compounds: Critical review. Environ. Toxicol. Chem. 1999, 18(1), 9-22. doi:
10.1002/etc.5620181203
[13] Adams, N.W.H., Kramer, J.R., Reactivity of Ag+ ion with thiol ligands in the presence
of iron sulfide. Environ. Toxicol. Chem. 1998, 17(4), 625-9. doi:
102

[14] Chen, Z., Campbell, P.G.C., Fortin, C., Silver binding by humic acid as determined by
equilibrium ion-exchange and dialysis. J. Phys. Chem. A. 2012, 116(25), 6532-9. doi:
10.1021/jp212403r
[15] Chen, Z., Porcher, C., Campbell, P.G.C., Fortin, C., Influence of humic acid on algal
uptake and toxicity of ionic silver. Environ. Sci. Tech. 2013, 47(15). doi: 10.1021/es401085n
[16] Bolan, N.S., Adriano, D.C., Kunhikrishnan, A., James, T., McDowell, R., Senesi, N., in
Adv. Agron. Vol 110 (Ed. DL Sparks) 2011, pp. 1-75.
[17] Ravichandran, M., Interactions between mercury and dissolved organic matter - a
review. Chemosphere. 2004, 55(3), 319-31. doi: 10.1016/j.chemosphere.2003.11.011
[18] Preston, C.M., Applications of NMR to soil organic matter analysis: History and
prospects. Soil Sci. 1996, 161(3), 144-66. doi: 10.1097/00010694-199603000-00002
[19] Nebbioso, A., Piccolo, A., Molecular characterization of dissolved organic matter
(DOM): a critical review. Anal. Bioanal. Chem. 2013, 405(1), 109-24. doi: 10.1007/s00216-
012-6363-2
[20] Ellerbrock, R.H., Gerke, H.H., in Adv. Agron. Vol 121 (Ed. DL Sparks) 2013, pp. 117-
77.
[21] Janik, L.J., Skjemstad, J.O., Shepherd, K.D., Spouncer, L.R., The prediction of soil
carbon fractions using mid-infrared-partial least square analysis. Aust. J. Soil Res. 2007, 45(2),
73-81. doi: 10.1071/sr06083
[22] Andrade-Eiroa, A., Canle, M., Cerda, V., Environmental applications of excitation-
emission spectrofluorimetry: An in depth review I. Appl. Spectrosc. Rev. 2013, 48(1), 1-49. doi:
10.1080/05704928.2012.692104
[23] Al-Reasi, H.A., Wood, C.M., Smith, D.S., Physicochemical and spectroscopic
properties of natural organic matter (NOM) from various sources and implications for
ameliorative effects on metal toxicity to aquatic biota. Aquat. Toxicol. 2011, 103(3-4), 179-90.
doi: 10.1016/j.aquatox.2011.02.015
[24] Ohno, T., Amirbahman, A., Bro, R., Parallel factor analysis of excitation-emission
matrix fluorescence spectra of water soluble soil organic matter as basis for the determination
of conditional metal binding parameters. Environ. Sci. Tech. 2008, 42(1), 186-92. doi:
10.1021/es071855f
[25] Fellman, J.B., D'Amore, D.V., Hood, E., Boone, R.D., Fluorescence characteristics and
biodegradability of dissolved organic matter in forest and wetland soils from coastal temperate
watersheds in southeast Alaska. Biogeochem. 2008, 88(2), 169-84. doi: 10.1007/s10533-008-
9203-x
[26] Cohen, E., Levy, G.J., Borisover, M., Fluorescent components of organic matter in
wastewater: Efficacy and selectivity of the water treatment. Water Res. 2014, 55. doi:
10.1016/j.watres.2014.02.040
103

[27] Gholizadeh, A., Boruvka, L., Saberioon, M., Vasat, R., Visible, near-infrared, and mid-
infrared spectroscopy applications for soil assessment with emphasis on soil organic matter
content and quality: state-of-the-art and key issues. Appl. Spectrosc. 2013, 67(12), 1349-62.
doi: 10.1366/13-07288
[28] Soriano-Disla, J.M., Janik, L.J., Rossel, R.A.V., Macdonald, L.M., McLaughlin, M.J.,
The performance of visible, near-, and mid-infrared reflectance spectroscopy for prediction of
soil physical, chemical, and biological properties. Appl. Spectrosc. Rev. 2014, 49(2), 139-86.
doi: 10.1080/05704928.2013.811081
[29] Santos, P.S.M., Otero, M., Duarte, R., Duarte, A.C., Spectroscopic characterization of
dissolved organic matter isolated from rainwater. Chemosphere. 2009, 74(8), 1053-61. doi:
10.1016/j.chemosphere.2008.10.061
[30] Artz, R.R.E., Chapman, S.J., Robertson, A.H.J., Potts, J.M., Laggoun-Defarge, F.,
Gogo, S., et al., FTIR spectroscopy can be used as a screening tool for organic matter quality in
regenerating cutover peatlands. Soil Biol. Biochem. 2008, 40(2), 515-27. doi:
10.1016/j.soilbio.2007.09.019
[31] Sharma, P., Ofner, J., Kappler, A., Formation of binary and ternary colloids and
dissolved complexes of organic matter, Fe and As. Environ. Sci. Tech. 2010, 44(12), 4479-85.
doi: 10.1021/es100066s
[32] Jarusutthirak, C., Amy, G., Role of soluble microbial products (SMP) in membrane
fouling and flux decline. Environ. Sci. Tech. 2006, 40(3), 969-74. doi: 10.1021/es050987a
[33] Janik, L., Forrester, S., Kirby, J.K., McLaughlin, M.J. 2010, (CSIRO Land and Water:
Adelaide).
[34] Weng, L.P., Temminghoff, E.J.M., Lofts, S., Tipping, E., Van Riemsdijk, W.H.,
Complexation with dissolved organic matter and solubility control of heavy metals in a sandy
soil. Environ. Sci. Tech. 2002, 36(22), 4804-10. doi: 10.1021/es0200084
[35] McBride, M., Sauvé, S., Hendershot, W., Solubility control of Cu, Zn, Cd and Pb in
contaminated soils. Eur. J. Soil Sci. 1997, 48(2), 337-46. doi: 10.1111/j.1365-
2389.1997.tb00554.x
[36] Amery, F., Degryse, F., Cheyns, K., De Troyer, I., Mertens, J., Merckx, R., et al., The
UV-absorbance of dissolved organic matter predicts the fivefold variation in its affinity for
mobilizing Cu in an agricultural soil horizon. Eur. J. Soil Sci. 2008, 59(6), 1087-95. doi:
10.1111/j.1365-2389.2008.01078.x
[37] Chen, Y., Senesi, N., Schnitzer, M., Chemical and physical characteristics of humic
and fulvic acids extracted from soils of mediterranean region. Geoderma. 1978, 20(2), 87-104.
doi: 10.1016/0016-7061(78)90037-x
[38] Gee, G.W., Bauder, J.W., Particle-size analysis 1986.
104

[39] Rayment, G.E., Higginson, F.R., Australian laboratory handbook of soil and water
chemical methods 1992 (Inkata Press: Melbourne).
[40] Adams, N.W.H., Kramer, J.R., Determination of silver speciation in wastewater and
receiving waters by competitive ligand equilibration/solvent extraction. Env. Toxicol. Chem.
1999, 18(12), 2674-80. doi:
[41] Senesi, N., Miano, T.M., Provenzano, M.R., Brunetti, G., Characterization,
differentiation, and classification of humic substances by fluorescence spectroscopy. Soil Sci.
1991, 152(4), 259-71. doi: 10.1097/00010694-199110000-00004
[42] DePalma, S.G.S., Arnold, W.R., McGeer, J.C., Dixon, D.G., Smith, D.S., Variability in
dissolved organic matter fluorescence and reduced sulfur concentration in coastal marine and
estuarine environments. Appl. Geochem. 2011, 26(3), 394-404. doi:
10.1016/j.apgeochem.2011.01.022
[43] Mueller, K.K., Fortin, C., Campbell, P.G.C., Spatial variation in the optical properties
of dissolved organic matter (DOM) in lakes on the canadian precambrian shield and links to
watershed characteristics. Aquat. Geochem. 2012, 18(1), 21-44. doi: 10.1007/s10498-011-
9147-y
[44] Ishii, S.K.L., Boyer, T.H., Behavior of reoccurring PARAFAC components in
fluorescent dissolved organic matter in natural and engineered systems: A critical review.
Environ. Sci. Tech. 2012, 46(4), 2006-17. doi: 10.1021/es2043504
[45] Tedetti, M., Longhitano, R., Garcia, N., Guigue, C., Ferretto, N., Goutx, M.,
Fluorescence properties of dissolved organic matter in coastal Mediterranean waters influenced
by a municipal sewage effluent (Bay of Marseilles, France). Environ. Chem. 2012, 9(5), 438-
49. doi: 10.1071/en12081
[46] Sikora, F.J., Stevenson, F.J., Silver complexation by humic substances - Conditional
stability constants and nature of reactive sites. Geoderma. 1988, 42(3-4), 353-63. doi:
[47] Jacobson, A.R., Martinez, C.E., Spagnuolo, M., McBride, M.B., Baveye, P., Reduction
of silver solubility by hurnic acid and thiol ligands during acanthite (beta-Ag2S) dissolution.
Environ. Poll. 2005, 135(1), 1-9. doi: 10.1016/j.envpol.2004.10.017
[48] Maurer, F., Christl, I., Hoffmann, M., Kretzschmar, R., Reduction and reoxidation of
humic acid: Influence on speciation of cadmium and silver. Environ. Sci. Tech. 2012, 46(16),
8808-16. doi: 10.1021/es301520s
105

Table S1. Analysis of 0.2 µm and 3 kDa filtered soil water extracts and the calculated colloidal fraction. All concentrations are reported in mg L-1.
Soil Al Fe P
0.2 µm
3 kDa Colloidal 0.2
µm 3
kDa Colloidal 0.2 µm
3 kDa Colloidal
1 0.40 0.23 0.17 0.68 0.10 0.58 1.85 1.50 0.35 2 0.21 0.20 0.01 0.14 0.01 0.13 0.39 0.21 0.18 3 2.48 0.36 2.12 1.34 0.09 1.25 1.31 0.82 0.48 4 0.77 0.19 0.58 0.43 0.01 0.42 0.49 0.26 0.23 5 2.49 0.24 2.24 1.90 0.05 1.85 1.29 0.97 0.32 6 0.56 0.39 0.17 0.33 0.06 0.27 0.26 0.22 0.03 7 3.68 3.03 0.65 1.21 0.36 0.85 0.23 0.15 0.08 8 0.52 0.25 0.27 0.24 0.03 0.21 0.38 0.30 0.08 9 2.94 0.21 2.73 1.67 0.03 1.64 0.65 0.42 0.23
10 1.96 0.44 1.52 0.53 0.13 0.41 0.31 0.25 0.06 11 0.32 0.22 0.10 0.08 0.05 0.03 0.98 0.99 0.04 12 0.20 0.12 0.09 0.16 0.03 0.13 0.07 0.07 0.07 13 0.15 0.13 0.02 0.01 0.01 - 0.01 0.04 - 14 2.61 0.15 2.47 1.61 0.01 1.59 0.95 0.80 0.16 15 2.88 0.29 2.60 1.45 0.08 1.37 1.24 1.23 0.01 16 1.15 0.13 1.02 0.49 0.01 0.48 0.14 0.13 0.01 17 1.89 0.18 1.71 1.41 0.02 1.39 0.25 0.28 - 18 0.67 0.16 0.51 0.48 0.01 0.47 0.78 0.68 0.10 19 0.44 0.29 0.16 0.03 0.02 0.01 0.05 0.09 - 20 3.71 0.18 3.52 2.25 0.01 2.24 1.20 1.00 0.20
- no colloidal concentration could be calculated when 3 kDa concentrations were equal to 0.2 µm concentrations
106

Table S2. Analysis of 0.2 µm
and 3 kDa filtered soil w
ater extracts and the calculated colloidal fraction for total S, sulfate, S in sulfate and reduced for S. A
ll concentrations are reported in mg L
-1.
0.2 µm
3 kD
a C
olloidal
Soil Total S
Sulfate (SO
4 2-) S in
(SO4 2-)
Reduced S
† Total S
Sulfate (SO
4 2-) S in
(SO4 2-)
Reduced S
† Total S
Sulfate (SO
4 2-) S in
(SO4 2-)
Reduced S
†
1 1.54
2.13 0.71
0.83 0.69
1.19 0.40
0.30 0.85
0.94 0.31
0.54 2
1.93 4.40
1.47 0.47
1.61 4.00
1.34 0.27
0.33 0.40
0.13 0.19
3 3.10
4.47 1.49
1.61 1.84
3.47 1.16
0.69 1.26
1.00 0.33
0.92 4
4.78 11.33
3.78 0.99
3.57 9.20
3.07 0.50
1.21 2.13
0.71 0.50
5 1.47
2.63 0.88
0.59 0.87
1.85 0.62
0.25 0.60
0.78 0.26
0.34 6
6.45 20.00
6.45 0.00
5.70 17.07
5.70 0.01
0.75 2.93
0.76 -
7 2.26
3.50 1.17
1.09 1.36
2.60 0.87
0.49 0.90
0.90 0.30
0.60 8
2.39 5.37
1.79 0.60
1.90 4.87
1.62 0.28
0.49 0.50
0.17 0.32
9 4.04
8.37 2.79
1.25 3.07
7.60 2.54
0.54 0.97
0.77 0.26
0.71 10
1.43 2.33
0.78 0.65
0.87 1.87
0.63 0.24
0.56 0.46
0.15 0.41
11 0.36
0.89 0.30
0.06 0.32
0.85 0.28
0.04 0.03
0.04 0.01
0.02 12
0.18 0.48
0.16 0.02
0.11 0.18
0.06 0.05
0.07 0.29
0.10 -
13 1.54
4.60 1.54
0.01 1.64
4.83 1.61
0.02 -
- -
- 14
1.59 4.77
1.59 0.00
1.30 3.80
1.27 0.03
0.29 0.97
0.32 -
15 0.65
1.93 0.65
0.01 0.63
1.78 0.59
0.03 0.03
0.15 0.05
- 16
1.40 4.20
1.40 0.00
1.30 3.87
1.29 0.01
0.10 0.33
0.11 -
17 0.23
0.62 0.21
0.02 0.30
0.70 0.23
0.07 -
- -
- 18
0.82 0.95
0.32 0.50
0.65 0.97
0.32 0.33
0.17 -
- 0.17
19 1.35
4.00 1.34
0.02 1.20
3.53 1.18
0.02 0.15
0.47 0.16
- 20
0.83 1.20
0.40 0.43
0.70 1.11
0.37 0.32
0.14 0.09
0.03 0.11
†Concentration of S rem
aining after subtraction of S in sulfate from total S.
- no colloidal concentration could be calculated when 3 kD
a concentrations were equal to 0.2 µm
concentrations
107

Table S3 pH values of soil water extracts
Soil pH of soil
water extracts
1 5.4
2 7.8 3 6.1 4 7.3 5 6.0
6 5.1 7 4.6 8 5.4
9 5.7 10 4.7 11 5.2 12 4.8
13 7.3 14 7.1 15 6.2
16 5.4 17 6.0 18 7.1 19 5.1
20 6.9
108

Figure S1. Principle components biplot showing the correlations between normalised complexed Ag Values and the various parameters measured in the study. Normalised Ag is most significantly and positively correlated with HS3, SUVA254 and normalised fluorescence.
109

110

CHAPTER 5
SUMMARY, CONCLUSIONS AND FUTURE RESEARCH DIRECTIONS
111

112

Metal contaminants, including silver (Ag), that are released to the environment may
pose a threat to soil dwelling organisms including microorganisms, plants and soil
invertebrates. Silver may enter the environment as the soluble ionic Ag+ species or as
nanoparticles that can release soluble Ag+. The transformations that Ag+ may undergo
once in the soil can alter its chemical form and therefore potential uptake and toxicity.
Measuring the partitioning, lability and speciation of Ag in soils, provides a better
understanding of its potential bioavailability, compared to measuring total Ag
concentrations in soil alone. To fully understand the availability of Ag in soils, there
are various factors to be taken into consideration such as an understanding of the
chemical nature and behaviour of Ag in soil and the influence of varying soil properties
on the transformations and reactions of Ag+.
The work presented in this thesis was conducted to gain a greater understanding of the
transformations and reactions of Ag in soil. This research provides further information
in understanding the risks of Ag in soil environments through an understanding of its
fate and potential availability. This includes an initial study to develop a sensitive
method to measure the partitioning and exchangeability of Ag in soils using isotope
dilution and the 110mAg radioisotope. The subsequent study utilised this isotope dilution
method in combination with solid phase speciation using X-ray absorption near edge
structure (XANES) spectroscopy to investigate the effect of ageing reactions and
transformations on Ag exchangeability in soils. The final study used a range of rapid,
accessible and sensitive laboratory methods (e.g. UV, fluorescence and IR spectroscopy
and elemental analysis) with partial least-squares regression to examine the
complexation of Ag+ by DOM in soil solutions. These findings will enable a better
understanding of the mobility and bioavailability of Ag in soil environments.
113

Development of a method to determine partitioning and lability of silver in soils
This chapter developed a sensitive method to measure the partitioning and
exchangeability of Ag in soils using an isotope dilution technique. To develop this
method, initially a suitable equilibration solution was identified by comparing water,
CaCl2 and Ca(NO3)2. Through this process, Ca(NO3)2 was highlighted as the most
suitable equilibration solution. The exclusion of CaCl2 as an equilibration solution was
due to variable results caused by precipitation of AgCl which is not desirable as it
compromises the assumptions of the isotope dilution principle by disrupting the
equilibrium of the system (Hamon et al. 2008). Calcium nitrate was chosen over water
because it provides an ionic strength similar to that of a soil solution and should
minimise the influence of colloids. Following this, the influence of Ca2+ concentration
in the equilibration solution on the partitioning and exchangeability of Ag was
investigated. The outcomes from this research indicated that 10 mM Ca(NO3)2
provided the most consistent results and should therefore be used in future work.
The final component of this research involved examining the effect of non-
exchangeable Ag colloids in soil suspensions on accurate measurements of Ag
exchangeability (E-value). This was investigated through use of a cation exchange resin
to correct for these potential colloidal interferences. While the use of Ca(NO3)2 as the
equilibration solution minimises the presence of colloids in solution, it was still found
that a resin clean up step was required to correct E-values for non-labile forms of Ag in
soil solutions. The need to correct for isotopically non-exchangeable Ag in soils
solutions during E-value determinations was found to differ between soil types and for
the Ag spiking concentration applied. The presence of non-isotopically exchangeable
colloids observed for Ag is similar to that for Cu. The isotopically non-exchangeable
114

Cu in the soil extracts led to an overestimation of the E-value, a result of the colloidal
Cu complexes (Ma et al. 2006). This also compromises another assumption of the
isotope dilution principle where the metal species measured in solution should all be
isotopically exchangeable. The finalised method provides a powerful tool to examine
the exchangeability and hence the potential availability of Ag in a range of soils with
varying physical and chemical properties.
The research in this chapter using the optimised isotope dilution method highlighted
some important findings related to the fate and behaviour of Ag in soils. The presence
of Ca2+ in the equilibration solution revealed the significant impact on Kd and E-values
for Ag in soils with low and high DOC concentrations. This difference was attributed to
the ability of Ca2+ to suppress the mobilisation of dissolved organic carbon (and Ag).
The flocculation of DOC in soil solution occurs through divalent Ca2+ forming bridges
between the negative sites of DOC structures, resulting in Ag (in a similar way to Cu)
getting trapped in these structures thus decreasing its soil solution concentration
(Romkens et al. 1996). The solid-solution partitioning of TOC was found to be
positively correlated to the Ag-Kd values in soils. Therefore, when the TOC-Kd was low
(higher solubility of TOC, more DOC in solution), Ag-Kd values were also low (more
Ag in soil solution). Hence, the TOC-Kd was always higher when Ca2+ ions were
present, compared to no Ca2+ ions present (i.e. water) and therefore, the Ag-Kd was also
high. This finding highlights the importance of DOC in the mobility and availability of
Ag in soils.
In addition to Ag partitioning being positively correlated with TOC, it is likely there
will be complexation of Ag with DOC, resulting in increased Ag being found in the
115

solution phase of the soil suspensions with higher DOC. It was found that as the
concentration of DOC in solution increased, the concentration of free Ag+ in solution
decreased. This result suggested that there was complexation of Ag with DOC, which
was the subject of further research in Chapter 4.
Soil properties such as CEC or TOC concentrations with pH were found to be the best
predictors of Ag partitioning in soils, supported by another study that found TOC
concentrations and pH to be important to the partitioning of Ag in soils (Cornelis et al.
2010). The Kd values for Ag in soils from the method development study (median Kd
value of 1400 L kg-1) are comparable to that observed for As (1800 L kg-1) and Zn
(1700 L kg-1) in soils (Sauvé et al. 2000). The mean E-value as a percent of the total Ag
added to soils (E%), was 51±19%, indicating that Ag can be rapidly immobilised in the
soil after two weeks. This is difficult to compare to other metals as the range in the
literature is from 0 – 100 % across various metals, incubation times and soils. A
comparison can be made with added soluble Cu to soils that were also incubated for
two weeks, where an average E% was 76±19% (Ma et al. 2006). This comparison
suggests rapid reactions in soils decrease the exchangeability of Ag in soils to a similar
extent as soluble Cu. The concentrations of geogenic exchangeable Ag in soils were
below detection limits, indicating occlusion of the Ag within poorly soluble solid
phases. These results indicate that measurement of exchangeable Ag is an important
consideration when estimating the potential risks associated with Ag in soil. The
conclusions drawn suggested that further work was necessary to assess the changes in
Ag lability over a longer term, which was the focus of Chapter 3.
116

Effect of ageing on the fate and lability of silver in soils
The findings in Chapter 3 showed that exchangeable concentrations of added soluble
Ag decreased over time for all of the soils investigated. After a six month ageing
period, the proportion of added soluble Ag that was exchangeable ranged from <10 to
50% (mean E% = 26±21%). The most rapid ageing was observed in soils that had high
pH (8.5-8.8). This study demonstrated that while there is an initial rapid ageing of Ag
in soil, this is followed by slower processes and reactions, further removing Ag from
exchangeable pools over a longer period. The removal of Ag into non-exchangeable
pools with age was found to be greater than other soluble metals such as Cd, Cu, Ni and
Zn) over longer aging time periods of 850 days (E% = 57-72%) (Buekers et al. 2007).
These authors also found ageing of metals was more prominent for soils with increased
alkalinity, which is consistent with the findings in this study.
Synchrotron based XANES analysis of Ag in soils indicated that for the majority of
soils, the added soluble Ag was reduced to metallic Ag over time, and associations with
Fe-oxohydroxides and reduced S groups in organic matter also decreased Ag lability.
Strong positive correlations were found between metallic Ag and non-labile Ag and
between organic carbon and Ag bonded with S species. The amount of metallic Ag
formed did not account for all non-labile Ag in the soils, indicating that other Ag
species can contribute to the non-labile pool. These other species may include Ag
irreversibly sorbed to Fe-oxohydroxide and Ag-S species (including Ag2S and Ag
strongly bound to cysteine and thiol groups). There was also a significant and strong
positive relationship between the percentages of Ag-S bonded species present in soils
to the organic carbon content. This demonstrates that the association of Ag with
organic matter is likely through the S groups of organic matter. Other studies have
117

demonstrated that conversion of Ag+ to Ag-S species is certain to occur through
wastewater treatment processes and through formation of biosolids (Kaegi et al. 2013).
These findings highlighted the importance of organic matter to the solid phase
speciation of Ag in soils. Overall, there was a significant decrease in exchangeable Ag
over time for all soils. Rapid ageing within the first two weeks of addition of soluble
Ag was found, suggesting that Ag ageing needs to be considered when evaluating the
potential risks associated with Ag in the terrestrial environment. Speciation data
showed that Ag+ is reduced to metallic Ag over time in soils and associations with S
and iron oxides in soil can also lead to reductions in Ag lability. The results in this
study suggest the risk of Ag in soil environments will be significantly reduced due to
aging reactions and changes in speciation that will move soluble Ag into non-
exchangeable pools in soils.
Complexation of silver and dissolved organic matter in soil water extracts
The research findings in Chapter 2 found that free Ag+ concentrations decreased as
DOC concentrations increased in soil solutions. This finding highlighted the
importance of DOC in soil solutions on the mobility and potential availability of Ag in
soils. A final study was performed to examine the effects of quantity and quality of
DOM on Ag complexation in soil solutions. The study involved measuring the amount
of complexed Ag in soil water extracts across a range of soils with natural varying
concentrations of DOM. The complexed Ag was then considered in relation to the
concentration of DOM to provide an understanding of variations in strength of binding
between soils. The soil water extracts were also characterised by size fractionation and
elemental analysis, and spectroscopic analysis using UV-Visible, fluorescence and mid
118

infra-red (MIR) spectroscopy. The chemical and spectroscopic measurements were
then used to model and predict complexed Ag in solution.
The proportion of complexed Ag using a resin technique in the soil water extracts was
found to vary considerably between the different soils tested. There was a positive
relationship found between Ag complexation and DOM concentrations, where soil
solutions with the highest DOM concentrations having the greatest proportion of
complexed Ag. Comparison of the complexed Ag results after normalisation to DOM
concentration (complexed Ag per mg C) showed differences in strength of binding or
affinity of the DOM to Ag. Indeed soils with similar DOM concentrations did not have
the same amount of complexed Ag in solution. This indicated that differences in DOM
composition or quality may be responsible for differences between complexation
capacities with Ag+.
A range of chemical and spectroscopic measurements were performed on soil water
extracts to better understand the complexation of Ag and develop partial least-squares
regression models to predict Ag complexation and DOM in soil water extracts. The
results from this study found that: (i) DOM concentration was significant in the
complexation of Ag in soil water extracts, and quality information through the addition
of fluorescence, SUVA254 and C:S ratio data strengthens the DOM complexation model
(accounting for 71% of the data variability) and (ii) complexed Ag in soil water
extracts could be well predicted by MIR analysis alone, accounting for 80% of the data
variability. The fluorescence and SUVA254 data are representative of the humic and
aromatic groups that represent a significant proportion of DOM composition and can
contain up to 60% S-groups. The MIR spectra suggested that carbohydrate,
119

carboxylate, aromatic and amine or alcohol functional groups in DOM were
responsible for the amount of complexed Ag in soil water extracts.
The findings examining complexed Ag % per mg C, found Ag complexation to be
strongly and positively correlated to the larger molecular weight humic substances and
aromatic groups, but also negatively correlated to the molar C:S ratio. The negative
correlation with C:S ratios, indicated that when there was less S per mole of C, the
strength of complexed Ag was weaker. This also supported the negative correlation
between C:S ratio and the amount of complexed Ag from the PLSR model. Overall,
these results are complimentary to those in the aquatic environment that indicate S
groups on DOM and humic/fulvic acids are important for the complexation of Ag+ and
that such complexation alleviates toxicity of Ag to biota since the complexed Ag is not
in a bioavailable form (Bell and Kramer 1999; Chen et al. 2013).
Overall this study demonstrated the critical role of DOM in soil water extracts for
complexation with Ag. It has also shown that spectroscopic techniques such as MIR are
very effective and efficient in predicting complexed Ag. The implications of this study
are that since Ag+ in soil solution has a very strong interaction with DOM it is not
likely that Ag+ will be available when high DOM concentrations are present. This
strong interaction is also comparable to the strong affinity of Cu2+ to DOM where the
aromatic carbon content was found to significantly impact the Cu mobilising potential
in soils (Amery et al. 2008). As a result, the complexation of Ag with DOM and its
relationship to DOM quality could cause significant leaching of Ag-DOM complexes,
which should be considered in assessing potential mobility of Ag in the terrestrial
environment.
120

Conclusions
1. Silver partitions strongly to the solid phase in soils, which is positively
correlated with cation exchange capacity, total organic carbon and pH. In
addition, a rapid decrease in Ag exchangeability was observed after a short two
week incubation.
2. Long term ageing of soluble Ag in soils revealed that the concentration of
exchangeable Ag continued to decrease and this was consistent with an
increased formation of metallic Ag as well as associations with Fe-
oxohydroxides and reduced S groups of organic matter. After six months of
ageing, the majority of added Ag was found to be in non-exchangeable pools in
the soils examined.
3. Dissolved organic matter plays a critical role in the complexation of Ag in soil
solutions. This is influenced by both DOM quantity and quality where the
aromatic and humic groups and C:S ratio are the most influential to the strength
of binding.
As a consequence of these main outcomes, the research contained in this thesis
highlights the importance of measuring isotopically exchangeable metal concentrations
in soil rather than total metal concentrations alone. This technique provides
environmentally relevant information on the behaviour of Ag in soils as it allows for a
greater understanding of the fate and potential availability of Ag in soils. The strong
interaction between Ag+ and DOM in soils suggests Ag+ will not be bioavailable when
high DOM concentrations are present in soil solutions. In contrast, the strong
interaction could cause significant leaching of Ag-DOM complexes which should be
121

considered in assessing potential mobility of Ag in the terrestrial environment.
Speciation data showed that Ag+ is reduced to metallic Ag over time in soils and
associations with S and iron oxides in soil can also lead to reductions in Ag lability.
The results in this study suggest the risk of Ag in soil environments will be
significantly reduced due to aging reactions and changes in speciation that will remove
soluble Ag into non-exchangeable pools in soils.
Future research directions
To address some of the issues raised in this study, and in order to further develop our
understanding of the behaviour and fate of Ag in soils, further research in the following
areas is recommended:
1. This study presented an isotopic dilution method for measuring the partitioning
(Kd-value) and lability (E-value) of Ag in soils. The results showed great
variation in both Kd and E-values across soils, which was heavily dependent on
soil properties and the concentration of added metal. Assessment of field-
contaminated soils will enable a greater understanding of the partitioning and
lability of Ag in the environment following exposure to various Ag sources (e.g.
AgNPs, biosolids, effluents, mine tailings). Applying the E-value method to
soils amended with these various Ag sources will provide a measure of the
available fraction in soils as a result of Ag pollution to the soil environment.
2. Following addition of soluble metals, initial ageing reactions were observed
over a short period of time, but over a longer term these ageing processes
slowed. There are many seasonal changes that could occur in the environment
that may change the conditions of the soil. As a result, this could alter the
122

chemical speciation of the metal. Silver is a redox sensitive metal, therefore
changes in soil water content, salinity or pH will heavily influence the amount
of exchangeable metal. In order to assess such effects on the behaviour and fate
of Ag in soil, further research should include monitoring E-values through
wetting and drying cycles, mimicking agricultural practices (e.g. application of
biosolids) and over a range of salinities and pH values. While Ag is overall
strongly partitioned to the solid phase of soils and over time most soluble Ag
converts to non-exchangeable forms in soil, changes in environmental
conditions could result in the re-mobilisation of this metal as well as potential
for the dissolution of non-labile precipitates like AgCl or Ag2S to occur slowly
over time.
3. The solid-phase speciation and solution complexation findings in this study
highlighted the importance of soil organic matter on the availability of Ag in
soils. Through both solid phase interaction and the complexation of Ag with
DOM in solution, it is apparent that these interactions decrease the amount of
labile and hence potentially available Ag+. The solid-phase speciation data
highlighted the significance of S-groups whereas the solution phase complexed
Ag results indicated humic and aromatic groups were most influential along
with the C:S ratio. Further characterisation of the DOM by specifically
measuring the concentration of reduced S groups present in solution DOM
would be insightful to assess whether these groups are specifically responsible
for the affinity of DOM for Ag+ in soil solutions. Further investigation of the
complexation between Ag and DOM could also include a quantitative measure
of the complexation capacity of DOM with Ag+.
123

The characterisation of DOM by fluorescence and MIR could also be carried
out with the presence of Ag+ in the solution, across a range of concentrations, in
order to make spectral comparisons with and without Ag. Changes in spectral
features could perhaps be used to precisely identify the characteristics of DOM
responsible and the mechanism behind Ag complexation in soil solution.
124

References
Amery, F., F. Degryse, K. Cheyns, et al. (2008). "The UV-absorbance of dissolved organic matter predicts the fivefold variation in its affinity for mobilizing Cu in an agricultural soil horizon." Eur. J. Soil Sci. 59(6): 1087-1095.
Bell, R. A. and J. R. Kramer (1999). "Structural chemistry and geochemistry of silver-sulfur compounds: Critical review." Environ. Toxicol. Chem. 18(1): 9-22.
Buekers, J., L. Van Laer, F. Amery, et al. (2007). "Role of soil constituents in fixation of soluble Zn, Cu, Ni and Cd added to soils." Eur. J. Soil Sci. 58(6): 1514-1524.
Chen, Z., C. Porcher, P. G. C. Campbell, et al. (2013). "Influence of humic acid on algal uptake and toxicity of ionic silver." Environ. Sci. Tech. 47(15).
Cornelis, G., J. K. Kirby, D. Beak, et al. (2010). "A method for determination of retention of silver and cerium oxide manufactured nanoparticles in soils." Environ. Chem. 7(3): 298-308.
Hamon, R. E., D. R. Parker and E. Lombi (2008). Advances in isotopic dilution techniques in trace element research: A review of methodologies, benefits and limitations. Adv. Agron. Vol 99. 99: 289-343.
Kaegi, R., A. Voegelin, C. Ort, et al. (2013). "Fate and transformation of silver nanoparticles in urban wastewater systems." Water Res. 47(12): 3866-3877.
Ma, Y. B., E. Lombi, A. L. Nolan, et al. (2006). "Determination of labile Cu in soils and isotopic exchangeability of colloidal Cu complexes." Eur. J. Soil Sci. 57(2): 147-153.
Ma, Y. B., E. Lombi, A. L. Nolan, et al. (2006). "Short-term natural attenuation of copper in soils: Effects of time, temperature, and soil characteristics." Environ. Toxicol. Chem. 25(3): 652-658.
Romkens, P. F., J. Bril and W. Salomons (1996). "Interaction between Ca2+ and dissolved organic carbon: Implications for metal mobilization." Applied Geochemistry. 11(1-2): 109-115.
Sauvé, S., W. Hendershot and H. E. Allen (2000). "Solid-solution partitioning of metals in contaminated soils: Dependence on pH, total metal burden, and organic matter." Environ. Sci. Technol. 34(7): 1125-1131.
125