behavioral economics for human-in-the-loop control systems
TRANSCRIPT

1
Behavioral Economics for Human-in-the-loopControl Systems DesignOverconfidence and the hot hand fallacy
Marius Protte†, Rene Fahr†, Daniel E. Quevedo♯, Senior Member, IEEE
Abstract— Successful design of human-in-the-loop control sys-tems requires appropriate models for human decision makers.Whilst most paradigms adopted in the control systems literaturehide the (limited) decision capability of humans, in behavioraleconomics individual decision making and optimization processesare well-known to be affected by perceptual and behavioralbiases. Our goal is to enrich control engineering with someinsights from behavioral economics research through exposingsuch biases in control-relevant settings.
This paper addresses the following two key questions:1) How do behavioral biases affect decision making?2) What is the role played by feedback in human-in-the-loop
control systems?Our experimental framework shows how individuals behave
when faced with the task of piloting an UAV under risk anduncertainty, paralleling a real-world decision-making scenario.Our findings support the notion of humans in CyberphysicalSystems underlying behavioral biases regardless of – or evenbecause of – receiving immediate outcome feedback. We observesubstantial shares of drone controllers to act inefficiently througheither flying excessively (overconfident) or overly conservatively(underconfident). Furthermore, we observe human-controllersto self-servingly misinterpret random sequences through beingsubject to a “hot hand fallacy”. We advise control engineersto mind the human component in order not to compromisetechnological accomplishments through human issues.
I. INTRODUCTION
Our century is bringing interesting challenges and opportu-nities that derive from the way that digital technology is shap-ing how we live as individuals and as a society. A key featureof a number of engineered systems is that they interact withhumans. Rather than solely affecting humans, often peoplemake decisions that have an effect on the engineered system.As an example, when driving our cars we often decide to takea route which differs from that suggested by the navigationsystem. This information is fed back to the service providerand henceforth used when making route suggestions to otherusers. The analysis and design of such Cyber-physical HumanSystems (CPHSs) would benefit from an understanding of howhumans behave. However, given their immense complexity, itis by no means clear how to formulate appropriate models forhuman decision makers, especially when operating in closedloop systems.
†Faculty of Business Administration and Economics, PaderbornUniversity, 33098 Germany. [email protected],[email protected]
♯School of Electrical Engineering & Robotics, Queensland Universityof Technology, QLD 4000, Brisbane, Australia. [email protected]
CPHSs fit into the general context of human-machine sys-tems and pose multidisciplinary challenges that have beentackled in a number of domains. For example, interestingsurveys on signal processing approaches include [1] and[2], whereas [3] adopts a computer science viewpoint. Morefocused on specific applications, the articles in the specialissue [4] as well as [5] study the interaction between humansand vehicles. The paper [6] surveys systems comprised ofhumans and robot swarms and [7] reviews telemanipulationby small unmanned systems. Also within the control systemscommunity significant advances have been made, see, e.g.,[8], [9], [10], [11]. Here it is common to model the effectof humans as a limited actuation resource or unknown deter-ministic dynamics to be identified. This opens the door to usevarious robust control and game theoretic methods to designclosed loop systems. However, most paradigms adopted in thesystems control literature so far hide the decision capability ofhumans and limitations to their cognitive and computationalcapabilities. Notable exceptions to the literature include [12]and [13] where human decision making is characterized viaa Partially Observed Markov Decision Process (MDP) [14]with states representing basic physical human aspects, such asoperator fatigue or proficiency. In particular, [13] investigatesa stochastic two player game, resulting from the interactionbetween a human operator and an unmanned aerial vehicle(UAV). Here the UAV is allowed to react to the decisions madeby the operator, to compensate for potential non-cooperativebehaviour. For a CPHS with multiple human decision makers,[15] models limitations in their decision making capabilitiesusing “level-k reasoning” and associated game theory [16]:Each agent optimizes a cost function using only reducedknowledge of the other agents’ policies.
In the present work we investigate human decision mak-ing from a behavioral economics perspective. We pose thequestion how behavioral biases affect decision making, sincewe expect behavioral influences to potentially hamper tech-nological optimization efforts. More generally, we aim todirect attention to the human as a poorly observed uncertaintysource in CPHS. We thus consider humans as being “boundedrational”, i.e., they are strategic thinkers who want to maximizetheir benefits but, at the same time, have only limited cognitiveand computational capabilities. We distinguish between closedloop scenarios, where the decision maker receives feedbackabout the success of its actions, and open loop situations,where no such feedback information is available. Here, wepay special attention to the role played by feedback on
arX
iv:2
007.
1586
9v1
[m
ath.
OC
] 3
1 Ju
l 202
0

2
behavioral biases in form of overconfidence [17] and theso-called hot hand fallacy [18]. The latter effect may arisewhen a decision maker becomes aware of her past successand overestimates future success probabilities. We will nextintroduce some prominent findings from behavioral economicsthat can be regarded as influential for CPHSs. These will besubsequently applied to an experimental human-in-the-loopframework inspired by the UAV piloting scenario of [13].Throughout our presentation we will highlight the value ofgiving greater consideration to human behavior and behavioralbiases in control engineering. The central outcome of ourstudy is that frequent feedback to human decision makersmay lead to sub-optimal results. This stands in contrast tosituations wherein computers carry out optimizations and moreinformation is always beneficial [19], [14], [20]. As we shallsee, when humans act as decision makers, then the situationis more ambiguous.
II. CONTRIBUTIONS FROM BEHAVIORAL ECONOMICS
Behavioral economics is a comparably young research fieldthat is concerned with the overarching question of how humansactually do behave in economic decisions, in contrast tohow they are prescribed to behave by economic theory [21].Therefore, traditional economic assumptions and models arerevised and enriched by insights from psychology. This servesto improve the understanding and predictability of humanbehavior, especially regarding recurring errors and biases indecision making [22]. The perception of humans thereby shiftsfrom the assumption of a rationally optimizing Markov deci-sion maker towards regarding humans as rather bounded ratio-nal agents. Humans constantly use cognitive mechanisms ofsimplification, namely decision heuristics, in order to processinformation and make decisions under uncertainty [21], [23].Such heuristics are used subconsciously due to individuals notmanaging to adequately process the complexity of a decisionproblem or to take all relevant information into account [22].In fact, when making judgments or estimations of events,frequencies or probabilities under uncertainty, individuals donot always obey Bayesian rules and statistical logic, as theyare meant to do in models assuming perfectly rational agentsand Markov decision makers. Such heuristic simplificationssometimes yield reasonable judgments, but may also lead tosevere and systematic errors [24], [25], [26]. Interestingly, evenexperienced researchers and professionals often underlie thesame judgment heuristics and biases as laypersons do [25].
A. Overconfidence
Overconfidence is well-known to be one of multiple be-havioral stylized facts influencing and thereby biasing hu-man decision making. Overconfidence can be defined as ageneral miscalibration in beliefs [27], more specifically, thediscrepancy between confidence and accuracy [17]. In beingoverconfident, people overestimate their own capabilities, theirknowledge or the general favorability of future prospects [28].The authors of [29] go as far as labeling overconfidence themost robust finding in the psychology of judgment.
Early contributions to research on overconfidence found thatpeople systematically tended to be unrealistically optimisticabout their future, in judging themselves to be more likelyto experience a variety of positive events, and to be lesslikely to experience negative events, compared to others. Thispattern has been traced back mainly to the degree of desir-ability influencing the perceived probability of such events[30]. In the original study [31] over 80% of the subjectsregarded themselves as more skillful and less risky car driversthan the average driver. Moreover, one half of the subjectsestimated themselves to be amongst the top 20% of thesample, vividly illustrating overconfidence as the discrepancybetween confidence and accuracy (belief and reality) in doingso. Meanwhile, evidence on overconfidence does not dependon whether or not experimental subjects are familiar to thegiven tasks or actions [32]. The tasks difficulty, on the otherhand, is known to have an impact on overconfidence, asmore difficult tasks were shown to facilitate overconfidencerather than easy tasks [27], [33]. Overconfidence can expressitself, and consequently has been studied, in multiple ways,like ‘better-than-average’ beliefs, e.g. [32]), or ‘overprecision’,e.g. [34]). The facet of overconfidence most fitting for thepurpose of our current work appears to be overestimation,described as self-servingly overestimating the likelihood ofdesirable outcomes, supposedly fueled by wishful thinking forsuch desirable outcomes to occur* [36], [37]. An experimentalapproach for studying overconfidence was requested in [32], asmost research in this field merely relies on verbal statements orsubjective estimations, rather than monitoring human decision-behavior. Our current analysis makes a contribution to this call.Overconfidence is connected to a variety of other behavioralphenomena, which will be revised in the sequel.
B. Underestimation of systematic risks
Analogous to overestimating favorable outcomes, overconfi-dence also implies underestimating risks, or rather the varianceof risky processes, indicating a too narrow distribution in one’ssubjective probability beliefs [38]. Often, humans assess prob-abilities incorrectly or rather draw incorrect conclusions fromthem through not adhering to Bayesian rules or neglectingbase-rates [24], [39]. In doing so, smaller probabilities areusually overestimated while larger probabilities are underesti-mated [40], [41]. Vice versa, decision makers are also foundto underestimate the overall likelihood of the occurrence ofrisks with small single probabilities of occurrence in someinstances. Especially risks of disqualification [42] through low-probability events generate less concern than their probabilitywarrants on average [43]. A cognitive process behind thisunderestimation of especially very low probability risks, likebeing involved in car crashes or natural disasters, can be char-acterized as subconsciously approximating low probabilitieswith zero in order to not having to mentally deal with themanymore [44].
Consequences of this issue can be observed in variousareas of economic and social decision making. Overconfident
*Overconfidence is therefore regarded as closely related to self-deception,see e.g. [35].

3
individuals, who underestimate health, financial or drivingrisks, are more likely to have insufficiently low insurancecoverage against such risks [45]. Furthermore, employees areobserved to underestimate the risk of their own company’sstock and being overly optimistic about its future performance.They tend to include such stocks too heavily into their retire-ment plans, despite the respective stock being riskier than theoverall market, as a consequence of excessive extrapolation ofpositive past performance [46]. Money being at stake doesneither change overconfident behavior, nor does it lead tobetter estimation results concerning abilities, probabilities orrisk. Experimental evidence was obtained on overconfidenceleading to overly rushed market entries, that often precedebusiness failures, due to entrepreneurs overestimating theirrelative chances to succeed [47]. Overconfident top-managerswere further shown to underestimate the volatility of cashflows of S&P 500 companies, resulting in erroneous invest-ment and financing decisions, in a large-scale survey over10 years [38]. Especially managers competing for leadershippositions display overconfidence by tending to take on riskierprojects due to underestimating their risks [48]. OverconfidentCEOs also overestimate the positive impact of their leadershipand their ability to successfully complete a merger to generatefuture company value. These CEOs are found to execute value-destroying mergers, thereby exposing the affected companiesto high financial or even existential risks [49]. Multiple ex-perimental studies found that overconfident investors trademore excessively than others, overestimate the impact oflittle information they have [50], [51], and do not adjusttheir trading volume to new negative information [52]. Thesefindings, which are inconsistent with the Markov assumptionand Bayesian updating, contradict theoretical expectations ofrationally optimizing economic agents and re-emphasize thenotion of individuals as bounded rational decision makers [21].
C. Attribution theory
Another mechanism contributing overconfident decisionmaking is a biased perception of causality in a self-servingway. Accordingly, individuals express the tendency to attributepositive past outcomes to themselves and their abilities, whileblaming negative outcomes on external circumstances [53].Successes are internalized, failures are externalized [54]. Inan early experiment, teachers attributed learning successes oftheir pupils to their teaching skills, while blaming bad learningperformances on the pupils themselves [55]. This self-servingattribution bias was identified to be the major driver of theaforementioned CEO overconfidence leading to risky mergers[56]. In [57] overconfidence evolves when traders get feedbackabout their ability through experience in a multiperiod marketmodel and overweigh the role of their ability on prior success.Overconfident investors subsequently tend to become evenmore overconfident in their future investments. Meanwhile,financial losses are rather attributed to environmental cir-cumstances, like unfavorable macroeconomic developments orsimply bad luck, with the investors degree of overconfidenceremaining constant [58], [59]. Also, professionals were foundto be as likely as laypersons to express overconfidence in
making economic decisions as well as in re-evaluating thequality of their own previous decision in hindsight [60].
People overestimate their own capabilities as well as theircontrol over future events that are actually determined byexternal factors, especially chance. This was illustrated in anexperimental study in which participants were either given alottery ticket (control group) or allowed to select a lotteryticket themselves (treatment group). Subjects who had chosentheir ticket themselves were, on average, demanding four timesmore money than those who were simply given their tickets,when asked to name a price they would sell it for. Those whochose the ticket themselves mistakenly assumed they wouldtherefore be more likely to win, although the winners wouldbe determined entirely by chance. This mechanism has beenlabeled the “illusion of control” [54], although critics of thisconcept have argued that it rather identifies a pattern of peopleoverestimating their ability to predict future outcomes than ofpeople overestimating their ability to control future outcomes[61]. Both interpretations are regarded as sufficient for thepurpose of our current analysis.
D. The role of feedback in overconfidence
Providing feedback is commonly regarded as an efficientlearning mechanism in Markov Decision Processes in orderto compute optimal behavior [62], [14], [19] and offers greatvalue for deriving logical inference rules in accordance withBayesian reasoning in machine learning [63], [64]. Whilethese points may hold true for cyber-physical systems withouthuman decision makers, humans are often observed to reactto feedback differently. Contradicting Markovian assumptions,behavioral economic research constantly observes errors inupdating the information set (e.g., [65], [66]). This indicatesthat providing more feedback information to humans doesnot necessarily lead to better estimations and decisions. Theimportance of outcome feedback in counteracting certain be-havioral biases, through continuous “monitoring of progressthrough a judgment-action-outcome loop” [67] and offeringcorrective adjustments, has been pointed out before [68], butit may not apply equally to every type of bias.
While research studying the connection of high informationsupply to overconfidence is comparably scarce, in variousinstances a higher amount of feedback was not found tobe able to improve behavioral rationality with regards tooverconfidence, as it would be expected by theory. Bothoverconfidence and underconfidence were shown to persist inemployees’ choices of incentive schemes although receivingclear feedback revealing the optimal alternative for them [69].Experiments on sports outcome-estimation showed that over-confidence did not decrease but rather increase with additionalinformation, as the subjects confidence increases more thantheir accuracy does [70]. Similarly, CEO overconfidence inforecasts was found to persist against corrective feedback [71]and venture capitalists were shown to be more overconfidentwhen having access to more information [72]. In generalknowledge tasks that are related to each other, correctiveoutcome feedback has shown able to mitigate underconfidencebut not overconfidence [73]. It turns out that feedback appears
4
to affect behavioral biases rather ambiguously with overconfi-dence tending to largely persist, or even growing, in responseto additional information.
E. Misperceptions of random sequences
With regards to human sequential decision processes, an-other potential threat of high information supply leading tobiased decision making, is the danger of falling subject to thehot hand fallacy. The study of this error in the assessmentof past outcomes originates in observations from basketball.If this player repeatedly scored on his past throws, he iscommonly judged to have a hot hand by his teammates and theaudience. Therefore, the player’s likelihood of scoring on fu-ture throws is judged to increase by the audience, even thoughfuture throws are independent of past throws. In doing so, theplayer’s objective probability of scoring is overestimated basedon his past successes [18]. This hot hand fallacy results frommisjudging statistically independent favorable events to beconnected to one another, implying a positive autocorrelationbetween them. Repeated past positive outcomes are thereforeerroneously expected to occur again in the near future, therebyoverestimating their objective probability of occurrence. Thehot hand fallacy is a very vivid illustration of biased probabil-ity judgments through presumed representativeness of recentinformation. Misinterpretations of random sequences throughsuch extrapolation of recent outcomes into the future wereempirically found to apply to several contexts. Regardingbasketball, the findings by [18] were supported by studies onbasketball betting market odds, although only small effectswere found [74], [75]. In a laboratory experiment, simulatinga blackjack game, gamblers were observed to bet more moneyafter a series of wins than after a series of losses [76]. Inmore sensitive contexts, individual decisions show signs ofthe hot hand fallacy as well. For instance, financial investorswho had negative prior experiences with low stock returns,exhibit a decreased willingness to take financial risks in futureinvestments [77]. Attribution theory, especially the illusion ofcontrol mentioned above, may factor into the hot hand assump-tion as well, since subjects are more likely to attribute recentsequences with low alternation to human skilled performance,while sequences with high alternation are rather perceived aschance processes [78].
Before proceeding, we note that the hot hand fallacy’sopposing bias, the so-called gamblers fallacy, presents theerroneous expectation of systematic reversals in stochasticprocesses. These are grounded in the belief that a small sampleshould be representative for the underlying population, i.e.,that a Bernoulli random process should balance out even acrossfew rounds [79]. Both phenomena have recently been stronglydisputed in their status as biases [80], [81].
III. SURVEILLANCE DRONE PILOTING FRAMEWORK ANDHYPOTHESES
Our experimental design for analyzing behavioral biasesin CPHSs builds upon a basic setup involving UAVs thatinteract with human operators, as discussed in [13] and which
j3
j1
i1
i2
i3
i7
i6
i5
i8
i4
j2
j4
j5 j6
j7
j8
j9j10
i1
i2
i3
i7
i6
i5
i8
i4
i1
i2
i3
i7
i6
i5
i8
i4
i1
i2
i3
i7
i6
i5
i8
i4
i1
i2
i3
i7
i6
i5
i8
i4
i1
i2
i3
i7
i6
i5
i8
i4
i1
i2
i3
i7
i6
i5
i8
i4 i1
i2
i3
i7
i6
i5
i8
i4
i1
i2
i3
i7
i6
i5
i8
i4
i1
i2
i3
i7
i6
i5
i8
i4
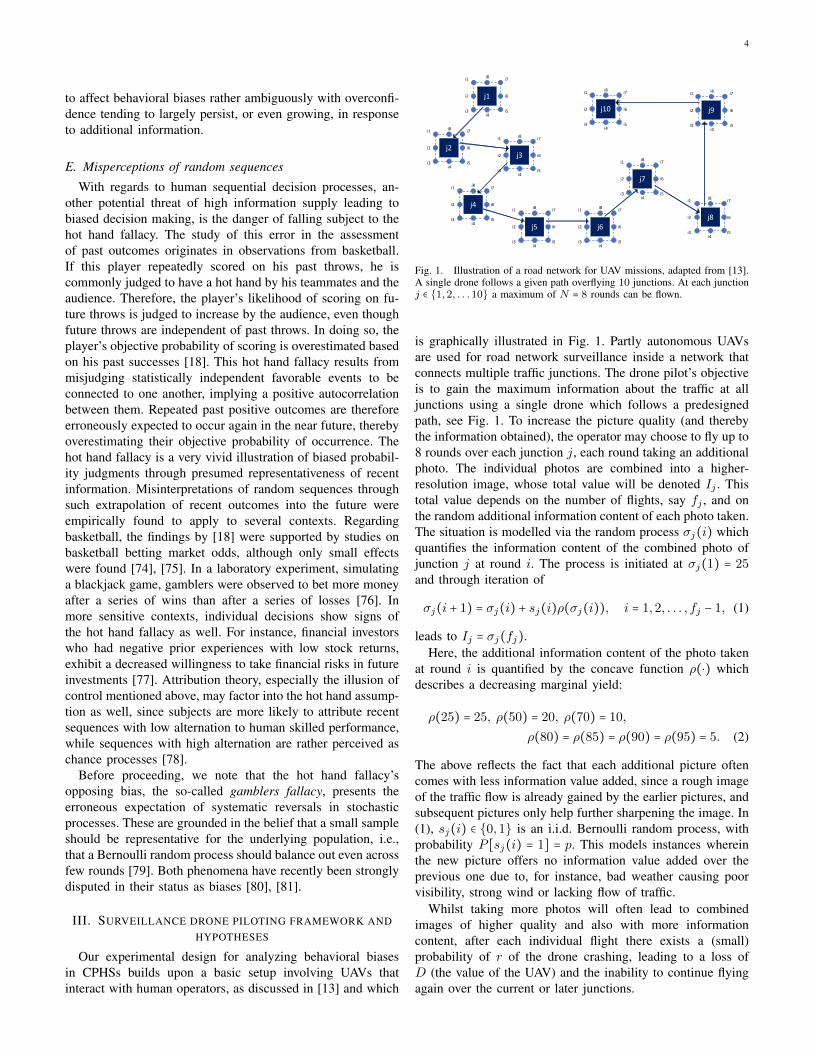
Fig. 1. Illustration of a road network for UAV missions, adapted from [13].A single drone follows a given path overflying 10 junctions. At each junctionj ∈ {1,2, . . .10} a maximum of N = 8 rounds can be flown.
is graphically illustrated in Fig. 1. Partly autonomous UAVsare used for road network surveillance inside a network thatconnects multiple traffic junctions. The drone pilot’s objectiveis to gain the maximum information about the traffic at alljunctions using a single drone which follows a predesignedpath, see Fig. 1. To increase the picture quality (and therebythe information obtained), the operator may choose to fly up to8 rounds over each junction j, each round taking an additionalphoto. The individual photos are combined into a higher-resolution image, whose total value will be denoted Ij . Thistotal value depends on the number of flights, say fj , and onthe random additional information content of each photo taken.The situation is modelled via the random process σj(i) whichquantifies the information content of the combined photo ofjunction j at round i. The process is initiated at σj(1) = 25and through iteration of
σj(i + 1) = σj(i) + sj(i)ρ(σj(i)), i = 1,2, . . . , fj − 1, (1)
leads to Ij = σj(fj).Here, the additional information content of the photo taken
at round i is quantified by the concave function ρ(⋅) whichdescribes a decreasing marginal yield:
ρ(25) = 25, ρ(50) = 20, ρ(70) = 10,
ρ(80) = ρ(85) = ρ(90) = ρ(95) = 5. (2)
The above reflects the fact that each additional picture oftencomes with less information value added, since a rough imageof the traffic flow is already gained by the earlier pictures, andsubsequent pictures only help further sharpening the image. In(1), sj(i) ∈ {0,1} is an i.i.d. Bernoulli random process, withprobability P [sj(i) = 1] = p. This models instances whereinthe new picture offers no information value added over theprevious one due to, for instance, bad weather causing poorvisibility, strong wind or lacking flow of traffic.
Whilst taking more photos will often lead to combinedimages of higher quality and also with more informationcontent, after each individual flight there exists a (small)probability of r of the drone crashing, leading to a loss ofD (the value of the UAV) and the inability to continue flyingagain over the current or later junctions.
5
Number of ro
unds
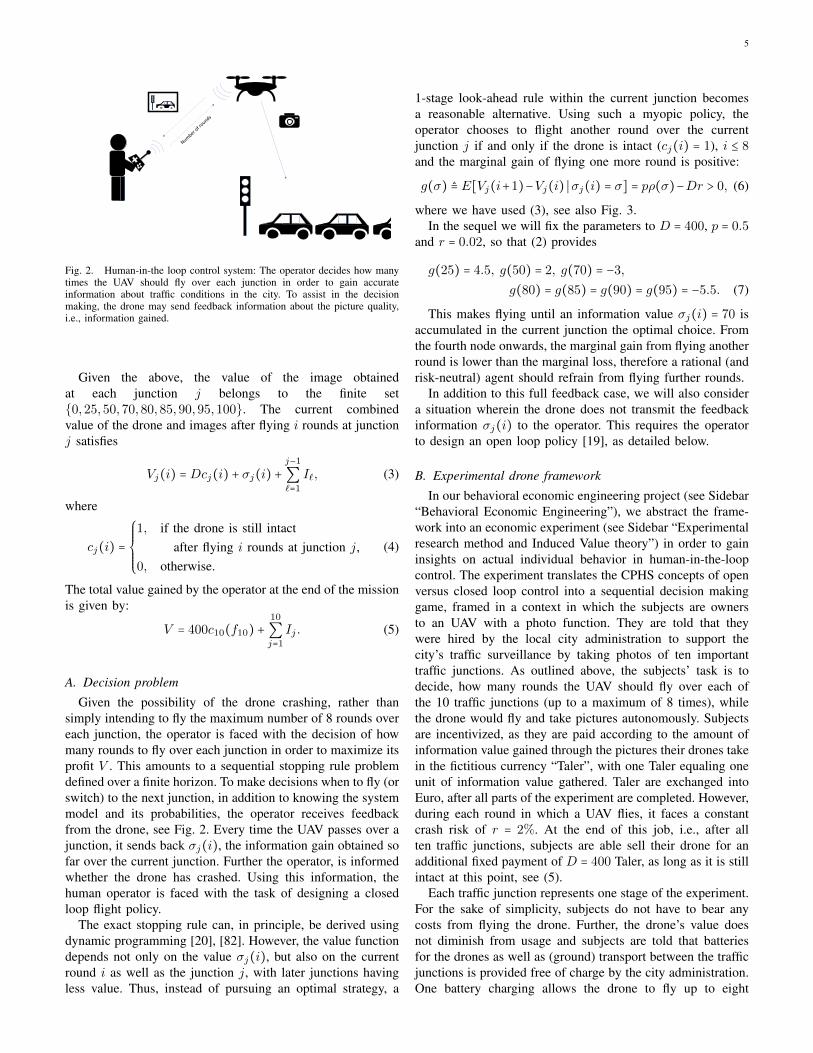
Fig. 2. Human-in-the loop control system: The operator decides how manytimes the UAV should fly over each junction in order to gain accurateinformation about traffic conditions in the city. To assist in the decisionmaking, the drone may send feedback information about the picture quality,i.e., information gained.
Given the above, the value of the image obtainedat each junction j belongs to the finite set{0,25,50,70,80,85,90,95,100}. The current combinedvalue of the drone and images after flying i rounds at junctionj satisfies
Vj(i) =Dcj(i) + σj(i) +j−1
∑`=1
I`, (3)
where
cj(i) =⎧⎪⎪⎪⎪⎨⎪⎪⎪⎪⎩
1, if the drone is still intactafter flying i rounds at junction j,
0, otherwise.(4)
The total value gained by the operator at the end of the missionis given by:
V = 400c10(f10) +10
∑j=1
Ij . (5)
A. Decision problem
Given the possibility of the drone crashing, rather thansimply intending to fly the maximum number of 8 rounds overeach junction, the operator is faced with the decision of howmany rounds to fly over each junction in order to maximize itsprofit V . This amounts to a sequential stopping rule problemdefined over a finite horizon. To make decisions when to fly (orswitch) to the next junction, in addition to knowing the systemmodel and its probabilities, the operator receives feedbackfrom the drone, see Fig. 2. Every time the UAV passes over ajunction, it sends back σj(i), the information gain obtained sofar over the current junction. Further the operator, is informedwhether the drone has crashed. Using this information, thehuman operator is faced with the task of designing a closedloop flight policy.
The exact stopping rule can, in principle, be derived usingdynamic programming [20], [82]. However, the value functiondepends not only on the value σj(i), but also on the currentround i as well as the junction j, with later junctions havingless value. Thus, instead of pursuing an optimal strategy, a
1-stage look-ahead rule within the current junction becomesa reasonable alternative. Using such a myopic policy, theoperator chooses to flight another round over the currentjunction j if and only if the drone is intact (cj(i) = 1), i ≤ 8and the marginal gain of flying one more round is positive:
g(σ) ≜ E[Vj(i+1)−Vj(i) ∣σj(i) = σ] = pρ(σ)−Dr > 0, (6)
where we have used (3), see also Fig. 3.In the sequel we will fix the parameters to D = 400, p = 0.5
and r = 0.02, so that (2) provides
g(25) = 4.5, g(50) = 2, g(70) = −3,
g(80) = g(85) = g(90) = g(95) = −5.5. (7)
This makes flying until an information value σj(i) = 70 isaccumulated in the current junction the optimal choice. Fromthe fourth node onwards, the marginal gain from flying anotherround is lower than the marginal loss, therefore a rational (andrisk-neutral) agent should refrain from flying further rounds.
In addition to this full feedback case, we will also considera situation wherein the drone does not transmit the feedbackinformation σj(i) to the operator. This requires the operatorto design an open loop policy [19], as detailed below.
B. Experimental drone framework
In our behavioral economic engineering project (see Sidebar“Behavioral Economic Engineering”), we abstract the frame-work into an economic experiment (see Sidebar “Experimentalresearch method and Induced Value theory”) in order to gaininsights on actual individual behavior in human-in-the-loopcontrol. The experiment translates the CPHS concepts of openversus closed loop control into a sequential decision makinggame, framed in a context in which the subjects are ownersto an UAV with a photo function. They are told that theywere hired by the local city administration to support thecity’s traffic surveillance by taking photos of ten importanttraffic junctions. As outlined above, the subjects’ task is todecide, how many rounds the UAV should fly over each ofthe 10 traffic junctions (up to a maximum of 8 times), whilethe drone would fly and take pictures autonomously. Subjectsare incentivized, as they are paid according to the amount ofinformation value gained through the pictures their drones takein the fictitious currency “Taler”, with one Taler equaling oneunit of information value gathered. Taler are exchanged intoEuro, after all parts of the experiment are completed. However,during each round in which a UAV flies, it faces a constantcrash risk of r = 2%. At the end of this job, i.e., after allten traffic junctions, subjects are able sell their drone for anadditional fixed payment of D = 400 Taler, as long as it is stillintact at this point, see (5).
Each traffic junction represents one stage of the experiment.For the sake of simplicity, subjects do not have to bear anycosts from flying the drone. Further, the drone’s value doesnot diminish from usage and subjects are told that batteriesfor the drones as well as (ground) transport between the trafficjunctions is provided free of charge by the city administration.One battery charging allows the drone to fly up to eight

6
Fig. 3. Marginal gains within each junction, for D = 400. Diagonal arrows describe an increase in information value with a subsequent crash, vertical arrowsrepresent a non-increase with a subsequent crash. Note that the maximum information value gain attainable at each traffic junction, namely 100, can only bereached if a subject decides to fly all eight rounds possible while obtaining an increase in each round.
rounds before the drone must land to recharge. Therefore,subjects are able to decide for a maximum of eight rounds pertraffic junction and consequently take up to eight pictures. Thiscorresponds to a maximum of eight nodes that can be reachedper junction. In the first round flown over each traffic junction,an information value of σj(1) = 25 is gained with certainty, asany picture taken represents an increase in information valueover no picture taken at all. From the second round onwards,the information value potentially gained per round decreases,see (2). For the sake of simplification, a crash can only happenafter a picture is taken. As per (5), the information valuegained at the junction where the crash occurs up to the pointof it, still qualifies for the payment, as subjects were told thatthe drone’s memory chip would survive the crash.
The operators need to decide how many rounds a UAVshould fly over each traffic junction in order to maximize thetotal gain V in (5) and consequent payoff. In order to do so,some of them receive feedback on the results of the previousrounds – depending on the treatment – which they can basetheir decision on. As noted before, the resulting optimizationproblem belongs to the class of general stopping problems.Its solution, both with and without feedback information, canin principle be derived, but requires careful computations.Since individuals are well-known to have limited cognitive andcomputational capabilities, they will not be able to compute aglobally optimal strategy. Instead, optimizing subjects will usethe decision heuristic in (6), i.e., the fourth node is identifiedas the one to reach.
The above leads to two decision heuristics, depending onwhether feedback information is available or not. In the former(closed loop heuristic), at every junction the UAV should aimto fly as many rounds as needed until reaching an informationvalue of σj(i) = 70. To be more precise, introduce aj(i) ∈{0,1}, where aj(i) = 1 corresponds to the decision to flyanother round over the current junction, then the closed loopheuristic can be stated via:
aj(i) = 1, if and only if σj(i) < 70 and i ≤ 8
and the drone is intact. (8)
Note that in this case, the total number of rounds flown over
a junction j, namely fj = ∑aj(i), depends on the sequenceof increases and non-increases the subject experiences.
In the absence of feedback from the drone, a suitable openloop heuristic amounts to attempting to fly fj = 5 times atevery junction:
aj(i) = 1, if and only if i ≤ 4 and the drone is intact. (9)
This yields the expected result of three increases in informa-tion value, with the first one being granted with certainty inthe first round. The above rules of thumb present reasonableheuristic approximations to the task’s optimal solution whenimplemented for all junctions. A rational and risk-neutraldecision maker, who acts according to expected utility theory[83], would follow these heuristics. Deviations from thesedecision-rules upwards or downwards represent indicators ofoverconfidence or underconfidence respectively, depending onthe direction.
The experiment ends either after all junctions are completedand the drone is sold or once the drone has crashed. A crashcould be caused by external factors like weather conditions,the drone hitting some object or animal, or technical failure.This risk of a total loss of the drone’s value in case of acrash imposes the prospect of high one-time costs onto theparticipants and thus prevents them from simply choosing themaximum number of rounds possible at every traffic junction.As subjects are paid according to the information value gained,striving for the optimal information value (using the aboveheuristic) presents the rational strategy. Always flying themaximum number of 8 rounds is not efficient, as gaininginformation value has to be weighed against maintaining thechance of being able to sell the drone at the end of theexperiment, as indicated in (5).
C. Hypotheses
The variety of behavioral phenomena and stylized facts re-garding decision biases and errors in relation to overconfidencepresented in the preceding section, suggests inefficient humandecision making. In fact, individuals are commonly observedto act overconfidently. In doing so, they tend to underestimatesystematic risks, insufficiently process joint and conditional

7
probabilities, self-servingly misattribute causal relationshipsand erroneously expect favorable outcome sequences to con-tinue in the future. These aspects should be particularlyrelevant in our example, since the probability of the dronecrashing may appear small for one specific round (2%), whilethe overall risk of the UAV crashing at any time over thecourse of the experiment is substantially higher. Modelingthe crash probability as a Bernoulli process, the chance of acrash when attempting to fly the maximum number of roundsat each of the ten junctions would be 1 − 0.9880 > 0.8.A narrow focus on the low single-decision crash probabil-ity [84] could therefore lead subjects to underestimate theoverall crash probability and consequently take higher risk.Providing feedback is commonly assumed to diminish thesebehavioral biases but known to not being able to entirelyresolve them, and in some instances even aggravating them.Subjects may rather attribute positive feedback to their owndecision performance to themselves instead of realizing that itis caused by chance. All these aspects point in the directionof expecting overconfident drone piloting. Manager overcon-fidence in economic decision making can be summarizedto originate in either overestimating expected cash flows orunderestimating risk [85]. Translated to our design, the dronepilots’ overconfidence could either result from overestimatingthe likelihood of information value improvements or fromunderestimating the risk of the UAV crashing. While the taskis framed in a quite understandable context, it is non-trivialin its solution. Most subjects are expected to approach thetask rather intuitively, i.e., not solving it systematically throughcomparing marginal gain and marginal costs, and consequentlyact overconfidently through one of its facets described above,if not through both. According to the general consensus ofliterature on overconfidence in human decision making, thefollowing hypothesis is posed:
a) H1: Drone pilots will generally act overconfidently inflying more than the optimal number of rounds, regardless offeedback.
As is also known from the literature, individuals are proneto unreflectively repeat decisions that previously yielded thempositive outcomes, even though such past successes entirelydepended on chance and have no impact on future outcomesat all. This decision heuristic, the hot hand fallacy alreadydiscussed, presents a major misinterpretation of random se-quences. While the hot hand fallacy in regard to the originalstudy on basketball throws [18] is subject to criticism today(with the data being re-analyzed and the conclusion beingreversed [80]), the general idea of individuals misjudging themeaning of random outcome sequences remains to be testedin the context of CPHS. For sequential decision problemsfeaturing feedback from the system, decision makers appearespecially vulnerable to fall victim to the hot hand fallacy.Translated to our drone framework, it is therefore expectedthat those drone pilots who immediately reach the optimalinformation value of a junction through experiencing gains inrepeated rounds in the closed loop system (as the possibilityis only given there), perceive themselves to be “on a roll”,
i.e., as having an equivalent to a hot hand†. Since decisionmakers are tempted to expect such apparent trends to continue,they will likely fly beyond the optimal number of rounds,overconfidently making their operation inefficient with regardsto risk and reward. This way, subjects fall victim to the hothand fallacy‡ Compared to the gamblers fallacy, a hot hand isconsidered more suitable to portray drone controllers behaviorin his attempt to gather information value, with humans moreprone to expect favorable outcomes to repeat under theirapparent control [78].§. This leads to our second hypothesis:
b) H2: Sequences of immediate positive feedback willlead to drone pilots falling victim to the hot hand fallacy.
These two hypotheses were tested in an experiment in-volving students at Paderborn University in September 2019.Details are given next.
IV. EXPERIMENTAL DESIGN
In order to be able to compare behavioral effects in closedand open loop operation, a between-subject design experimentis conducted, meaning each subject can only participate inexactly one treatment with the groups being compared after-wards.
A. Treatments
To evaluate the effect of feedback in human-in-the-loopcontrol, two treatments are presented: Closed Loop and OpenLoop. The groups differ only in the fact that subjects in one ofthem receive immediate outcome feedback after every decisionmade, while subjects in the other group do not receive anyfeedback until the end of the experiment.
In the Closed Loop Treatment, subjects receive feedbackdirectly after each round of each junction on whether anincrease in information value was gained in this specificround, see Fig. 3. They were also informed about the currenttotal information value gained for the respective junction andwhether the drone was still intact. Subsequently, they wereasked whether they wanted to fly another round. The framingin the instructions said that the drone would transmit thepictures taken to the drone pilots laptops immediately, sofeedback was given just in time for the next rounds decision.
In the Open Loop Treatment, subjects are provided with nofeedback at all. Subjects make decisions on how many roundsthe drone should fly over each junction entirely in advance.Afterwards, they are informed about the total informationvalue they obtained and whether the drone is still intact
†In our experiment, we define a hot hand as three consequent increasesfrom the very start of a junction. With the junctions being distinct fromeach other and the first success being certain anyway, there is no possibilityof pattern overlays [81]. Therefore, as well as due to the outcome of afourth flight being unimportant for judging the decision inefficient, we donot consider our results subject to ”streak selection bias” [80].
‡Literature observes a shift from hot hand beliefs for shorter outcomestreaks towards a gamblers fallacy pattern for increasing streak length [86],[79]. Drone controllers who experience multiple increases in a row wouldtherefore begin to overestimate the probability of a non-increase at some pointand stop flying to prevent a crash accordingly.
§Also, a hot hand fallacy can be considered the more problematic errorcompared to the gamblers fallacy, since in the case of the latter, subjectswould stop earlier and not risk a drone crash through flying in periods thatyield marginal losses (although sacrificing marginal gain).

8
and sold at the end of the experiment. The framing in theinstructions states that the UAV has to be deconstructed ina complex procedure to be able to extract and read out thememory chip to check on the pictures taken. Therefore, nofeedback on the pictures would be provided until either alljunctions were completed or the drone had crashed.
B. Procedure
The experiment was computerized using the experimentsoftware oTree [87] and hosted centrally on a university server,so subjects could remotely access the experiment and didnot have to come to the laboratory physically. 500 subjectswho previously had enrolled voluntarily into the BaER-Lab¶
student participant pool were chosen randomly, with 250 eachbeing randomly assigned to the two treatments in advance.These subjects were contacted via the online recruitmentsystem ORSEE [88] and invited to participate within thefollowing five days.
The invitation email included a hyperlink that directed thesubjects to their respective treatment, where they receivedthe detailed instructions for the experiment. The instructionsof both treatments only differed regarding the provision offeedback, as explained above. To be able to progress tothe drone flying task, subjects had to correctly solve fourcontrol questions. The questions revolved around the centralparameters of the experimental design in order to assure thatthe subjects had read and understood the instructions in itscritical parts. Subsequently, subjects advanced to the droneflying task, in which they had to make their decisions throughclicking single choice buttons. Subjects would receive one unitof the fictitious currency Taler for each unit of informationvalue gained as pay for flying the drone. During the whole ex-periment, one subject’s payoffs did not depend on the decisionsof any other subject. After completing the drone flying task,a result screen presented the total information value accruedover all traffic junctions, the state of the drone, i.e., whetherit was still intact and consequently sold to earn 400 additionalTaler or not, as well as the corresponding payoffs the subjectgenerated in Euros. Payoffs were translated from Taler to Euroat an exchange rate of 1 Euro per 120 Taler. Subjects were thenasked to answer a standardized questionnaire, that includedquestions on demographics, perceived task difficulty and thesubject’s reasons for choosing the numbers of rounds the waythey did. Afterwards, subjects were presented with the multipleprice list of [89] (see Sidebar “Multiple Price List Format”),in order to measure their risk preferences.
Filling out the price list was incentivized, as for everyfifteenth subject one out of the list’s twenty rows was randomlyselected and the payoffs that the subjects chosen alternativerow yielded in this row was added to the his total payoffs.In case Alternative A had been selected by the subject, thefixed amount stated in the respective row was simply addedto its payoffs. In case Alternative B had been selected, thelottery was automatically played out and either e0 or e30were added to the subject’s payoffs. After completing the price
¶BaER-Lab stands for “Business and Economic Research Laboratory”.For further information visit www.baer-lab.org.
TABLE IAVERAGE VALUES OF ROUNDS FLOWN, GAINED INFORMATION VALUE V ,
EARNINGS ∆m AND CRASH RATES, BY TREATMENT. STANDARD
DEVIATIONS ARE PRESENTED IN PARENTHESIS.
Closed Loop Open LoopAverage rounds flown 5.89 5.10
(2.08) (1.82)Average information value 651.84 509.90
gained in total (397.56) (380.13)Average earnings 5.43 4.30
in Euro (3.31) (3.17)Crash rate 52.63% 68.75%
list, subjects were informed about whether the list came intoeffect for their payoffs, and in case it did which row had beenselected. On a final screen, subjects were informed about theirtotal payoffs in Euros and thanked for their participation.
A subject’s total payoff function can consequently be for-malized as
∆m = 1
120V + d(`)i=15x (10)
where V is the total value, as in (5). The term d(`) representsthe additional payoff from the multiple price list, conditionalon the selected row ` of the list that a subject was paid in caseof being a fifteenth participant, i.e., a subjects participant’s IDbeing a multiple of 15.
Subjects were able to collect their payoffs in cash at theChair’s secretariat following their participation by stating aunique eight-figure ID-Code they had to create in the begin-ning of the experiment. That way the correct payoffs couldbe handed out to each subject, while maintaining anonymityabout the subject’s decisions made.
V. EXPERIMENTAL RESULTS
Out of the 105 subjects who finished the online experiment,57 participated in the Closed Loop and 48 in the OpenLoop treatment respectively. The average age of the subjectswas 23.87 years and varied by about half a year betweentreatments. 31 subjects (29.52%) were female, while onesubject classified itself as “diverse”. On average, subjectsearned e4.89 from the experiment, plus the amount they wouldearn from filling out the multiple price list in case they werepaid due to being a fifteenth participant.
Subjects in the Closed Loop treatment flew, on average,5.89 rounds over each traffic junction, thereby exceeding theaverage number of rounds from the Open Loop treatment by0.79 rounds per junction. Over all rounds flown, subjects inthe Closed Loop treatment gained a cumulative informationvalue of 651.84, on average. This represents a 27.83% surpluscompared to the average information value gained in theOpen Loop treatment. Similarly, a higher drone crash rate ofnearly 70% was observed in the Open Loop group. These twodimensions generally interact, since the information value isfixed, once a drone crashes. Averages of rounds flown andaccumulated information value as well as average earningsand crash rates for each treatment are displayed in Table I.

9
TABLE IIAVERAGE SHARES OF OVERCONFIDENT, UNDERCONFIDENT AND OPTIMAL
DECISIONS. STANDARD DEVIATIONS ARE PRESENTED IN PARENTHESIS.
Closed Loop Open LoopOverconfidence 0.4410 0.4167
degree (.3628) (.3497)Underconfidence 0.3091 0.3833
degree (.3099) (.3309)Optimizing 0.2521 0.200
degree (.2581) (.2388)
As could be expected from control theoretic results [19],the Closed Loop system is clearly observed to be moreeffective than the Open Loop piloting system, with regardsto accumulating information about traffic conditions in ourframework. Considerably more information value was aggre-gated with a closed loop of immediate outcome feedbackbeing implemented, which also translates to a higher monetarypayoff for the subjects. However, subjects displayed behavioralbiases as we will see. Indeed, the average number of roundsin the Closed Loop treatment being nearly six already hintsthat several subjects tended to fly beyond the heuristicallyoptimal number of rounds. In doing so, they would havetaken inefficiently high risks, since marginal losses exceededmarginal gains in later rounds of each junctions. For instance,instead of aiming to add five or ten more units of informationvalue when already sitting at 70, subjects should stop andcontinue with the next traffic junction to obtain twenty-fiveunits of information value with certainty at the same crashrisk.
A. Overconfidence and underconfidence
To determine whether a subject acts overconfidently, opti-mally or even underconfidently at a certain traffic junction,the number of rounds flown is compared to the heuristicsdiscussed before, see (6). If the subject flew beyond theheuristically optimal number of rounds, the decision at thisjunction is noted as overconfident. If the subject decides tofly less rounds than optimal the junction’s decision indicatesunderconfidence. In case the heuristic is met the subject actsoptimizing.
As mentioned before, flying until the fourth node is reached(associated with an information value of 70) is a suitableheuristic for a risk neutral decision maker. This inducesdifferent strategies for the treatments. In the closed loopsystem, it is optimal for the subjects to fly as many roundsas necessary to reach the fourth node. The actual number ofrounds needed depends on the sequence of increases and non-increases experienced, as illustrated in Fig. 3. In the open loopsystem, meanwhile, flying five rounds is a suitable heuristic.As subjects have to decide on the number of rounds to fly forall traffic junctions in advance, this strategy applies to all ofthem, as explained before.
An indicator for overconfidence on the subject-level is cre-ated by calculating the quotient of the number of overconfidentjunctions and the total number of junctions per subject, since
Fig. 4. Average shares of overconfident, underconfident and optimal decisions
the number of traffic junctions played differed between sub-jects due to some drones crashing prematurely. This relativefrequency of overconfident junctions by a subject will belabeled “overconfidence degree”. Degrees of underconfidenceand optimizing behavior are computed analogously, so all threedegrees add up to 1. The average degrees of each of thesebehavioral tendencies are displayed in Table II.
The average overconfidence degree of 0.44 in the closedloop system means that subjects, on average, decided over-confidently for 44% of the traffic junctions. Comparatively,overconfidence degrees do barely differ between the twotreatments with subjects deciding overconfidently for over42% of the junctions. The average underconfidence degree washigher in the Open Loop treatment. Degrees of overconfidenceand underconfidence are relatively close to each other for theopen loop, while overconfidence characterizes the predomi-nating behavioral tendency in the closed loop system. Theoptimization degree drops off in both treatments, with subjectsonly deciding optimally at one fourth and one fifth of thejunctions respectively. This gap also becomes apparent in thegraphic illustration of the average degrees of overconfidence,underconfidence and optimization displayed in Fig. 4. Degreesof overconfidence did not differ significantly by gender ineither treatment.
Seven subjects in the Closed Loop and eight subjects inthe Open Loop group behaved overconfidently in every singlephase they flew in, resulting in the maximum overconfidencedegree of 1. On the other side, only three subjects in theclosed loop system and two in the open loop system decidedoptimally for every junction, while three subjects in eachtreatment acted underconfidently at every junction. Amongthose junctions in which subjects act overconfidently, theyflew, on average, 2.88 (SD = 1.36) more rounds after reachingthe optimal node in the Closed Loop treatment. In the OpenLoop group, subjects flew on average 1.88 (SD = 0.85)rounds beyond the optimum respectively. It appears that thosesubjects, who decide to fly more rounds than optimal, they doit clearly, i.e., usually by more than one round. Also, subjectsexceed the optimal number of rounds by, on average, onemore round in the closed loop compared to the open loop

10
TABLE IIICATEGORIZATION OF DECISION BEHAVIOR BY TREATMENT. RELATIVE
SHARES REFERRING TO EACH TREATMENT ARE PRESENTED IN
PARENTHESIS.
Closed Loop Open Loop TotalOptimal 3 2 5
(5.36%) (4.26%) (4.85%)Rather 5 6 10
overconfident (8.93%) (12.77%) (10.68%)Strongly 24 16 40
overconfident (42.86%) (34.04%) (38.83%)Rather 8 5 13
underconfident (14.29%) (10.64%) (12.62%)Strongly 13 16 29
underconfident (23.21%) (34.04%) (28.16%)Mixed 3 2 5
(5.36%) (4.26%) (4.85%)Total 56 47 103
(100%) (100%) (100%)
system once they fly beyond the optimum. The differenceis statistically significant in a Mann-Whitney U-Test (Z =7.393, p = 0.000) and match the observation of subjects inthe Closed Loop treatment flying more rounds overall andaccruing more information value in total.
To gain a more precise impression about the distributionof subjects deviations from optimal behavior within eachtreatment, we classify all subjects into broad categories. Sub-jects that act in accordance with the strategy of flying untilreaching the fourth node at all traffic junctions are classifiedas optimizing. A subject whose overconfidence degree exceedsone third up to 0.5 is classified as rather overconfident. Once asubject flies beyond the optimal number of rounds in more thanhalf of the junctions (i.e., displaying an overconfidence degreeover 0.5), this subject is considered strongly overconfident.Analogously, the categories rather underconfident and stronglyunderconfident are defined using the same thresholds in termsof underconfidence degrees as the ones for overconfidence.The sixth category, mixed, defines scenarios, in which subjectsshow overconfident or underconfident behavior in at leastone junction but in less than one third of all junctions theyplayed (equaling overconfidence or underconfidence degreesbetween 0 and 0.333). Since these subjects act optimizing insome junctions but not in all, their behavior still contradictsthe notion of a strictly optimizing agent, although no cleardominant decision-pattern can be assigned to this behavior.The distribution of subjects into these categories by treatmentis displayed in Table III.||
According to Table III, only few subjects in each treatmentact optimally throughout. Rather, individual behavior deviatesfrom the optimal number of rounds in both directions. Ap-proximately half of the subjects in both groups (Closed Loop:51.79%, Open Loop: 46.81%) can be considered rather over-confident or strongly overconfident. Additionally, large sharesof rather underconfident or strongly underconfident individuals
||Two subjects from the Closed Loop treatment were excluded, becausethey crashed in the very first round at the first traffic junction, wherefore nostatement on their decision making behavior can be made.
(Closed Loop: 37.50%, Open Loop: 44.68%) are observed aswell. From the assumptions of MDPs and standard economictheory follow notions of individuals as rationally optimizingdecision makers that leave no room for overconfident orunderconfident behavior. Consequently, our empirical resultsdo not meet these theoretical propositions. In fact, according toa Binomial Test of the data for the Closed Loop treatment theprobability of observing 29 overconfident (rather or stronglyoverconfident) subjects out of a sample of 56 is virtuallyzero (p < 0.000001), given the assumption of optimizingbehavior. The same result is obtained for overconfidence inthe open loop systems. Consequently, we can fully supportH1, indicating a strong general tendency of individuals toact overconfidently in CPHSs, regardless of whether receivingimmediate outcome feedback or not. While not part of thehypothesis, we also observe the equivalent results for under-confident behavior in both treatments.
B. Hot Hand Fallacy
In contrast to an open loop, only a closed loop system pro-vides the threat of sequences of immediate outcome feedbackluring subjects into a hot hand fallacy. In our experiment, asubject in the Closed Loop treatment is defined to have a“hot hand” once it reaches the optimal node through obtainingthree increases in information value in a row even though thefirst increase was certain. This corresponds to the commonperception of three repeated outcomes as a streak [90]. In thiscase, an optimizing subject would stop flying when followingthe one-stage optimal strategy, since three increases are nec-essary to reach the optimum and flying beyond the optimumyields a negative marginal gain. The outcome of prior roundsshould have no relevance for the subject’s decision, since therounds outcomes are independent from each other. If a subjectdecides to continue flying though, it violates the heuristicallyoptimal decision rule, falling victim to the hot hand fallacy.Overall, at 84 junctions the respective subject experiencedthree continuous increases in information. In 70 out of these84 cases (83.33%), subjects decided to fly at least one moreround thereby falling victim to the hot hand fallacy. This shareof hot hand fallacies among situations that pose the threat offalling victim to it is highly statistically significant: Underthe assumption of subjects being optimizing Markov decisionmakers, the probability of such a high proportion disobeyingthe optimal strategy is practically zero (Binomial Test: Pr(allsubjects act optimally ∣ 83.33% of the hot hand situationsresult in the hot hand fallacy): p < 0.0000001). Comparingnon-overconfident and overconfident decision making betweenjunctions with and without a hot hand in Table IV, we observethose subjects who experience a hot hand situation (70 outof 84, 83.33%) to have a significantly higher chance to actoverconfidently at that junction, compared to those subjectswho do not reach the optimum through three consecutive gainsin information value (123 out of 260, 47.31%). Running a Chi-Squared Test to test the hypothesis statistically, we obtain ahighly significant relationship between hot hand situations andsubsequent overconfident behavior, i.e., the hot hand fallacy,

11
TABLE IVHOT HAND FALLACY - CHI-SQUARED TABLE. THE TEST CAPTURES EVERY
INSTANCE IN WHICH A SUBJECT STARTED FLYING AT ANY TRAFFIC
JUNCTION IN THE CLOSED LOOP TREATMENT.
Not overconfident Overconfident TotalNo hot hand 137 123 260
Hot hand 14 70 84Total 151 193 344
TABLE VDISTRIBUTION OF RISK CATEGORIES BY TREATMENT. PERCENTAGE
VALUES IN PARENTHESIS DISPLAY RELATIVE FREQUENCIES OF RISK
PREFERENCES IN THE RESPECTIVE TREATMENT.
Closed Loop Open Loop TotalRisk averse 36 33 69
(63.16%) (68.75%) (65.71%)Risk neutral 6 5 11
(10.53%) (10.42%) (10.48%)Risk seeking 6 4 10
(10.53%) (8.33%) (9.52%)Not identifiable 9 6 15
(15.79%) (12.50%) (14.29%)Total 57 48 105
(100%) (100%) (100%)
with an error probability p of virtually zero (χ2(df = 1) ∶33.46, p = 0.000). Consequently, H2 is strongly supported.
C. Risk Preferences
Subjects’ individual risk preferences are broadly classifiedto be risk neutral, risk averse or risk seeking, see [89] andSidebar “Risk Preferences”. Given that the presented strategyis based on the assumption of a risk neutral decision maker,the observed distribution of risk preferences in each treatmentis displayed in Table V.** Consistent with the literature, theclear majority of around two thirds of the subjects in bothtreatments displays risk aversion. Overall, the distribution ofrisk preferences appears very similar between the treatments,with the relative shares of each risk attitude varying onlyslightly between the groups. This impression is supportedby a two-sided Kolmogorov-Smirnov test, in which the nullhypothesis that the risk preference distribution in the twotreatments is not statistically different from each other cannotbe rejected (D = 0.030, p > 0.1). Also, degrees of over-confidence and underconfidence did not differ significantlyin between-treatment comparisons for each risk attitude usingMann-Whitney U-tests.
Further, we did not observe risk seeking subjects to dis-play significantly more overconfident behavior (Open Loop:∅ = 0.5257, Closed Loop: ∅ = 0.175) than risk neutral(Open Loop: ∅ = 0.4333, Closed Loop: ∅ = 0.700) or riskaverse (Open Loop: ∅ = 0.4140, Closed Loop: ∅ = 0.3818)individuals in either treatment (Kruskal-Wallis equality ofpopulations tests, Closed: H = 0.450, p = 0.7984, Open:
**Risk preferences of fifteen subjects in total could not be determined,since their choices switched between Option A and Option B three times ormore.
H = 5.437, p = 0.0660)††. On the other hand, in the closed loopsystem, we find risk averse subjects to be significantly moreunderconfident, compared to the risk neutral and risk seekingsubjects (∅ underconfidence degree: 0.3480(SD = 0.3018),Kruskal-Wallis equality of populations test: H = 8.891, p =0.0117), while no effect was found in the open loop system.
Beside overconfidence, risk seeking preferences could intheory present an alternative explanation for drone pilotsflying beyond the optimal number of rounds, with subjectsprimarily aiming to achieve a large information value whilejust hoping for their drones not to crash. However, we do notfind substantial differences in overconfidence conditional onrisk attitude between treatments and overall mainly observeindividuals who can be classified as risk averse. This wouldtheoretically predict subjects to decide rather conservativelythrough settling for a lower number of rounds in order toremain in the game and to protect the drone from crashing,even at the cost of missing out higher payments from infor-mation value gains. Since the experimental results display alarge share of subjects flying beyond the optimum, the casefor individual overconfidence as the dominant explanation forinefficient drone piloting beyond the optimum is strengthened.Consequently, we conclude risk preferences to not beingable to explain overconfident behavior although it appears toexplain the observed degrees of underconfidence).
VI. DISCUSSION AND CONCLUSION
Our experimental drone framework allows to observe howindividuals behave when faced with the task of piloting anUAV under risk and uncertainty, paralleling a real-worlddecision-problem. Even though a closed feedback loop wasidentified to be the more successful system compared to openloop operation, we still observed inefficient drone pilotingfrom the vast majority of subjects. Individuals expressedboth overconfident and underconfident behavioral tendencies,regardless of receiving immediate outcome feedback. Specif-ically, our results indicate that immediate outcome feedback,that is originally intended to support optimal decision making,can turn out to be rather counterproductive in this regard. Over-confident decisions and consequently inefficient drone pilotingcan be facilitated by the hot hand fallacy as a misinterpretationof random sequences of immediate feedback on positiveoutcomes, since subjects fail to realize such sequences to becaused by chance and therefore being history independent. Infact, a handful of subjects in the closed loop treatment stated inthe questionnaire that their decision strategy was to fly as longas they achieved steady increases in information value, tryingto exploit an apparent hot hand. The fact that the possibilityfor this fallacy is only given in a closed loop system, presentsan obvious weakness that should be considered in designingsuch feedback policies.
In general, the current work exposes the human as an underobserved source of errors in human-in-the-loop control sys-tems. We thus advise researchers and practitioners to carefully
††Note that statistical tests on risk preferences have to be interpreted withcaution, since the sample size of risk neutral and risk seeking individuals isextremely low.

12
account for the behavioral component in the control of cyber-physical systems and the potential problems that arise from it,besides mathematical model optimization only. In particular,our findings illustrate the impact of behavioral biases regardingeffects of immediate feedback and the (miss-)understanding ofhistory independence in chance processes.
While more information is commonly regarded to result inbetter decisions in cyber-physical systems, human susceptibil-ity for perceptual biases in response to high information supplyhas to be taken into account. Therefore, identifying an optimalquantity and frequency of feedback remains a goal for futureresearch. We expect a carefully crafted intermittent feedbackto be better suited for this purpose and stress the need foran intelligent feedback design that adapts to an individual’srationality in order provide suitable amount of information.
Generally, considering the effect of humans in control loopsmore seriously presents an important issue for research andpractice. Overall, humans were shown to mostly not actoptimizing in the given decision-problem in our experimentalframework, which strongly puts the Markov decision makeras an adequate characterization of human decision makingin question. Models of human decision processes should berevisited to account for limits of cognitive capacities andbehavioral biases that result from them, in order to notjeopardize technological accomplishments through erroneoushuman decisions. Otherwise, individuals in human-in-the-loopcontrol might take unnecessarily high risk and render thought-fully designed policies inefficient, as seen for highly frequentfeedback in the case of the hot hand fallacy.
Lastly, our study further provides a methodological con-tribution to research on CPHSs, making a first approach toincorporate insights from behavioral economics into controlengineering. Further it introduces incentivized economic ex-periments as a viable option to reveal how individuals actuallybehave, in contrast to how they are theoretically prescribed tobehave. We present an experimental UAV framework featuringa sequential decision-problem, with a focus on behavioralbiases in relation to feedback policies. Future experimentalresearch in this area may intensify efforts of incorporatingvarious other behavioral phenomena and stylized facts intocontrol engineering by building upon this framework, in orderto design or test behavioral interventions that are able toproactively counteract them.
REFERENCES
[1] A. Vempaty, B. Kailkhura, and P. K. Varshney, “Human-machineinference networks for smart decision making: Opportunities and chal-lenges,” in IEEE Int. Conf. Acoust. Speech Signal Process. (ICASSP),pp. 6961–6965, 2018.
[2] S. Narayanan and P. G. Georgiou, “Behavioral signal processing:Deriving human behavioral informatics from speech and language,”Proceedings of the IEEE, vol. 101, no. 5, pp. 1203–1233, 2013.
[3] G. Schirner, D. Erdogmus, K. Chowdhury, and T. Padir, “The future ofhuman-in-the-loop cyber-physical systems,” Computer, vol. 46, no. 1,pp. 36–45, 2013.
[4] M. Tanelli, R. Toledo-Moreo, and L. M. Stanley, “Guest editorial:Holistic approaches for human–vehicle systems: Combining models,interactions, and control,” IEEE Trans. Human-Machine Systems,vol. 47, no. 5, pp. 609–613, 2017.
[5] F. Dressler, “Cyber physical social systems: Towards deeply integratedhybridized systems,” in Intern. Conf. Computing, Networking andCommunications, 2018.
[6] A. Kolling, P. Walker, N. Chakraborty, K. Sycara, and M. Lewis,“Human interaction with robot swarms: A survey,” IEEE Transactionson Human-Machine Systems, vol. 46, no. 1, pp. 9–26, 2016.
[7] S. N. Young and J. M. Peschel, “Review of human–machine inter-faces for small unmanned systems with robotic manipulators,” IEEETransactions on Human-Machine Systems, vol. 50, no. 2, pp. 131–143,2020.
[8] P. F. Hokayem and M. W. Spong, “Bilateral teleoperation: An historicalsurvey,” Automatica, vol. 42, no. 12, 2006.
[9] P. J. van Overloop, J. M. Maestre, A. D. Sadowska, E. F. Camacho,and B. de Schutter, “Human-in-the-loop model predictive control of anirrigation canal,” IEEE Control Systems Magazine, vol. 35, pp. 19–29,Aug. 2015.
[10] Z. Ercan, A. Carvalho, M. Gokasan, and F. Borelli, “Modeling, identi-fication, and predictive control of a driver steering assistance system,”IEEE Trans. Human-Machine Systems, vol. 47, no. 5, pp. 700–710,2017.
[11] M. Inoue and V. Gupta, “Weak control for human-in-the-loop systems,”IEEE Control Syst. Lett., vol. 3, no. 2, pp. 440–445, 2019.
[12] C.-P. Lam and S. S. Sastry, “A POMDP framework for human-in-the-loop system,” in Proc. IEEE Conference on Decision and Control,pp. 6031–6036, 2014.
[13] L. Feng, C. Wiltsche, L. Humphrey, and U. Topcu, “Synthesis ofhuman-in-the-loop control protocols for autonomous systems,” IEEETransactions on Automation Science and Engineering, vol. 13, pp. 450–462, Apr. 2016.
[14] M. L. Puterman, Markov Decision Processes. Hoboken, N.J.: Wiley-Interscience, 1994.
[15] B. M. Albaba and Y. Yildiz, “Modeling cyber-physical human systemsvia an interplay between reinforcement learning and game theory,”Annual Reviews in Control, vol. 48, no. 1–19, 2019.
[16] C. F. Camerer, T.-H. Ho, and J.-K. Chong, “A cognitive hierarchymodel of games,” The Quarterly Journal of Economics, vol. 119, no. 3,2004.
[17] P. S. Schaefer, C. C. Williams, A. S. Goodie, and W. K. Campbell,“Overconfidence and the big five,” Journal of Economic Research inPersonality, vol. 38, pp. 473–480, 2004.
[18] T. Gilovich, R. Vallone, and A. Tversky, “The hot hand in basketball:On the misperception of random sequences,” Cognitive Psychology,vol. 17, pp. 295–314, July 1985.
[19] Y. Bar-Shalom and E. Tse, “Dual effect, certainty equivalence, andseparation in stochastic control,” IEEE Transactions on AutomaticControl, vol. 19, pp. 494– 500, Oct. 1974.
[20] D. P. Bertsekas, Dynamic Programming and Optimal Control, Vol.1.Belmont, MA: Athena Scientific, 2005.
[21] D. Kahneman, “Maps of bounded rationality: Psychology for behav-ioral economics,” The American Economic Review, vol. 93, pp. 1449–1475, Dec. 2003.
[22] C. F. Camerer and C. Loewenstein, “Behavioral economics: Past,present, future,” in Advances in Behavioral Economics (C. F. Camerer,G. Loewenstein, and M. Rabin, eds.), pp. 3–52, Princeton, NJ: Prince-ton University Press, 2003.
[23] D. Ariely, Predictably Irrational: The Hidden Forces that Shape OurDecisions. HarperCollins Publishers, 2009.
[24] D. Kahneman and A. Tversky, “On the psychology of prediction,”Psychological Review, vol. 80, no. 4, pp. 237–251, 1973.
[25] A. Tversky and D. Kahneman, “Judgment under uncertainty: Heuristicsand biases,” Science, vol. 185, pp. 1124–1131, Sept. 1974.
[26] P. M. Todd and G. Gigerenzer, “Bounding rationality to the world,”Journal of Economic Psychology, vol. 24, pp. 143–165, Apr. 2003.IZA Discussion Paper No. 7383.
[27] S. Lichtenstein and B. Fischhoff, “Do those who know more alsoknow more about how much they know?,” Organizational Behaviorand Human Performance, vol. 20, pp. 159–183, Dec. 1977.
[28] B. M. Barber and T. Odean, “Boys will be boys: Gender, overcon-fidence, and common stock investment,” The Quarterly Journal ofEconomics, vol. 116, no. 1, pp. 261–292, 2001.
[29] W. F. M. DeBondt and H. Thaler, R., “Financial decision-makingin markets and firms: A behavioural perspective,” in Handbook ofOperations Research and Management Science (A. R. Jarrow, V. Mak-simovic, and W. T. Ziemba, eds.), vol. 9, pp. 385–410, Amsterdam:Elsevier-North Holland, 1995.
[30] N. D. Weinstein, “Unrealistic optimism about future life events,”Journal of Personality and Social Psychology, vol. 39, pp. 806–820,Nov. 1980.
[31] O. Svenson, “Are we all less risky and more skillful than our fellowdrivers?,” Acta Psychologica, vol. 47, pp. 143–148, Feb. 1981.

13
[32] E. Hoelzl and A. Rustichini, “Overconfident: Do you put your moneyon it?,” The Economic Journal, vol. 115, no. 503, pp. 305–318, 2005.
[33] D. A. Moore and P. J. Healy, “The trouble with overconfidece,”Psychological Review, vol. 115, no. 2, pp. 502–517, 2008.
[34] J. R. Radzevick and D. A. Moore, “Competing to be certain (butwrong): Market dynamics and excessive confidence in judgment,”Management Science, vol. 57, pp. 93–106, Jan. 2011.
[35] W. van Hippel and R. Trivers, “The evolution and psychology of self-deception,” Behavioral and Brain Sciences, vol. 34, no. 1, pp. 1 –56,2011.
[36] D. A. Moore and D. Schatz, “The three faces of overconfidence,” Socialand Personality Psychology Compass, vol. 11, no. 8, pp. 1–12, 2017.
[37] G. Mayraz, “Wishful thinking,” CEP Discussion Papers, 2011.[38] I. Ben-David, J. R. Graham, and C. R. Harvey, “Managerial miscalibra-
tion,” The Quarterly Journal of Economics, vol. 128, no. 4, pp. 1547–1584, 2013.
[39] P. Sedlmeier and G. Gigerenzer, “Teaching bayesian reasoning in lessthan two hours,” Journal of Experimental Psychology, vol. 130, no. 3,pp. 380–400, 2001.
[40] D. Kahneman and A. Tversky, “Prospect theory: An analysis ofdecision under risk,” Econometrica, vol. 47, no. 2, pp. 263–292, 1979.
[41] P. Slovic, B. Fischhoff, and S. Lichtenstein, “Why study risk percep-tion?,” Risk Analysis, vol. 2, no. 2, pp. 83–93, 1982.
[42] K. Abbink, B. Irlenbusch, and E. Renner, “An experimental briberygame,” The Journal of Law, Economics and Organization, vol. 18, no. 2,pp. 428–454, 2002.
[43] E. U. Weber, “Experience-based and description-based perceptions oflong-term risk: Why global warming does not scare us (yet),” ClimateChange, vol. 77, no. 1-2, pp. 103–120, 2006.
[44] P. Slovic, B. Fischhoff, and S. Lichtenstein, “Accident probabilitiesand seat belt usage: A psychological perspective,” Accident Analysis& Prevention, vol. 10, no. 4, pp. 281–285, 1978.
[45] A. Sandroni and F. Squintani, “Overconfidence and asymmetric in-formation: The case of insurance,” Journal of Economic Behavior &Organization, vol. 93, pp. 149–165, Sept. 2013.
[46] S. Benartzi, “Excessive extrapolation and the allocation of 401(k)accounts to company stock,” The Journal of Finance, vol. 56, pp. 1747–1764, Oct. 2001.
[47] C. Camerer and D. Lovallo, “Overconfidence and excess entry: Anexperimental approach,” The American Economic Review, vol. 89,pp. 306–318, Mar. 1999.
[48] A. M. Goel and A. V. Thakor, “Overconfidence, ceo selection, and cor-porate governance,” The Journal of Finance, vol. 63, no. 6, pp. 2737–2784, 2008.
[49] U. Malmendier and G. Tate, “Ceo overconfidence and corporate invest-ment,” The Journal of Finance, vol. 60, pp. 2661–2700, Dec. 2005.
[50] T. Odean, “Do investors trade too much?,” The American EconomicReview, vol. 89, pp. 1279–1298, Dec. 1999.
[51] B. M. Barber and T. Odean, “Trading is hazardous to your wealth:The common stock investment performance of individual investors,”The Journal of Finance, vol. 55, pp. 773–806, Apr. 2000.
[52] I. Trinugroho and R. Sembel, “Overconfidence and excessive tradingbehavior: An experimental study,” International Journal of Businessand Management, vol. 6, pp. 147–152, July 2011.
[53] I. Frieze and B. Weiner, “Cue utilization and attributional judgmentsfor success and failure,” Journal of Personality, vol. 39, no. 4, pp. 591–605, 1971.
[54] E. J. Langer, “The illusion of control,” Journal of Personality and SocialPsychology, vol. 32, no. 2, pp. 311–328, 1975.
[55] T. J. Johnson, R. Feigenbaum, and M. Weiby, “Some determinantsand consequences of the teacher’s perception of causation,” Journal ofEducational Psychology, vol. 55, no. 5, pp. 237–246, 1964.
[56] M. T. Billett and Y. Qian, “Are overconfident ceos born or made?evidence of self-attribution bias from frequent acquirers,” ManagementScience, vol. 54, pp. 1037–1051, Apr. 2008.
[57] S. Gervais and T. Odean, “Learning to be overconfident,” The Reviewof Financial Studies, vol. 14, no. 1, pp. 1–27, 2001.
[58] G. Hilary and L. Menzly, “Does past success lead analysts to becomeoverconfident?,” Management Science, vol. 52, pp. 489–500, Apr.2006.
[59] K. Daniel and D. Hirshleifer, “Overconfident and investors, predictablereturns, and excessive trading,” Journal of Economic Perspectives,vol. 29, no. 4, pp. 61–88, 2015.
[60] G. Torngren and H. Montgomery, “Worse than chance? performanceand confidence among professionals and laypeople in the stock market,”The Journal of Behavioral Finance, vol. 5, no. 3, pp. 148–153, 2004.
[61] P. K. Presson and V. A. Benassi, “Illusion of control: A meta-analyticreview,” Journal of Social Behavior and Personality, vol. 11, pp. 493–510, Jan. 1996.
[62] M. van Otterlo and M. Wiering, “Reinforcement learning and markovdecision processes,” in Reinforcement Learning (M. Wiering andM. van Otterlo, eds.), vol. 12, ch. 1, pp. 3–42, Berlin: Springer, 2012.
[63] G. Kasneci, J. Van Gael, R. Herbrich, and T. Graepel, “Bayesianknowledge corroboration with logical rules and user feedback,” inMachine Learning and Knowledge Discovery in Databases. ECMLPKDD 2010. (B. J.L., B. F., G. A., and S. M., eds.), pp. 1–18, 2010.
[64] D. P. Bertsekas, Reinforcement Learning and Optimal Control. Bel-mont, MA: Athena Scientific, 2019.
[65] C. Camerer, “Behavioral economics: Reunifying psychology and eco-nomics,” Proceedings of the National Academy of Sciences USA,vol. 96, pp. 10575–10577, Sept. 1999.
[66] G. Charness and D. Levin, “When optimal choices feel wrong: Alaboratory study of bayesian updating, complexity and affect,” TheAmerican Economic Review, vol. 95, pp. 1300–1309, Sept. 2005.
[67] D. N. Kleinmuntz, “Cognitive heuristics and feedback in a dynamicdecision environment,” Management Science, vol. 31, pp. 680–702,June 1985.
[68] R. M. Hogarth, “Beyond discrete biases: Functional and dysfunctionalaspects of judgmental heuristics,” Psychological Bulletin, vol. 90, no. 2,pp. 197–217, 1981.
[69] I. Larkin and S. Leider, “Does commitment or feedback influencemyopic loss aversion? an experimental analysis,” American EconomicJournal: Microeconomics, vol. 4, no. 2, pp. 184–214, 2012.
[70] C. I. Tsai, J. Klayman, and R. Hastie, “Effects of amount of informationon judgment accuracy and confidence,” Organizational Behavior andHuman Decision Processes, vol. 107, pp. 97–105, Nov. 2008.
[71] G. Chen, C. Crossland, and S. Luo, “Making the same mistake allover again: Ceo overconfidence and corporate resistance to correctivefeedback,” Strategic Management Journal, vol. 36, pp. 1513–1535, Oct.2015.
[72] A. L. Zacharakis and D. A. Shepherd, “The nature of informationand overconfidence on venture capitalists’ decision making,” Journalof Business Venturing, vol. 16, pp. 311–332, July 2001.
[73] V. Subbotin, “Outcome feedback effects on under- and overconfidentjudgments (general knowledge tasks),” Organizational Behavior andHuman Decision Processes, vol. 66, pp. 268–276, June 1996.
[74] C. F. Camerer, “Does the basketball market believe in the ’hot hand’?,”The American Economic Review, vol. 79, pp. 1257–1261, Dec. 1989.
[75] W. O. Brown and R. D. Sauer, “Does the basketball market believein the hot hand? comment,” The American Economic Review, vol. 83,pp. 1377–1386, Dec. 1993.
[76] A. W. Chau and J. G. Phillips, “Effects of perceived control uponwagering and attributions in computer blackjack,” The Journal ofGeneral Psychology, vol. 122, no. 3, pp. 253–269, 1995.
[77] U. Malmendier and S. Nagel, “Depression babies: Do macroeconomicexperiences affect risk taking?,” The Quarterly Journal of Economics,vol. 126, pp. 373–416, Feb. 2011.
[78] P. Ayton and I. Fischer, “The hot hand fallacy and the gambler’s fallacy:Two faces of subjective randomness?,” Memory & Cognition, vol. 32,no. 8, pp. 1369–1378, 2004.
[79] M. Rabin and D. Vayanos, “The gamblers and hot-hand fallacies:Theory and applications,” Review of Economic Studies, vol. 77, no. 2,pp. 730–778, 2009.
[80] J. B. Miller and A. Sanjurjo, “Surprised by the hot hand fallacy? a truthin the law of small numbers,” Econometrica, vol. 86, no. 6, pp. 2019–2047, 2018.
[81] J. B. Miller and A. Sanjurjo, “How experience confirms the gamblersfallacy when sample size is neglected,” Working paper, pp. 1–12, Oct.2018.
[82] T. S. Ferguson, “Optimal stopping and applications.” Mathematics De-partment, UCLA, https://www.math.ucla.edu/people/ladder/tom, 2008.
[83] J. von Neumann and O. Morgenstern, Theory of Games and EconomicBehavior. Princeton University Press, 2 ed., 1944.
[84] D. Read, G. Loewenstein, and M. Rabin, “Choice bracketing,” Journalof Risk and Uncertainty, vol. 19, no. 1-3, pp. 171–197, 1999.
[85] D. Hirshleifer, A. Low, and S. H. Teoh, “Are overconfident ceos betterinnovators?,” The Journal of Finance, vol. 67, pp. 1457–1498, Aug.2012.
[86] M. E. Jarvik, “Probability learning and a negative recency effect inthe serial anticipation of alternative symbols,” Journal of ExperimentalPsychology, vol. 41, no. 4, pp. 291–297, 1951.

14
[87] D. L. Chen, M. Schonger, and C. Wickens, “otree - an open-sourceplatform for laboratory, online, and field experiments,” Journal ofBehavioral and Experimental Finance, vol. 9, pp. 88–97, Mar. 2016.
[88] B. Greiner, “Subject pool recruitment procedures: organizing experi-ments with orsee,” Journal of the Economic Science Association, vol. 1,pp. 114–125, May 2015.
[89] T. Dohmen, A. Falk, D. Huffman, and U. Sunde, “Are risk aversion andimpatience related to cognitive ability,” American Economic Review,vol. 100, pp. 1238–1260, June 2010.
[90] K. A. Carlson and S. B. Shu, “The rule of three: How the third eventsignals the emergence of a streak,” Organizational Behavior and HumanDecision Processes, vol. 104, no. 1, pp. 113–121, 2007.
[91] G. E. Bolton and A. Ockenfels, “Behavioral economic engineering,”Journal of Economic Psychology, vol. 33, pp. 665–676, June 2012.
[92] R. H. Thaler and S. Benartzi, “Save more tomorrow: Using behavioraleconomics to increase employee saving,” Journal of Political Economy,vol. 112, no. S1, pp. 164–187, 2004.
[93] A. E. Roth and E. Peranson, “The redesign of the matching market foramerican physicians: Some engineering aspects of economic design,”The American Economic Review, vol. 89, no. 4, pp. 748–780, 1999.
[94] P. A. Samuelson and W. Nordhaus, Principles of Economics. McGraw-Hill, 12 ed., 1985.
[95] A. E. Roth, “Laboratory experimentation in economics: A methodolog-ical overview,” The Economic Journal, vol. 98, pp. 974–1031, Dec.1988.
[96] N. Mazar, O. Amir, and D. Ariely, “The dishonesty of honest people:A theory of self-concept maintenance,” Journal of Marketing Research,vol. 45, no. 6, pp. 633–644, 2008.
[97] D. Ariely, E. Kamenica, and D. Prelec, “Man’s search for meaning:The case of legos,” Journal of Economic Behavior & Organization,vol. 67, pp. 671–677, Sept. 2008.
[98] M. J. Carrington, B. A. Neville, and G. J. Whitwell, “Why ethicalconsumers don’t walk their talk: Towards a framework for understand-ing the gap between the ethical purchase intentions and actual buyingbehaviour of ethically minded consumers,” Journal of Business Ethics,vol. 97, pp. 139–158, Nov. 2010.
[99] A. J. Nederhof, “Methods of coping with social desirability bias:a review,” European Journal of Social Psychology, vol. 15, no. 3,pp. 263–280, 1985.
[100] J. Weimann and J. Brosig-Koch, Einfuhrung in dieexerimentelle Wirtschaftsforschung. Springer Gabler, 2019.https://doi.org/10.1007/978-3-642-32765-0.
[101] G. Charness, “Laboratory experiments: Challenges and promis: Areview of ”theory and experiment: What are the questions?” by vernonsmith,” Journal of Economic Behavior & Organization, vol. 73, no. 1,pp. 21–23, 2010.
[102] J. Pearl, “Causality: Models, reasoning, and inference,” EconometricTheory, vol. 19, pp. 675–682, Aug. 2003.
[103] V. L. Smith, “Experimental economics: Induced value theory,” TheAmerican Economic Review, vol. 66, pp. 274–279, Feb. 1976.
[104] C. A. Holt and S. K. Laury, “Risk aversion and incentive effects,” TheAmerican Economic Review, vol. 92, pp. 1644–1655, Dec. 2002.
[105] J. W. Pratt, “Risk aversion in the small and in the large,” Econometrica,vol. 32, no. 1/2, pp. 122–136, 1964.
[106] H. R. Varian, Intermediate Microeconomics: A Modern Approach. NewYork, NY: W. W. Norton & Company, 8 ed., 2006.
[107] S. C. Jaquette, “A utility criterion for markov decision processes,”Management Science, vol. 23, pp. 43–49, Sept. 1976.
[108] G. W. Harrison, J. A. List, and C. Towe, “Naturally occurring pref-erences and exogenous laboratory experiments: A case study of riskaversion,” Econometrica, vol. 75, pp. 433–458, Mar. 2007.
[109] C. C. Eckel and P. J. Grossman, “Men, women and risk aversion: Ex-perimental evidence,” in Handbook of Experimental Economic Results(C. R. Plott and V. L. Smith, eds.), vol. 1, ch. 113, pp. 1061–1073,Amsterdam: Elsevier B.V., 2008.
[110] G. W. Harrison, M. I. Lau, and E. E. Rutstrom, “Estimating riskattitudes in denmark: A field experiment,” The Scandinavian Journalof Economics, vol. 109, no. 2, pp. 341–368, 2007.
[111] S. J. Kachelmeier and M. Shehata, “Examining risk preferences underhigh monetary incentives: Experimental evidencefrom the people’srepublic of china,” The American Economic Review, vol. 82, pp. 1120–1141, Dec. 1992.
[112] R. A. Howard and J. E. Matheson, “Risk-sensitive markov decisionprocesses,” Management Science, vol. 18, pp. 365–369, Mar. 1972.
[113] A. Majumdar, S. Singh, A. Mandlekar, and M. Pavone, “Risk-sensitiveinverse reinforcement learning via coherent risk models,” ConferencePaper: Robotics: Science and Systems, 2017.
[114] B. M. Djawadi and R. Fahr, “The impact of risk perception andrisk attitudes on corrupt behavior: Evidence from a petty corruptionexperiment,” IZA Discussion Paper No. 7383, 2013.
SIDEBARS
A. Sidebar: Behavioral Economic Engineering
The deviation between theoretically prescribed behavior andactual human decision making is often labeled behavioralmessiness [91] and poses a huge challenge for organiza-tional policy makers. Experiments thereby represent a tool forbridging economic theory and real-world institutional designin order to generate practical value from applied economicscience [91]. The laboratory basically acts as a wind tunnelfor practice in order to test behavioral reactions to institutionalinterventions in a controlled environment, before implement-ing them into the real world. Projects following this approachare summed under the label of behavioral economic engineer-ing [91]. Prominent examples include the implementation ofoptimized retirement savings plans [92] and the redesign ofmatching algorithms for American physicians [93].
B. Sidebar: Experimental research method and Induced ValueTheory
Behavioral economic findings are often based on experimen-tal research, especially controlled laboratory experiments, as“experimental control is exceptionally helpful for distinguish-ing behavioral explanations from standard ones” [22]. Labo-ratory experiments, which had been considered unfeasible foreconomic disciplines and privilege of natural sciences up untilthe late 20th century [94], aim to parallel real-world situationsin laboratory settings, while abstracting from environmentalfactors. This means, experiments isolate certain variables ofinterest from more complex real-world contexts, while simul-taneously controlling for conditions of the subjects’ economicand social environments [95]. Participants, commonly referredto as “subjects”, work on computerized or analogue tasks, likesolving math problems [96] or assembling Lego figures [97],accompanied by anonymously making decisions, which areobserved by the experimenter. Economic theories or conceptsthat the experimenter wants to test usually underlie the deci-sion to make in the experiment often in relation to a giventask. A constituting factor of experiments consists in thembeing incentivized, i.e., the participants are paid for solvingtasks and making decisions by the experimenter, with theconcrete amount of payments depending on the respectiveexperimental design [95]. Subjects know about the paymentsthey are able to receive beforehand, as they receive instructionscontaining the experimental procedure and the payoff functionin the beginning of every experiment. Herein lies the biggestadvantage of experimental economic research: actual humanbehavior can be observed with the subjects actions havingactual monetary consequences for their payoffs in the end,so they have to “put their money where their mouth is”.This is not the case for other research methods used ineconomic or social science like surveys or scenario studies,in which participants only state how they would behave incertain situations, while no information is gained whether they
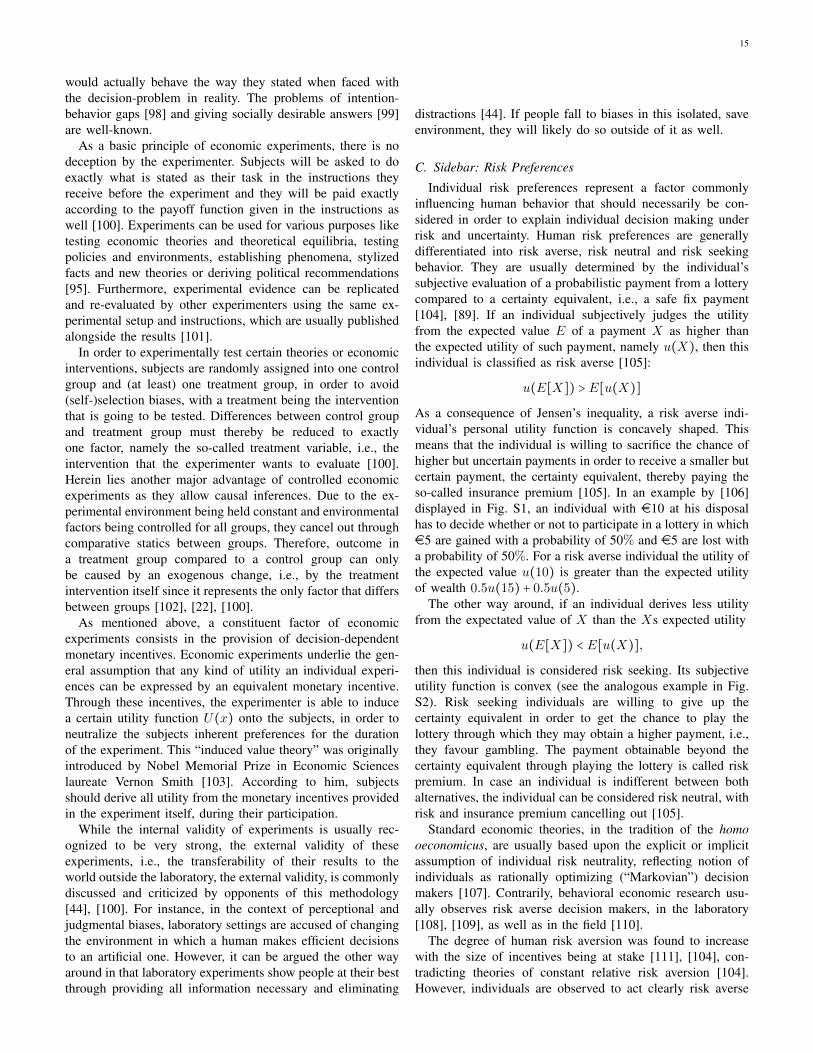
15
would actually behave the way they stated when faced withthe decision-problem in reality. The problems of intention-behavior gaps [98] and giving socially desirable answers [99]are well-known.
As a basic principle of economic experiments, there is nodeception by the experimenter. Subjects will be asked to doexactly what is stated as their task in the instructions theyreceive before the experiment and they will be paid exactlyaccording to the payoff function given in the instructions aswell [100]. Experiments can be used for various purposes liketesting economic theories and theoretical equilibria, testingpolicies and environments, establishing phenomena, stylizedfacts and new theories or deriving political recommendations[95]. Furthermore, experimental evidence can be replicatedand re-evaluated by other experimenters using the same ex-perimental setup and instructions, which are usually publishedalongside the results [101].
In order to experimentally test certain theories or economicinterventions, subjects are randomly assigned into one controlgroup and (at least) one treatment group, in order to avoid(self-)selection biases, with a treatment being the interventionthat is going to be tested. Differences between control groupand treatment group must thereby be reduced to exactlyone factor, namely the so-called treatment variable, i.e., theintervention that the experimenter wants to evaluate [100].Herein lies another major advantage of controlled economicexperiments as they allow causal inferences. Due to the ex-perimental environment being held constant and environmentalfactors being controlled for all groups, they cancel out throughcomparative statics between groups. Therefore, outcome ina treatment group compared to a control group can onlybe caused by an exogenous change, i.e., by the treatmentintervention itself since it represents the only factor that differsbetween groups [102], [22], [100].
As mentioned above, a constituent factor of economicexperiments consists in the provision of decision-dependentmonetary incentives. Economic experiments underlie the gen-eral assumption that any kind of utility an individual experi-ences can be expressed by an equivalent monetary incentive.Through these incentives, the experimenter is able to inducea certain utility function U(x) onto the subjects, in order toneutralize the subjects inherent preferences for the durationof the experiment. This “induced value theory” was originallyintroduced by Nobel Memorial Prize in Economic Scienceslaureate Vernon Smith [103]. According to him, subjectsshould derive all utility from the monetary incentives providedin the experiment itself, during their participation.
While the internal validity of experiments is usually rec-ognized to be very strong, the external validity of theseexperiments, i.e., the transferability of their results to theworld outside the laboratory, the external validity, is commonlydiscussed and criticized by opponents of this methodology[44], [100]. For instance, in the context of perceptional andjudgmental biases, laboratory settings are accused of changingthe environment in which a human makes efficient decisionsto an artificial one. However, it can be argued the other wayaround in that laboratory experiments show people at their bestthrough providing all information necessary and eliminating
distractions [44]. If people fall to biases in this isolated, saveenvironment, they will likely do so outside of it as well.
C. Sidebar: Risk Preferences
Individual risk preferences represent a factor commonlyinfluencing human behavior that should necessarily be con-sidered in order to explain individual decision making underrisk and uncertainty. Human risk preferences are generallydifferentiated into risk averse, risk neutral and risk seekingbehavior. They are usually determined by the individual’ssubjective evaluation of a probabilistic payment from a lotterycompared to a certainty equivalent, i.e., a safe fix payment[104], [89]. If an individual subjectively judges the utilityfrom the expected value E of a payment X as higher thanthe expected utility of such payment, namely u(X), then thisindividual is classified as risk averse [105]:
u(E[X]) > E[u(X)]
As a consequence of Jensen’s inequality, a risk averse indi-vidual’s personal utility function is concavely shaped. Thismeans that the individual is willing to sacrifice the chance ofhigher but uncertain payments in order to receive a smaller butcertain payment, the certainty equivalent, thereby paying theso-called insurance premium [105]. In an example by [106]displayed in Fig. S1, an individual with e10 at his disposalhas to decide whether or not to participate in a lottery in whiche5 are gained with a probability of 50% and e5 are lost witha probability of 50%. For a risk averse individual the utility ofthe expected value u(10) is greater than the expected utilityof wealth 0.5u(15) + 0.5u(5).
The other way around, if an individual derives less utilityfrom the expectated value of X than the Xs expected utility
u(E[X]) < E[u(X)],
then this individual is considered risk seeking. Its subjectiveutility function is convex (see the analogous example in Fig.S2). Risk seeking individuals are willing to give up thecertainty equivalent in order to get the chance to play thelottery through which they may obtain a higher payment, i.e.,they favour gambling. The payment obtainable beyond thecertainty equivalent through playing the lottery is called riskpremium. In case an individual is indifferent between bothalternatives, the individual can be considered risk neutral, withrisk and insurance premium cancelling out [105].
Standard economic theories, in the tradition of the homooeconomicus, are usually based upon the explicit or implicitassumption of individual risk neutrality, reflecting notion ofindividuals as rationally optimizing (“Markovian”) decisionmakers [107]. Contrarily, behavioral economic research usu-ally observes risk averse decision makers, in the laboratory[108], [109], as well as in the field [110].
The degree of human risk aversion was found to increasewith the size of incentives being at stake [111], [104], con-tradicting theories of constant relative risk aversion [104].However, individuals are observed to act clearly risk averse
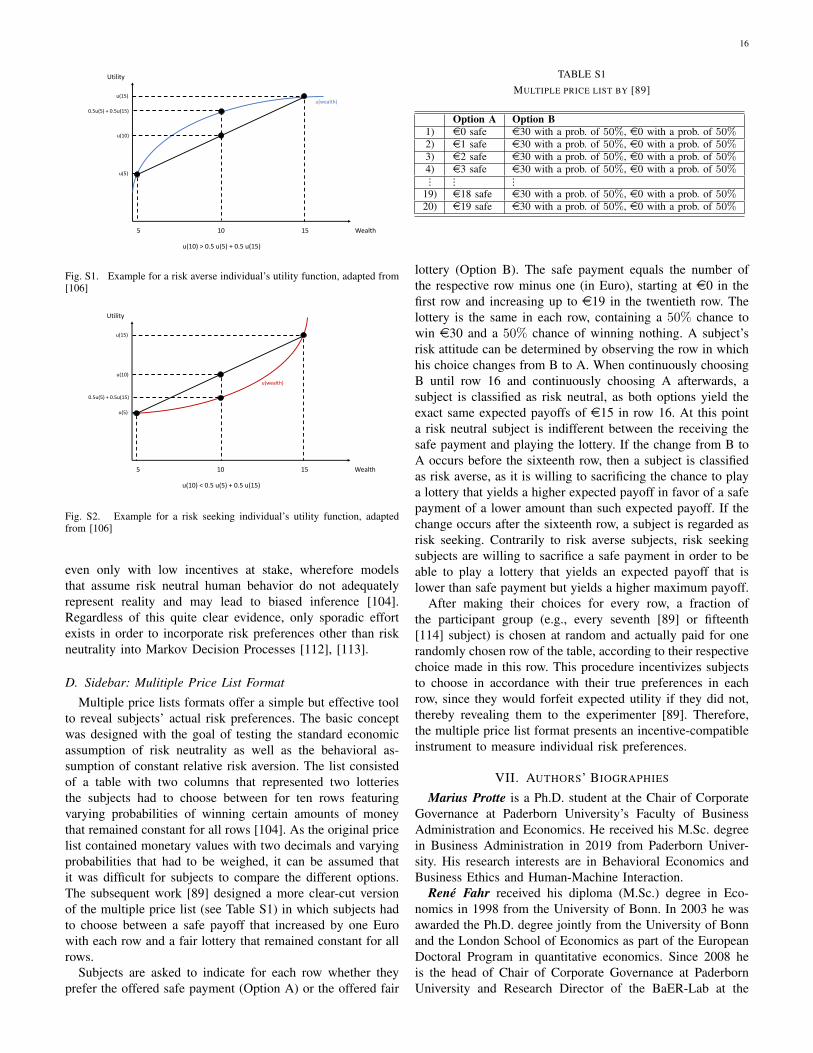
16
Wealth
Utility
u(wealth)
15105
u(5)
u(10)
u(15)
0.5u(5) + 0.5u(15)
u(10) > 0.5 u(5) + 0.5 u(15)
Fig. S1. Example for a risk averse individual’s utility function, adapted from[106]
Wealth
Utility
u(wealth)
15105
u(5)
u(10)
u(15)
0.5u(5) + 0.5u(15)
u(10) < 0.5 u(5) + 0.5 u(15)
Fig. S2. Example for a risk seeking individual’s utility function, adaptedfrom [106]
even only with low incentives at stake, wherefore modelsthat assume risk neutral human behavior do not adequatelyrepresent reality and may lead to biased inference [104].Regardless of this quite clear evidence, only sporadic effortexists in order to incorporate risk preferences other than riskneutrality into Markov Decision Processes [112], [113].
D. Sidebar: Mulitiple Price List Format
Multiple price lists formats offer a simple but effective toolto reveal subjects’ actual risk preferences. The basic conceptwas designed with the goal of testing the standard economicassumption of risk neutrality as well as the behavioral as-sumption of constant relative risk aversion. The list consistedof a table with two columns that represented two lotteriesthe subjects had to choose between for ten rows featuringvarying probabilities of winning certain amounts of moneythat remained constant for all rows [104]. As the original pricelist contained monetary values with two decimals and varyingprobabilities that had to be weighed, it can be assumed thatit was difficult for subjects to compare the different options.The subsequent work [89] designed a more clear-cut versionof the multiple price list (see Table S1) in which subjects hadto choose between a safe payoff that increased by one Eurowith each row and a fair lottery that remained constant for allrows.
Subjects are asked to indicate for each row whether theyprefer the offered safe payment (Option A) or the offered fair
TABLE S1MULTIPLE PRICE LIST BY [89]
Option A Option B1) e0 safe e30 with a prob. of 50%, e0 with a prob. of 50%2) e1 safe e30 with a prob. of 50%, e0 with a prob. of 50%3) e2 safe e30 with a prob. of 50%, e0 with a prob. of 50%4) e3 safe e30 with a prob. of 50%, e0 with a prob. of 50%⋮ ⋮ ⋮
19) e18 safe e30 with a prob. of 50%, e0 with a prob. of 50%20) e19 safe e30 with a prob. of 50%, e0 with a prob. of 50%
lottery (Option B). The safe payment equals the number ofthe respective row minus one (in Euro), starting at e0 in thefirst row and increasing up to e19 in the twentieth row. Thelottery is the same in each row, containing a 50% chance towin e30 and a 50% chance of winning nothing. A subject’srisk attitude can be determined by observing the row in whichhis choice changes from B to A. When continuously choosingB until row 16 and continuously choosing A afterwards, asubject is classified as risk neutral, as both options yield theexact same expected payoffs of e15 in row 16. At this pointa risk neutral subject is indifferent between the receiving thesafe payment and playing the lottery. If the change from B toA occurs before the sixteenth row, then a subject is classifiedas risk averse, as it is willing to sacrificing the chance to playa lottery that yields a higher expected payoff in favor of a safepayment of a lower amount than such expected payoff. If thechange occurs after the sixteenth row, a subject is regarded asrisk seeking. Contrarily to risk averse subjects, risk seekingsubjects are willing to sacrifice a safe payment in order to beable to play a lottery that yields an expected payoff that islower than safe payment but yields a higher maximum payoff.
After making their choices for every row, a fraction ofthe participant group (e.g., every seventh [89] or fifteenth[114] subject) is chosen at random and actually paid for onerandomly chosen row of the table, according to their respectivechoice made in this row. This procedure incentivizes subjectsto choose in accordance with their true preferences in eachrow, since they would forfeit expected utility if they did not,thereby revealing them to the experimenter [89]. Therefore,the multiple price list format presents an incentive-compatibleinstrument to measure individual risk preferences.
VII. AUTHORS’ BIOGRAPHIES
Marius Protte is a Ph.D. student at the Chair of CorporateGovernance at Paderborn University’s Faculty of BusinessAdministration and Economics. He received his M.Sc. degreein Business Administration in 2019 from Paderborn Univer-sity. His research interests are in Behavioral Economics andBusiness Ethics and Human-Machine Interaction.
Rene Fahr received his diploma (M.Sc.) degree in Eco-nomics in 1998 from the University of Bonn. In 2003 he wasawarded the Ph.D. degree jointly from the University of Bonnand the London School of Economics as part of the EuropeanDoctoral Program in quantitative economics. Since 2008 heis the head of Chair of Corporate Governance at PaderbornUniversity and Research Director of the BaER-Lab at the

17
Faculty of Economics and Business Administration. Since2019 he is Vice-President for Technology Transfer and mem-ber of the University’s executive board and since 2020 he ishead of the research group Behavioral Economic Engineeringand Responsible Management at the Heinz Nixdorf Institute(Paderborn University). His doctoral studies were supported byfull scholarships by the German Science Foundation and Ger-man Academic Exchange Service. Since 1998 he was affiliatedwith the IZA in Bonn as a resident research affiliate. From2003 till 2008 he was a post-doctoral researcher in personneleconomics at the University of Cologne. His research interestsare in Behavioral Economics, Behavioral Business Ethics andHuman-Machine Interaction.
Daniel Quevedo is professor of cyberphysical systems inthe School of Electrical Engineering and Robotics, Queens-land University of Technology (QUT), Brisbane, Australia.Before joining QUT, he established and led the Chair inAutomatic Control at Paderborn University, Germany. In 2000,he received Ingeniero Civil Electronico and M.Sc. degreesfrom Universidad Tecnica Federico Santa Marıa, Valparaıso,Chile, and in 2005 the Ph.D. degree from the University ofNewcastle in Australia. He received the IEEE Conferenceon Decision and Control Best Student Paper Award in 2003and was also a finalist in 2002. In 2009 he was awarded afive-year Research Fellowship from the Australian ResearchCouncil. He is co-recipient of the 2018 IEEE Transactionson Automatic Control George S. Axelby Outstanding PaperAward. Prof. Quevedo currently serves as Associate Editor forthe IEEE Control Systems Magazine and in the Editorial Boardof the International Journal of Robust and Nonlinear Control.From 2015–2018 he was Chair of the IEEE Control SystemsSociety Technical Committee on Networks & CommunicationSystems. His research interests are in control of networkedsystems and of power converters.