behavioral characteristics of damaged steel repaired by
TRANSCRIPT

Louisiana State UniversityLSU Digital Commons
LSU Historical Dissertations and Theses Graduate School
1991
Behavioral Characteristics of Damaged SteelRepaired by Heat Straightening.Paul Franklin RobinsonLouisiana State University and Agricultural & Mechanical College
Follow this and additional works at: https://digitalcommons.lsu.edu/gradschool_disstheses
This Dissertation is brought to you for free and open access by the Graduate School at LSU Digital Commons. It has been accepted for inclusion inLSU Historical Dissertations and Theses by an authorized administrator of LSU Digital Commons. For more information, please [email protected].
Recommended CitationRobinson, Paul Franklin, "Behavioral Characteristics of Damaged Steel Repaired by Heat Straightening." (1991). LSU HistoricalDissertations and Theses. 5206.https://digitalcommons.lsu.edu/gradschool_disstheses/5206
INFORMATION TO USERS
This manuscript has been reproduced from the microfilm master. UMI films the text directly from the original or copy submitted. Thus, some thesis and dissertation copies are in typewriter face, while others may be from any type of computer printer.
The quality of this reproduction is dependent upon the quality of the copy submitted. Broken or indistinct print, colored or poor quality illustrations and photographs, print bleedthrough, substandard margins, and improper alignment can adversely affect reproduction.
In the unlikely event that the author did not send UMI a complete manuscript and there are missing pages, these will be noted. Also, if unauthorized copyright material had to be removed, a note will indicate the deletion.
Oversize materials (e.g., maps, drawings, charts) are reproduced by sectioning the original, beginning at the upper left-hand corner and continuing from left to right in equal sections with small overlaps. Each original is also photographed in one exposure and is included in reduced form at the back of the book.
Photographs included in the original manuscript have been reproduced xerographically in this copy. Higher quality 6" x 9" black and white photographic prints are available for any photographs or illustrations appearing in this copy for an additional charge. Contact UMI directly to order.
University Microfilms International A Beil & Howell Information C o m p a n y
3 0 0 North Z e e b R o a d . Ann Arbor. Ml 4 8 1 0 6 - 1 3 4 6 USA 3 1 3 / 7 6 1 - 4 7 0 0 8 0 0 / 5 2 1 - 0 6 0 0


O rd e r N u m b e r 9207528
Behavioral characteristics of dam aged steel repaired by heat straightening
Robinson, Paul Franklin, Ph.D.
The Louisiana State University and Agricultural and Mechanical Col., 1991
Copyright © 1992 by R obinson, Paul Franklin. A ll rights reserved.
UMI300 N. Zeeb Rd.Ann Arbor, MI 48106


BEHAVIORAL CHARACTERISTICS OF DAMAGED STEEL REPAIRED BY HEAT STRAIGHTENING
A Dissertation
Submitted to the Graduate Faculty of the Louisiana State University and
Agricultural and Mechanical College in partial fullfillment of the requirements for the degree of
Doctor of Philosophy
mThe Department of Civil Engineering
byPaul Franklin Robinson
B.S., Louisiana Tech University, 1986 M.S., Louisiana Tech University, 1987
August 1991

ACKNOWLEDGMENTS
This research was performed at Louisiana State University under the supervision of Dr. R. Richard Avent. Acknowledgment is made to Dr. Avent for his time, encouragement, and criticism, all of which were very helpful and full of suspense. I also wish to thank the other members of my committee, Dr. Luis A. deBejar, Dr. Vijaya K. A. Gopu, Dr. Mohammed Alawady, Dr. Warren N. Waggenspack, Jr., and Dr. Ganesar Chanmugan, for their insight on how to improve upon my work. Special thanks are extended to the Louisiana Transportation Research Center, the Federal Highway Administration, and the Louisiana Department of Transportation and Development for their support of this project.
My appreciation also goes to Dr. Leslie K. Guice, the Civil Engineering Department Head at Louisiana Tech University, for encouraging me to attend Louisiana State University. Special thanks go to my parents, Mr. and Mrs. Charles F. Robinson for always providing the right amount of encouragement. Many thanks go to my best friend, Tommy Dedon, for all the fishing trips and three and a half unforgettable years. I would also like to thank Renee Elliot for her timely help with my figures. Most of all,I would like to thank my God, Who still lives and saves us through His Son Jesus.
ii
TABLE OF CONTENTS
EagfiACKNOWLEDGMENTS ........................................ iiLIST OF T A B L E S ........................................ ViLIST OF F I G U R E S ........................................ XA B S T R A C T .............................................. XV iiCHAPTER I: INTRODUCTION ............................ 1
Background on Heat Straightening ................ 2Literature Review ................................. 6Purpose and Objectives ............................ 10Scope of I n v e s t i g a t i o n ............................ 11
CHAPTER II: UNDEFORMED PLATES ..................... 13Test Setup and P r o c e d u r e .......................... 13Residual Stresses ................................... 14Material Properties ................................ 26C o n c l u s i o n s .......................................... 26
CHAPTER III: DEFORMED PLATES ......................... 28Test Setup and P r o c e d u r e .......................... 33Plastic Rotations ................................... 36Statistical study of Plastic Rotations ......... 54Residual Stresses ................................... 57S h o r t e n i n g .......................................... 64Redistribution of Material ....................... 70Material Properties ................................ 72Tensile Properties and Fatigue ................... 80C o n c l u s i o n s .......................................... 83
CHAPTER IV: CHANNELS AND ANGLES ................... 85Undamaged Specimens ................................ 86Geometric Considerations .......................... 87Load Ratio and Stress Considerations ............ 94Out-of-Plane Movement .............................. 103Damaged Specimens ................................... 105Residual Stresses ................................... IllC o n c l u s i o n s .......................................... 122

TABLE OF CONTENTS (Continued)
Page
CHAPTER V: UNDEFORMED WIDE FLANGES BEAMS ......... 124Test S e t u p .......................................... 124Plastic Rotations ................................... 125Residual Stresses ................................... 125C o n c l u s i o n s .......................................... 133
CHAPTER VI: DEFORMED WIDE FLANGE BEAMS ............ 137Weak Axis D a m a g e ................................... 138Plastic Rotations (Category W) ................... 143Comparison of Heats Within a Given Repair Cycle . 144Average Plastic Rotations in Different
Repair Cycles ................................... 149Plastic Rotation Prediction Eqn (Category W) . . 151Statistically Based Predictions for Damage Repair 155Residual Stresses (Category W) .................. 157Material Properties ................................ 164Strong Axis D a m a g e ................................ 171Plastic Rotations (Category S ) ..................... 172Residual Stresses (Category S) .................. 177C o n c l u s i o n s .......................................... 179
CHAPTER VII: CONCLUSIONS ............................ 182Plastic Rotations ................................... 182Residual Stresses ................................... 185Material Properties ................................ 187S h o r t e n i n g .......................................... 188Significance of Results ............................ 189Recommendations for Future Research ............. 190Recommendations for Applying Heat Straightening
in P r a c t i c e ....................................... 191R E F E R E N C E S : ............................................ 194APPENDIX I: RESIDUAL STRESSES (UNDAMAGED PLATES) . 200APPENDIX II: PLASTIC ROTATIONS (DAMAGED PLATES) . 209APPENDIX III: RESIDUAL STRESSES (DAMAGED PLATES) . 214APPENDIX IV: PLATE THICKNESSES (AFTER REPAIR) . . 225APPENDIX V: RESIDUAL STRESSES (UNDAMAGED W F 'S ) . . 229
iv

TABLE OF CONTENTS (Continued)
Page
APPENDIX VI: PLASTIC ROTATIONS (DAMAGED WF'S) . . 238APPENDIX VII: RESIDUAL STRESSES (DAMAGED WF'S) . . 242V I T A .................................................. 255
V

LIST OF TABLES
Table Page
1. Heating parameters for undeformed plates . . . . 162. Experimentally determined residual stresses
in an unheated specimen (Plate U H ) .............. 223. Experimentally determined residual stresses
in undamaged plates: "small" vee angles(20°, 45°, and 60°) 25
4. Experimentally determined residual stressesin undamaged plates: "large" vee angles(82°) 25
5. Heating conditions and angles of damage(damaged plates) ................................... 36
6. summary of plastic rotation data (damagedplates) ............................................ 38
7. Plastic rotations in subsequent heatinggroups . . . ..................................... 40
8. Effect of depth ratio on plastic rotations . . . 529. Comparison of plastic rotation data from
various studies ................................... 5510. Comparison of deBejar's results with modified
e q u a t i o n ............................................ 5711. Experimentally determined residual stresses
in damaged plates: "small" angles of damage(approx. 6°) using assumed value of E =29.000 k s i .......................................... 63
12. Experimentally determined residual stressesin damaged plates: "small" angles of damage(approx. 6°) using measured E values fromtensile tests ..................................... 64
13. Experimentally determined residual stressesin damaged plates: "large" angles of damage(12° to 24°) using assumed value of E =29.000 k s i .......................................... 65
vi

LIST OF TABLES (Continued)
Table Page
14. Experimentally determined residual stresses in damaged plates: "large" angles of damage (12° to 24°) using E values from tensilet e s t s ............................................... 67
15. Shortening of plates as a result of heat straightening ..................................... 68
16. Material properties of damaged plates p e c i m e n s .......................................... 73
17. Moduli of elasticity of damaged plates p e c i m e n s .......................................... 74
18. T-test results (for material property comparisons) ........................................ 76
19. Comparison of material properties in heat- straightened steel with unheated specimensand ASTM standard values (current research) . . 77
20. Comparison of material properties in heat- straightened steel with unheated specimensand ASTM standard values (past research) . . . . 79
21. Plastic rotations for L4x4xl/4 angles .......... 9022. Plastic rotations for C6x8.2 channels .......... 9123. Stresses at Point B (at open end of vee) of a
L4x4xl/4 angle ..................................... 9624. Comparison of out-of-plane plastic rotations
to plastic rotations in the desired directionof m o v e m e n t ...........................................105
25. Damaged angle and channel specimens ............ 10826. Stresses at open end of vee for various load
ratios on angles (stiffening element at veeapex) ..................................................108
27. Comparison of plastic rotations in angles tothe modified plate equation ........................ 110
28. Residual stresses in undamaged angles .......... 115
vii

LIST OF TABLES (Continued)
Table Page
29. Residual stresses in undamaged channel (IX-6 ) 121
30. Residual stresses in damaged angles ............ 12231. Heating conditions for undamaged wide flange
b e a m s ................................................. 12932. Plastic rotations in undamaged wide flange
b e a m s ................................................. 12933. Experimentally determined residual stresses
in an unheated W6x9 specimen (Beam U H ) ............ 13334. Experimentally determined residual stresses
in undamaged, Category W wide flange beams . . . 13435. Experimentally determined residual stresses
in undamaged, Category S wide flange beams ("large" vee a n g l e s ) ................................. 135
36. Experimentally determined residual stressesin undamaged, Category S wide flange beams ("small" vee a n g l e s ) ................................. 136
37. Summary of damaged beam d a t a .........................13938. Shortening resulting from each damage/repair
cycle (initial measurement length = 22",average damage = 7.20°) 141
39. Increasing yield zone after eachdamage/repair cycle .............................. 143
40. P-values for comparing plastic rotations atdifferent heat numbers within a straightening p r o c e s s ............................................... 147
41. Statistical data for independent samples t-t e s t ........... 150
42. P-values for varying repair cycle numbers . . . 15143. Comparison of different estimates of the
number of heats required for damage repair(from deBejar, et. al 1991) 157
viii
LIST OF TABLES (Continued)
Table Page
44. Residual stresses in damaged beams (1 and 2 damage/repair cycles, assumed E = 29,000k s i ) ..................................... 158
45. Residual stresses in damaged beams (1 and 2 damage/repair cycles, measured E values used) . 159
46. Residual stresses in damaged beams (4 and 8 damage/repair cycles) at Region B (assumed E =29,000 k s i .............................................162
47. Residual stresses in damaged beams (4 and 8 damage/repair cycles) at Region B (measured E values used) ....................................... 163
48. Residual stresses in damaged beams (4 and 8 damage/repair cycles) at Regions A and C(assumed E = 29,000 k s i ) ............................ 164
49. Material properties of damaged beams p e c i m e n s .............................................165
50. Moduli of elasticity of damaged beams p e c i m e n s .............................................170
51. Comparison of material properties in heat- straightened steel beams with unheatedspecimens and ASTM standard values .............. 171
52. Individual plastic rotations for a damaged Category S wide flange beam (specimen XX-1) . . 17 6
53. Comparison of plastic rotation in undamaged Category s wide flanges to Equation 1 8 ............ 177
54. Residual stresses in a damaged Category Swide flange beam (specimen XX-1) ................ 179
ix

LIST OF FIGURES
Figure Page
1. Illustration of vee heat.......................... 32. Heating configuration for Category w
wide f l a n g e ........................................ 53. Heating configuration for Category s
wide f l a n g e ........................................ 54. Experimental plate set-up ........................ 155. Residual stress distribution from finite
element analysis (Roeder 1985) 176. Strip configuration for sectioning
m e t h o d ............................................ 197. Residual stresses in unheated plate
(Plate UH) ........................................ 218. Average residual stresses resulting
from vee h e a t s ................................... 239. Method of establishing curvature from 3 points
of measurement (Shanafelt and Horn 1984) . . . 2910. Variations in curvature for identical
angles of d a m a g e ................................. 3211. Plate damaging set-up ............................ 3412. Vee locations to accomodate entire
yield z o n e ........................................ 3513. Spreading of yield zone with
increasing angles of damage ..................... 3714. Experimental strain contour (from
Roeder 1985) 4315. Strain at open end of vee (derived
from Roeder 1 9 8 5 ) ................................. 45
x
LIST OF FIGURES (Continued)
Figure Page
16. Comparison of old and new data with Boudreaux's equation and the modified plastic rotation equation (1200°F, M/Mp =0.5) 47
17. Comparison of old and new data with Boudreaux's equation and the modified plastic rotation equation (1200°F, M/Mp =0 . 2 5 ) ............................................... 48
18. Increasing vee angles from 0 to 180°with "optimum angle" shown .................... 50
19. Comparing the effect of depth ratio on plastic rotations for 20-, 45-, and 60-degreevee heats on damaged p l a t e s .................... 53
20. Regions A, B, and C for residualstress measurements .............................. 58
21. Residual stress distribution forRegion B (estimated modulus of elasticity of29,000 k s i ) ....................................... 60
22. Residual stress distribution forRegion B (moduli of elasticity from tensiletest r e s u l t s ) ..................................... 61
23. Residual stress distribution for Regions A and C (estimated modulus ofelasticity of 29,000 k s i ) ....................... 62
24. Representation of shortening resultingfrom a damage/repair c y c l e ..................... 66
25. Shortening vs. angle of damage inplate e l e m e n t s ................................... 69
26. Points used to measure thickening inplates repaired by heat straightening ......... 71
27. Heating patterns (Category S for equal leg angle and category W for channel) with stiffening element at open end of vee . . . . 88
28. "Unfolded" angle with vee andrectangular heating patterns shown ........... 89
xi

LIST OF FIGURES (Continued)
Figure Page
29. "Unfolded" channel with vee andrectangular heating patterns shown ............ 93
30. Cross-section of a typical a n g l e .............. 9531. Cross-section of a typical channel ............ 9732. Angle-to-plate movement ratio (Ra/p )
vs load r a t i o ..................................... 9933. Channel-to-plate movement ratio (Rc/p)
vs load r a t i o ........................................ 10034. Heating patterns for angles and channels
stiffening element vee a p e x ........................10735. Comparison of plastic rotations in L6x4x5/16
specimen with Equations 11a and 4 b .............. 11236. Comparison of plastic rotations in L4x4xl/4
specimen with Equations 11a and 4 b .............. 11337. Comparison of plastic rotations in C6x8.2
specimen with Equations lib and 4 b .............. 11438. Stresses in Channel IX-6 (45° vee, M/Mp =
0.50, depth ratio = 1 . 0 0 ) .......................... 11639. Stresses in Angle VI-1 (20° vee, M/Mp =
0.00, depth ratio = 1 . 0 0 ) .......................... 11740. Stresses in Angle VI-4 (45° vee, M/Mp =
0.00, depth ratio =1.00) ....................... 11841. Stresses in Angle L4x4 (45° vee, M/Mp =
0.50, depth ratio = 1 . 0 0 ) .......................... 11942. Stresses in Angle L6x4 (45° vee, M/Mp =
0.33, depth ratio = 1 . 0 0 ) .......................... 12043. Beam heating s e t - u p ..................................12644. Residual stress strip locations
(Category S h e a t ) ....................................12745. Residual stress strip locations
(Category w h e a t ) ....................................128
xii

LIST OF FIGURES (Continued)
Figure Page
46. Residual stresses in unheated wide flangespecimen (Beam UH) ................................. 131
47. Average residual stresses in undamaged wideflange beams after Cat. s and Cat. W heats . . 132
48. Spreading of yield zone in subsequentbends of damaged wide flange beam specimens . . 140
49. Heat locations used for damaged beamsand regions A, B, and c for residual stress measurements shown .............................. 142
50. Comparison of plastic rotations in repetitivelydamaged, Category W wide flange beams with Equations 15 and 4 b .............................154
51. Residual stress distributions in damaged, Category W wide flange beams(estimated E = 29,000 ksi) ........................160
52. Residual stress distributions in damaged, Category W wide flange beams(measured E values used from tensile tests) . . 161
53. Yield stress vs. number of repairc y c l e s ...........................................167
54. Tensile stress vs. number of repairc y c l e s ...........................................168
55. Percent elongation vs. number ofrepair cycles ..................................... 169
56. Geometric relationship betweenCategory s wide flanges and plates . . . . . . 173
57. Comparison of data from Beam XX-1 withEquations 18 and 4 b .............................175
58. Stresses in Beam XX-1 (45° vee,M/Mp=0.50, depth ratio=l.00) 178
A 1 . Stresses in Plate 1-1 (20° vee,M/Mp= 0 .00, depth ratio=l.00) 201
xiii

LIST OF 'FIGURES (Continued)
Figure Page
A 2 . Stresses in Plate 1-2 (45° vee,M/Mp =0.00, depth ratio=1.00) 202
A3. Stresses in Plate 1-3 (60° vee,M/Mp=0.00, depth ratio=1.00) 203
A 4 . Stresses in Plate II-l (20° vee,M/Mp=0.00, depth ratio=1.00) 204
A 5 . Stresses in Plate VI-4 (45° vee,M/Mp=0.50, depth ratio=0.75) 205
A 6 . Stresses in Plate VI-6 (45° vee,M/Mp=0.00, depth ratio=0.75) 206
A 7 . Stresses in Plate VI-10 (82° vee,M/Mp=0.50, depth ratio=0.75) 207
A 8 . Stresses in Plate VI-12 (82° vee,M/Mp =0.00, depth ratio=0.75) 208
A 9 . Stresses in Plate XXV-3 (45° vee,M/Mp=0.25, DR=1.00, Angle of Damage = 6.40°, assumed E = 29,000 k s i ) ............................ 215
A10. Stresses in Plate XXV-3 (45° vee,M/Mp=0.25, DR=1.00, Angle of Damage = 6.40°,using E from tensile test results) .............. 216
All. Stresses in Plate XXV-4 (45° vee,M/Mp=0.25, DR=1.00, Angle of Damage = 23.62°, assumed E = 29,000 k s i ) ............................ 217
A12. stresses in Plate XXV-4 (45° vee,M/Mp=0.25, DR=1.00, Angle of Damage = 23.62°, using E from tensile test r e s u l t s ) .............. 218
A 1 3 . Stresses in Plate XXV-5 (45° vee,M/Mp=0.50, DR=1.00, Angle of Damage = 5.58°, assumed E = 29,000 k s i ) ............................ 219
A14. Stresses in Plate XXV-5 (45° vee,M/Mp=0.50, DR=1.00, Angle of Damage = 5.58°,using E from tensile test r e s u l t s ) .............. 220
xiv

LIST OF FIGURES (Continued)
Figure Page
A15. Stresses in Plate XXV-6 (45° vee,M/Mp=0 .50, DR=1.00, Angle of Damage = 11.80°, assumed E = 29,000 k s i ) ............................ 221
A 1 6 . Stresses in Plate XXV-6 (45° vee,M/Mp=0.50, DR=1.00, Angle of Damage = 11.80°, using E from tensile test r e s u l t s ) .............. 222
A 1 7 . Stresses in Plate XXV-7 (45° vee,M/Mp=0.33, DR=1.00, Angle of Damage = 18.77°, assumed E = 29,000 ksi) . ........................223
A18. Stresses in Plate XXV-7 (45° vee,M/Mp=0.33, DR=1.00, Angle of Damage = 18.77°, using E from tensile test r e s u l t s ) .............. 224
A 1 9 . Stresses in Beam 1-1 (20° vee,M/Mp=0.00, DR=1.00) .............................. 230
A 2 0 . Stresses in Beam 1-2 (45° vee,M/Mp=0.00, DR=1.00) .............................. 231
A21. Stresses in Beam 1-4 (30° vee,M/Mp= 0 .00, DR=1.00) .............................. 232
A2 2 . Stresses in Beam II-l (20° vee,M/Mp= 0 .00, DR=1.00) .............................. 233
A 2 3 . Stresses in Beam II-3 (45° vee,M/Mp = 0 .00, DR=1. 0 0 ) .............................. 234
A 2 4 . Stresses in Beam III-2 (20° vee,M/Mp = 0.50, DR=1. 0 0 ) .............................. 235
A25. Stresses in Beam IV-5 (45° vee,M/Mp = 0 .25, DR=1. 0 0 ) .............................. 236
A2 6 . Stresses in Beam IV-6 (45° vee,M/Mp=0.50, DR=1.00) .............................. 237
A 2 7 . Stresses in Beam XXI-1 (1Damage/Repair Cycle,assumed value of E = 29,000) 243
xv

LIST OF FIGURES (Continued)
Figure Page
A28. Stresses in Beam XXI-1 (1 Damage/Repair Cycle,using E from tensile test r e s u l t s ) .............. 244
A29. Stresses in Beam XXI-2 (2 Damage/Repair Cycles,assumed value of E = 29,000) 245
A 3 0 . Stresses in Beam XXI-2 (2Damage/Repair Cycles)using E from tensile test results) . . . . . . 246
A31. Stresses in Beam XXI-3 (A) (4Damage/Repair Cycles)assumed value of'E = 29,000) 247
A32. Stresses in Beam XXI-3 (B) (4Damage/Repair Cycles)assumed value of E = 29,000) 248
A33. Stresses in Beam XXI-3 (B) (4Damage/Repair Cycles)using E from tensile test r e s u l t s ) .............. 249
A34. Stresses in Beam XXI-3 (C) (4Damage/Repair Cycles)assumed value of E = 29,000) 250
A35. Stresses in Beam XXI-4 (A) (8Damage/Repair Cycles)assumed value of E = 29,000) 251
A 3 6 . Stresses in Beam XXI-4 (B) (8Damage/Repair Cycles)assumed value of E = 29,000) 252
A37. Stresses in Beam XXI-4 (B) (8Damage/Repair Cycles)using E from tensile test r e s u l t s ) .............. 253
A38. Stresses in Beam XXI-4 (C) (8Damage/Repair Cycles)assumed value of E = 29,000) 254
xv i

ABSTRACT
A comprehensive set of experiments is conducted on damaged steel plates and rolled shapes which have been subjected to heat straightening. Effects of the repair process on the tensile properties and residual stresses in the repaired steel are experimentally determined for the first time. Based on the results, rational decisions can be made concerning the use of heat straightening and its limitations.
For the first time in a laboratory setting, heavily damaged plate elements and rolled shapes are repetitively subjected to vee heat applications to produce desired straightening. Movements resulting from each heat application are recorded and provide an adequate database for modifying existing equations which have been used in the past to predict such movements for plates only. The relationship between movements in rolled shapes and plates is analytically established and experimentally verified.
Results show that conclusions drawn from studies on undamaged specimens should not be assumed to apply to damaged specimens. This is especially true in the studies of residual stresses and movements resulting from vee heats on wide flange shapes. Also, tensile properties of the steel can differ from those found in undamaged plates,
xvii

depending on how many times a member has been damaged and repaired using heat straightening.
Other important results of the research include scientifically based suggestions regarding the use and limitations of heat straightening. These suggestions include the following topics: Degree of damage,repetitive damage, and detrimental effects on steel properties caused by certain heating patterns.
xviii

CHAPTER IINTRODUCTION
The "art" of heat straightening has been applied by experienced craftsmen for over 50 years as a method of repairing damaged steel. Early references described the basics of heat straightening (Holt 1938) . In recent years, progress has been made toward making heat straightening more of a science than an art (Shanafelt and Horn 1984; Roeder 1985; Avent and Fadous 1988). This progress has been most beneficial in helping to predict the response of steel subjected to the heat straightening process, in terms of movements and material properties. However, many questions remain regarding this process, its limitations, and its effects on the steel.
The majority of recent heat straightening research has focused on the repair of plate elements damaged about their strong axes. The heating pattern used to correct such damage is the vee or triangular heat (to be explained below). Emphasis has been placed mainly on determining plate movements resulting from individual heats, with almost all of the heats (experimental and theoretical) being applied to undamaged steel specimens, as opposed to damaged ones.
1

Background on Heat StraighteningThe concept of heat straightening is relatively
simple. Heat applied (usually by a torch) to damaged steel in a specific pattern will cause the steel to undergo permanent deformation in a desired direction. The heating process must be applied in various patterns and at various locations along a damaged member to produce straightening. Although heating alone may be used to straighten a bent member, loads may also be applied to increase the efficiency of the process. These loads are usually kept low enough to not cause hot mechanical straightening (Avent 1990).
Many types of heating patterns exist, such as the spot, line, strip, and edge heats. However, the vee heat is the most basic pattern used to straighten strong axis bends in steel plate elements. As seen in Figure 1, a typical vee heat starts with a very small spot heat applied at the apex of the vee-shaped area using an oxy- acetylene torch. When the desired temperature is reached (usually around 1200°F for A36 steel), the torch is advanced progressively in a serpentine motion toward the base of the vee. The cool material adjacent to the heated area resists the normal thermal expansion of the steel in the longitudinal direction. As a result, the heated material will expand through the thickness of the plate.At the completion of the heat, the entire heated area is at a high and relatively uniform temperature. As the

£
Before heat
heat ]—spot heat at v g<= (progress at 1200
Progression after : vee apex
Figure l. Illustration of vee heat
u>

steel cools, the material contracts longitudinally to a greater degree than the expansion during heating. Thus, a net contraction occurs which produces bending in an initially straight member, or straightening (if the plate is bent in the opposite direction to that of the movement) (Avent and Fadous 1988).
The various heating parameters of a vee heat are simply defined. Applied loads are classified in terms of a load ratio (LR), the ratio of the moment present at the center of the vee, M, to the plastic moment capacity, Mp , of the cross-section in the direction of desired movement. Depth ratio (DR) is the ratio of the vee depth, dv , to the plate width, w. The amount of permanent deformation experienced in the plate element is classified as a plastic rotation, <J) (Figure 1), determined from the plate geometry before and after each heating/cooling process.
Rolled shapes consist essentially of plate elements. Therefore, the vee heat can also be utilized to produce movement in these shapes. Figure 2 shows the basic heating pattern used to produce movement in the weak axis direction of a wide flange shape (referred to as Category W). First, the vee heats are applied to the flanges in the same manner as for plates, and then the rectangular heat is applied to allow for contraction in the web.Figure 3 shows the pattern used for strong axis bending (known as Category S). In this case, the vee heat is first applied to the web, and the rectangular heat is then

5
Figure 2. Heating configuration for Category w wide flange
Figure 3. Heating configuration for Category S wide flange

applied to the flange at the open end of the vee.Different patterns used for heating angles and channels are shown in Chapter IV.
Literature ReviewThe study of heat straightening has developed
significantly over the past half-century. An early reference (J. Holt 1938) on the subject outlined the procedures necessary for straightening damaged steel of various configurations. These general procedures were used for many years, as evident in later references (J. Holt 1955; R. Holt 1965, 1971). Little scientific emphasis was placed on the heat straightening process or its effects.
Over the years, several studies were conducted to answer the many questions regarding the use of heat straightening, its effects, and its limitations. The culmination of these studies were two recent comprehensive reports regarding heat straightening. The first report (Shanafelt and Horn 1984) addressed the general damage assessment of structures with a rational approach to using heat straightening as one of many repair alternatives.The second report (Avent and Fadous 1988) was geared more toward optimizing the use of heat straightening, once the decision is made to use it.
Shanafelt and Horn's report was the first to discuss the subject of damage limitations regarding the use of
heat straightening, although no evidence was presented to support their suggestions. Guidelines were given for damage inspection and measurement, along with the rationale behind choosing a repair procedure based on the measurements. General structural characteristics of steel {strength and fatigue) were incorporated into the decision making process concerning proper locations at which heat straightening should be applied.
The report by Avent and Fadous focused on the behavior of steel when subjected to variations in heat straightening applications, i.e., temperature, load ratio, plate dimensions, etc. Conclusions were based on a number of experiments (approximately 483 heats were applied to various plates and rolled shapes). Theory regarding plastic rotations in plates from past studies (Holt 1971; Weerth 1971; Horton 1973) was expanded using the vast amount of experimental data.
Avent and Fadous also utilized experimental data obtained by Roeder (1985) where 68 plates were heated (using vee heats) as well as a few wide flange beam specimens of various sizes. Roeder also conducted actual strain measurements within the vee heated area, and formulated a finite element program to model residual strains and residual stresses resulting from a single vee heat on an undamaged plate element.
Roeder's plastic rotation data were highly influential in the development of the most recent equation

to predict plastic rotations based on variations in vee heat applications. This equation, presented by Avent and Fadous (1988), was primarily the result of experiments conducted by Boudreaux (1987). For this reason, it is referred to by the author as Boudreaux's equation.
Only a minimal amount of damage repair on actual bridges has been conducted for which measurements were recorded, analyzed, and published. In fact, the only known example of such a study on an existing bridge was conducted by Moberg (1979) on the Bothell Bridge in the state of Washington. To provide a controlled atmosphere for studying full-scale bridge members, the Heat- Straightening Evaluation and Testing (HEAT) facility was constructed at Louisiana State University (Avent and Fadous 1989). This facility allows for the damage and repair of large wide flange sections resembling actual bridge girders (including composite members), without the hassle of traffic control. Research is being conducted at the HEAT facility in conjunction with this report.
It should be noted that the earlier publications by Weerth and Horton provided the foundation for Roeder's work at the University of Washington, in terms of establishing methodology of heating and measuring the specimens. Thus they were very important in establishing heat straightening techniques used by Boudreaux, Avent and Fadous, as well as the author. Moberg provided excellent summaries in the Literature Review of his Masters thesis
of all the important early work conducted (before 1980) in the field of heat straightening. For a logical and comprehensive presentation of the most important aspects of heat straightening, the reader should refer to Avent (1990).
In summarizing the previous literature, it is evident that certain areas of research are lacking concerning the use of heat straightening. Some of the most important points are as follows:
1. Almost all studies have been conducted on initially straight specimens, with only one to four heat applications per specimen.
2. No experimentally measured residual stresses have been published for heat-curved or heat-straightened steel.
3. The few theoretical residual stresses in various references have been contradictory, even for the most simple plate elements.
4. Material properties of damaged steel repaired by heat straightening has never been studied, and their is no evidence to suggest that they would be the same as for undamaged steel subjected to the same process.
5. No experimental or theoretical rationale has been used to establish general damage limits on the use of heat straightening.
6. No one has adequately addressed the subject of repetitive damage to a heat-straightened member.

7. Little analytical work has been done to predict plastic rotations in a wide variety of rolled shapes.
8. Damage classification has been vague in past studies.
Purpose and ObjectivesThe lack of adequate research in the area of actual
damage repair using heat straightening has led to many questions concerning its use. The purpose of the author's research is to answer some of the most pressing questions, primarily in the areas of damage classification, damage limitation, residual stresses, and changes in the material properties of damaged steel subjected to the process of heat straightening. Specifically, the following questions, frequently asked by those involved in heat straightening, are addressed:
1. How does the degree of member damage affect the heat straightening process?
2. How should damage be classified?3. Is there an upper limit on the amount of damage
that a steel member may undergo and still be heat- straightened?
4. How many times can a member be damaged and heat straightened?
5. What are the residual stresses resulting from heat straightening?

6. What changes in material properties are exhibited by steel that has been damaged and heat straightened?
7. Can an analytical equation be developed to relate movements in heat straightened rolled shapes of all types to plate movements.
8. What results from heat curving studies can be applied to heat straightening.
The many variables and uncertainties regarding heat straightening have rendered the subject very difficult to approach from a theoretical viewpoint, although this has been attempted with varying degrees of success using the most elementary cases of undamaged specimens. Therefore, it was deemed necessary that the major thrust of the author's research be experimental, with appropriate analysis being conducted using the obtained data. The experiments, designed to answer the above mentioned questions, are outlined below, after a brief introduction to the subject of heat straightening and literature review.
Scope of investigationThe research presented herein was conducted at the
structures laboratory in the Center for Engineering and Business Administration (CEBA) at Louisiana state University. These laboratory experiments are only a portion of a larger research project conducted under
funding from the Federal Highway Administration through the Louisiana Transportation Research Center.
The laboratory experiments performed are classified into five general categories:
1. Undamaged Plates.2. Damaged Plates.3. Angles and channels (includes undamaged and
damaged specimens).4. Undamaged Wide Flange Beams.5. Damaged Wide Flange Beams.
Individual chapters are devoted specifically to each of the above categories, presenting the reasoning behind each type of experiment, along with its setup, methodology, and results.

CHAPTER IIUNDAMAGED PLATES
Several previous studies have been conducted on the behavior of initially straight plate elements subjected to the heat straightening process (actually heat curving), using the vee heat. These studies have included theoretical analyses of plastic rotations and residual stresses in undeformed steel plate elements (Weerth 1971; Roeder 1985). Actual experiments have also been completed (Weerth 1971; Roeder 1985; Avent and Fadous 1988), with geometric measurements being taken to determine plastic rotations. Material property tests have been conducted on heat curved steel plates (Nicholls and Weerth 1972). However, experimentally determined residual stresses have not been documented for vee heated plate elements. The purpose of this chapter is to present measured residual stresses in undamaged plates which have been subjected to heat curving using vee heats.
Test Setup and ProcedureIn order to more clearly understand the residual
stresses resulting from varying parameters in the heat straightening process, a number of experiments were conducted on a set of initially straight plates to contribute to the previous research in this area. The 4"
13

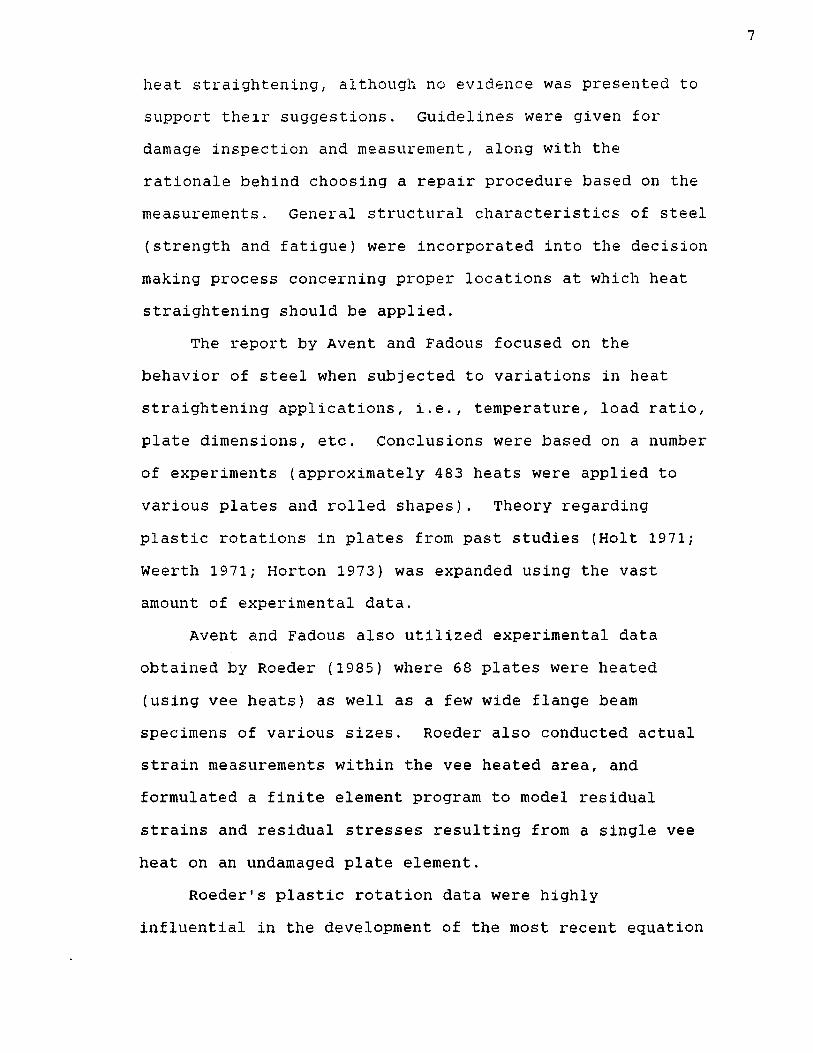
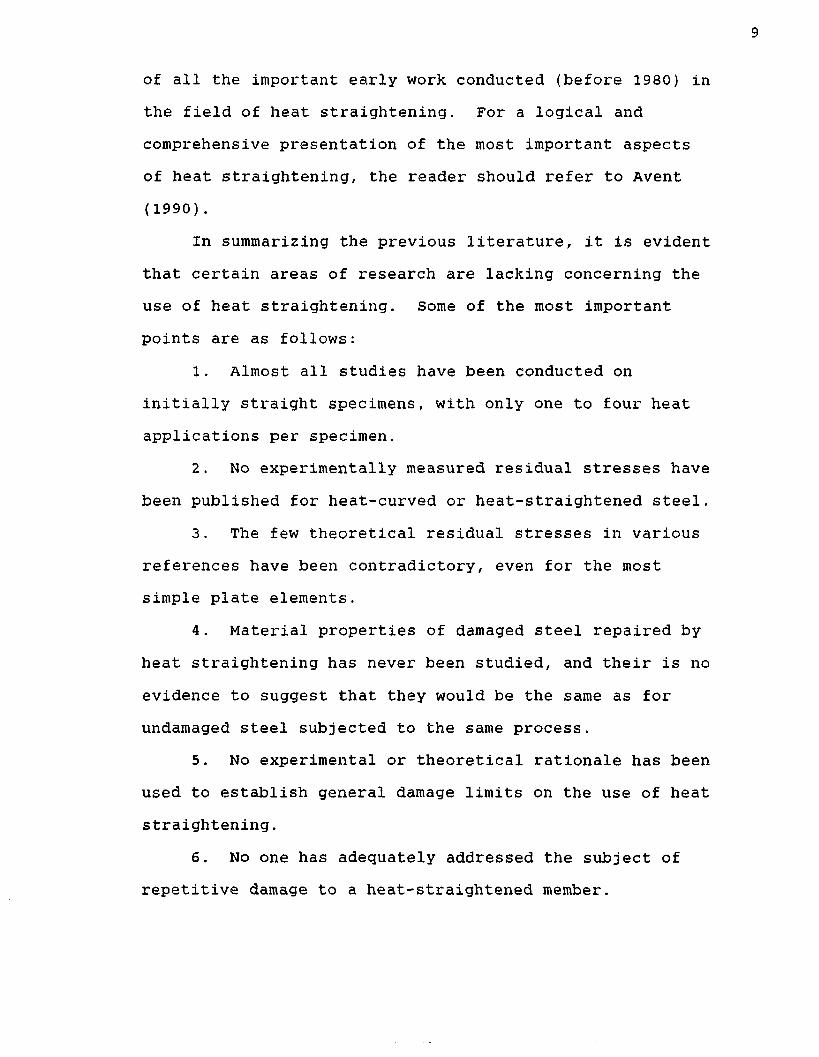
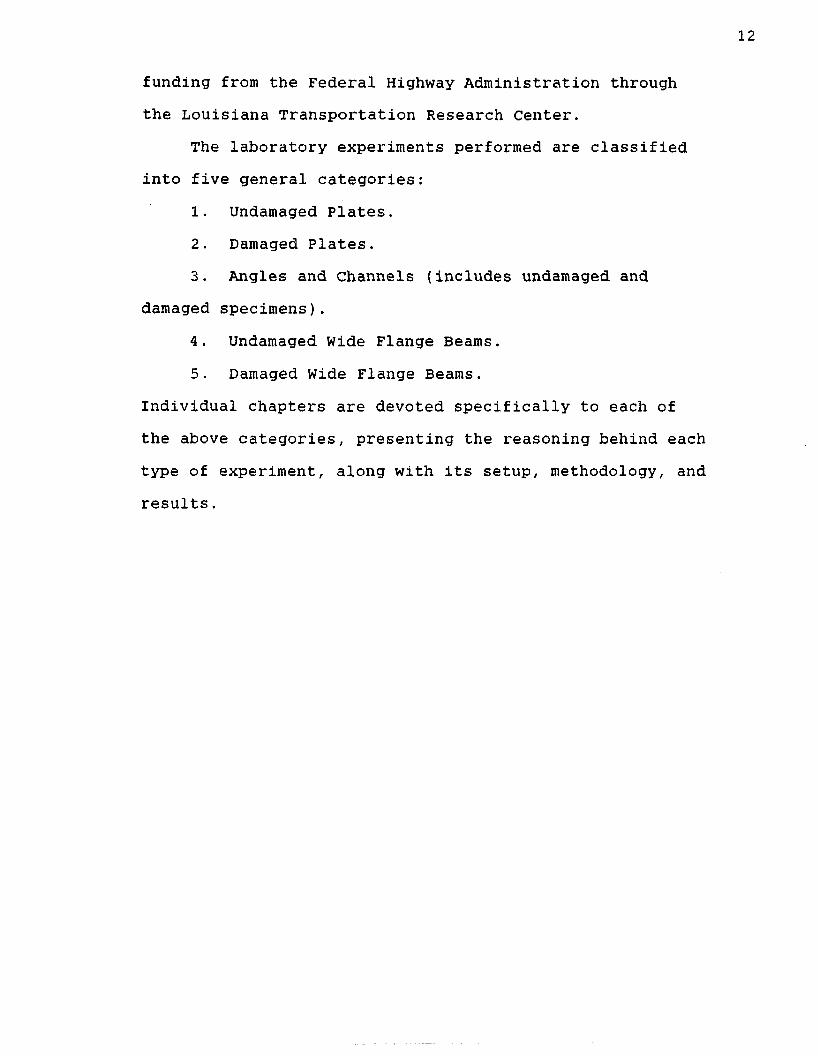
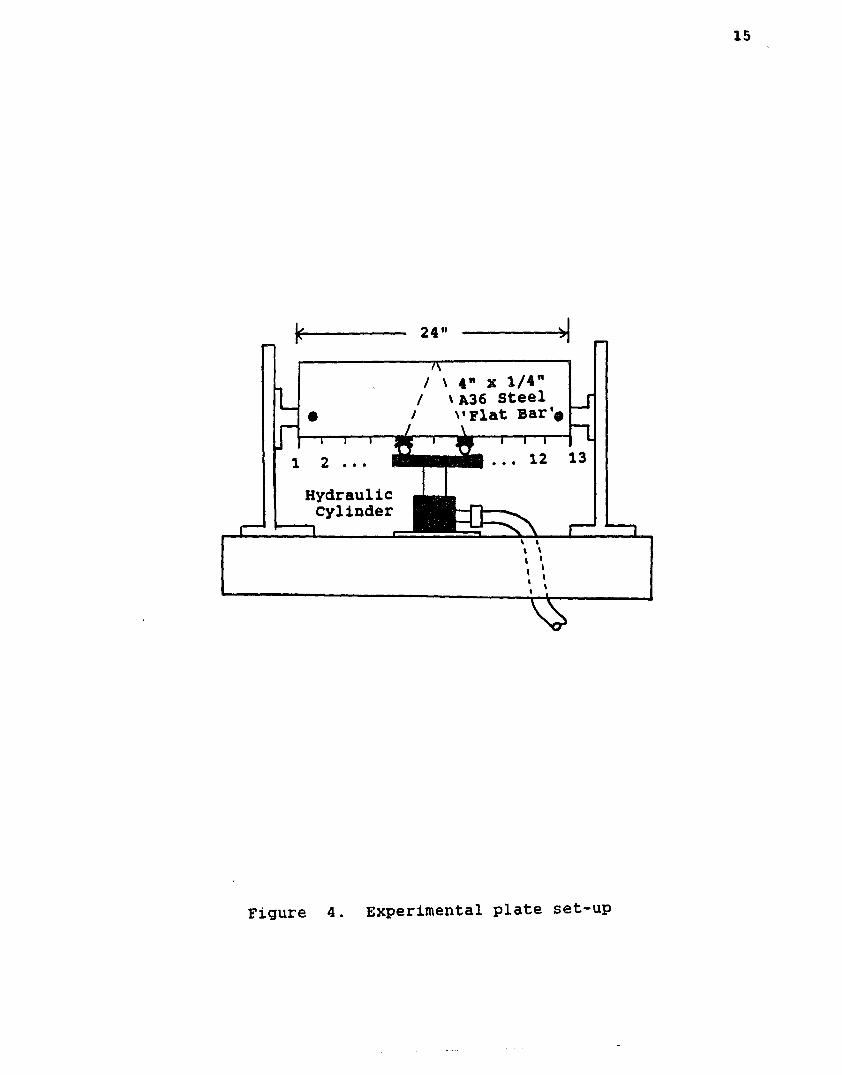
x 1/4" x 24", A36 steel plates were simply-supported (using 5/8" bolts) on a stationary frame at a length of 22" (Figure 4). Each specimen was subjected to four heating/cooling cycles (alternating sides to prevent a net out-of-plane distortion). Each plate was assigned a specific vee angle, vee depth ratio, and load ratio for the four heating cycles.
The heating parameters for each of the plates are shown in Table 1. Each plate was heated using an oxy- acetylene torch (#3 tip) to approximately 1200°F. The temperature was measured using an Omega high-temperature surface probe and thermometer. The load was applied by use of a hydraulic cylinder which produced the desired moment at the vee heat location (in this case, at the center line of the plate. The bolts used to hold the plate were loosely fastened to allow uninhibited plate movements. Slots in the frame allowed for any plate shortening that might occur.
Residual StressesAlthough residual stresses are often mentioned in
literature on heat straightening, there has been little documented research in this area. Past research was conducted in the context of heat curving (not heat straightening), and thus is somewhat limited in its applicability to heat straightening. Some of the most notable research was conducted at the University of
24"
Lir — i— i— r
1 2 . . .
HydraulicCylinder
“7T/ \ 4" x 1/4"/ \ A36 Steel/ \»Flat Bar'®
Figure 4. Experimental plate set-up

Table 1. Heating parameters for undamaged plates.
Plate Vee Angle Load Ratio Depth Ratio
1-1 20 0.00 1.001-2 45 0. 00 1.001-3 60 0.00 1.00
II-l 20 0. 00 1.00VI-4 45 0. 50 0.75VI-6 45 0.00 0.75VI-10 82 0.50 0.75VI-12 82 0.00 0.75
Washington (Roeder 1985), where a finite element model was developed to predict the local behavior of a plate element subjected to a vee heat. Residual stresses were estimated using the model. An example of Roeder's residual stress distribution is shown in Figure 5.
Experimental research was conducted (Brockenbrough 1970b) to back up earlier theoretical residual stress studies (Brockenbrough 1970a) on heat-curved plate girders subjected to line heats. These stresses, determined by the "sectioning method" discussed below were reasonably consistent with the theoretical values. Similar theoretical methods were used on vee-heated plate elements (Nicholls and Weerth 1972) and on wide flange beams (Horton 1973). However, the results were not supported by any experimental data.
The limited information regarding residual stresses in heat-straightened steel, necessitated the study of initially straight plates for two major reasons: (1) To

Line of Symmetry
0.0
0.4
Heated Area0.0
0.20.60.8
Normalized Residual Stresses
Figure 5. Residual stress distribution from finite element analysis (Roeder 1965)

experimentally verify Roeder's theoretical stresses from his finite element model, and (2) To provide a convenient and time saving way (compared to the use of damaged specimens) of checking changes in residual stresses resulting from variations in the parameters of the heat straightening process, i.e., vee angle, vee depth ratio, and load ratio. This type of parameter study was not possible for damaged specimens, due to the nature of the proposed experiments, in which the amounts of damage varied instead of the heating parameters.
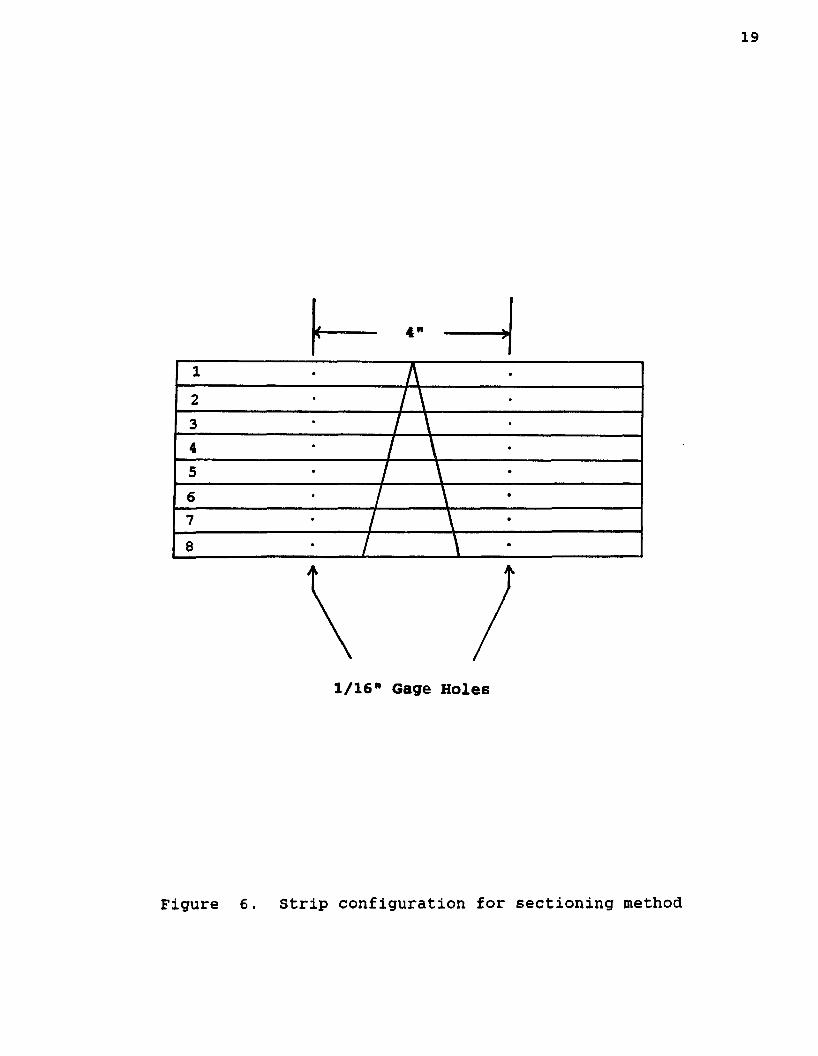
Longitudinal residual stress patterns in all of the plates were determined using the "sectioning method", a well-established, but destructive method. This method is described as follows: A plate element may be marked instrips (Figure 6). Two gage holes (diameter =0.0625", approx. depth = 0.20"), separated by a measured distance (in this case, approximately four 4 inches), are drilled along the center of each strip. The exact distance is measured to the nearest hundred thousandth of an inch, using an extensometer. Eight strips of approximately one-half inch width are cut from the 4-inch deep plate, and the distance between the two gage holes (along the center line of each strip) is remeasured.
The difference between the final and initial gage readings indicates that residual stresses were present in the strip before cutting. A positive change indicates a compressive stress, and a negative change indicates a
1/16” Gage Holes
Figure 6. Strip configuration for sectioning method

tensile stress. The stresses are computed by dividing the net change in length by the initial gage reading (to obtain strain) and multiplying by the modulus of elasticity of the material, changes in temperature are taken into account by utilizing measurements of a standard gage length on a steel rod which changes depending on the temperatures during the initial and final strip measurements, respectively. The procedure was applied to both sides of the strip, and an average was taken. The computed stress indicates the average residual stress present in the entire strip within the 4-inch gage length. Residual stresses have been shown to be relatively uniform throughout the thickness of thin plate elements (SSRC 1976).
First, an unheated plate (Plate UH) was tested for residual stresses to provide the basis for determining changes brought on by the vee heats. Stresses found in each strip are shown in Table 2 and plotted in Figure 7. The values are fairly low and the distribution compares reasonably well in shape with standard residual stress assumptions, values of 0.3 o y (compression in the edges and tension in the center of the plate, distributed parabolically or linearly), are commonly used in predicting buckling behavior of plate elements.
The stresses in Plate UH were somewhat lower than the conservative predicted values. Similar low values were found in a previous study (Avent and Wells 1982) of plate

Stri
p N
um
ber
05-
GO-
M
CO
ioH
CO
CM
Plate UH (U nheated Specim en)
a
-50 -40 -30 -20 -10 0 1 20 30 40 50Residual S tress (KSI)
Figure 7. Residual stresses in unheated plate (Plate UH)

Table 2. Experimentally determined residual stresses in an unheated specimen (Plate U H).
Strip Residual Stress (KSI)
1 -10.842 -3.083 0.294 2 .215 0.986 0.007 -1. 568 -7 .00
components of thin-web welded H columns (before welding). In this study, several types of plate edges were studied (rolled, sheared, and slit and coiled). All of the plates in the current study have rolled edges, and the stresses in Plate UH most closely matched the rolled-edge example used by Avent and Wells (see also Avent and Wells 1979).
The residual stresses found for the heated undamaged plates led to the following observations:
1. A distinction can be made by classifying "small vee angles" as those being less than or equal to 60 degrees, and "large vee angles" as those greater than 60 degrees. These two categories have significantly different magnitudes of residual stresses. The averages of all plates within each category are shown in Figure 8. The smaller vees exhibited considerably higher compressive stresses. Residual stress values for each plate are shown in Tables 3 and 4. Plots of these values are presented in Appendix I .

Stri
p N
um
ber
05
CO
r -
co
IO
CO
CM
o-50 -40 -30 -20 -10 0 10 20 30 40 50Residual Stress (KSI)
Undamaged Plates
Q O O Q O Sm all—Ang Large-Ang
e Vee: e Vee =
Figure 8. Average residual stresses resulting from vee heats
N)u>

24
2. The residual stress patterns in all of the plates were similar in shape to Roeder's theoretical distribution (Figure 5), where normalized values were used.
3. When comparing individual plates, it was found that the two parameters of load ratio and depth ratio, when considered separately, have no significant effect on the residual stress pattern.
4. The stress patterns for the practical range ofvees (20 to 60 degrees) consist of stresses which are approximately 100 percent larger than regularly assumed stresses in fabricated structural plate. The higher compressive stresses could be detrimental to column behavior associated with inelastic buckling at lower loads than normal.
It is reasonable to assume that heat curving is not practical for columns, because columns (in most cases) are meant to be straight. Nonetheless, the effects of various heating parameters on the stress values in undamaged plates could be experienced in damaged plates as well.However, one should consider the effects of heatstraightening on damaged specimens (plates or rolled shapes) before making any recommendations for column repair using vee heats. This topic is discussed in Chapters III for plates and VI for beams.

Table 3. Experimentally determined residual stresses in undamaged plates: "small" vee angles (20°, 45°, and 60°) .
Residual Stresses in Plate #:
(KSI)
strip 1-1 II-l 1-2 VI-6 VI-4 1-3 AVG
1 -24 .47 -22 .70 -23. 96 -23.27 -16 .68 -27. 23 -23 ..052 0 .11 11 .75 4. 84 5.98 -1 .13 -4 .79 2 ,.793 13 .23 18 .71 8. 56 17 .18 8 . 19 10. 15 12 ..674 17 .11 16 .50 15. 23 18.20 10 .77 16. 31 15 ,.695 16 .24 12 .62 14. 29 14 .28 11 .13 17 .18 14 ., 296 9 .24 N .R.* 8. 59 9.64 9 .97 18. 63 11 ,.217 8 .20 N .R.* 0 . 15 2.00 7 .03 0 . 07 3 ,.498 -22 .15 -24 .36 -24 .40 -23 .89 -18 .67 -25 .19 -23 ,.11
★NO reading was taken due to cutting error.
Table 4. Experimentally determined residual in undamaged plates: "large" vee angles (82°)
stresses
Residual Stresses (KSI)in Plate #:
Strip VI-12 VI-10 AVG.
1 -9 .43 N.R. -9 .432 -6.67 -6 .16 -6.423 13.27 10.30 11.794 16.50 11 .82 14.165 11.13 11.53 11.336 -1.38 1 .41 0.027 -3.63 -2.03 -2.838 -11.85 -18.16 -15.00
*No reading was taken due to cutting error.

26
Material PropertiesMaterial property studies of undamaged steel plate
elements subjected to the heat straightening process have been conducted in the past (Nicholls and Weerth 1972). A summary of all the studies (including rolled shapes and various heating patterns) is well documented (Avent 1989). Most researchers have stated that the process, when applied to undamaged specimens, has little effect on the material properties. These studies included a wide range of temperatures, types of heating patterns, and different types of steel. To avoid repeating past research, material property studies conducted by the author were limited to damaged specimens for which no previous material property information was available. The results are presented in Chapter III and VI, for damaged plates and wide flanges, respectively.
ConclusionsUsing the results from past and present studies of
undamaged plates, predictions of changes in plate behavior (plastic rotations and residual stresses) with respect to the changing parameters of vee heat applications can be made, similar findings resulting from variations in the heating parameters in damaged plates are shown in Chapter III, indicating that the relative effects on the behavior of undamaged plates are also observed in damaged plates. This is important, because an additional variable of

27
degree of damage exists in the study of damaged plates.It is also recognized that the experimental procedures are often more difficult and time consuming for damaged plates, and repetition of parameter studies already conducted on undamaged specimens is not desirable. The study of damaged plates is presented in the following chapter.
CHAPTER IIIDAMAGED PLATES
A commonly posed question among those involved in heat straightening is the following: Is there an upperlimit on the amount of damage that a steel member may undergo and still be heat straightened? To answer the question of damage limitation, one first must be able to define damage. Definitions of this type have been nonexistent or, at best, extremely vague in previous literature concerning heat straightening.
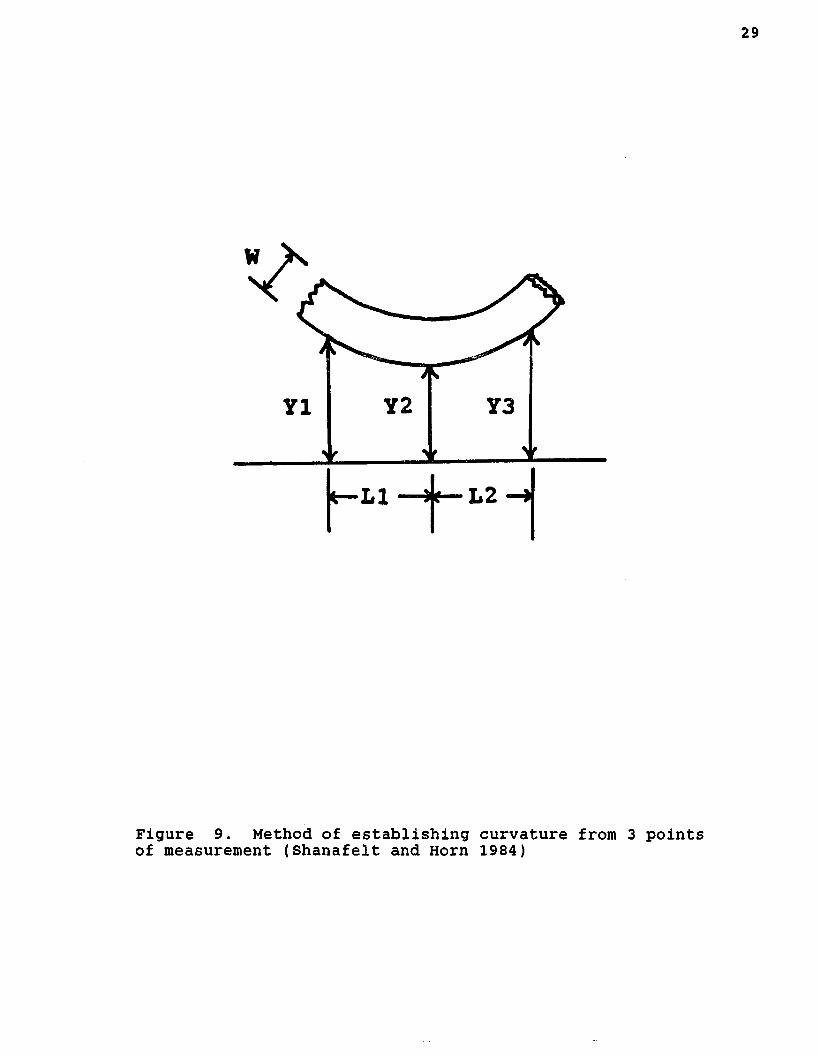
In a comprehensive set of guidelines for the evaluation and repair of damaged steel bridge members, Shanafelt and Horn (1984) developed a method of quantifying damage in terms of strain. The following equation was used to determine the radius of curvature (RC) along the edge of a damaged member:
(LI + L2)2RC = (Y1 - 2 (Y2 ) + Y 3 ) ........................ (1)
The equation parameters are shown in Figure 9.In the above reference, the radius of curvature in a
given damaged member, as calculated using Equation 1, was compared to the radius of curvature at the extreme fibers of particular cross-section at the point of first yielding. The curvature was then expressed as a multiple of the yield strain value. Recommendations were made concerning upper limits on damage to members in which heat
28
i \
Y2 Y3Y1
L2
Figure 9. Method of establishing curvature from 3 points of measurement (Shanafelt and Horn 1984)

straightening should be applied. It was recommended that primary tension members having more than five percent nominal strain (about 42 times yield strain in A36 steel) should not be straightened unless the straightened elements were strengthened by additional splice material. Also, even if nominal strains were less than or equal to five percent, a limit of 15 times the yield strain (the strain at which strain hardening approximately begins) was placed on primary tension members for strains occurring at severe fatigue critical areas (AASHTO stress categories lower than C ) .
If severe critical details were present, according to the guidelines, the member would need to be strengthened with a minimum of 50 percent additional area. This minimum addition was based on the simple premise that if the member was initially designed for a working stress of about 0.5 Fy, the straightened member element could be neglected entirely and the maximum stress would not exceed Fy.
Using these guidelines, all primary tension member areas in severe fatigue critical areas with less than or equal to 15 times the yield point strain could be straightened. The preceding strain limitations applied to primary tension members or primary members with tensile areas. No limitation on strain was placed on compression members or tension or compression secondary members.

shanafelt and Horn suggested that measuring points for curvature be spaced at one-foot intervals. The validity of Equation 1 is based on the assumption of constant curvature in the region contained within the points (see Figure 9). However, in most actual damage situations, the damage is more localized, with radius of curvature being highly variable throughout the damaged region. Therefore, in those cases, the one-foot spacing between measurements renders Equation 1 an inaccurate method of classifying damage. Also, the value of 15 times yield strain constitutes an extremely small bend in a plate element about its strong axis. The equation, as used, may not portray this fact in certain situations.
In the study of repetitively damaged, single curvature beams (as explained further in Chapter VI), it was discovered that the total "angle of damage" was a better definition of damage than curvature. This conclusion originated from the fact that approximately the same number of heats were required to straighten two beams damaged to the same angle, but with different curvature distributions (and different maximum curvatures) (see Figure 10). The angle of damage is simply the angle formed by the straight portions of the member which are on either side of the damaged region. This type of damage classification is similar to that used by Moberg (1979) during the actual repair of a damaged bridge, of course, this definition does not nullify the importance of

32
Note: Same angle of Damage.Different Curvatures.
Figure 10. Variations in curvature for identical angles of damage

curvature. Curvature (or strain) is still the most logical characteristic for establishing damage limits, though not sufficient by itself for damage definition.
Test Setup and ProcedureTo help develop guidelines for damage limits, a
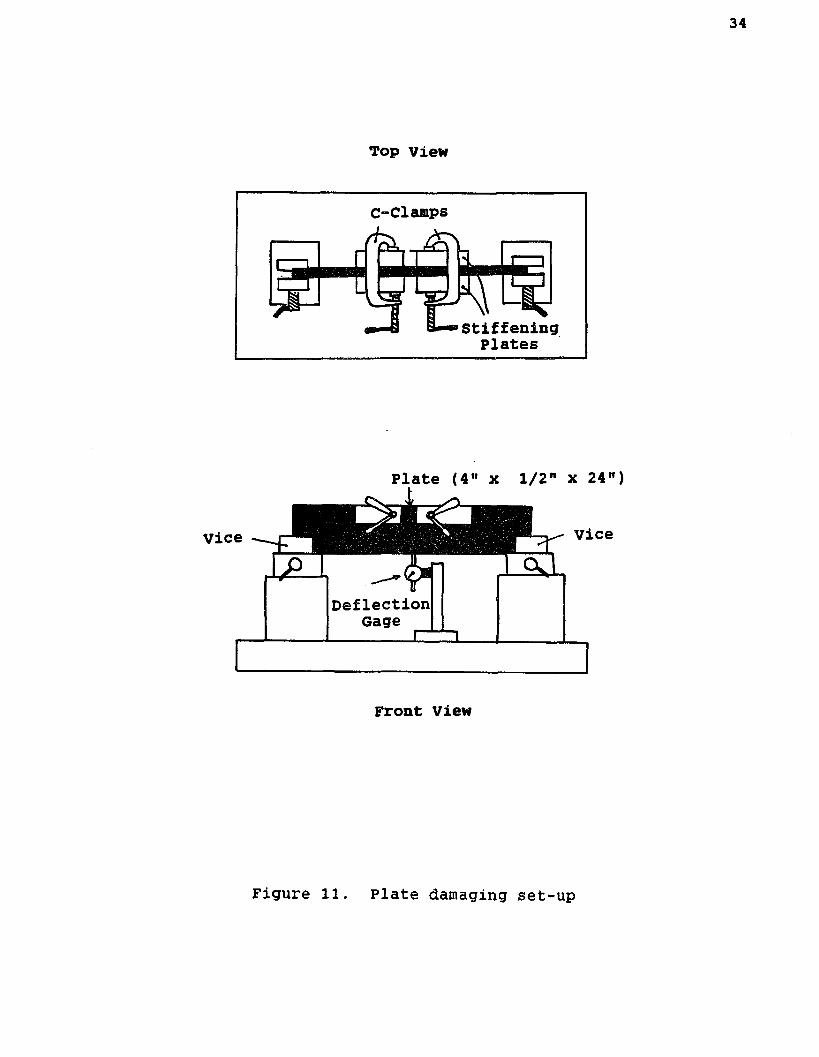
number of deformed plate studies were conducted by the author. Table 5 shows the deformed plates which were straightened. Shown are their damage classifications, maximum strains, and heating parameters used. Each plate had dimensions of 4" x 1/4" by 24". They were simply supported at 22" and were damaged with a center point loading to 4 different degrees of damage (see Figure 11). Equation 1 was used, with much smaller intervals (one inch) between measuring points. This modification was to allow for a more uniform curvature over the span of measuring points to more accurately determine the maximum strain (in terms of yield) along the bottom edge of the plate.
It is obvious from Table 5, that small angles of damage represent quite large strains in terms of yield.It is also evident that strain does not directly vary with angle of damage (due to the spreading of the yield zone as the angle increases (see Figure 12).
Each deformed plate was straightened, using the heating parameters shown in Table 5, in the same manner as the undeformed plates. The numbers of heating/cooling
Top view
C-Clamps
Plates
Plate (4" x 1/2" x 24")
DeflectionGage I rr±i
Front View
Figure 11. Plate damaging set-up

35
Vees cover entire yield zone.
Figure 12. Vee locations to accomodate entire yield zone

36
Table 5. Heating conditions and angles of damage (deformed plates.)
Plate Angle of Max Strain Vee Load VeeDamage (Multiple of Angle Ratio Depth
(deg/millirad) Yield str) (deg) (M/Mp) ratio
XXV-3 6.40 / 111.8 30 45 0. 25 1.00XXV-4 23 .62 / 412.2 100 45 0.25 1.00XXV-5 5 . 58 / 97 .4 30 45 0.50 1.00XXV-6 11.80 / 205.9 80 45 0.50 1.00XXV-7 18.77 / 327 .6 90 45 0.33 1.00XXV-8 5.99 / 104.5 30 45 0.50 0.75XXV-9* 21 .12 / 368.6 80 20 0.50 0.75XXV-10* 25.06 / 437 .4 90 20 0.50 1.00XXV-11* 18.21 / 317 .8 100 60 0. 50 0.75XXV-12* 25 . 02 / 436.7 100 60 0.50 1.00
*The last four• specimens were used just for plasticrotation data and were not straightened completely (20heats were applied to each).
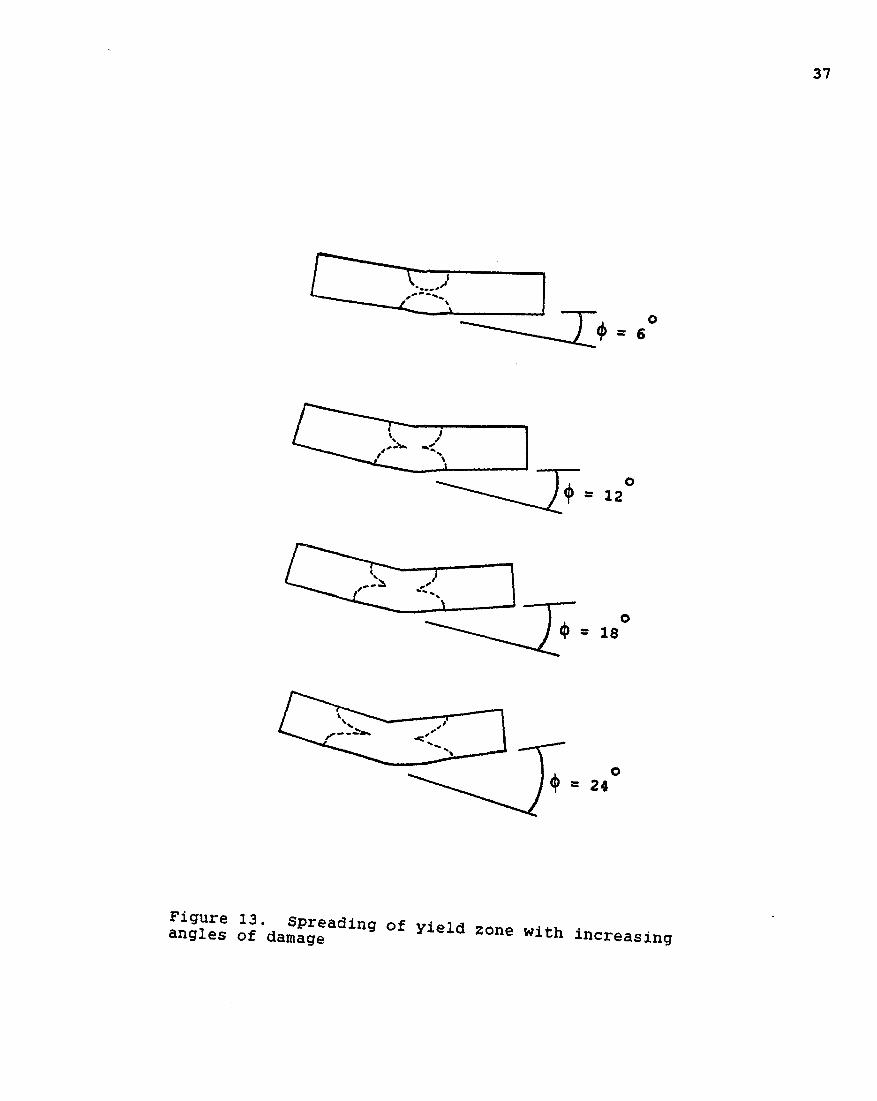
cycles required to straighten the plates ranged from 13 (for XXV-5) to 106 (for XXV-4) as seen in Table 6. The vee heat locations varied from heat to heat to insure that straightening was achieved throughout the yielded zone (see Figure 13).
Plastic RotationsAlmost all of the previous plastic rotation studies
were associated with undamaged specimens, heated between one and four times each. In those studies (Roeder 1985; Avent and Fadous 1988), observations were made that the plastic rotations in undeformed plates exhibited widely scattered values under any given set of heating parameters. However, no conclusions could be drawn
* - 6
<t> * 18
♦ * 24
Figure 13. spreading of yield zone with increasing angles of damage
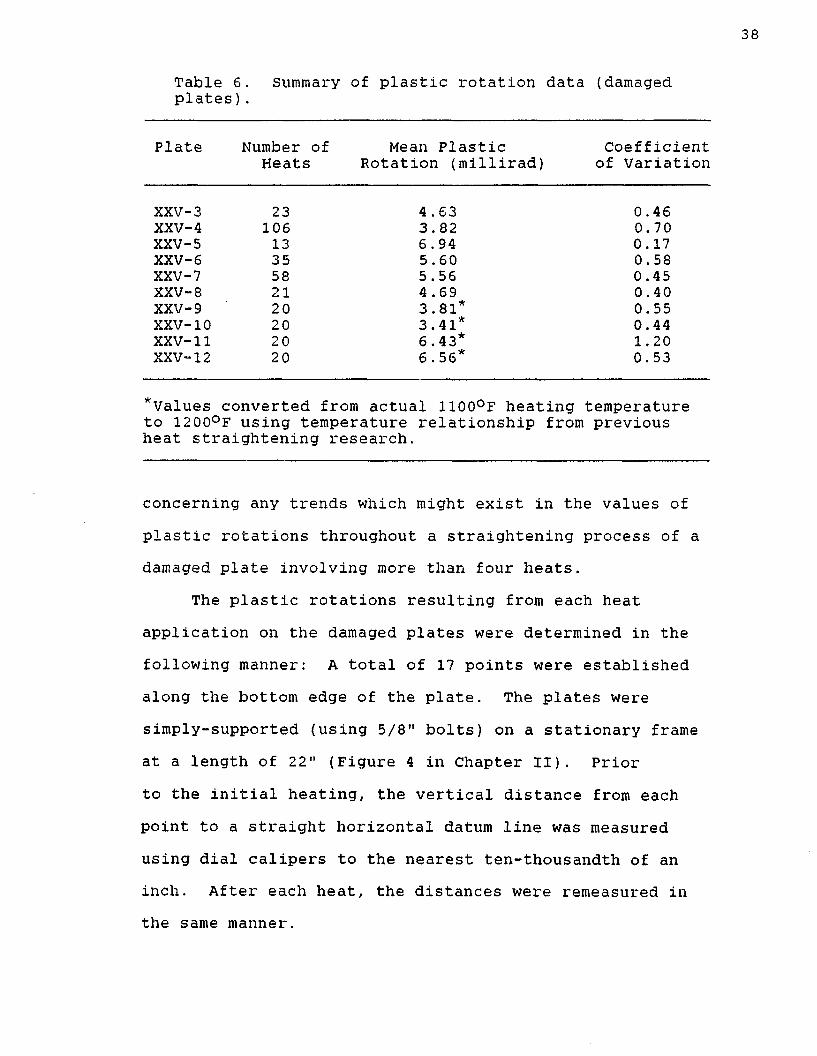
Table 6. Summary of plastic rotation data (damaged plates).
Plate Number of Mean Plastic CoefficientHeats Rotation (millirad) of Variation
XXV-3 23 4 .63 0.46XXV-4 106 3.82 0.70XXV-5 13 6.94 0.17XXV-6 35 5 .60 0. 58XXV-7 58 5 .56 0.45XXV-8 21 4 .69 0.40XXV-9 20 3.81* 0.55XXV-10 20 3.41* 0.44XXV-11 20 6.43* 1.20XXV-12 20 6 . 56* 0. 53
*Values converted from actual 1100°F heating temperatureto 1200°F using temperature relationship from previousheat straightening research.
concerning any trends which might exist in the values ofplastic rotations throughout a straightening process of a damaged plate involving more than four heats.
The plastic rotations resulting from each heat application on the damaged plates were determined in the following manner: A total of 17 points were establishedalong the bottom edge of the plate. The plates were simply-supported (using 5/8" bolts) on a stationary frame at a length of 22" (Figure 4 in Chapter II). Prior to the initial heating, the vertical distance from each point to a straight horizontal datum line was measured using dial calipers to the nearest ten-thousandth of an inch. After each heat, the distances were remeasured in the same manner.
From each set of measurements, linear regression was used to establish two straight lines (representing the bottom plate edge on each side of the center line of the plate, respectively) . The plastic rotation, (J>, is simply the change in the angle formed by these two lines, resulting from the heating process.
The damaged plate experiments contributed a great deal of information concerning plastic rotations. The plastic rotations for each individual plate are shown in Appendix II. As in previous research, the values exhibited a wide scatter. This scatter could be be attributed to a number of things, e.g., relative location of heat to the previous heat, slight differences in temperature, changing residual stress patterns from heat to heat, etc. It is highly suspect, although great pains were taken to avoid it, that error in measurement also contributed to the scatter as a result of out-of- plane movement of the plates. However, despite the scatter, the large numbers of heats allow for statistically more meaningful average plastic rotations to be calculated as well as the observance of trends in these plastic rotations within an entire straightening process.
A summary of the plastic rotation data for each plate is shown in Table 6. The large number of heats on each plate reduces the uncertainty in predicting plastic rotations. Table 7 shows the average plastic rotations in specific heating sequences throughout the straightening

Table 7. Plastic rotations in subsequent heating groups.
Plate A v g . Plastic Rotation in Heat Numbers:1-3 1-10 11-20 21-30 31-40 41-50
XXV-3 3.62 4.21 4 . 91 ---- ---- ----XXV-4 2.72 3 .88 3.97 5 .51 4.24 4. 13XXV-5 7.55 6.71 _ _ _ _ ----XXV-6 12.67 8.31 5.62 3.84 ---- ----XXV-7 7 .65 6.34 6.46 3.86 5.45 6.02XXV-8 5.57 5.56 4.02 ---- ----XXV-9 6.15 4 . 20 3.43 ---- ----XXV-10 4.29 3.95 2.86 ---- ---- ----XXV-11 8.22 6.85 6.00 ---- _ _ _ _ ----XXV-12 8.11 6.98 6. 14 — — — — -* — — — —
51-60 61 -70 71-80 81-90 91-100
XXV-4 2.76 3.92 3.59 3.69 2.73XXV-7 5 .12 —> — — — — — — — — — — — — — — —
process of each plate. In almost all cases, high plastic rotations resulted from the first three heats. However, past this point, only slight decreases occurred (most notably in plates XXV-9 through XXV-12). These findings were further supported in the study of damaged beams, where a statistical approach was used to determine that plastic rotations did not vary significantly from heat to heat after the first few heats (see chapter VI).
Previous plastic rotation equations were based (theoretically and experimentally) on vee heats applied to straight plate elements only. Since the observation was made that in almost all of the damaged plates, lower

41
plastic rotations occurred than predicted by these equations, further developments of the existing equations were made. The most recent comprehensive equation (Avent and Fadous 1988) based on Roeder's (1985) and Boudreaux's (1987) data is as follows:
4> = 10.5 + 0.00125(T-750)](0.9 + 3.4 M/Mp ) £ p (T) sin(0/2) (2 )
with e p (T) = (.001 T 2 + 6.1 T - 415) 10“6
- [ (-7 20.000 + 4200T - 2.75 T 2) ]806(500,000 + 1333 T - 1.111 T 2)
where <)> is the plastic rotation in radians, T is temperature in °F, M/Mp is the load ratio and 0 is the vee angle. e p (T) is the plastic strain at the open end of the vee. This equation assumed uniform strain throughout the vee width which linearly varied from zero at the vee apex to £p (T) at the open end. £p(T) is determined based on previous studies of the effects of temperature on the yield stress and modulus of elasticity of steel. Equation 2 reduces to the following at 1150°F and a load ratio of 0.323:
$ = 2 ep (T)sin(0/2)....................... (3)
The load ratio of 0.323 was determined to be the value at which "perfect confinement" exists. Perfect confinement is the condition at which thermal expansion of the vee- heated area is zero. This is achieved by applying the
maximum load ratio at which the permanent plastic strains are not assisted by any hot mechanical straightening). Equation 3 represents twice the shortening of half the open end of the vee, resulting in the plastic rotation (for a detailed derivation see Avent and Fadous 1988).
The experimental data obtained by Roeder and Boudreaux were well represented by Equation 2, when considered together. However, Boudreaux's data values were somewhat lower than Equation 2, and Roeder's where somewhat higher. It is not clear why the two researchers had significantly different plastic rotations.
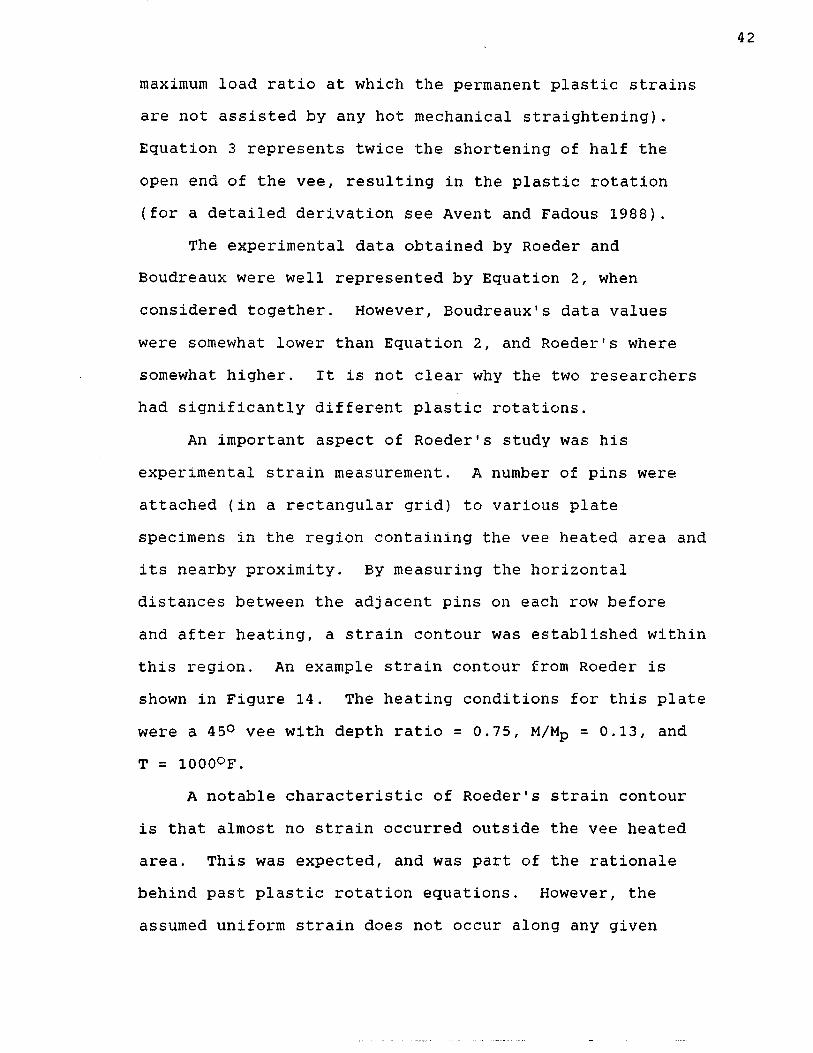
An important aspect of Roeder's study was his experimental strain measurement. A number of pins were attached (in a rectangular grid) to various plate specimens in the region containing the vee heated area and its nearby proximity. By measuring the horizontal distances between the adjacent pins on each row before and after heating, a strain contour was established within this region. An example strain contour from Roeder is shown in Figure 14. The heating conditions for this plate were a 45° vee with depth ratio = 0.75, M/Mp = 0.13, and T = 1000°F.
A notable characteristic of Roeder's strain contour is that almost no strain occurred outside the vee heated area. This was expected, and was part of the rationale behind past plastic rotation equations. However, the assumed uniform strain does not occur along any given

Center of Heated Area is Approximate Line of Symmetry
0.004
0.001
Heated Area (1000°F)0.002
0.0000.010
Longitudinal strain
Figure 14. Experimental strain contour (from Roeder 1985)

44
horizontal line (for example, the lower edge of the plate). Since Roeder presented only one example strain distribution, it is difficult to draw many conclusions, especially in regards to the accuracy of the values themselves. It should be noted that the plastic rotation and strain values in this particular example were extremely high compared to the analytical equations used at that time. However, it can be concluded that the general shape of the contour is relatively representative of typical strains, assuming the measurements were accurate.
It can be seen in Figure 15 that the majority of the deformation in the open end of the vee occurs approximately within the inner two thirds of the heated region. Thus, assuming that the value of £p(T) reasonably represents the strain at the center line (and it should), it is reasoned that an "effective" vee angle ( 0 e = 2/3 )should be used in Equation 2 to more accurately predict plastic rotations, thus
<|> = [0.5 + 0.00125(T-750) ] (0.9 + 3.4 M/Mp ) £ p (T) sin(0e/2)............................................................. (4a)
which is simply
<[> = [0.5 + 0.00125(T-750) ] (0.9 + 3.4 M/Mp ) £p (T) sin(0/3) ............................................................. (4b)

Roeder's Strain DistributionTheoretical Strain (Constant)
Maximum Strain
CDN■ rH
D ista n ce F rom C enter Line (B o t to m Edge)
Figure 15. Strain at open end of vee (derived from Roeder 1985)
cn

Equation 4b represents the experimental data in the current study very well. A comparison of experimental values and the theoretical curves from the previous equation (Equation 2) and the modified equation (Equation 4b) are shown in Figures 16 and 17 for two different load ratios. Clearly, the data closely match the newer equation better than the old one. Also shown are data from Boudreaux and Roeder. Boudreaux's data are also actually better represented by the modified equation than by the old one. Roeder's values are extremely high. Although few in number in these plots, Roeder's large number of heats at lower load ratios drastically affected Boudreaux's equation.
A least squares curve fit of the data represented by Figure 16 (see Appendix II) revealed the best effective angle to be approximately 30 degrees, when keeping the equation in the same form as Boudreaux's. This angle is 66 percent of the actual vee angle of 45 degrees. In other words the effective angle would be 30/45 x 0, or 0.66 0 , which agrees very closely with the Equation 4b.
From Figure 17, it is apparent that for an angle up to about 20 degrees (which is the smallest practical vee angle), the Boudreaux equation would be sufficient to represent the data. However, within the more practical range between 20 and 60 degrees, the modified equation would be more applicable. This makes sense, because the old equation, which is basically linear (within the

Plastic
Rotation
(rad
x 10
E-03
) 12-i OOOOO Weighted Averages of New Data (149 Heats Total) Boudreaux's Plastic Rotation Equation
Modified Plastic Rotation Equation□□□□□ Boudreax's Data for Undamaged Plates (18
1 0 -
Heats Total)
9 -
8 -
7 -
6 -
5 -
4-
3 -
2 -
Temperature = 1200°F Load Ratio = 0.50
30 40 50 60 70 80 9010 200Vee Angle (Degrees)
Figure 16. Comparison of old and new data with Boudreaux's equationand the modified equation (1200°F, M/Mp = 0.5)
it*

Plastic
Rotation
(rad
x 10
E-03
) 12-1OOOOO Average of N ew Data (129 Heats) □□□□□ Boudreaux's Data (Total of 46 Heats) a a a a a Roeder's Data (Total of 5 Heats) Boudreaux's Plastic Rotation Equation Modified Plastic Rotation Equation1 0 -
9 -
0 -
7 -
6 -
5 -
4 -
3 -
2 -
Temperature = 1200°F Load Ratio = 0.25
10 20 30 500 40 60 70 80 90Vee Angle (Degrees)
Figure 17. Comparison of old and new data with Boudreaux's equation and the modified equation (1200°F, M/Mp = 0.25)
00

practical range of vee angles) does not take into account the fact that the relationship between vee angle and plastic rotation in the range of large vee angles does not follow the same linear relationship. In fact, other research has indicated that the amount of increase in plastic rotation with vee angle, tends to decrease in the range of larger vee angles (Avent and Fadous 1988), although this fact was not specifically made apparent.This trend in plastic rotations at increasingly large vee angles is influenced by the nonuniform strains, exhibited by Roeder's strain contour. The nonuniformity is not as significant in the smaller angles, where the heating pattern is more concentrated.
Another cause of the efficiency decrease with increase in angle is simply the vee heating concept itself coupled with the plate geometry. For example, consider the plate shown in Figure 18. Shown are a number of vees increasing from zero to 180 degrees (where the entire plate would be heated for a full depth vee). At zero and 180 degrees, vee heats produce no plastic rotation. Thus, for a continuous curve to exist for vee angle vs. plastic rotation, there must be an increase in plastic rotation from zero degrees to some "optimum" vee angle where the maximum plastic rotation can exist. This vee angle is represented by the dotted lines on Figure 18. It is not important to know exactly what the value of this angle is, because it is well above the practical range of vees.

50
£
Optimum Vee Angle
Figure 18. Increasing vee angles from 0 to 180° with "optimum angle" shown
51
Once the modified equation for plastic rotation was established, it was desirable to see how it compared to all of the data, previous and present. Table 8 shows Boudreaux's, Roeder's and the current data, along with computed values from Boudreaux's and the modified equations, for a wide range of heating conditions.Boudreaux's data averaged approximately 15% lower than the original equation, and the total average plastic rotations of the damaged plates clearly are better represented by the modified equation. Obviously from Table 8, the original plastic rotation equation was influenced greatly by Roeder's high values.
It is likely that the residual stress distribution has some influence on the fact that the plastic rotations are greater during the first three heats on a damaged specimen. In the study of residual stresses, it was found that the stress distribution in a straight plate heated four times was similar to that in a damaged plate, regardless of the number of heats that were applied to straighten it (see section on residual stresses in this chapter). Therefore it is apparent that after, at most, four heats, the residual stresses "stabilize", as do the plastic rotations (when considering average values). It should be noted that the trend of higher plastic rotations in the initial three heats was also observed in the study of damaged wide flange beams and damaged full-scale simulated bridge girders.

Table 8. Comparison of plastic rotation data from various studies.
vee M/Mp
Plastic RotationsRoeder * E qn. 3 Boudreaux Damaged
1st 3 AvgEqn (4b)
20 0 ____ 1. 23 1.26 .... .... 0.8220 .25 ---- 2.41 1.74 ---- --- 1.6120 .50 --- 3.57 3 .69 4 . 29 3.41 2 .3845 0 ---- 2.73 2.51 --- 1. 8445 .25 8.72 5.30 2.47 2.88 3.96 3.5845 .50 ---- 7 .87 7 .13 11.28 5.58 5 .3260 0 6.98 3 .56 2.53 .... .... 2 .4460 .25 8.55 6 .93 4.28 --- 4.7460 . 50 --- 10.30 6.57 8. 10 6.56 7 .0382 0 ---- 4.67 3 .43 --- ---- 3.2782 . 25 10.47 9.08 6.25 --- ---- 6.3682 .50 — _ _ ~ 13.50 12.68 ---- _ _ _ _ 9.45
*Note : All of Roeder ' s vee heats had depth ratios ofeither 0.67 or 0. 75, and all of his values were extremelyhigh. Some of Roeder's values are for temperatures lowerthan 1200°F For example the average value! of 8.72milliradians for the 45 degree vee (M/Md =0. 25) includesone value of 8.20 obtained at 975°F and a depthratio of 0. 67 .
While temperature, load ratio, and vee angle are included in Equation 4b, the depth ratio dv /w is not. In previous research (Weerth 1971), statements have been made that depth ratio would significantly affect the plastic rotations, keeping all other parameters constant.However, not enough data was available to verify this statement. A study was undertaken here to obtain adequate data for two depth ratios, 1.00 and 0.75. The heating temperature was 1200°F and the load ratio was 0.5 in all cases. Only the vee angle was varied. Shown in Figure 19

Plastic
Rotation
(radians
x 10
E—03)
Temp = 1200°FLoad Ratio (M/Mp) = 0.50 20 Heats
20 Heats21 Heats6 -
5-48 Heats
20 Heats
20 Heats3 -
2 - b dooq D ep th R atio = 0 .75 M A M D ep th R atio = 1.00 W eighted Avg. o f a l l Data
20 500 10 30 40 60 70Vee Angle (Degrees)
Figure 19. Comparing the effect of depth ratio on plastic rotations for20-, 45-, and 60-degree vee heats on damaged plates
Ulu>
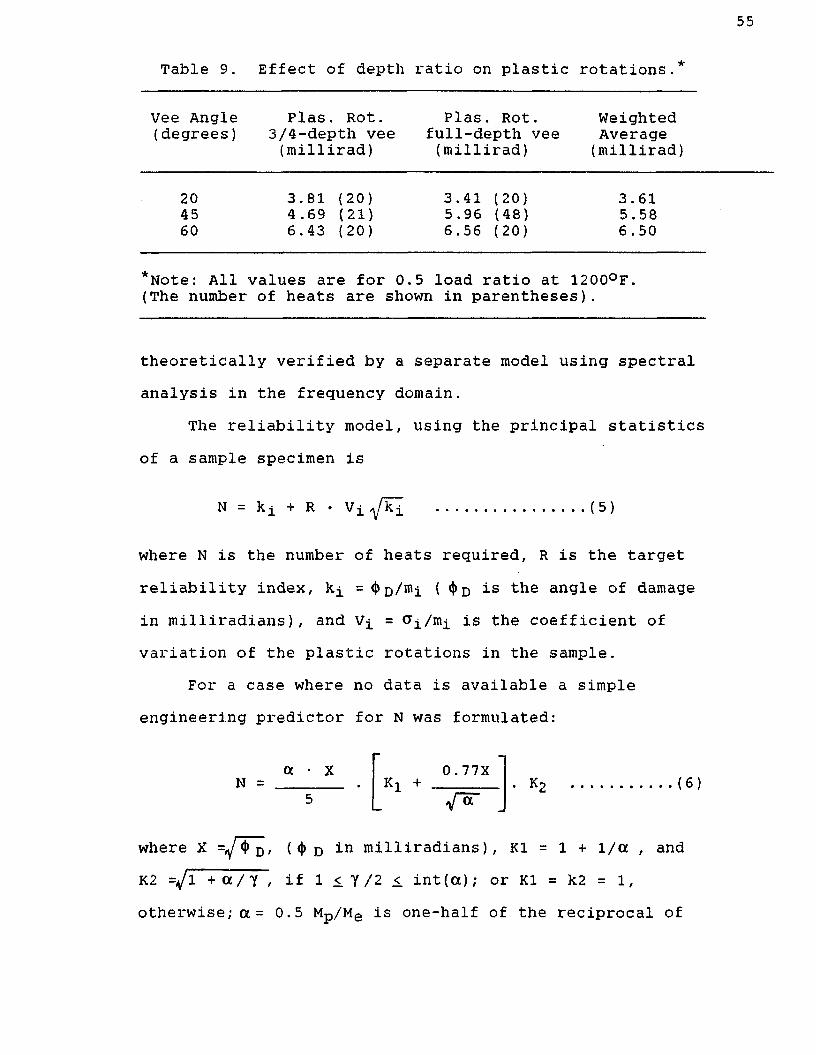
are plastic rotations for 20-, 45-, and 60-degree vees for both 0.7 5 and 1.00 depth ratios. As is evident, vee depth ratios of 0.75 and 1.00 do not differ significantly.Thus, within this range of depth ratios, there is no need to account for vee depth in the equation. Weighted averages (with respect to the number of heats) of the data represented by Figure 19 are presented in Table 9.
Statistical Study of Plastic RotationsThe primary purpose of predicting plastic rotations
is to determine the number of heats required to straighten a given damaged specimen. If the total damage were divided by the average plastic rotation, an estimate of number of heats would be obtained. However, statistically speaking, it is more desirable to know the reliability behind such predictions. Because of the random nature of plastic rotation as a variable, using the simple average does not indicate reliability.
To achieve statistically reliable predictions, a detailed study of the experimental plastic rotations was conducted (deBejar, et. al 1991) using the author's data. Simple engineering predictors based on the linearized theory of reliability were derived using the uniform value of a preselected target reliability index. Two different forms of the predictor were formulated, based on whether or not the principal statistics of the process for the subject specimen are known. These models were
55
Table 9. Effect of depth ratio on plastic rotations.
Vee Angle Plas. Rot. Plas. Rot. Weighted(degrees) 3/4-depth vee full-depth vee Average
(millirad) (millirad) (millirad)
20 3.81 (20) 3.41 (20) 3.6145 4.69 (21) 5.96 (48) 5.5860 6.43 (20) 6.56 (20) 6 .50
*Note: All values are for 0. 5 load ratio at 1200°F.(The number of heats are shown in parentheses) •
theoretically verified by a separate model using spectral analysis in the frequency domain.
The reliability model, using the principal statistics of a sample specimen is
N = k ± + R Vi^I (5)
where N is the number of heats required, R is the target reliability index, =<l>D/mi ( <|>d is the angle of damage in milliradians), and is the coefficient ofvariation of the plastic rotations in the sample.
For a case where no data is available a simple engineering predictor for N was formulated:
N = a Kx + 0.77Xfar J k 2 (6 )
where X =*J§ n, ( <J> d in milliradians), K1 = 1 + 1/a , and K2 =tjI + a / 7 , if 1 <.7/2 <. int(a); or K1 = k2 = 1, otherwise; a = 0.5 Mp/Me is one-half of the reciprocal of

56
the load ratio; Y is the closest integer representing the number of times that 6-degrees (104.72 milliradians) is contained in specified damage angle, <J> D ; and int is an operator returning the integer part of a real number.
Equation 6 was slightly modified for plate XXV-8 (due to its 0.75 depth ratio), although it has been shown above that, in general, there is no significant difference in the plastic rotations for this depth when compared to full depth vees. The modification yielded the following equation:
5 xN = _____ . (1 + 0.77 5X) (7)2
where 8 = 0.7 5 is the vee depth ratio.Table 10 shows the results of the study when compared
to the actual number of heats required to straighten the plates. It should be noted that numbers are slightly greater than the actual number of heats applied to the experimental plates because, in all cases, the plates would have required about two more heats to be completely straightened. Shown in Table 10, the values for each of the analytical models were close to each other, and with the actual number of heats. Also shown is the number of heats required if every heat produced the exact value computed by the most recently modified plastic rotation equation (Equation 4b). In all but one case (XXV-7), the newly modified plastic rotation equation has excellent agreement

57
Table 10. Comparison of deBejar's results with modified equation.
Number of heats required to straighten the specimen.Reliability Spectral Modified Actual
Theory Analysis Equation N o . ofPlate Eqn. 6 Eqn. 5 (4b) Heats*
XXV-3 XXV-4 XXV-5 XXV-6 XXV-7 XXV-8
2912517466727**
2912315446626
3012416456527
3312219418421
2510815386023
*Adjusted for complete straightening using average of allplastic rotations for that specimen.**Equation 7 was used instead of Equation 6.
with deBejar's values. It should be noted that the data for plate XXV-7 seemed to be out of step with the rest of the plates, possibly due to faulty readings on the pressure gauge on the hydraulic cylinder.
Residual StressesAverage residual stresses were determined by the
sectioning method for three different regions on the damaged plates: Regions A, B, and C (see Figure 20). In studying the residual stresses of the plates after straightening, the following observations were made:
1. By classifying the plates in groups of small degree of damage (angle of damage = 6 degrees) and large degree of damage (angle of damage = 12 to 24 degrees),

Center of Damage
4"1311 1210
45
/ \
3.31
Figure 20. Regions A, B, and C for residual stress measurements

these two groups experienced slightly different residual stress patterns. These classifications are logical when considering strains, with the small degree of damage classification exhibiting approximately 30 times yield strain, and the larger degrees of damage 80 to 100 times yield strain. The less damaged plates experienced larger stresses in region B, and lower stresses in regions A and C, when compared to the more damaged plates, where the stresses were relatively uniform (for each strip) in all three regions (see Figures 21 through 23). This is probably a result of a more uniform strain distribution caused by the spreading of the yield zone. Values for the two separate categories are shown in Tables 11 through 14. The stresses were computed at using (1) the commonly assumed value of E = 29,000 ksi for modulus of elasticity (at Regions A, B, and C), and (2) the measured values obtained from the tensile tests (at Region B only) (see section on material properties). It should be noted that some of the gage holes were destroyed in the stripping process, thus rendering the strips unreadable. Stress distributions for each individual plate are shown in Appendix III.
2. As in the undamaged plates, load ratio and depth ratio, individually have no apparent effect on the residual stress patterns. It is likely that the same effects of vee angle on residual stresses found for the undamaged plates can be applied to the damaged plates. In that

Stri
p N
um
ber
05
oo
o
CO
\o
co
CvJ
o-50 -40 -30 -20 -10 0 10 20 30 40 50Residual Stress (KSI)
Figure 21. Residual stress distribution for Region B (estimatedmodulus of elasticity of 29,000 ksi)
Damaged Plates (Region B)Dam aegrees
24 De g. Da

Stri
p N
um
ber
Damaged Plates (Region B)Dama
2. Daegrees 24 De
0 050 -40 -30 -20 - 20 30 40 50Residual Stress (KSI)
Figure 22. Residual stress distribution for Region B (moduli ofelasticity from tensile test results)
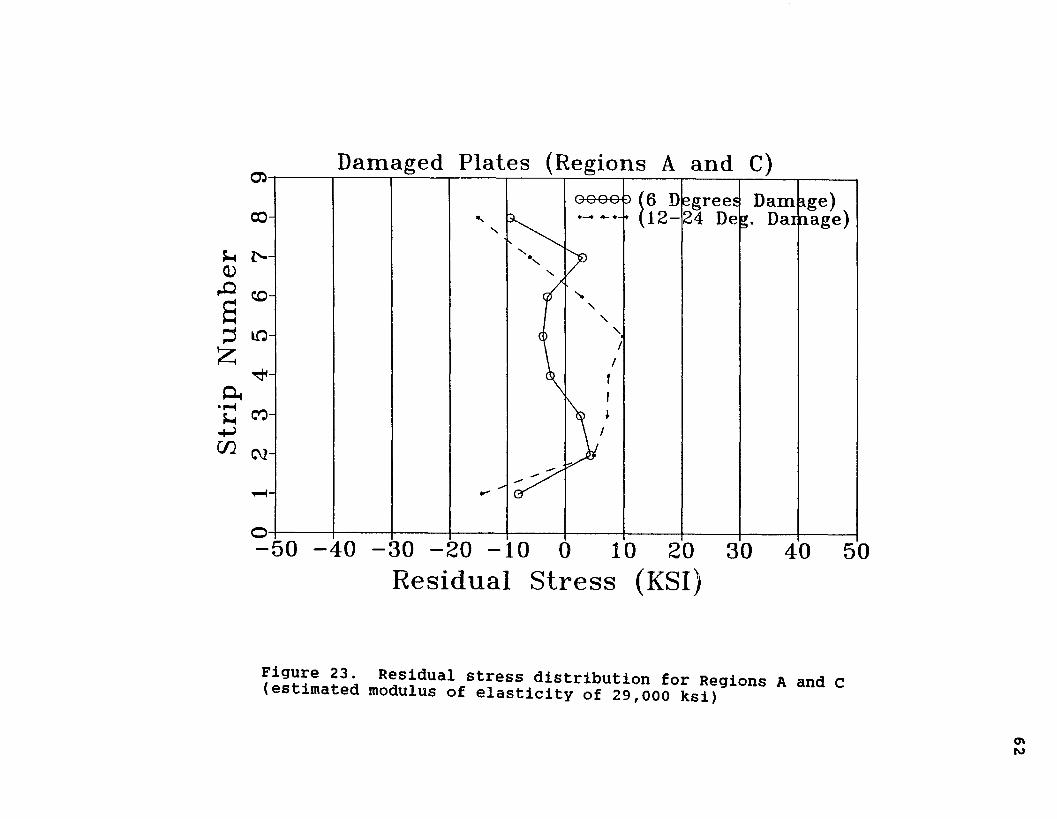
Stri
p N
um
ber
05
00
F-
50
ID
CO
CM
-*-■4
-50 -40 -30 —20 -10 0 10 20 30 40 50Residual Stress (KSI)
Damaged Plates (Regions A and C)Dama
Daoe-0-e egrees
24 De
Residual stress distribution for Regions A and c(estimated modulus of elasticity of 29,000 ksi)
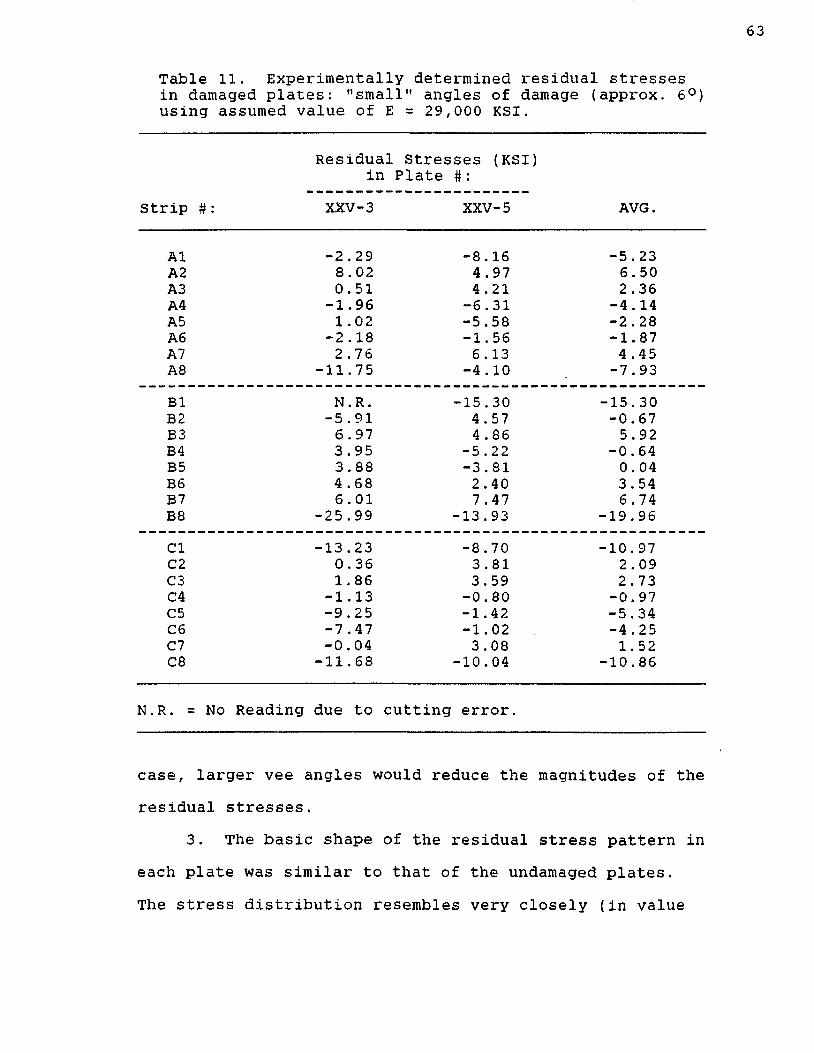
Table 11. Experimentally determined residual stressesin damaged plates: "small" angles of damage (approx. 6°)using assumed value of E = 29,000 KSI.
Strip #:
Residualin
XXV-3
Stresses (KSI) Plate #:
XXV-5 AVG.
A1 -2 . 29 -8.16 -5.23A2 8.02 4.97 6.50A3 0.51 4.21 2.36A4 -1.96 -6.31 -4.14A5 1.02 -5 .58 -2.28A6 -2 .18 -1. 56 -1.87A7 2 .76 6.13 4 .45A8 -11.75 -4.10 -7 . 93B1 N.R. -15.30 -15.30B2 -5.91 4.57 -0.67B3 6.97 4 .86 5.92B4 3.95 -5.22 -0.64B5 3.88 -3.81 0.04B6 4 .68 2 .40 3.54B7 6.01 7 .47 6 . 74B8 -25 .99 -13.93 -19.96Cl -13 . 23 -8.70 -10.97C2 0.36 3.81 2.09C3 1 .86 3.59 2 . 73C4 -1 .13 -0.80 -0. 97C5 -9.25 -1.42 -5.34C6 -7 .47 -1.02 -4.25Cl -0 .04 3 .08 1.52C8 -11.68 -10.04 -10.86
N.R. = NO Reading due to cutting error.
case, larger vee angles would reduce the magnitudes of the residual stresses.
3. The basic shape of the residual stress pattern in each plate was similar to that of the undamaged plates.The stress distribution resembles very closely (in value
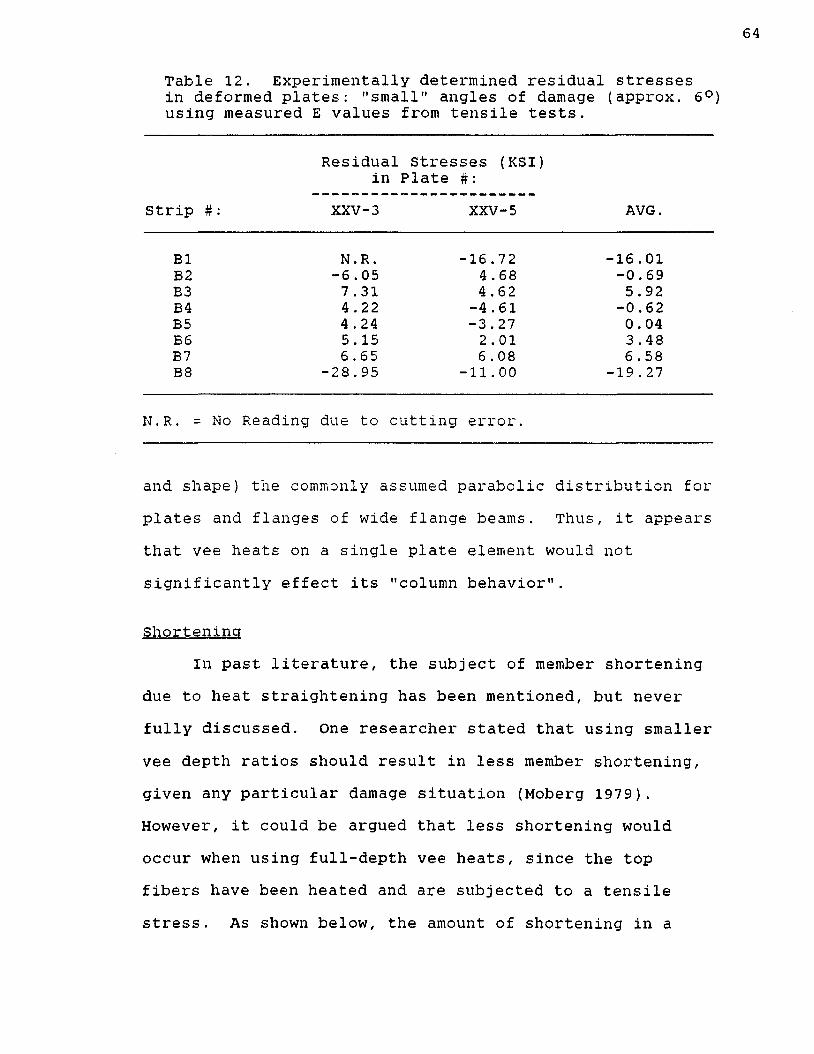
Table 12. Experimentally determined residual stressesin deformed plates: "small" angles of damage (approx. 6°)using measured E values from tensile tests.
Residual Stresses (KSI)in Plate #:
Strip #: XXV-3 XXV-5 AVG.
B1 N.R. -16.72 -16.01B2 -6.05 4.68 -0.69B3 7.31 4.62 5.92B4 4.22 -4 .61 -0.62B5 4 .24 -3.27 0.04B6 5 .15 2.01 3.48B7 6.65 6 .08 6 .58B8 -28.95 -11.00 -19.27
N.R. = NO Reading due to cutting error.
and shape) the commonly as sumed ;parabolic distribution forplates and flanges of wide flange beams. Thus, it appearsthat vee heats on a single plate element would notsignificantly effect its "column behavior If
ShorteningIn past literature, the subject of member shortening
due to heat straightening has been mentioned, but never fully discussed. One researcher stated that using smaller vee depth ratios should result in less member shortening, given any particular damage situation (Moberg 1979). However, it could be argued that less shortening would occur when using full-depth vee heats, since the top fibers have been heated and are subjected to a tensile stress. As shown below, the amount of shortening in a

Table 13. Experimentally determined residual stressesin deformed plates: "large" angles of damage (12° to24°) using assumed value of E = 29,000 KSI.
Residual Stresses (KSI)Strip #: XXV-4 XXV-6 XXV-7 AVG
A1 -18.41 -7.14 -22.23 -15.93A2 3 .30 8.23 4.79 5.44A3 7.03 4 .10 10.73 7 .29A4 8.52 1.67 14.54 8.24A5 12.00 0.69 23.96 12.22A6 7 .83 -1.63 8.88 5 .03A7 N.R. N.R. N.R. N.R.A8 N.R. N.R. N.R. N.R.B1 -11.71 -17.47 -15.19 -14 .79B2 3.59 7 .36 4 .03 4.99B3 4 .06 3 .01 10.66 5.91B4 5 . 58 12 . 15 10.00 9.24B5 9 . 21 6.41 8.63 8.08B6 4 . 13 N.R. -1.41 1.71B7 -4.68 N.R. N.R. -4.68B8 N.R. N.R. N.R. N.R.Cl -14.29 -9 . 28 -15.41 -12.99C2 4 . 10 3 .19 5.66 4 .32C3 6.09 1.31 13.77 7.06C4 7 .40 1 .60 10.66 6.55C5 10. 12 3.26 9.28 7 .55C6 6.45 -3 .34 -0 .87 0.75C7 N.R, N.R. N.R. N.R.C8 N.R. N.R. N.R. N.R.
N.R. = No Reading due to cutting error.
member can be quite significant, regardless of the vee depth ratio used.
Figure 24 shows the author's concept of the shortening phenomenon. First, one has a plate of given length. If the plate is damaged about its strong axis with a midpoint loading as shown, the top edge of the

Original Plate Length
Top Length (After Bend)
• Final Plate Length — (After straightening)
Figure 24. Representation of shortening resulting from damage/repair cycle
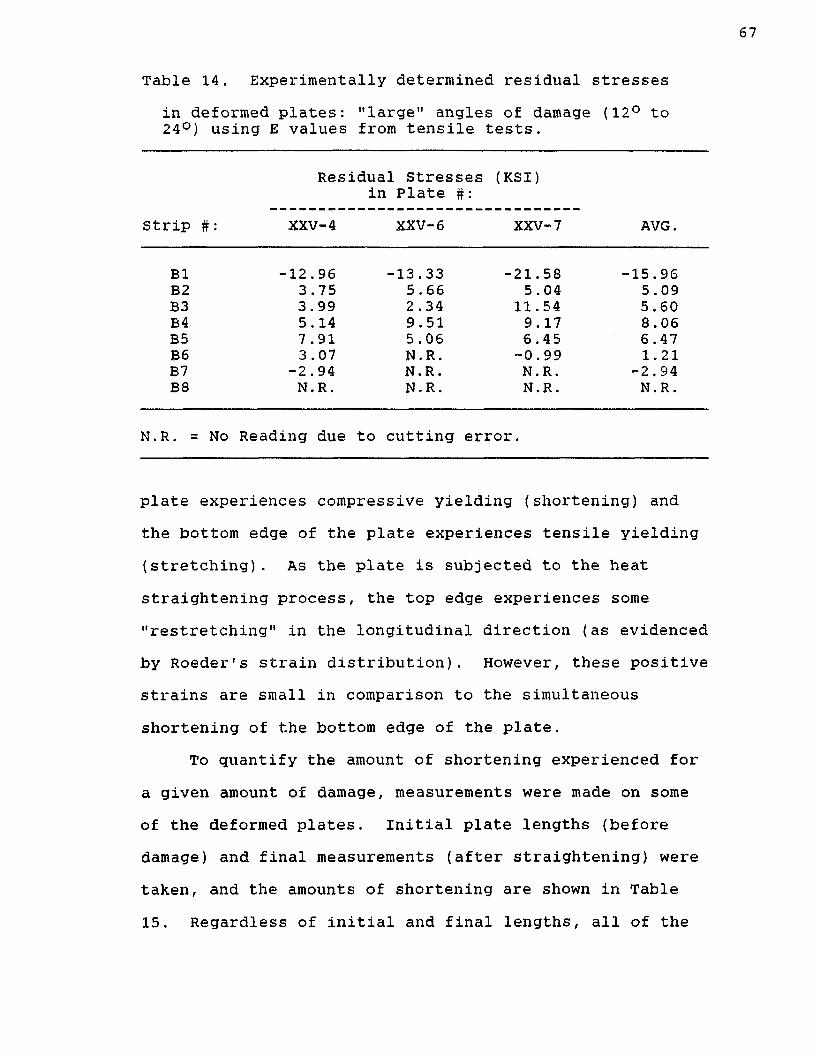
67
Table 14. Experimentally determined residual stressesin deformed plates: "large" angles of damage (12° to 24°) using E values from tensile tests.
Residual Stresses in Plate #:
(KSI)
Strip #: XXV-4 XXV-6 XXV-7 AVG.
B1 -12 .96 -13 .33 -21.58 -15.96B2 3.75 5.66 5 .04 5 .09B3 3.99 2 .34 11.54 5.60B4 5.14 9.51 9.17 8.06B5 7.91 5.06 6.45 6.47B6 3.07 N.R. -0.99 1.21B7 -2 .94 N.R. N.R. -2.94B8 N.R. N.R. N.R. N.R.
N.R. = No Reading due to cutting error.
plate experiences compressive yielding (shortening) and the bottom edge of the plate experiences tensile yielding (stretching). As the plate is subjected to the heat straightening process, the top edge experiences some "restretching" in the longitudinal direction (as evidenced by Roeder's strain distribution). However, these positive strains are small in comparison to the simultaneous shortening of the bottom edge of the plate.
To quantify the amount of shortening experienced for a given amount of damage, measurements were made on some of the deformed plates. Initial plate lengths (before damage) and final measurements (after straightening) were taken, and the amounts of shortening are shown in Table 15. Regardless of initial and final lengths, all of the

68
Table 15. Shortening of plates as a result of heat straightening.
Plate # Damage (rad) Damage (deg) Shortening (in.)
XXV-8 0.1045 5.99 0.080XXV-6 0.2059 11.80 0.175XXV-7 0.3276 18.77 0.310XXV-4 0.4122 23.62 0.550
shortening occurs only within the damaged region (meaning shortening should not be expressed as a percentage of total length, but simply as a length itself).
A plot of shortening vs. degree of damage is shown in Figure 25 for the plates with a depth of 4 inches. As seen in the plot, shortening varies quite directly with degree of damage up to a certain point, somewhere between 18 and 24 degrees, for the specimens studied. With only 4 specimens, conclusions concerning the shortening phenomenon are tentative. However, shortening appears to be a function of plate depth (since strain will vary with plate depth for a given angle of damage). The shortening is also affected by the angle of damage itself, but does not vary with vee depth ratio, at least in the 0.75 to 1.00 range. The amount of shortening in Plate XXV-8 was about the same as for all of the deformed beams (see Chapter VI), in which the same amount of damage was experienced and 3/4-depth vees were also used. All of the specimens with 3/4-depth vees seemed to follow the same trend of shortening exhibited by those heated with

Shor
teni
ng
(in
ches
)0.6
0.5 where S = shortening in inches,<bD = angle of damage in degrees.
W = plate depth
0.4
0.3
0.2
0.05 10 15 200 25
Angle of D am age (D egrees)
Figure 25. shortening vs. angle of damage in plate elements

full-depth vees. A preliminary formula for estimatingshortening (based only on the four plates in Table 15) is
S = W * (0.02 <}> D ) for 0 < A < 24° ........(8)
where S = shortening in inches.<|>D = angle of damage in degrees.W = plate depth (width).
Redistribution of MaterialAs a result of shortening, the heated portions of the
deformed plates thickened upon straightening. This fact becomes especially important in influencing future damage (if any) of the plate, as discovered in the study of deformed beams (see Chapter VI). After the residual stress strips were cut from each plate, it became very easy to measure thicknesses at various locations along each strip. Thicknesses at a total of five points (see Figure 26) on each of the eight strips were measured to the 1/1000" using dial calipers. The measured thicknesses at the various points are presented in Appendix IV.
Thickening was greatest for the plates damaged to the largest degrees. For example, in Plate XXV-4, the specimen with the greatest amount of damage (23.62°), the thicknesses (measured for each strip) along the center of damage averaged 0.655 inches. When compared to the average thickness of the plate before damage (0.495 inches), the thickening results in a 32 percent increase in cross-sectional area. At points further away from the

C.L. ofDamage
50"
aa ee6 « 1 "
Figure 26. Points used to measure thickening in plates repaired by heat straightening

72
center of damage, thickening is less pronounced, but, nevertheless, some thickening occurs within all of the yield zone. With a thicker cross-section meaning a stronger member, it is likely that little significance should be placed on the thickening experienced.
Material PropertiesTensile tests were conducted on specimens taken from
plates XXV-3 through XXV-8 to determine yield strength, tensile strength, percent elongation, and percent reduction in area, and modulus of elasticity. For each plate, specimens were taken from the heated area at the top (strip 1 or 2), middle (strip 4 or 5), and bottom (strip 7 or 8) of the vee, and from an unheated region of the same plate (strip UH) , to compare the before and aftereffects of the damage/straightening process on the tensile properties.
Tables 16 and 17 show the specimen properties found in the tensile tests. For each plate, consistent values were found for all of the unheated tensile specimens. For the heated specimens, a significant increase in yield stress occurred (most notably at the top of the vee) over the unheated specimens, although the tensile strengths exhibited only slight increases. Significant reductions in percent elongation (an indication of ductility) occurred in all of the specimens.

Table 16. Material properties of damaged plates.
Specimen/Strip
YieldStress(ksi)
MaximumStress(ksi)
Percent*Elong.
Percent Red. in Area
XXV-3 (UH) 46.8 68.7 45 58XXV-3 1 51.7 70.5 33 46XXV-3 5 49.8 70.6 38 60XXV-3 7 50.0 70.3 39 60XXV-4 (UH) 48.7 71.7 41 56XXV-4 2 52.3 71.2 30 62XXV-4 5 51.9 71.9 31 60XXV-4 7 51.7 69.7 34 64XXV-5 (UH) 45 .1 72.4 42 57XXV-5 1 55.4 73.6 30 60XXV-5 4 51.1 72.6 41 58XXV-5 8 48.3 71.2 36 57XXV-6 (UH) 43.9 66.5 46 60XXV-6 2 52 .0 68.4 34 63XXV-6 5 48.3 68.8 36 60XXV-6 7 47 .0 69 .0 36 60XXV-7 (UH) 46.9 69 . 6 43 59XXV-7 2 50.0 70.7 32 57XXV-7 5 46.0 67.9XXV-7 8 43 .7 67 .6 35 65XXV-8 (UH) 42.3 69 . 0 41 58XXV-8 2 60.1 75.6 28 51XXV-8 4 48.6 71.7 35 59XXV-8 8 50.9 70.7 34 56Rates of strain = 0.4545
= 1.0714in/in per in/in per
minute up minute up
to yield to failure
* 1-inch gage length.
Only three references mention anything about the effects of heat straightening on modulus of elasticity (Weerth 1971; Nicholls and Weerth 1972; Horton 1973), and these references implied that single vee heat applications
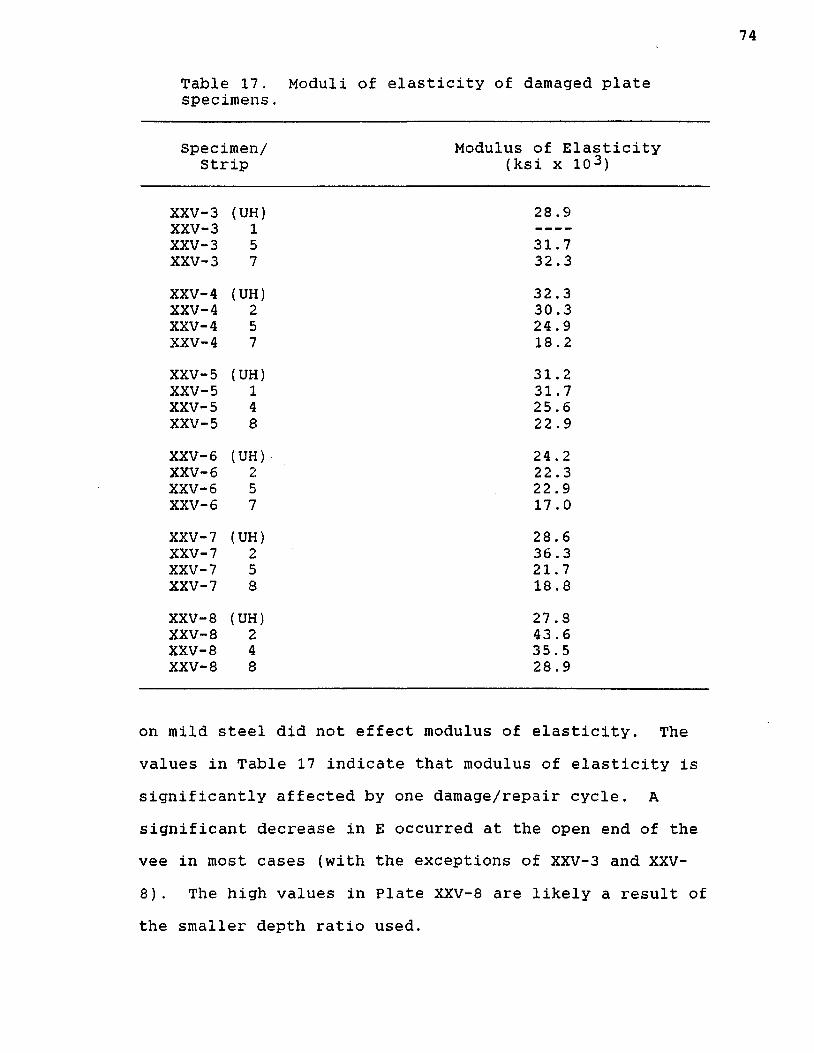
Table 17. Moduli of elasticity of damaged plate specimens.
Specimen/Strip
Modulus of Elasticity (ksi x 103)
XXV-3 (UH) 28.9XXV-3 1 ----XXV-3 5 31.7XXV-3 7 32.3XXV-4 (UH) 32.3XXV-4 2 30.3XXV-4 5 24 .9XXV-4 7 18.2XXV-5 (UH) 31.2XXV-5 1 31.7XXV-5 4 25.6XXV-5 8 22.9XXV-6 (UH) 24.2XXV-6 2 22.3XXV-6 5 22 .9XXV-6 7 17.0XXV-7 (UH) 28.6XXV-7 2 36.3XXV-7 5 21.7XXV-7 8 18.8XXV-8 (UH) 27 .8XXV-8 2 43.6XXV-8 4 35.5XXV-8 8 28.9
on mild steel did not effect modulus of elasticity. The values in Table 17 indicate that modulus of elasticity is significantly affected by one damage/repair cycle. A significant decrease in E occurred at the open end of the vee in most cases (with the exceptions of XXV-3 and XXV- 8). The high values in Plate XXV-8 are likely a result of the smaller depth ratio used.

Modulus of elasticity is a property used for determining residual stresses and deflections in members as well as the critical buckling load in columns. All of these factors should be taken into account in the analysis of a heat-straightened member.
An important observation is that the changes in material properties resulting from the damaging and straightening processes were very similar for each plate, in spite of the vast differences in degree of damage and the number of heats applied. It appears that degree of damage does not significantly affect material properties. Therefore, for all practical purposes, the plates could all be classified together as "1st Damage/Repair Cycle" members. The topic of damage/repair cycles is discussed in further detail in Chapter VI.
By classifying the plates together, an independent samples t-test was conducted on each of the properties in Table 16 to attach a statistical significance to the effects of one damage/straightening process on these properties. This test (which is discussed in detail in Chapter VI) is an excellent method for determining the confidence level at which one can predict changes resulting from some process or event, even with a small number of samples.
Table 18 shows the confidence levels of one damage/repair cycle causing an increase (or decrease) in the particular tensile properties of a steel plate
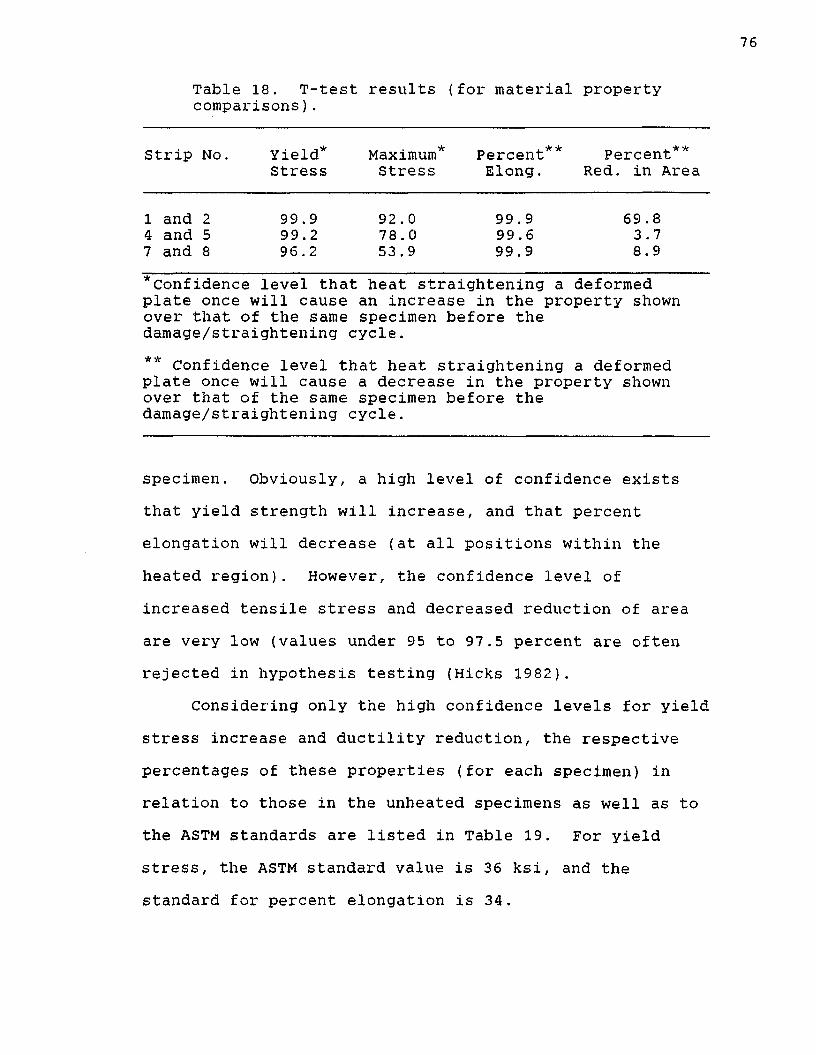
Table 18. T-test results (for material property comparisons).
Strip No. Yield*Stress
Maximum*Stress
Percent** Elong.
Percent** Red. in Area
1 and 2 99.9 92.0 99 . 9 69.84 and 5 99.2 78.0 99.6 3.77 and 8 96 . 2 53.9 99.9 8.9*Confidence level that heat straightening a deformed plate once will cause an increase in the property shown over that of the same specimen before the damage/straightening cycle.** Confidence level that heat straightening a deformed plate once will cause a decrease in the property shown over that of the same specimen before the damage/straightening cycle.
specimen. Obviously, a high level of confidence exists that yield strength will increase, and that percent elongation will decrease (at all positions within the heated region). However, the confidence level of increased tensile stress and decreased reduction of area are very low (values under 95 to 97.5 percent are often rejected in hypothesis testing (Hicks 1982).
Considering only the high confidence levels for yield stress increase and ductility reduction, the respective percentages of these properties (for each specimen) in relation to those in the unheated specimens as well as to the ASTM standards are listed in Table 19. For yield stress, the ASTM standard value is 36 ksi, and the standard for percent elongation is 34.
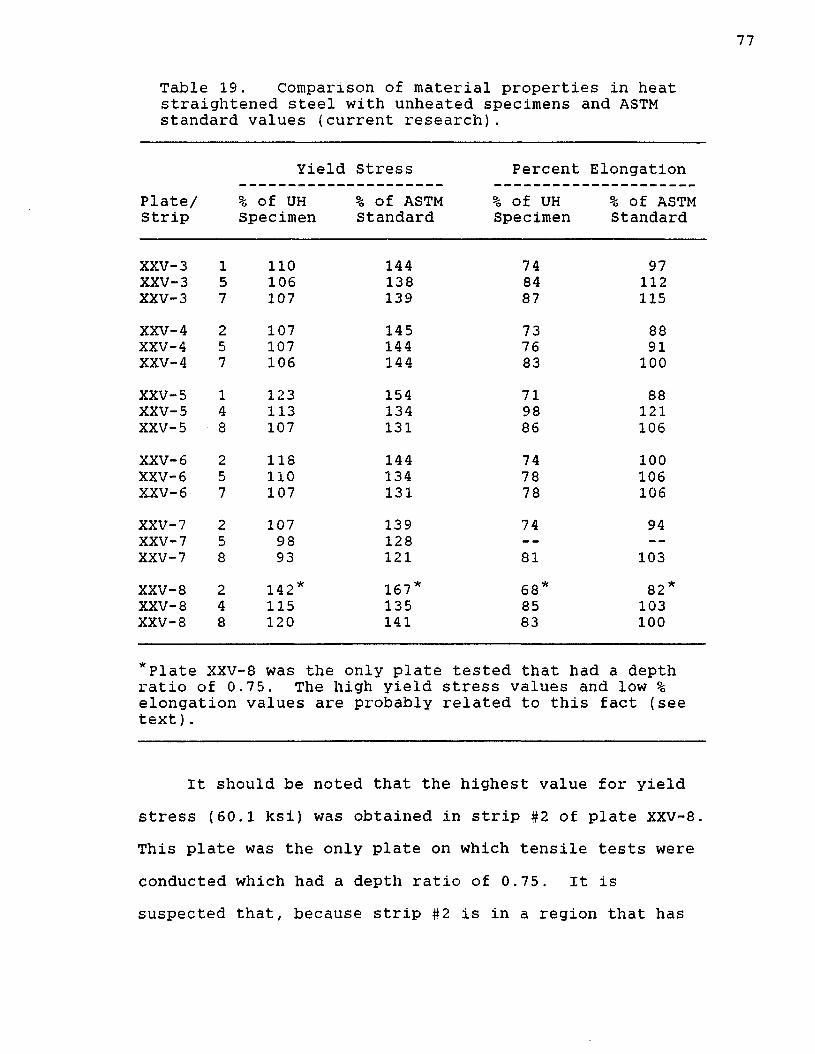
Table 19. Comparison of material properties in heat straightened steel with unheated specimens and ASTM standard values (current research).
Yield Stress Percent ElongationPlate/Strip
% of UH Specimen
% of ASTM Standard
% of UH Specimen
% Of ASTM Standard
XXV-3 1 110 144 74 97XXV-3 5 106 138 84 112XXV-3 7 107 139 87 115XXV-4 2 107 145 73 88XXV-4 5 107 144 76 91XXV-4 7 106 144 83 100XXV-5 1 123 154 71 88XXV-5 4 113 134 98 121XXV-5 8 107 131 86 106XXV-6 2 118 144 74 100XXV-6 5 110 134 78 106XXV-6 7 107 131 78 106XXV-7 2 107 139 74 94XXV-7 5 98 128 - -
XXV-7 8 93 121 81 103XXV-8 2 142* 167* 68* 82*XXV-8 4 115 135 85 103XXV-8 8 120 141 83 100
*Plate XXV -8 was the ionly plate tested that had a depthratio of 0 .75. The high yield stress values and low %elongation text) .
values are probably related to this fact (see
It should be noted that the highest value for yieldstress (60 .1 ksi) was obtained in strip #2 of plate XXV-8.This plate was the only plate on which tensile tests wereconducted which had a depth ratio of 0.75. It is suspected that, because strip #2 is in a region that has

undergone compressive deformation, but has not been directly heated, it retains more of a strain hardening effect than it would if it were contained within the vee heated area (as strip #2 is for full-depth vees). As mentioned earlier, the minor restretching effect in the upper portions of the plate (addressed by Roeder) possibly causes a cyclic hardening effect not experienced if the material is heated. This specimen alone (among the plates) experienced a significant increase in tensile strength over the unheated specimen for that plate (10 percent). It should also be noted that similar high yield and tensile stresses were experienced (near the vee apex) after the first bend in the study of repetitively damaged wide flange beams, where a depth ratio of 0.75 was also used.
A summary of tensile test results of past research is shown in Table 20 for A36 steel heated at various temperatures and configurations. A more complete summary comprising of many different steel types is shown in a previous report (Avent 1986). All of the specimens in Table 20 were initially straight (plates, wide flange sections, and plate girders). Yield stresses in the heated specimens were only slightly higher (1-3 %) than unheated specimens in the same studies, although the loss of ductility ranged from 13 to 25 percent (approximately the same range as the damaged plates in the current study). The lower yield stress increase in the undamaged

79
Table 20. Comparison of material properties of steel subjected to the heat straightening process with unheated specimens and ASTM standard values (past research).
Yield Stress Percent Elongationtemp/ heat % of UH % of ASTM % of UH % Of ASTM
type Specimen Standard Specimen Standard
1200*/vee+ 103 -- 75 --1200*/vee++ 100 -- 87 --1100-1200/vee+ 100 ■*" — 87 — ■»
1000/line** _ — , 118 _r-. 961000/line** - - 108 -- 941000/line** -- 106 -- 931000/line** -- 90 __ 961000/line** -- 97 -- 961000/line** -- 105 -- 961000/line** -- 101 -- 1001000/line** -- 97 -- 1001000/line** “■ — 100 “ ■“ 100
*Average of unspecified number of values.+Nicholls and Weerth 1972; Weerth 1971 (average of unspecinumber of specimens of heat-curved plates).++Horton 1973 (heat-curved wide flange sections) •**Brockenbrough and Ives 1970 (heat -curved girders).
specimens was probably a result of the fact that thesespecimens were never subjected to any cold bending (and thus strain hardening). It is difficult to draw any conclusions from Brockenbrough's study (using line heats), because the properties of the steel before heating are not known. As in the current study, all of the specimens

listed in Table 20 experienced only slight increases in tensile strength (a property not significantly affected by strain hardening).
Tensile Properties and FatigueThe importance of increased yield stress and tensile
strength and decreased ductility in the specimens lies in the areas of stress concentrations and fatigue. Stress concentrations often occur around discontinuities in structural members, such as holes, fillets, notches, and the like (Barsom and Rolfe 1987). Structural designers usually rely on the ductility of the material to redistribute the load around a mild stress concentration, hence ignoring the effects of the stress concentration. However, a decrease in ductility allows for less stress redistribution, thus causing the higher stresses to remain concentrated.
Fatigue life is the total number of cycles (load fluctuations) required at a certain stress level to cause the initiation and propagation of cracks to a critical size. Regardless of how the cycles are classified, once above the "fatigue limit", an increase in stress means a lower fatigue life, for any given material with a given geometry, i.e. presence of notches, holes, etc. The fatigue limit is the stress at which an infinite number of cycles can theoretically be applied without fatigue.

Studies have shown that the fatigue-crack-initiation threshold in various steels is related to the yield strength as well as tensile strength (Barsom and Rolfe 1987). This threshold basically establishes an upper stress for a given notch geometry at which an infinite number of cycles can be applied without crack initiation. Equations basing the threshold on both tensile strength and yield strength have been formulated and agree well with each other for most structural steels (where the ratios of tensile to yield strengths are fairly consistent). However, the tensile to yield strength ratio was severely altered in the heat straightened plates.
In general, the fatigue-crack-initiation threshold increases with tensile as well as yield strength.However, tensile strength increases were slight in theheat straightened plates, when compared to ductility losses (9.5% vs. 32% in the "worst case" specimen 2 on Plate XXV-8). Thus, the fatigue-crack-initiation threshold, based solely on tensile strength, could possibly be exceeded by increased stress caused by the ductility loss, resulting in failure.
Like ductility, fracture toughness (a value proportional to the energy consumed during plastic deformation) decreases as yield strength increases. The ability of a particular flaw, or stress concentrator, to cause catastrophic damage depends on the fracture toughness of the material (Flinn and Trojan 1986). Thus,

it can be assumed that a 42 percent increase in yield strength (and a 32 percent loss in ductility), as in the example specimen above, would constitute a severereduction in the ability of a member (under a given set ofconditions) to resist brittle fracture.
Because the subject of stress concentrations andbrittle fracture depends on specific conditions, it isdifficult to make recommendations, without detailed analyses of these specific situations. It cannot be overemphasized that heat straightening areas of high stress concentration should be avoided when possible and only done after a sufficient analysis by a qualified engineer. However, since varying degrees of damage seemed to have similar material properties, degree of damage would not be the deciding factor on whether or not a member should be straightened in a fatigue critical area. Therefore, the suggestions made by Shanafelt and Horn for strain limitation in severe fatigue critical areas (where strain hardening was the basis) are considered only as a precautionary limits with no scientific rationale.Further study should be conducted to determine if heat straightening should be allowed for any degree of damage in the severe fatigue critical areas.
Since the effects of heat straightening on material properties, did not seem to relate to the degree of damage of plates (at least past the initial strain hardening point), Shanafelt and Horn's suggested limit of five

83
percent nominal strain (41.67 times yield strain, if assumed yield strain is 0.0012) in tension members has no basis (recall that this constitutes a fairly small angle of damage in a plate element bent about its weak axis, especially with a large plate width). It was found that a strain of at least 100 times yield can be heat straightened with little or no difference in material property changes than for much smaller strains. Thus, in areas other than fatigue critical areas, the amount of shortening that will be experienced should be the determining factor when contemplating the use of heat straightening.
ConclusionsThe study of damaged plates shows that results from
previous undamaged plate studies cannot necessarily be applied to damaged plates, especially for residual stresses and material properties. However, the relative effects of individual heating parameters on plastic rotations and residual stresses are similar in undamaged and damaged specimens. For the first time, residual stress patterns in damaged specimens are determined and compare closely with patterns commonly assumed in practice for as-rolled plate specimens. The large numbers of heats applied to the damaged plates reduce the uncertainty in plate behavior resulting from vee heats. Both deterministic and probablistic models have been presented

84
to predict the effects of plastic rotations. Thus, the ability to make reliable predictions concerning repair time has now been enhanced.
Yield stress, modulus of elasticity, and percent elongation were all found to be quite variable, even within a given plate, and should be considered before heat straightening operations begin. Some conclusions and suggestions from past research concerning damage limits on the use of heat straightening have now been experimentally verified (and modified in some cases). The results of this chapter allow engineers a more scientific approach to establishing a repair procedure for a given damage situation.
With plates being the fundamental element of structural shapes, the results of the damaged plate studies answer the basic questions concerning the straightening of more complex shapes. The following chapter is devoted to the study of heat straightening effects on angles and channels, since they are the most simple rolled shapes in terms of cross-sectional geometry. Many of the conclusions from the damaged plate studies are incorporated into the study of the angles and channels.
CHAPTER IV ANGLES AND CHANNELS
This chapter is devoted to quantifying the behavior of various rolled shapes (angles and channels), since these shapes consist of multiple plate elements, the plate equation for plastic rotation forms the basis for the extension to rolled shapes. Included are experimental data from past research on undamaged specimens (Boudreaux 1987), and current data from damaged specimens. These data will be used to verify the mathematical models. The focus will be first on plastic rotations, followed by a brief discussion on residual stresses.
With a single plate, the only damage considered is bending about the strong axis. However, with rolled shapes, bending may occur about either the strong or weak axis and still result in the individual plate elements being bent primarily about their strong axes. As such, a distinction must be made between the various types of damage. Three categories are defined and addressed in this research:
1. Category S: Denotes primary bending about the major, or "strong" axis.
2. Category W: Denotes primary bending about the minor, or "weak" axis.
85

3. category T: Denotes unsymmetrical bending thatresults in torsion, or "twisting" about the longitudinal axis of the member.
In cases where the moment of inertia is the same for either axis, the member will be classified as a Category S member. A distinction is also made between the bending elements and stiffening elements of a cross-section. The bending elements are the plate elements of the cross- section subjected to strong axis bending about their own local axes. The stiffening elements are perpendicular to the bending elements and are bent about their own local weak axes. In most cases associated with major distortion of the entire member, yielding occurs in the bending plate elements but not in the stiffening elements. When yielding occurs in the stiffening elements, it is usually associated with localized bulges, crimps and buckles about the element's minor axis. This type of damage is not addressed here.
Undamaged SpecimensIn the previous studies conducted by Boudreaux, a
number of angles and channels were subjected to the heat straightening process. These shapes are essentially the most simple rolled shapes, as they can be considered as a single plate which is in a "folded" form. The heats presented below were applied to produce Category w bending in channels and Category S bending in equal leg

angles with the "stiffening element" located at the open end of the vee (see Figure 27). The stiffening element is the leg of the angle that is not being vee heated. In the case of the channel, the stiffening element is the web.
In Boudreaux's study, it was found that when using the same heating parameters on these shapes as for the plates, much greater plastic rotations resulted. An equation to predict plastic rotations for these shapes was briefly addressed, with no in-depth look at the reasons for the larger rotations. Part of the current research involved a study of the plastic rotations of the angles and channels. The plastic rotations are shown below in Table 21 and 22 (Avent and Fadous 1988). All were heated at approximately 1200F, and had a depth ratio of 1.00.
Geometric ConsiderationsAn understanding of the basic behavior of a heat-
straightened angle or channel can be obtained by considering them as folded plates. First, the angle's shape can be related to that of the plate when considering plastic rotations. For illustrative purposes, an L4x4xl/4 angle is chosen. Assume that, if the angle is unfolded, the same heat could still be applied, though now on a single plate with approximately an 8-inch depth (see Figure 28a).
As shown in Figure 28a, the deformation at the open end of the vee heat (at the center of the plate) is given

Figure 27. Heating patterns (Category S for equal leg angle and Category w for channel) with stiffening element at open end of vee

Heated Area
*v
(a) equal leg angle
d6 is the distance from the "apex" end of the vee heated leg to the stiffening element, and is not dependent on vee depth. The value of dE varies from zero to w, depending on vee orientation (ds = w in this figure).
y/2
i-i
(b) general angle
Figure 28. "Unfolded" angle with vee and rectangular heating patterns shown

Table 21. Plastic rotations for L4x4xl/4 angles.
SpecimenHt # Vee angle
(degrees)M/Mp Plastic rot.
(millirad)
VI-1 1 20 0.00 1.742 20 0.00 1.503 20 0.00 0.98
AVG 1.41VI-2 1 20 0.25 6.21
2 20 0.25 4 .873 20 0.25 5-92
AVG 5.63VI-3 1 20 0.50 11.03
2 20 0.50 8.923 20 0.50 13.36
AVG 11.10VI-4 1 45 0.00 3 .08
2 45 0.00 3.583 45 0.00 2.83
AVG 3.16VI-5 1 45 0.25 7.88
2 45 0.25 11. 283 45 0.25 $.93
AVG 9.36VI-6 1 45 0.50 15.71
2 45 0. 50 15.963 45 0.50 16.20
AVG 15.96
an assumed value of x v . If the rotation of the entire plate were governed by this value, and assuming a linear strain distribution throughout the plate, the amount of deformation at the bottom of the plate would be 2xv .
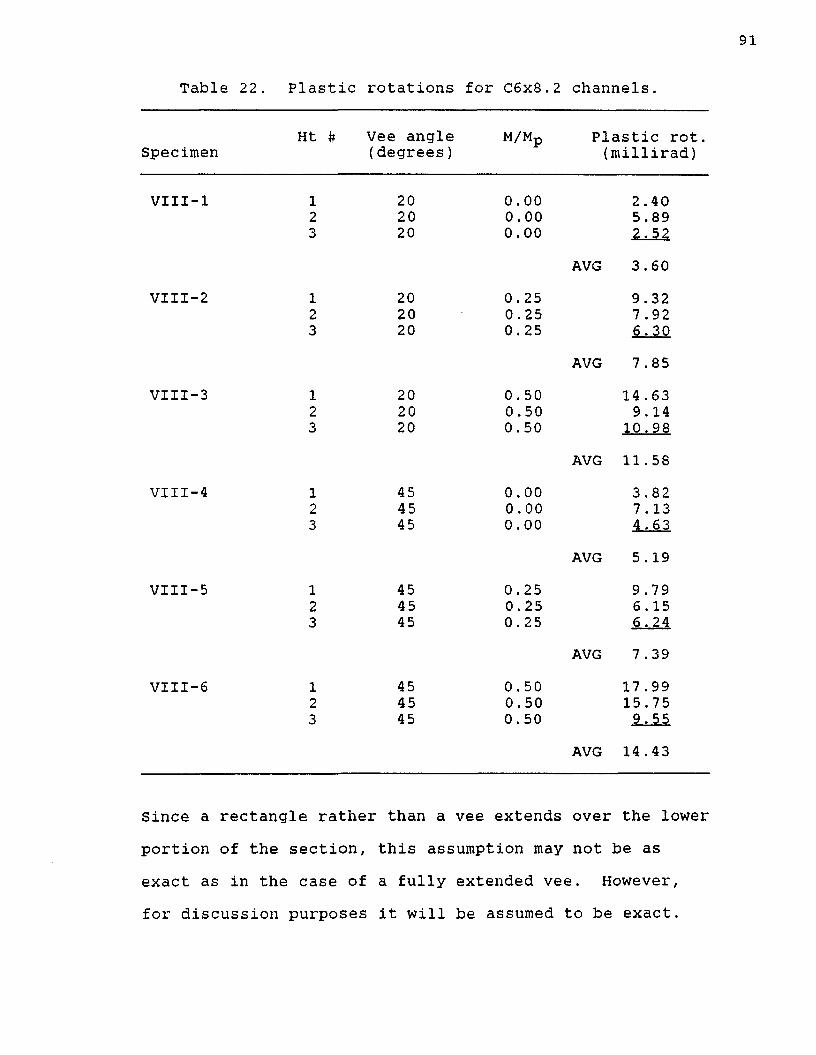
91
Table 22. Plastic rotations for C6x8.2 channels.
SpecimenHt # Vee angle
(degrees)M/Mp Plastic rot.
(millirad)
VIII-1 1 20 0.00 2.402 20 0.00 5.893 20 0.00 2-5?
AVG 3.60VIII-2 1 20 0.25 9.32
2 20 0.25 7 .923 20 0. 25 $.30
AVG 7 .85VIII-3 1 20 0.50 14 .63
2 20 0.50 9.143 20 0.50 10.98
AVG 11.58VIII-4 1 45 0.00 3.82
2 45 0.00 7 .133 45 0.00 4.63
AVG 5 .19VIII-5 1 45 0.25 9.79
2 45 0.25 6 .153 45 0.25 6.24
AVG 7.39VIII-6 1 45 0.50 17 .99
2 45 0.50 15.753 45 0.50 9.55
AVG 14 .43
Since a rectangle rather than a vee extends over the lowerportion of the section, this assumption may not be as exact as in the case of a fully extended vee. However,for discussion purposes it will be assumed to be exact.

92
With the conditions as shown in Figure 28a, the average deformation in the lower half of the plate is 1.5 xv . If this deformation were to be experienced in the stiffening element of the angle, then the amount of plastic rotation would be 1.5 times the plastic rotation of a 4-inch plate heated with the same vee. Thus, the fold in the plate element results in a magnified plastic rotation. It should also be noted that the varying strains experienced at different points in the stiffening element will produce some out-of-plane distortion (discussed in detail below).
The channel can also be "unfolded" to establish a relationship between its plastic rotations and those of a plate. Figure 29 shows the channel (C6x8.2) in its unfolded position with the heating pattern used. As shown, the channel can be considered as two angles with the vees being heated simultaneously.
Consider one half of the channel. The vee depth is 1.92 inches, thus a comparison can be made to a vee-heated 1.92-inch plate, where the assumed deformation is again designated a value, x v , at the open end of the vee. If this deformation governed the relative movement with a linear strain distribution throughout the half of the web considered (to the original web centerline), then the deformation at the centerline of the web would be equal to 2.56 xv , with the average deformation for the half of the web being 1.78 xv . With the same considerations for the

Flange Heated Area
1/2 of Web
Heated Area
1/2 of Web
Flange
Figure 29. "Unfolded" channel with vee and rectangular heating patterns shown

other half of the channel (because of the other vee heat), the average deformation in the entire web would also be 1.78 xv . Thus, to an even greater degree than the case of the angle, plastic rotations will be magnified over those of plates by the channel's folded geometry. For both the angle and channel, the experimental data will be used to determine the degree of this magnification.
Load Ratio and Stress ConsiderationsIf a load ratio is applied during the heating
process, one must consider that the stress distribution throughout the vee heat differs in an angle than it does for a plate. Figure 30 shows the cross-section of an angle, along with its major, minor, and principal axes. Since the cross-section is not symmetrical, a vertical load will produce vertical bending only if some sort of lateral restraint is used. With the neutral axis being located relatively close to the stiffening element, the case of vertical bending results in a greater percentage of a given vee heat in compression than for plates.
If no lateral restraint is provided, a vertical load will not produce just vertical bending. Thus, the simple bending formula, My/I, cannot be used to calculate stresses in the vee heated area resulting from the load. Instead, the bending formula can be utilized twice, using the components of the moment about both principal axes.The stresses at Point B (Figure 30) are shown in Table 23,

95
Point B
principal axes
Neutral Axis
Point A S
Figure 30. cross-section of a typical angle

Table 23. Stresses at Point B (at open end of vee) of an L4x4xl/4 angle.
Stress (ksi)With Lateral
M/Mp* RestraintWithout Lateral
Restraint
0.25 6.10 0.50 12.19
14 .36 28.71
*Note: Boudreaux calculated load ratio based on the use of lateral restraint, but did not use lateral restraint in the actual experiments.
for load ratios of 0.25 and 0.50. When considering no lateral restraint, as opposed to using My/I, the stresses are quite large.
The stress present in the channel is simply calculated by My/I due to its symmetrical shape (when considering weak axis bending). Because of the short distance from the neutral axis to the stiffening element (see Figure 31), the value for y (and thus stress) at any point in the stiffening element is small (only 13.18 ksi for M/Mp = 0.50).
It is apparent from the above discussion that load ratio (expressed as M/Mp) in itself does not indicate the magnitude of stresses which will occur for different cross-sections. In fact stresses can be high enough in certain cross-sections to justify establishing lower limits on load ratio than for other cross-sections to prevent hot mechanical straightening. Since the stress

Point B
A *Point A
Neutral Axis7
v j
Figure 31. Cross-section of a typical channel

level partially defines the internal restraint during heat straightening, these stresses will affect the plastic rotation. An analysis of each cross-section is needed to decide load ratios to be used in the heat straightening of rolled shapes.
With the above geometrical and stress considerations, the plastic rotations for each angle and channel were compared to those for Boudreaux's plates under the same respective heating conditions. The ratio of angle plastic rotation to plate plastic rotation, Ra/p, was plotted vs. load ratio, as shown in Figure 32. A linear least squares curve fit of the data reveals that Ra/p was close to the estimated value of 1.5 at zero load ratio, and that an increase in load ratio caused a significant increase in Ra/p. This data reinforces the hypothesis of dual effects of the geometric and stress considerations.
A similar plot is shown (Figure 33) for the ratio of channel plastic rotation to plate plastic rotation, Rc/p . Here again the value of Rc/p at zero load ratio seemed to correspond with the geometrical considerations. As expected, because stresses are relatively low in the channel, when compared to the stresses in a plate under the same conditions, an increase in load ratio did not result in a significant increase in Rc/p- Again, the above hypothesis is verified.
The geometric magnification associated with angles or channels can be rationally derived with the following

4n4-3d ^
s «
2 -
g£ SfeO t>d °
<*-h d) O
a
• 2 c £4-3<$ ° Dh 4->
- 3 -
1-
Each point represents the comparison of 3 heats on an angle to 3 heats on a plate.
20° VeeO
45° Vee O
20° Vee O
C)() 45° Vee
20° Vee
0 0.00
QQQQQ Least Squares Curve Fit: Ra/P = 1.45 + 2.87 (M/Mp) Equation 9a Based on Geometry and Stress:
Ra/P = [1 + 1 /2 (b8/d v)] [1 + SF (M/Mp)] where SF = 2 for angles, ba is the depth of the stiffening elem ent, and dv is the depth of the vee.For L4x4xl/4 angles ba = dv = 4
0.25Load Ratio
0.50
Figure 32. Angle-to-plate movement ratio (Ra/p) vs load ratio

Rat
io
of C
hann
el
Mov
emen
t to
Plat
e M
ovem
ent,
R
c/D
5-i
4-
3-()
2 - °
1-
0-j— 0.00
Each point represents the comparison of 3 heats on a channel to 3 heats on a plate.
45 Vee °45° Vee 20 Vee °
2° Vee 20° Vee O
QQQQO Least Squares Curve Fit: Ra/P = 2.55 + 0.24 (M/Mp) Equation 9b Based on Geometry and Stress:
Rc/p = [1 + 1 /2 (b ,/d ,)] [1 + SF (M/Mp)] where SF = 0 for channels, bB is the depth of the stiffening elem ent, and dv is the depth of the vee. For C6x8.2 channels, bs = 6
0.25 0.50Load Ratio
Figure 33. Channel-to-plate movement ratio (Rc/p ) vs load ratio
100
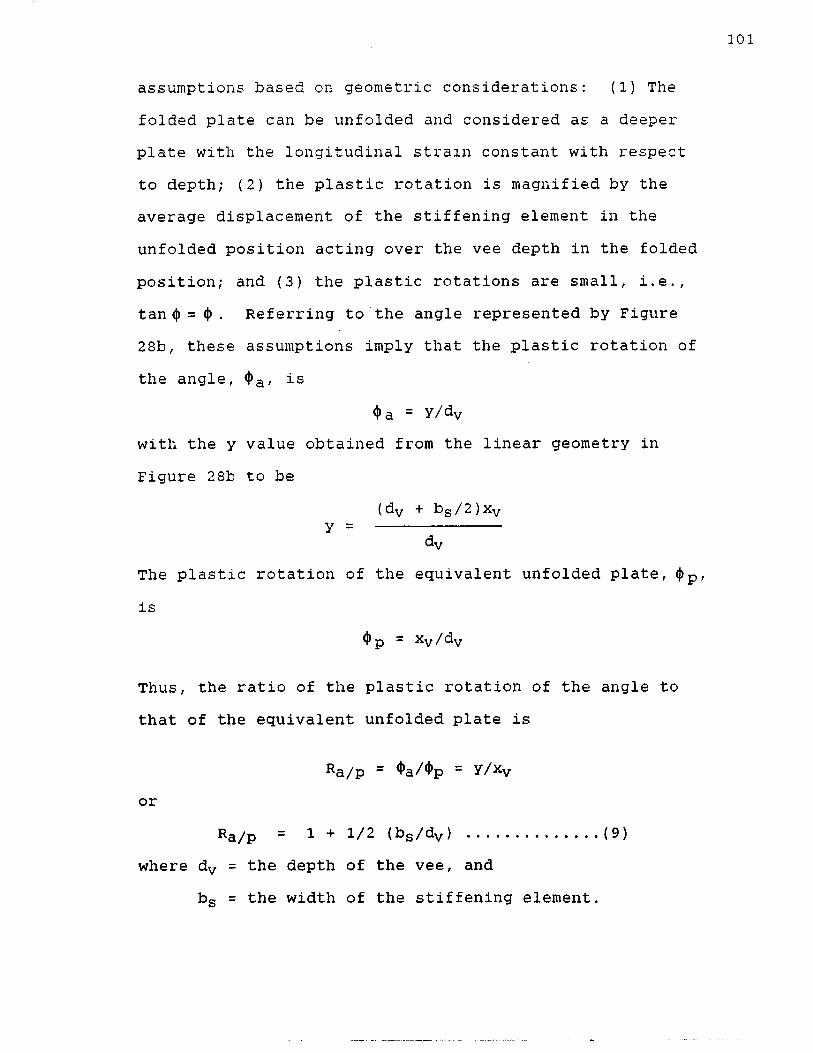
assumptions based on geometric considerations: (1) Thefolded plate can be unfolded and considered as a deeper plate with the longitudinal strain constant with respect to depth; (2) the plastic rotation is magnified by the average displacement of the stiffening element in the unfolded position acting over the vee depth in the folded position; and (3) the plastic rotations are small, i.e., tan <}> = 0 . Referring to the angle represented by Figure 28b, these assumptions imply that the plastic rotation of the angle, 4>a , is
<l>a = Y/dvwith the y value obtained from the linear geometry in Figure 28b to be
( dy + bg / 2 ) Xyy = ----------------
dvThe plastic rotation of the equivalent unfolded plate, <|)p, is
<t> p = Xy/dy
Thus, the ratio of the plastic rotation of the angle to that of the equivalent unfolded plate is
^a/p = ^a/^p = Y/*vor
Ra/p = 1 + 1/2 (bs/dy) ............... (9)where dv = the depth of the vee, and
b s = the width of the stiffening element.

102
The data for the channel seemed to closely match Equation 9. The use of geometric assumption (2) above would not predict this fact, because the web (and thus b s) was divided by two. Therefore, it is assumed that the plastic rotations in channels are governed by the displacement at the center of the web, as opposed to a quarter point, as would be the case if using assumption (2) for one half of the channel being considered as an angle. The greater magnification is likely a result of contributions from both vees being heated at the flanges. Thus,
(dv + bs ' ) xvy = ----------------
dv
where bs ' = bs/2, leading again to Equation 9 for use in channels (bs is the total width of the stiffening element or web).
The stress amplification of plastic rotation to the unsymmetrical shape of the angle can be rationally derived on the basis of the following assumptions: (1) Thevariation of Ra/p is linear with respect to the load ratio, and (2) a load ratio of 50% increases Ra/p by a stress factor, SF = 2. These assumptions are based on the results of the least squares curve fit of the available data for angles (Figure 32). Using these assumptions,
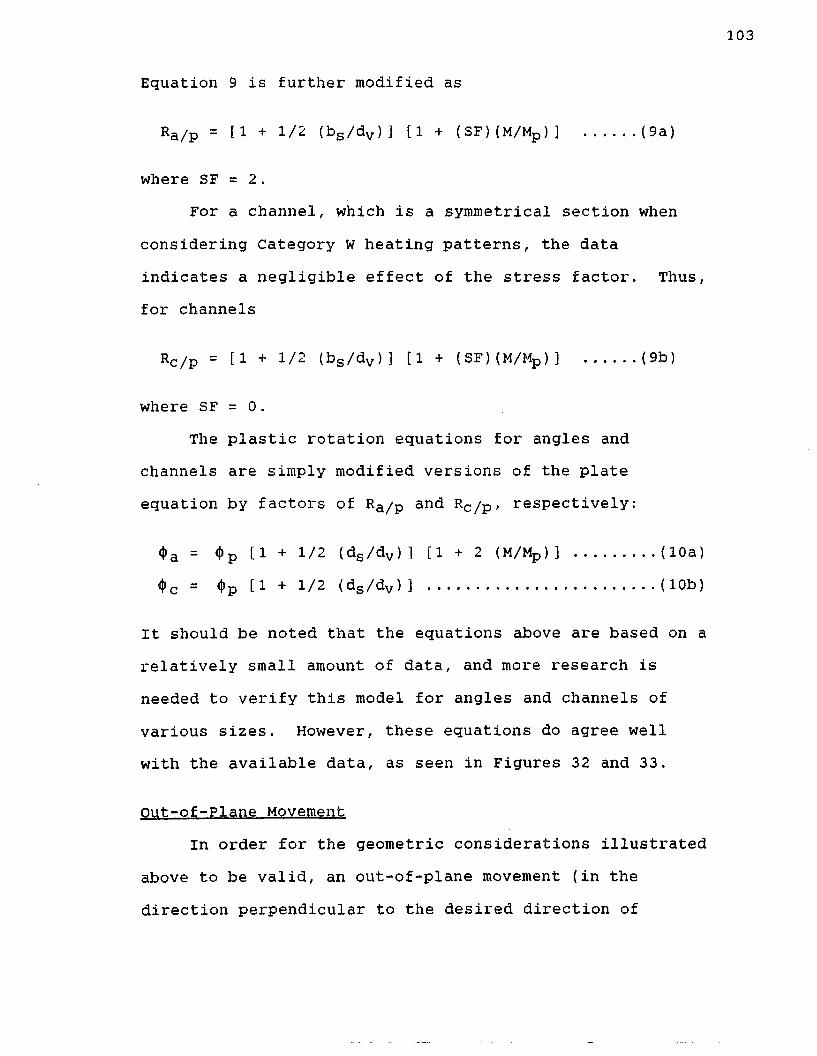
103
Equation 9 is further modified as
Ra/p = [1 + 1/2 (bs/dv )] [1 + (SF)(M/Mp )] (9a)
where SF = 2 .For a channel, which is a symmetrical section when
considering Category W heating patterns, the data indicates a negligible effect of the stress factor. Thus, for channels
Rc/P = [1 + 1/2 (bs/dv )] [1 + (SF)(M / M p )] (9b)
where SF = 0.The plastic rotation equations for angles and
channels are simply modified versions of the plateequation by factors of Ra/p an^ Rc/p> respectively:
<i>a = <>p [ 1 + 1/2 (ds/dv ) ] [1 + 2 (M/Mp)] ...(10a)0 C = 4>p [1 + 1/2 (ds/dv ) ] ........................ (10b)
It should be noted that the equations above are based on a relatively small amount of data, and more research is needed to verify this model for angles and channels of various sizes. However, these equations do agree well with the available data, as seen in Figures 32 and 33.
Out-of-Plane MovementIn order for the geometric considerations illustrated
above to be valid, an out-of-plane movement (in the direction perpendicular to the desired direction of

104
movement) would obviously have to occur. With the linear continuous strain concept, even though the stiffening element is heated with a rectangle, its strain behavior resembles that of a vee heat and thus the stiffening element would shorten more on one edge (opposite the vee in the case of the angle) than the other. According to the theory, the out-of-plane movements should be fairly large (especially when using a load ratio, in which case, the entire rectangular heat is in compression).
In the angles listed above, the average out-of-plane plastic rotations were computed and compared to the plastic rotations in the desired direction. These values and comparisons are shown in Table 24.
As can be seen from Table 24, the out-of-plane movements are quite large in all cases, and they increase significantly with load ratio (note the very large value for VI-6). However, when compared to the plastic rotations in the desired direction, the zero load ratio cases exhibited more relative movement. In fact, the out- of-plane movements were greater than the desired movements. The large out-of-plane movements are more than likely larger than the desired movement because the vee heated leg of the angle has already been heated, offering less resistance to rotation. The lower out-of-plane to desired movement ratios encountered at larger load ratios are probably due to restraint caused by the larger forces.

105
Table 24. Comparison of out-of-plane plastic rotations to plastic rotations in the desired direction of movement.
Specimen Out-of-Plane Plastic Rotations (millirad)
Ratio of Out-of-Plane to Desired Movement
VI-1 2.93 2.07VI-2 4 .03 0.71VI-3 6.59 0.59VI-4 4 .55 1.44VI-5 7.85 0.84VI-6 10.76 0.67
Depending on whether or not the out-of-plane movements are beneficial to the overall repair of the given specimen, alternative heating patterns may be necessary to prevent them. The vee heat would be applied as normal, and the stiffening element would still need to be heated to allow rotation in the desired direction. However, instead of a rectangular heating pattern, it is likely a reverse vee heat (continuing from the open end of the original vee, and tapering down to a point) would allow desired rotation, while reducing the out-of-plane movement. In its "unfolded" position, the heating pattern would resemble a diamond shape, a pattern used by pipe welders to straighten pipe distortions. Heating in the proper fashion is essential for obtaining movement.
Damaged Specimens
A number of channels and angles were damaged and straightened in the current study, as indicated in Table

106
25. The average plastic rotations are shown for each different combination of heating parameters used (different combinations were used on some specimens). All of the damaged specimens had the vee apex applied at the stiffening element (Figure 34).
A notable fact from Table 25 is that very large plastic rotations occurred for all of the angles (when compared to plates under the same conditions). With the stiffening element at the vee apex (and thus heated only with a line heat), the only explanation deals with stress. Larger stresses (than for plates) occur in the angles.These large stresses are compressive over most of the vee (because the neutral axis is shifted toward the stiffening element). The stresses at the open end of the vee are given in Table 26 for the various cases of angles (point A in Figure 30).
From Table 26, it can be seen that the stresses are significantly higher in the angles than for the plates.It is suggested that load ratios for this type of bending should be kept below 0.33 to prevent yielding (even before heating!) and to prevent buckling at the open end of the vee. The load ratio is still based on the plastic moment considering vertical bending only, i.e., by use of the plastic modulus about the horizontal axis, to be consistent with current practice.
In each case above, the stress in the extreme fiber was about 1.4 times the stress in the extreme fiber of a

Figure 34. Heating patterns for angles and channels stiffening element vee apex
107

108
Table 25. Damaged angle and channel specimens.
Specimen/ M/Mp Depth # of Heats Avg PRCategory Ratio (milliradians)
L6x4x5/16(S )* 0.22 1.00 3 4 .66L6x4x5/16 (S) 0.50 1.00 16 9.10L6x4x5/16 (W) 0.50 1.00 3 11.11L4x4xl/4 0.33 0.75 2 5 .57L4x4xl/4 0.33 1.00 5 6 .75C6x8.2 (W) 0.50 1.00 14 5 . 78
*s means strong-axis bending, W means weak- axis bending.Note: All vee heats were 45° , and all had the stiffeningelement at the vee apex.
Table 26. Stresses at open end of vee for various casesof heats on angles (stiffening element at vee apex).
EquivalentShape/ Load Ratio Stress (ksi) Plate Stress
Category (ksi)
L6x4x5/16 (S) 0. 22 16.08 11.880.50 36.55* 27 .00
L6x4x5/16 (W) 0. 50 37 .90* 27.00L4x4xl/4 0 .33 25 .78 17 .82
*These values assume yielding does not occur.
plate under the same conditions. Due to similar neutral axis positions in each shape, it seems likely that the plastic rotations in each angle should differ from plate plastic rotations by similar factors. Because a very large amount of hot mechanical straightening obviously occurred when using a 0.50 load ratio, it is more

109
practical to compare only the cases of 0.22 and 0.33 load ratios with plates under similar conditions (see Table 27). This will allow a proper modification of the plate equation for angles in damaged in this fashion, using reasonable load ratios.
Table 27 indicates that Equation 10a is an excellent indicator of plastic rotations in angles with the stiffening element at the vee apex (the bs term is considered equal to zero because the stiffening element is not heated as part on an extended vee). It should be noted that the value of 2 for SF applies for both equal leg and unequal leg angles (for the two cases shown).
The plastic rotations for specimen C6x8.2 in Table 25 indicate that Equation 10b closely predicts plastic rotations for Category W heats with the stiffening element at the vee apex (again bs is considered equal to zero). In other words, the plastic rotations should be equal to those for plates subjected to the same heating conditions. Recall from Table 25, that the average plastic rotation for specimen C6x8.2 was 5.78 milliradians for 14 heats with a 45° vee angle and a 0.5 load ratio. This average value is close to the average plastic rotation of 5.32 milliradians found in plates when using the same heating parameters.
From the above observations, Equations 10a and 10b predict very well the plastic rotations in angles and

110
Table 27. Comparison of plastic rotations in angles to the modified plate equation.
Shape LoadRatio
Plas. Rot. (millirad)
Plas. Rot.of Plate R a/p** (millirad)
L6x4x5/16(S ) L4x4xl/4
0.220.33
4 .66 6.75*
3.37 1.38 4.16 1.62
*These values represent the heats **Ratio of angle plastic rotation
with depth ratio = 1. to plate rotation.
Category W channels, regardless of the vee orientation. These equations are based on the influences of both the stiffening element and the stresses present during the heating process. However, these equations should bewritten in a form which accounts for the location of thestiffening element:
4>a = 4>p [ 1 + 1/2 (ds/w) (bs/dv ) ] [1 + 2 (M/Mp)] ---- (10c)0C = 0p[ 1 + 1/2 (ds/w) (bs/dv ) ] .................... (10d)
where ds is the distance from the edge of the vee heated plate element closest to the vee apex (Figure 28b) to the stiffening element, and w is the width of the vee heated element. The term ds/w is zero when the stiffening element is at the vee apex and one when the stiffeningelement is at the open end of the vee. This term isimportant because the bs term can never actually be zero if a stiffening element exists, regardless of its location. The ds/w term simply indicates of the effect of

Ill
the stiffening element based on its location.It is apparent that vee depth is inversely
proportional to plastic rotation in Equations 10c and lOd. If these equations were used, then very low depth ratios would indicate very high plastic rotations. This does not occur in actuality. Instead, since only full-depth vees were used to formulate Equations 10c and lOd, it can be assumed that depth ratios between 0.75 and 1.00 will produce similar magnitudes of plastic rotations. This is a valid assumption, when considering the fact that it is true for plate elements, as shown in Chapter III. Thus, the dv term is simply changed to w:
<t>a = <t>pt 1 + 1/2 (ds )(bs )/w2 ] [l + 2 (M/Mp)] --- (11 a)<|>c = 4>p[ l + 1/2 (ds )(bs )/w2 ] (lib)
Equations 11a and lib are considered valid for depth ratios ranging from 0.7 5 to 1.00. Figures 35 through 37 show the comparisons of various shapes to their respective plastic rotation equations.
Residual StressesResidual stress patterns were experimentally
determined for some representative samples of angles and channels. The geometry of the shapes prevented measurements with the extensometer on both sides of certain strips. However, the continuity and consistency of the plots indicate that by just measuring one side,

Plastic
Rotation
(rad
x 10
E-03
) 12-1
Angle Equation 11a (L6x4x5/16, Category S, bs/w = 0)OOOOO Avg Plas. Rot. for L6x4x5/16, Cat. S, bs/w = 0 (3 Heats) Modified Plate Equation 4b1 0 -
9 -
8 -
7 -
6 -
5 -
4 -
3 -
2 -
L6x4x5/16 (Category S) Load Ratio 0.22
0 10 20 30 40 50 7060 80 90Vee Angle (Degrees)
Figure 35. Comparison of plastic rotations in L6x4x5/16 specimenwith Equations 11a and 4b
112
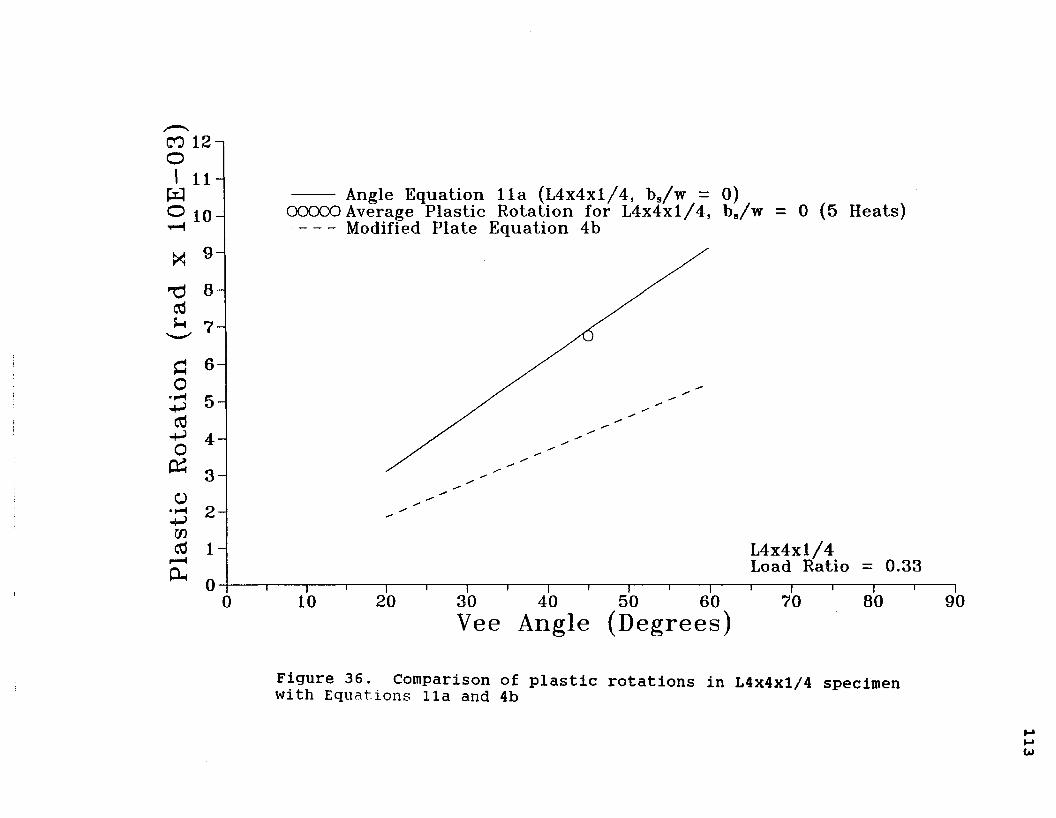
Plastic
Rotation
(rad
x 10
E—03)
12-1
Angle Equation 11a (L4x4xl/4, bs/w =OOOOO Average Plastic Rotation for L4x4xl/4, Modified Plate Equation 4b
bs/w = 0 (5 Heats)1 0 -
9 -
7 -
6 -
5 -
4 -
3 -
2 -
L 4x4xl/4 Load Ratio 0.33
80 9010 20 30 40 50 60 700Vee Angle (Degrees)
Figure 36. Comparison of plastic rotations in L4x4xl/4 specimenwith Equations 11a and 4b
113

Plastic
Rotation
(rad
x 10
E-C O 12-1 O
1 1 - Channel Equation l ib (C6x8.2 Category W, bg/w = 0)OOOOO Avg Plastic Rotation, C6x8.2, Cat. W, bs/w = 0 (14 heats)
Note: Modified Plate Equation 4b is the same asEquation l ib in this case.1 0 -
9-
8 -
7-
6 -
5 -
4 -
3 -
2 -
C6x8.2 (Category W) Load Ratio = 0.50
20 30 400 10 50 60 70 80 90Vee Angle (Degrees)
Figure 37. comparison of plastic rotations in C6x8.2 specimen with Equations lib and 4b
114
115
Table 28. Residual stresses in undamaged angles.
Specimen/StripResidual Stress (KSI) in Vee Heated Leg
Residual Stress (KSI) in Rectangular
Heated Leg
VI-1 1 -22.04 -19.692 3 .09 -7 .403 9.17 6.424 11.46 9.795 10.04 15.376* 7 .03 15.737* -5.29 13.928* -20.16 -17.40
VI-4 1 -26.10 -27.082 -10.19 -2.763 3.87 6 .164 15.48 0.335 21.90 9.546* 8.48 12 .917* 5.44 12 .048* -43.07 -31.83
* Only one side measured.
sufficient results were obtained. The residual stress values are given in Tables 28 through 30, and shown in Figures 38 through 42). The strip number locations are shown in the figures. These values should be fairly representative of the respective heating configurations on the various shapes.
In the two undamaged angles (VI-1 and VI-4), the residual stress patterns were quite similar (slightly higher compressive stresses were found at the leg ends of specimen VI-4). The only difference in these two specimens is the vee angle used (20° and 45°,

40-|
-40
Channel IX -6
40
0
-40
1...4
O-i
3-4-5-6 -
1
8 -
9-10j;1 1 -
11
-40 0 40Stress (KSI)
I I X i i0 1 2 3M 5
Figure 38. Stresses in Channel IX-6 (45° vee, M/Mp = 0.50, depth ratio = 1.00)
116

Stress (KSI)-4 0 40
2-3 -4 -5 -6 -
Figure 39. Stresses in Angle VI
Angle V I -1
i r\
8 v-r 40
— 40
1 (20° vee, M/Mp = 0.00, depth ratio = 1.00)
117

Stress (KSI)-4 0 40
3-4 -5 -6 -
Figure 40. Stresses in Angle VI-4
Angle VI-4
r40
40
(4 5° vee, M/Mp = 0.00, depth ratio = 1.00)
118

Stress (KSI)40-40
-8-7
-5-4-3
L 0
Figure 41. Stresses in Angle L4x4
Angle L4x4
(45° vee, M/Mp = 0.50, depth ratio = 1.00)
119

Stress (KSI)-40 40
-1 0
-8-7-6-5-4-3,
L 0
Figure 42. Stresses in Angle L6x4
A ngle L6x4
ii h
r 40
— 40
(45° vee, M/Mp = 0.33, depth ratio = 1.00)
120
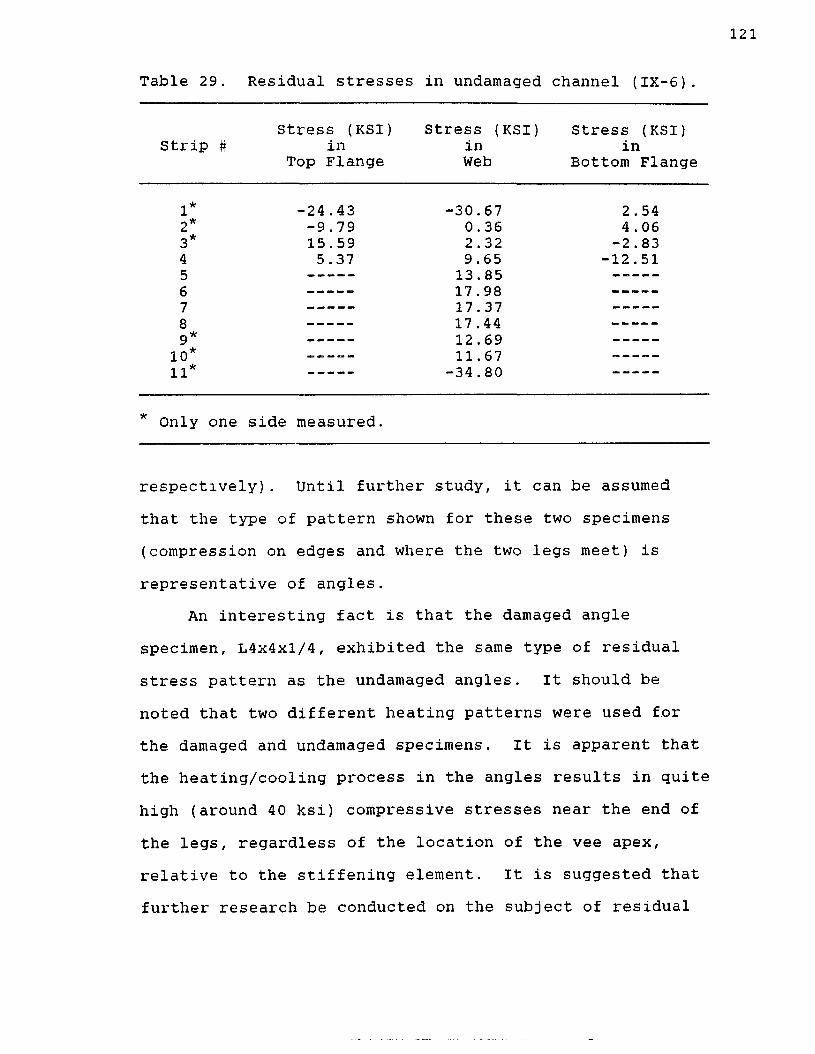
121
Table 29. Residual stresses in undamaged channel (IX-6).
Strip #Stress (KSI)
inTop Flange
Stress (KSI) in Web
Stress (KSI) in
Bottom Flange
1* -24 .43 -30.67 2.542* -9.79 0.36 4 .063* 15.59 2.32 -2.834 5.37 9.65 -12.515 ----------- 13.85 — ------
6 17.987 17.378 17 .449* 12 .69
10* 11.6711* -34.80
* Only one side measured.
respectively). Until further study, it can be assumed that the type of pattern shown for these two specimens (compression on edges and where the two legs meet) is representative of angles.
An interesting fact is that the damaged angle specimen, L4x4xl/4, exhibited the same type of residual stress pattern as the undamaged angles. It should be noted that two different heating patterns were used for the damaged and undamaged specimens. It is apparent that the heating/cooling process in the angles results in quite high (around 40 ksi) compressive stresses near the end of the legs, regardless of the location of the vee apex, relative to the stiffening element. It is suggested that further research be conducted on the subject of residual

Table 30. Residual stresses in damaged angles.
122
Specimen/StripResidual Stress (KSI) in Vee Heated Leg**
Residual Stress (KSI) in Rectangular
Heated Leg
L4x4xl/4 1* -47.49 -53.652* 17.91 -9.573* 33.57 2.104 34.06 16 .325 27 .55 21.906 19 .87 22 .847 -10.30 -9.728 -35 .74 -22.70
L6x4x5/16 1* 12.25 -----------
2* -4.71 -2.613* 14 .65 12 .334 27 .55 14 .365 43.86 21. 576 31 . 50 26.907 29.69 43.218 18.27 31.549 10. 19 ------ —
10 -7 . 8711 -25.3412 -35.38
* Only one side measured.** some vee heats were also applied to the both legs due t<some bending occurring in horizontal direction (fromvertical loading) during damage.
stress patterns in channels and other sizes of angles subjected to the heat straightening process.
ConclusionsThe past study conducted by Boudreaux on undamaged
angles and channels indicated extremely high plastic rotations when compared to plates heated under the same conditions. The current study on damaged angles and

123
channels has resulted in similar findings. Cross-section geometry has been incorporated into the modified plate equation from Chapter III, to predict plastic rotations for these shapes for two types of heating patterns. Stresses and the location of the stiffening element, with respect to the vee apex, both have an effect on the plastic rotations in angles and channels. Residual stress patterns were found for a few of the specimens (both damaged and undamaged). Compressive stresses near the leg tips were quite high in some cases.
The study of the angles and channels illustrates the fact that more variables are involved in the prediction of plastic rotation in shapes other than simple plates. An even more complex shape is the wide flange. A study of undamaged wide flange beams is presented in the following chapter.

CHAPTER VUNDAMAGED WIDE FLANGE BEAMS
Although the information in the preceding chapters is useful in understanding the effects of heat straightening, many steel bridge members do not consist of a single plate or even channels and angles. More commonly, bridges are constructed using plate girders and wide flange shapes. Often these members are damaged as a result of accidents.
Plastic rotation studies have been conducted in the past (Horton 1973; Avent and Fadous 1988), on a few undeformed wide flange beams. Some material properties resulting from heat curving have been investigated, with theoretical studies used to predict residual stresses (Horton 1973). However, no experimental residual stress measurements were made. In the current study, a number of undeformed wide flange beams were subjected to the heat straightening process in a laboratory environment.Plastic rotations were investigated to add to previous data, and residual stresses were experimentally determined.
Test SetupThe studies were similar to those of the undeformed
plates; in this case, using 5-foot long specimens of W6x9 rolled shapes (A36 steel). The beams were bolted to a
124

125
stationary frame in cantilever fashion, and loads and heat were applied accordingly (Figure 43). Each initially straight beam was subjected to four heating/cooling cycles to produce Category w movement (movement about the weak axis, as shown in Figure 43) or category S movement (movement about the strong axis). The heating conditions for the beams are shown in Table 31.
Plastic RotationsTo determine beam movements resulting from each heat,
measurements were taken using a sliding measuring frame along a set of guide rails, which ran under the beam, parallel to it. Measurements were taken at eight locations along the beam and were used in a similar manner as for the plates to arrive at plastic rotations. Plastic rotations for each of the beams are shown in Table 32.This topic is discussed more in Chapter VI.
Residual StressesResidual stresses were experimentally determined in
the heated region of the beams, using the sectioning method, in all of the beams, eight strips were cut from each flange, and six strips were cut from the web (see Figures 44 and 45).
The shape of the extensometer used to measure the gage lengths prohibited obtaining stresses in the web within about 1.5 inches from either of the flanges, thus limiting stress readings to six strips. Also, for the
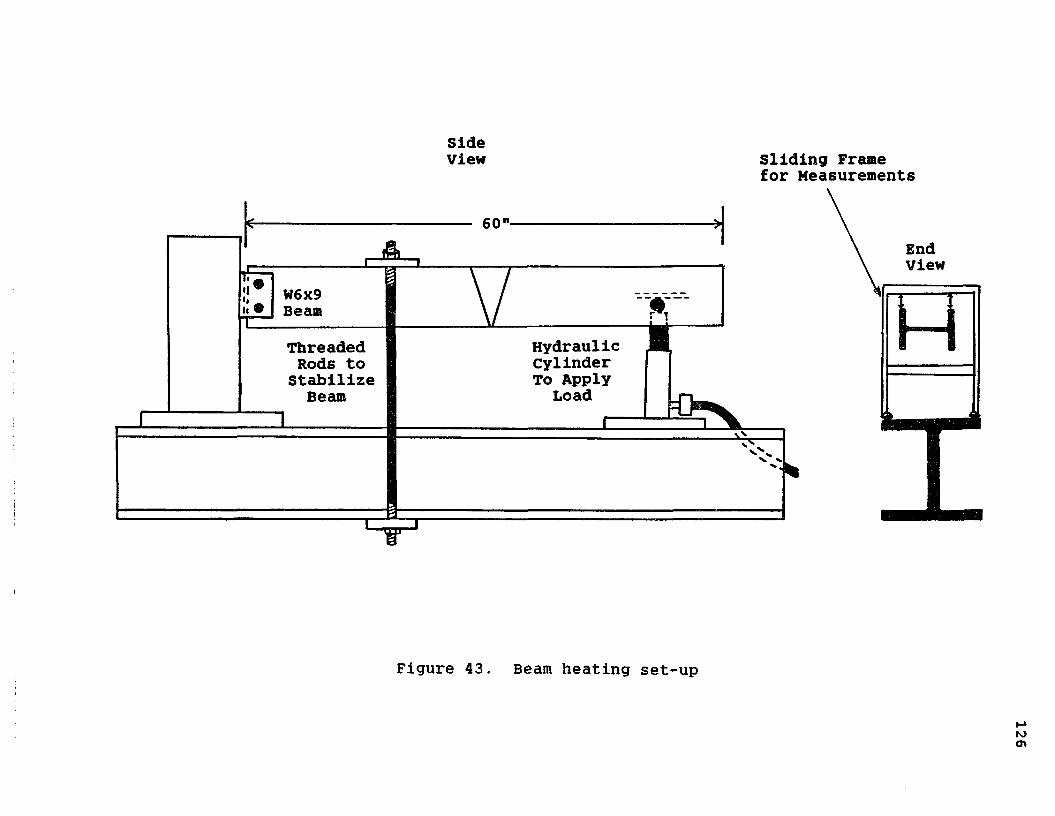
Sideview Sliding Frame for Measurements
60
W6x9Beam
Hydraulic Cylinder To Apply
Load
Threaded Rods to Stabilize Beam
EndView
H
Figure 43. Beam heating set-up

Strip Number Designation
81
Figure 44. Residual stress strip locations (Category S heat)
127

strip Number Designation
1 8
Figure 45. Residual stress strip locations (Category W heat)
128

129
Table 31. Heating conditions for undamaged wide flange beams.
Beam Vee angle Load Ratio Depth ratio Category
1-1 20 0.00 1.00 S1-2 45 0.00 1.00 s1-4 30 0.00 1.00 s
II-l 20 0.00 1.00 wII-3 45 0.00 1.00 w
III-2 20 0.50 1.00 wIV-5 45 0. 25 1.00 sIV-6 45 0.50 1.00 s
Tablebeams
32. Plastic rotations in undamaged wide flange
BeamPlastic Rotation (milliradians)
Heat 1 Heat 2 Heat 3 Heat 4 AVG
1-1 2 .25 3.58 2 .85 3.48 3.041-2 3.77 6 .43 5 .51 5.70 5.351-4 3.94 2 . 54 4.96 5.33 4 .19
II-l 1.87 1.62 0.21 1.06 1 . 19II-3 2.90 2.69 0.70 -3.00 0.82
III-2 7.57 6.77 6.93 5 . 28 6 .64IV-5 8.94 6 . 50 6 . 50 No heat 7.31IV-6 6 .83 7.00 7 .67 No heat 7 .17
same reason, only in strips 1 and 8 in the flanges were both sides of the strip measured. Although only one side was measured for strips 2 through 7, the results from strips 1 and 8 have shown that one side of the strip can be used to estimate the residual stress fairly well.
130
An unheated specimen (Beam UH) was tested for residual stresses (Table 33 and Figure 46), to compare with the heated specimens. These stresses matched very closely with a plot of the residual stresses in a roller straightened W6x20 shape shown in the Structural Stability Research Council Guide to Stability Design Criteria for Metal Structures (1976). Roller straightening (or rotorizing) is a common mill practice for straightening small wide flange shapes to meet sweep and camber tolerances. The process redistributes and greatly reduces the initial residual stresses in the flanges (a characteristic evident in Beam UH, where these stresses are quite low) (SSRC 1976).
Values for the Category W, small vee angle Category S, and large vee angle Category S specimens are shown in Tables 34 through 36. Average residual stress distributions for the three categories are shown in Figure 47. Individual residual stress distributions for each beam are shown in Appendix V. From the residual stress patterns in the heated undamaged beams, the following observations are made:
1. The patterns were significantly different in the Category s and Category W specimens.
2. Load ratio and depth ratio were again found to not significantly change the stress patterns, when all other parameters were held constant.
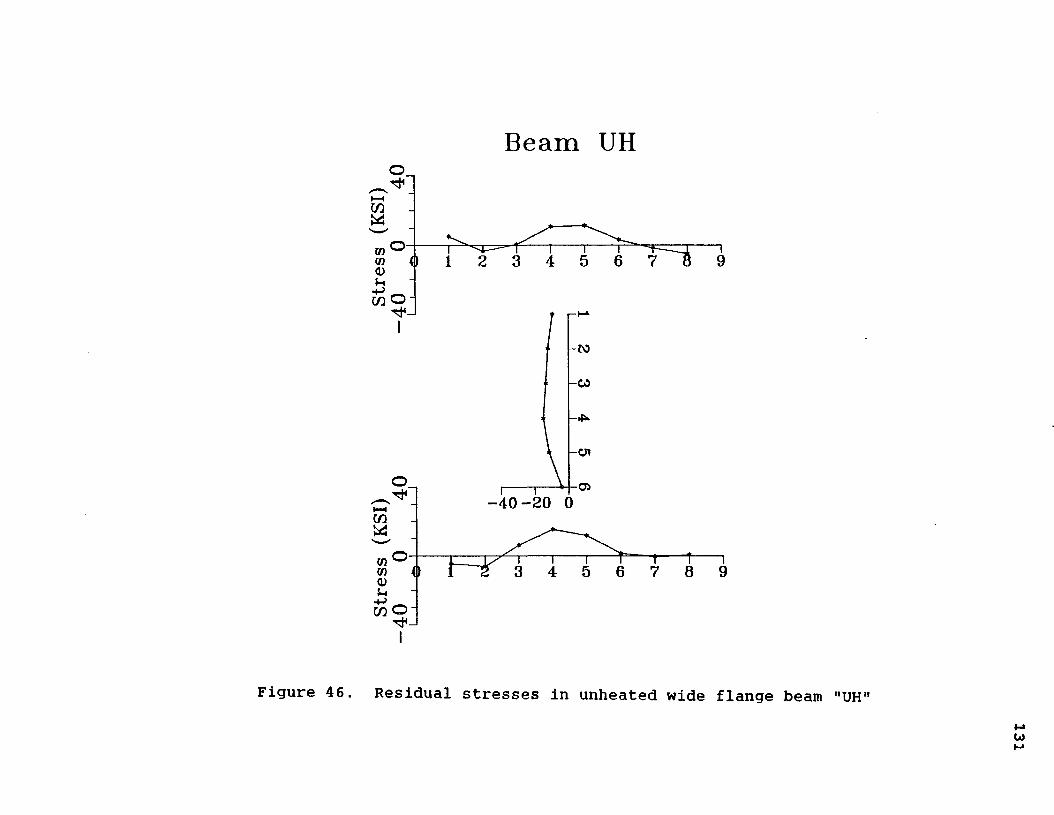
B e a m U H
o
1/3 O -
-C0
O-4 0 -2 0 0
cn
Figure 46. Residual stresses in unheated wide flange beam

Undamaged Beams
ro-
co-
U1-
►— icn
Category W Heats Category S, Large Vee Angle Category S, Small Vee Angle
Figure 47. Average residual stresses in undamaged wide flange beams after Category W (sweep) and Category S (camber) heats

133
Table 33. Experimentally determined residual stressesin an unheated W6x9 specimen (Beam U H).
Residual Stress (KSI)Strip Stress Strip Stress Strip Stress
TF1 5.08 W1 -9 .46 BF1 -4 .61TF2 -3.34 W2 -12.22 BF2 -6 .09TF3 0.58 W3 -13.60 BF3 6.31TF4 10.51 W4 -14 .97 BF4 15.30TF5 11.24 W5 -11 .64 BF5 11.75TF6 3 .12 W6 -4 .20 BF6 1. 23TF7 -1. 60 BF7 -0.44TF8 -5 .08 BF8 0.61
3 . By classifying the 20- and 30-degree vee anglesas small and 45- degree vee angles as large, there weresignificant pattern differences in the two classifications in the Category S specimens (no significant difference in Category W specimens).
4. The residual stresses are greatly increased when vee heats are applied to undamaged beams. With most (or all) of both flanges experiencing compressive stresses (in sweep and camber heats), column strength would be affected.
ConclusionsThe study of plastic rotations and residual stresses
in the undamaged wide flange beams provides a basis for comparison with damaged beams. The different heating configurations necessary for the heating of Category S and Category W wide flange sections, respectively, are found to produce different typical residual stress patterns.

134
Table 34. Experimentally determined residual stresses in undamaged, Category W wide flange beams.
Strip
Residual Stress (KSI) in Beam #:
AVG.II-l II-3 III-2
TF1 -14.86 -14.39 -16 .68 -15.31TF2 -8.99 -8.12 -11.09 -9.40TF3 -4.50 -12.62 -8.99 -8.70TF4 -11.96 -21.90 -10.37 -14.74TF5 -16.82 -21.46 -14.07 -17 .45TF6 -12.69 -15.66 -7.18 -11.84TF7 -9.72 -9.57 -7 .25 -8.85TF8 -14 .03 -16.25 -17 .01 -15 .76W1 13 . 27 21.55 30.42 21.75W2 14 . 07 22 . 51 30.38 22.32W3 15 . 08 23.39 29 .33 22.60W4 17 . 01 24.25 28.64 23 .30W5 18.38 23 .96 22 .77 21 .70W6 20.12 23.06 18.63 20 . 60
BF1 -22.27 -24 .76 -13.99 -20.34BF2 -6 .16 -14 .43 -11.89 -10.83BF3 -5 . 00 -18.34 -8.70 -10.68BF4 -7 .83 -10.37 -16.82 -11.67BF5 -9.57 -16.24 -15.73 -13.85BF6 -11.38 -13.05 -7.61 -10.68BF7 -16.02 -16.24 -3 .34 -11.87BF8 -19.83 -24 .18 -14.14 -19.38
However, it is yet unknown what kind of residual stresspatterns exist in damaged wide flange sections that havebeen repaired by heat straightening.
The following chapter is devoted to thei study ofdamaged wide flange beams. A more detailed look atplastic rotations is provided. Topics also includeresidual stresses and material properties. The question

135
of repetitive damage to heat straightened specimens is thoroughly addressed.
Table 35. Experimentally determined residual stresses in undamaged, Category S wide flange beams ("large" vee angles).*
Residual Stress (KSI) in Beam #:
Strip 1-2 IV-5 IV-6 AVG
TF1 -23.13 -23.97 -16.32 -21.14TF2 -0.65 -1.60 -4.71 -2.32TF3 0.94 2 .54 3.05 2 .18TF4 2.76 5 .08 4 .06 3.97TF5 1 . 23 0.94 3.63 1 . 93TF6 -2.76 6.89 -0.58 1. 18TF7 -3 . 99 5 .15 3 . 26 1.47TF8 -16.32 -17 .59 -5 .99 -13.30W1 28.53 34 .77 16 .32 26 . 54W2 23.35 33.64 13.60 23 . 53W3 25 .16 29.62 12.15 22 .31W4 27.55 29.62 12 .15 20.58W5 23 . 17 18.09 -0.76 13.50W6 20.88 6 .46 -12.47 4.96
BF1 -44.01 -42.02 -22.55 -36 . 19BF2 -44 .15 -25.23 0.07 -23.10BF3 -31.25 6.09 7 .32 -5 . 95BF4 -25.67 12.91 -2 .83 -5.20BF5 -8.05 16.39 3 .19 3.84BF6 -13.92 12 .18 5.73 1.33BF7 -24 . 29 7 .47 -5.95 -7.59BF8 -38.57 -41.62 -39.12 -39.77
* 45° vees.

136
Table 36. Experimentally determined residual stresses in undamaged, category S wide flange beams ("small" vee angles).*
Strip
Residual Stress in Beam #:
1-1
(KSI)
1-4 AVG.
TF1 -24.15 -22.59 -23.37TF2 -22.62 -12.04 -17.33TF3 -28.93 -8.56 -18.75TF4 -18.85 -7 .83 -13.34TF5 -22.40 -12 .47 -17.44TF6 -21.17 -12.91 -17.04TF7 -19.00 -11.46 -15.03TF8 -19.87 -11.96 -15.91W1 33.82 43 .11 38.47W2 34 .66 41.84 38.25W3 33.53 38.39 35.96W4 34 .73 29.97 32 .35W5 28.53 24 .69 26.61W6 19.91 11.20 15.56
BF1 -36.11 -30.31 -33.21BF2 -12.11 -3.91 -8.01BF3 -9.57 -3.92 -6.75BF4 -1. 09 -4.57 -2.83BF5 -6 . 16 -6 .16 -6.16BF6 -9.64 -5 . 08 -7 .36BF7 -14.07 -16.17 -15.12BF8 -34.44 -33.07 -33.76
* Small angles = 20 and 30 degrees.

CHAPTER VIDAMAGED WIDE FLANGE BEAMS
With the exception of a few recent specimens (Avent and Fadous 1988), information regarding the heat straightening of damaged wide flange beams has been previously unavailable. For this reason, a number of experiments were designed to: (1) study the total heatstraightening process of a damaged member and, (2) answer questions concerning the feasibility and effects of repeatedly damaging/repairing a given member. This second point stemmed from the fact that once a member encounters damage and is heat straightened, the possibility exists that the same member will undergo damage again during its lifetime.
The primary focus of this research was to determine the variation in material properties of steel subjected to the repetitive damage/straightening process, as well as to find the change in residual stresses in the member. Thus, heating parameters were the same for all specimens. Practical information is also provided herein concerning plastic rotations in the context of an entire repair process, which consists of many heats. Two types of beams were studied, weak axis bending (category W) and strong axis bending (Category S). Weak axis damage is more conducive to pure heat straightening research, because
137

138
local buckling (which requires hot mechanical straightening) can easily be prevented. Also, weak axis damage is similar to the type of damage often encountered in bridge girders from overheight vehicles (usually only one flange is damaged).
Weak Axis DamageFour beams (W6x9's) were used in the study. Each
beam was damaged about its weak axis to an angle of about seven degrees (approximately the same as the least damaged of the deformed plates). Each beam was repaired using a 45 degree vee with a depth ratio of 0.75 and a load ratio of 0.5. The vee angle and depth ratio were initially chosen for two reasons: (1) To investigate theshortening caused by such a depth ratio, and (2) because a 45 degree vee provides maximum movement without creating too large a heating area (a factor significant in causing local flange buckling during the straightening process). Further precautions were taken against buckling by placing one C-clamp around the two flanges at the center of the open end of the vees. This prevented the buckling, but it did not hinder plastic rotation. Without such precautions, flange buckling is inevitable, as was concluded by studying various size members in preliminary experiments.
The number of damage/repair cycles varied for each of the beams (Table 37). Each repair cycle consisted of

139
Table 37. Summary of damaged beam data.
Beam/RC#**
Angle(Deg)
of Damage (Millirad)
# of Heats
AvgP.R.
(Millirad)Coefficient
ofVariation
XXI-1/1 7 .34 128.1 20 6 .85 0.28XXI-2/1 7.67 133.9 20 6.65 0.30XXI-2/2 8.22 143.5 23 6.70 0.26XXI-3/1 7 .15 124 .8 18 6 .64 0 .16XXI-3/2 7 .21 125.8 22 5.93 0.26XXI-3/3 7 .14 124.7 19 6 .19 0.28XXI-3/4 7 .17 125 . 2 21 6 .30 0.29XXI-4/1 7 .06 123.2 18 6.42 0.28XXI-4/2 6.56 114.4 17 6.52 0.17XXI-4/3 7 . 50 131.0 21 5.91 0.33XXI-4/4 7 . 20 125 . 7 20 6 .12 0.39XXI-4/5 6 .87 119.9 21 5 .68 0 .39XXI-4/6 6.42 112.0 13*XX.I-4/7 7 . 16 125.0 16*XXI-4/8 7 . 27 126.9 13*
*Some heats included two vees due **Repair cycle number.
to time constraints.
approximately 20 heats, with the average plastic rotation shown for each repair cycle (individual plastic rotations are presented in Appendix VI). Each time a beam was damaged and straightened, a net shortening of about one- tenth of an inch occurred in the heated region (Table 38). These values match very well with the plate shortening equation in Chapter III. It is therefore recommended that Equation 10 be applied to wide flange beams as well as plates.
With the shortening, a thickening developed in the middle region, causing a spreading of the yield zone in each subsequent bend as seen in Figure 48 (values shown in

I f - » - ’t
Figure 48. spreading of yield zone in subsequent damaged wide flange beam specimens
bends
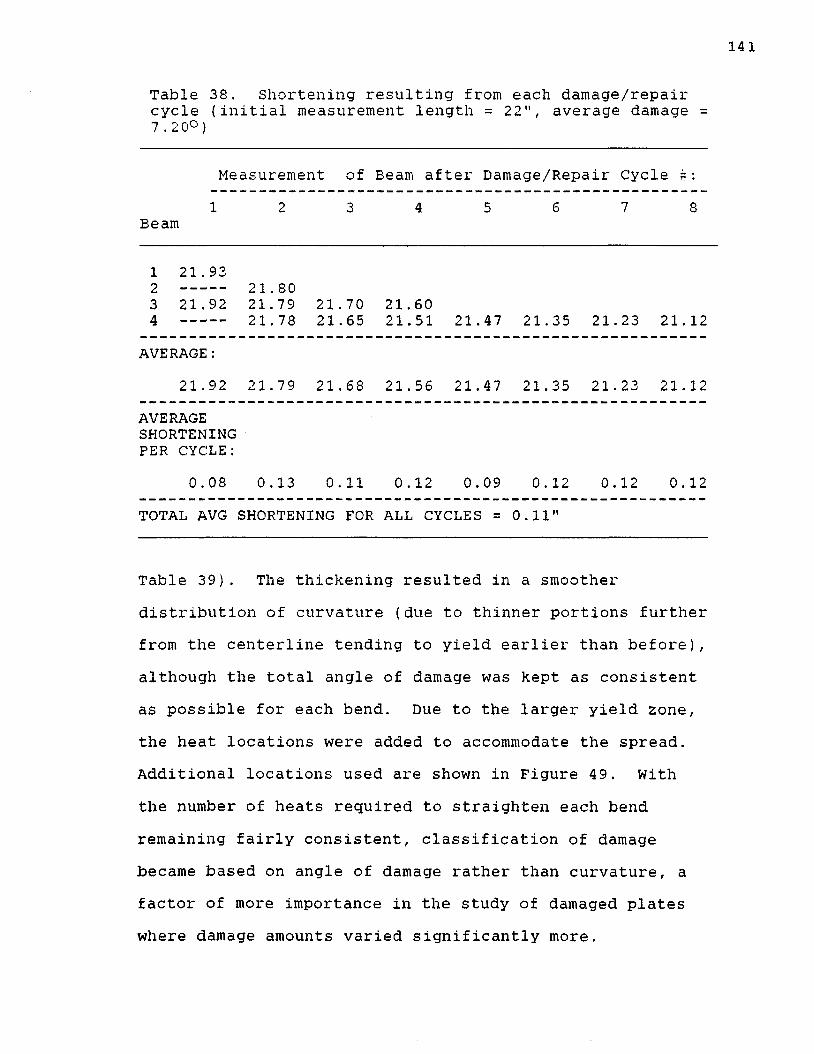
141
Table 38. Shortening resulting from each damage/repair cycle (initial measurement length = 22", average damage = 7.20°)
Measurement of Beam after Damage/Repair Cycle #:1
Beam2 3 4 5 6 7 S
1 21.933 21.924 -----
21 . 80 21 . 79 21 .78
21. 70 21 .65
21.6021.51 21.47 21.35 21. 23 21.12
AVERAGE: 21.92 21.79 21 . 68 21.56 21.47 21.35 21.23 21.12
AVERAGE SHORTENING PER CYCLE:
0.08 0 .13 0.11 0.12 0.09 0.12 0.12 0 . 12TOTAL AVG SHORTENING FOR ALL CYCLES = 0.11"
Table 39). The thickening resulted in a smoother distribution of curvature (due to thinner portions further from the centerline tending to yield earlier than before), although the total angle of damage was kept as consistent as possible for each bend. Due to the larger yield zone, the heat locations were added to accommodate the spread. Additional locations used are shown in Figure 49. With the number of heats required to straighten each bend remaining fairly consistent, classification of damage became based on angle of damage rather than curvature, a factor of more importance in the study of damaged plates where damage amounts varied significantly more.
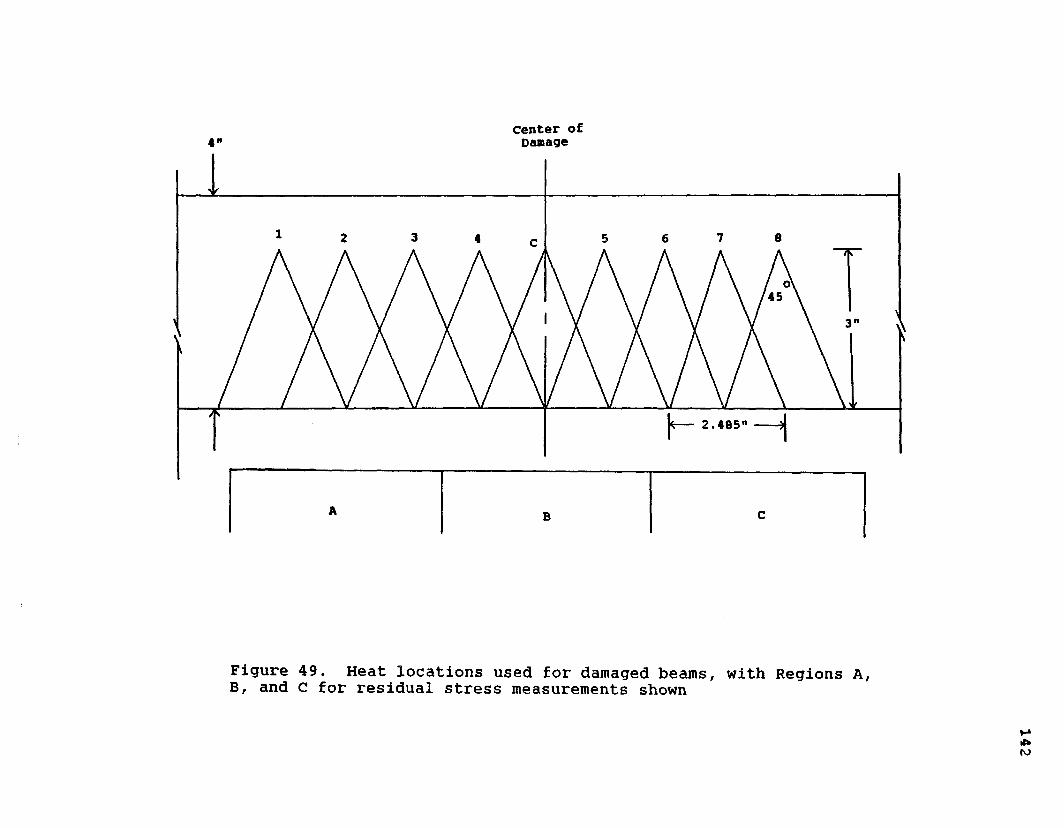
4"Center o£ Damage
45
2.485
Figure 49. Heat locations used for damaged beams, with Regions A, B, and C for residual stress measurements shown

143
Table 39. Increasing yield zone after each damage/repair cycle (see Figure 48).
Length (Top row
of yield zone = top fiber, :
(in inches) after Bend #: bottom row = bottom fibers.)
1Beam
2 3 4 5 6 7 8
2 ---- 8.208.40
3 5.90 6 .00
8.058.65
9 .75 10.40
10.3011.65
4 5 . 50 5.80
8.15 8.40
9.5010.20
10.5012.00
10.70 13 . 20
10.70 13 .30
11.50 15 . 25
11 .50 15.25
AVERAGES5.705.90
8.138.48
9.63 10 .30
10.4011.83
10.70 13 . 20
10.70 13 .30
11. 50 15 . 25
11. 50 15 . 25
Plastic RotationsThe individual plastic rotation values for each heat
are presented in Appendix VI. With most of the plastic rotation data in the past being restricted to a few values per member, there was no evidence that plastic rotations experience any changes as a particular straightening process progressed, especially when a great number of heats were required. Therefore, data from the four damaged beams were used to investigate any changes (of statistical significance) in the plastic rotations throughout a straightening process, even with all heating parameters remaining constant. The primary goals were: (1) to compare

144
the plastic rotations resulting from any given heat to another within a given straightening process; (2) to determine any differences in plastic rotations from one repair cycle to the next; and (3) to point out any relevant trends in the plastic rotation values.
The initial investigation was twofold. First, only the 1st bends of each of the four specimens were considered (using a dependent samples test) to investigate any trends concerning plastic rotation values within a given process. Second, the first bend of one specimen was compared with the 2nd, 3rd, 4th, and 5th bends, respectively, of all the other specimens combined (using an independent samples test on means), to investigate differences, if any, between the plastic rotations in different repair cycles.
Comparison of Heats Within a Given Repair CvcleSince each beam was damaged at least once, plastic
rotation data from all of the specimens were considered. The method used is known as a dependent samples t-test (Hicks 1982). This method is used when one has the same sample "before and after" some treatment has been applied. The usual procedure is to take differences between the first and second observations (in this case, two plastic rotations at different heat numbers) on the same specimen, and test the hypothesis that the "mean difference" (using all four beams),f^o, between the two plastic rotations in

145
question is zero (This would actually mean that there is no significant difference). This reduces the problem to a test on a single mean:
Hypothesis "zero": Hq : = 0Hypothesis "one" : H i : /-tD = 0 ( > 0)with 'n' differences, aThe test statistic, t, is as follows:
dt = ......... (12)sd/ n
(with n-1 degrees of freedom).
Reject if t > ti_a/2 (or t >. ti_a ) .
A sample of n is chosen (with all four beams considered, n= 4 ) . Two sets of measurements are taken (for example plastic rotations for heat number 1 on all beams andplastic rotations for heat number 2 on all beams).Differences are computed for each beam. The mean of thesedifferences, d, is computed, along with their standarddeviation, s^. From the above equation, t is found and from this value, a decision regarding the hypothesis Hi is made. To illustrate the method, the plastic rotations (shown in milliradians) for the first two heat numbers are compared:
Beam: XXI-1 XXI-2 XXI-3 XXI-4P.R. for Ht #1: 10.97 12.16 6.14 10.39P.R. for Ht #2: 4.94 5.52 7.61 10.06Difference, d: 6.03 6.64 -1.47 0.33

Mean difference, d = 2.88 Std. dev., sd = 4.06 n = 4degrees of freedom, df = n - 1 = 3
From the Student's t-distribution table (Benjamin and Cornell 1970), the following "P-value" was found for the above conditions:
P = 87.5%
This P-value indicates that there is an 87.5% confidence level, given the four plates studied, that the plastic rotation resulting from heat number 1 would be greater than the plastic rotation resulting from heat number 2. Here it becomes obvious that the number of samples used will drastically affect the results. For example if the same mean difference and standard deviation were found, using 16 beams instead of 4, the resulting P-value would be over 99%. However, with that many samples, it is unlikely that these values would be even remotely similar.
The value of 87.5% is not considered high (hypotheses are often tested in the 95% to 97.5% range). Thus, the hypothesis H ^ , which suggests that plastic rotations will be greater for the first heat than for the second heat should be rejected.
P-values were found, comparing each heat number with each other. These values are shown in Table 40. The numbers in the table represent the confidence level that the heat on the horizontal axis will have cause less

147
Table 40. P-values for comparing plastic rotations at different heat numbers within a straightening process.
The P-values shown indicate the confidence level that the heat represented by the number on the horizontal axis will produce less plastic rotation than the heat represented by the number on the vertical axis.Ht# 1 2 3 4 5 6 7 8 9
1 87.2 96.3 95.2 93.0 92.3 97.9 91.5 78.22 84.2 82.4 67.4 50.0 57.2 50.0 24.13 60.8 42.7 21.7 39.2 21.7 8.54 32.6 6.3 32.6 10.4 4.85 21.7 42.7 11.5 4.86 60.8 46.3 3.77 39.2 6.38 3.4
Ht # 10 11 12 13 14 15 16 17
1 93.7 94 . 2 92 .3 96 .3 96.6 98.2 97 .3 96 .92 46 .3 70.5 50.0 64 . 2 73.3 91. 5 87 . 2 84.23 17 .6 29 . 5 21.7 50.0 60.8 92 .3 84 . 2 78.34 5.8 2.3 7.6 39.2 53 .7 93 . 7 88.5 80.45 26.7 46.3 29 . 5 53.7 64 . 2 84 .2 96 . 9 92.36 39 . 2 78.3 42 . 7 80.5 90.6 96 . 0 99.9 98.27 29 .5 53 .7 64 .2 70.5 73.3 88.5 87 . 2 89 .68 42 . 7 73 .3 53.7 75.9 84 . 2 93.7 99.9 98.99 91.5 91.5 93 .7 96 .0 96 .3 96 .9 99.6 99 . 9
10 ---- 84 . 2 60 .8 93.7 99.0 99 . 0 97 .7 95 .611 ---- 78.3 57.3 78.3 97.9 93.0 87 . 212 ---- 92.3 98.4 98.0 97 .5 96.013 ---- 78.3 92.3 84 .2 85 .814 ---- 96.3 80.5 78.315 ---- 42.7 46 .316 ---- 64 . 217 _ •— _ _■
plastic rotation than the heat on the vertical axis.High P-values were common when comparing various
heats to heat #1. This results from the relatively high

148
plastic rotations experienced from the first heat (a characteristic observed in many damaged specimens, including plates and full-scale, simulated bridge girders). It is suspected that the higher rotations in the first heats are the result of residual stresses resulting from the damaging process.
From Table 40, it appears that the probability is high that the heats toward the end of the heating process will produce slightly lower plastic rotations. This could have resulted from the fact that toward the end of the heating process, heats are more localized (because most of the plate has already been straightened). However, when examining these P-values (for the heats toward the end of the process), the "high” values (over 95%) are found only when comparing with heats 6, 8, 9, 10, and 12. This indicates that heats 6, 8, 9, 10, and 12 exhibited unusually high plastic rotations (obviously a matter of chance, not statistical significance).
Most of the other P-values were found to be far below 95%, and the few that are above 95% do not exhibit any noticeable pattern or trend in the amount of plastic rotation experienced throughout the straightening process. Therefore, after the first heat, it seems that at any point during the straightening process, one should expect similar plastic rotations.

149
Average Plastic Rotations in Different Repair CyclesAfter the above discovery, a relatively simple check
was made to determine if the number of damage/repair cycles that a member has been through affects plastic rotation. As mentioned previously, beams damaged more than once exhibit different curvature and experience thickening resulting from previous repairs (and, as seen below, have different material properties). It is assumed that for these beams, just as in those damaged only once, the plastic rotation values within the given repair cycle will exhibit no significant trends.
However, to compare plastic rotations, in different repair cycles, independent sample t-tests (Issa 1978,Hicks 1982) were utilized. Since beam XXI-1 only experienced 1 damage/repair cycle, its plastic rotation values were chosen to be compared with the plastic rotation values from all the beams that experienced 2, 3, 4, and 5 bends, respectively. In this way, the maximum number of samples could be utilized, while still insuring independence.
First, the means and standard deviations of the plastic rotations were grouped by repair cycle (see Table 41). The following equations were used to determine the test statistic, t', and the degrees of freedom, d f :

150
Table 41. Statistical data for independent samples t-test.
Beamsin
Category
Plastic Rotations (millirad)
CategoryMean(x)
Std Dev (s)
# of Samples (n)
1st Bend XXI-1 6 . 50 2 .38 19
2nd BendXXI-2 XXI-3 XXI-4
6 . 18 1.60 60
3rd BendXXI-3XXI-4 6 . 01 1.90 40
4th BendXXI-3XXI-4 6 . 20 2 .14 40
5th Bend XXI-4 5 . 68 2.25 21
t ’ = y T - Y~2..... (13)
Siz s 2' + ____n- n 2
df =
1 “ s 2' + ____
n l n22 mm 2
Sl 2 s 2 2
I 3 i-* I + . n 2ni + 1 n 2 + 1
- 2 (14)
The Student's t distribution table was again utilized, yielding the P-values shown in Table 42. As can be seen, the P-values were quite low. This indicates that no

151
Table 42. P-values for varying repair cycle numbers
Repair Cycle P-value*
2 70.6%3 78.1%4 67.8%5 86.5%
*P-values represent the confidence level that the average plastic rotations in the repair cycle shown will be less than in the 1st repair cycle.
matter how many times a member has been damaged, plastic rotations will be close in value to those experienced during the first repair cycle, despite any material property differences or plate thickening.
Plastic Rotation Prediction Equation (Category VHAs in angles and channels, it is desirable to predict
plastic rotations in wide flange sections, based on variations in heating parameters. In a past study (Avent and Fadous 1988), a preliminary equation was developed to predict movements in rolled shapes (including wide flanges) based upon the location of the stiffening element with respect to the vee apex and relative to the vee depth (in the case of Category W wide flange sections, the stiffening element is the web). It was concluded, based on limited and quite scattered data, that in undamaged Category W wide flange specimens, the stiffening element (web) has no apparent effect on the plastic rotations.

152
Boudreaux concluded that, for this type of heating pattern, the plate equation was valid. However, it has already been pointed out that Boudreaux's plate equation was influenced by Roeder's extremely high experimental plastic rotations. Also, many of Boudreaux's plastic rotations in the Category W wide flange specimens were higher than even his plate equation would suggest.
The complex heating pattern for this type of damage does not immediately lend itself to a simple "folded plate" approach used for angles and channels to relate plastic rotations. However, it is reasonable to assume that the web (stiffening element) would have less effect on plastic rotations in this type of heating than it would, for example, for channels or angles with the stiffening element at the open end of the vee. In fact, the wide flange beam could actually be considered as a channel with its web shifted to the center of the two flanges. Recall equation lib:
4>c = <|>p [l + 1/2 (ds )(bs )/w2] ......... (lib)
In the case of a Category W wide flange heat, the value for ds/w is always 1/2. For a W6x9 specimen, b s = 6" and w = 4", thus Equation lib indicates 37.5 percent larger movements in Category W wide flanges than in plates.
In the repetitively damaged beams, the average plastic rotation (for 215 heats) was 6.30 milliradians.The modified plate equation (Eqn. 4b) for the same heating

153
conditions (45o vee and 0.50 load ratio) yields a value of 5.32 milliradians (the actual average for the damaged plates was 5.58 milliradians). It is apparent from these data alone, that an increase of only 18% over the modified plate equation in Chapter III exists for plastic rotations in Category W wide flange specimens.
When examining experimental data for the damaged beams, their relationship to plate plastic rotations seem to possess the same magnification characteristic that was initially assumed for both angles and channels (see geometric considerations in Chapter IV). In other words, the magnification would be 1/4 instead of 1/2 to accurately represent the geometric effects on plastic rotations, because only 1/2 of the section is considered due to symmetry. Thus, plastic rotations for Category W wide flanges heat may be rationally estimated using the following equation:
^ wf (w ) = «>p U + 1/4 (ds ) (bs )/w2] ........... (15)
Equation 15 represented the data well (Figure 50) and should be valid for the estimation of plastic rotations in damaged Category w wide flanges with depth ratios between 0.7 5 and 1.00. Regardless of the depth ratio, for Category W beams, the load ratio should not affect the beam-to-plate movement ratio, at least in damaged specimens. Three undamaged Category W specimens in the current study were heated with full depth vees. Of the

Plastic
Rotation
(rad
x 10
E-03
)1 1 -
Wide Flange Equation 15 (Category W)OOOOO Avg Plastic Rotation for W6x9 Category W (215 Heats) Modified Plate Equation 4b1 0 -
9 -
8 -
7 -
6 -
5-
4 -
3 -
2 -
W6x9 (Category W) Load Ratio 0.50
10 20 30 400 50 7060 80 90Vee Angle (Degrees)
Figure 50. Comparison of plastic rotations in repetitively damaged,Category W wide flange beams with Equations 15 and 4b
154
155
three, two agreed well with Equation 15. The other exhibited rather high values, as were found in some, though not all, of Boudreaux's specimens. As shown later in this chapter, residual stresses in the damaged beams are entirely different than in the undamaged specimens, and this fact could be a major reason why the plastic rotations also differ in some cases. Thus, for damaged specimens, conclusions should not be made from a few heats on undamaged specimens.
Statistically Based Predictions for Damage RepairAs for plates, it is important to be able to predict,
with a given amount of certainty, the number of heats necessary to repair a given amount of damage. For this reason, deBejar (1991) again applied both the theory of reliability and spectral analysis (see Chapter III) to the damaged beam data to obtain such predictions.
The following equations were developed to predict the number of heats required to repair a wide flange beam damaged about its weak axis to a known degree of damage, using a 45° vee angle, 0.75 depth ratio, a load ratio of 0.5, and a heating temperature of 1200°F. A general expression to predict the number of heats required to straighten a given damage angle was formulated using one sample test (beam) for each of the repair cycles. Using the principal statistics of the sample, one obtains

156
N = ki + R-Vi./Fi ................. (16)
where R is the target reliability index, = <J>D/mi, and Vj_
= (Tj/mi is the coefficient of variation of the plastic rotations.
An excellent engineering predictor for N (with target reliability R = 2) was developed, independent of the principal statistics of any given sample for any repair cycle:
XN = • [ 1 + 0.11 X * (8 - r)] (17)(6 - r)
where r is the number of the corresponding repair cycle, X = !>[), and is given in milliradians. The probability ofcertainty is approximately 98%.
Following the same methodology applied earlier to plate specimens, the estimation of N, as provided by the theory of reliability were theoretically verified using spectral analysis in the frequency domain. A summary of the results are shown in Table 43. As for the plates, excellent agreement was found between all methods used, and the actual number of heats required for straightening the beams. It is obvious from these results, as seen from the independent samples t-test, that the number of heats is virtually independent of the repair cycle.

157
Table 43. of heats 1991) .
Comparison of different required for damage repair
estimates of the number (from deBejar, et. al,
Sample*/ Reliability Theory Spectral NRepairCycle
(R = 2)Eqn. 16 Eqn. 17
Analysis (Tests)**
XXI-2/1 23 25 25 23XXI-3/2 22 24 26 23XXI-3/3 23 23 24 21XXI-3/4 23 22 23 21XXI-4/5 26 25 26 22
*One representative sample was chosen for each cycle.
repair
**The actual number of heats required for complete straightening.
Residual StressesResidual stresses were experimentally determined by
the sectioning method. The stresses were fairly consistent in the beams with one and two damage/repair cycles and fairly consistent in those with with four and eight damage/repair cycles. This indicates that the number of bends might affect the distribution. No conclusions can be made concerning heating parameter variations in the repetitively damaged specimens, due to the fact that vee angle, depth ratio, and load ratio were consistent for all the specimens. Values of all residual stresses computed for the damaged beams are given in Tables 44 through 48. Values are shown, using an estimated modulus of elasticity of 29,000 ksi as well as

158
Table 44. Residual stresses in damaged beams (1 and 2damage/repair cycles, assumed E = 29,000 KSI).
Strip #
Residualin
XXI-1
Stress (KSI) Beam
XXI-2
TF1 4.72 -0.76TF2 5 . 58 6.02TF3 12 .69 6.96TF4 15 .15 7 .90TF5 18 .13 10.66TF6 21.75 17 .62TF7 19.94 15.88TF8 -7 .76 8.23W1 -14 .32 N . A .W2 -9 . 90 N.A.W3 -6 . 50 N.A.W4 -5 . 58 N.A.W5 -7 . 14 N.A. AVG OF ALLW6 -13.85 N.A. FLANGES
BF1 4 .46 -5 . 22 0.80BF2 10.30 4.42 6 .58BF3 10.65 6 .09 9 . 10BF4 8 . 19 3.77 8.75BF5 16.45 4 .57 12.45BF6 16.39 11.60 16 . 84BF7 23 .42 17 .76 19.25BF8 12.44 3.95 4.22
N .A . = Not shortening.
available because of web distortion due to
the actual values of E obtained from tensile tests on specimens taken from the central damage region (see section on material properties). Stresses in Beams XXI-3 and XXI-4 were also found in 4-inch regions whose centers were four inches to the left and right of the center of damage, respectively to determine how the residual

159
Table 45. Residual stresses in damaged beams (1 and 2damage/repair cycles, measured E values used).
Strip #
Residualin
XXI-1
Stress (KSI) Beam
XXI-2
TF1 4.72 -0.74TF2 6 .52 5.12TF3 12 .69 5.11TF4 12 .59 4 .88TF5 16.25 7.65TF6 20.93 14.40TF7 20.42 14.51 AVG OF ALLTF8 -8.46 8.34 FLANGESBF1 4 .46 -5.06 0.79BF2 12.04 3.76 6.65BF3 10.65 4 .47 7.91BF4 6 .81 2.33 6.34BF5 14.75 3.28 10.05BF6 15.77 9.48 14 .98BF7 23 . 99 16.23 18.65BF8 13 . 56 4.00 4 .44
N.A. = Not shortening,
available because of web distortion due to
stresses changed depending on their location with respect to the damaged area (Figure 49). Individual residual stress distributions for all of the damaged beams are shown in Appendix VII.
Figures 51 (using assumed E) and 52 (using measured E's) show the average residual stresses in the flanges of the specimens for the different categories and locations (the shortening of the beams prevented the measurement of residual stresses in the webs, except for XXI-1). The numerical values of these averages are shown in Tables 44

Stre
ss
(KSI
) St
ress
(K
SI)
Damaged Beams
-4 0 -2 0 0
4 and 8 Repair Cycles (Region B)— 4 and 8 Repair Cycles (Regions A and C)
1 and 2 Repair Cycles
Figure 51. Residual stress distributions in damaged, Category wwide flange beams (estimated E = 29,000 ksi)
160
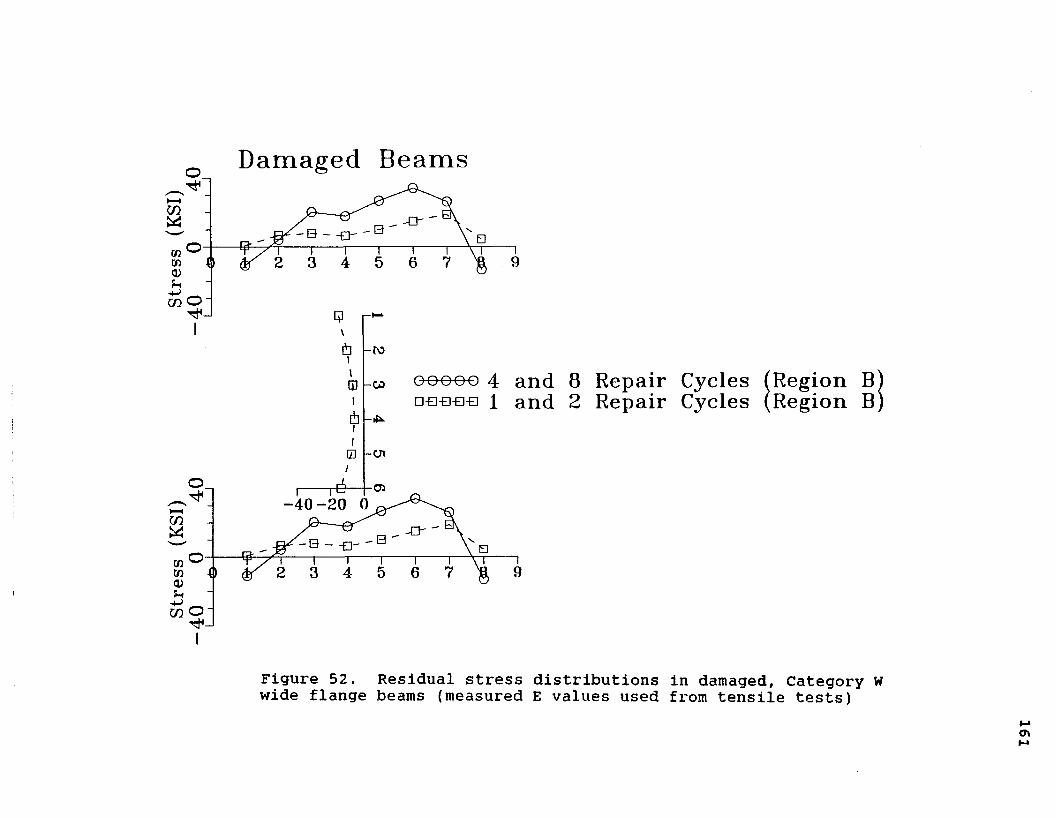
Stre
ss
(KSI
) St
ress
(K
SI)
Damaged Beams
<g 6
o-
q-0q o o 4 and 8 □-ehd-ehd 1 and 2
-CO
C>-4 0 -2 0 0
Figure 52. Residual stress distributions in damaged. Category wwide flange beams (measured E values used from tensile tests)
161
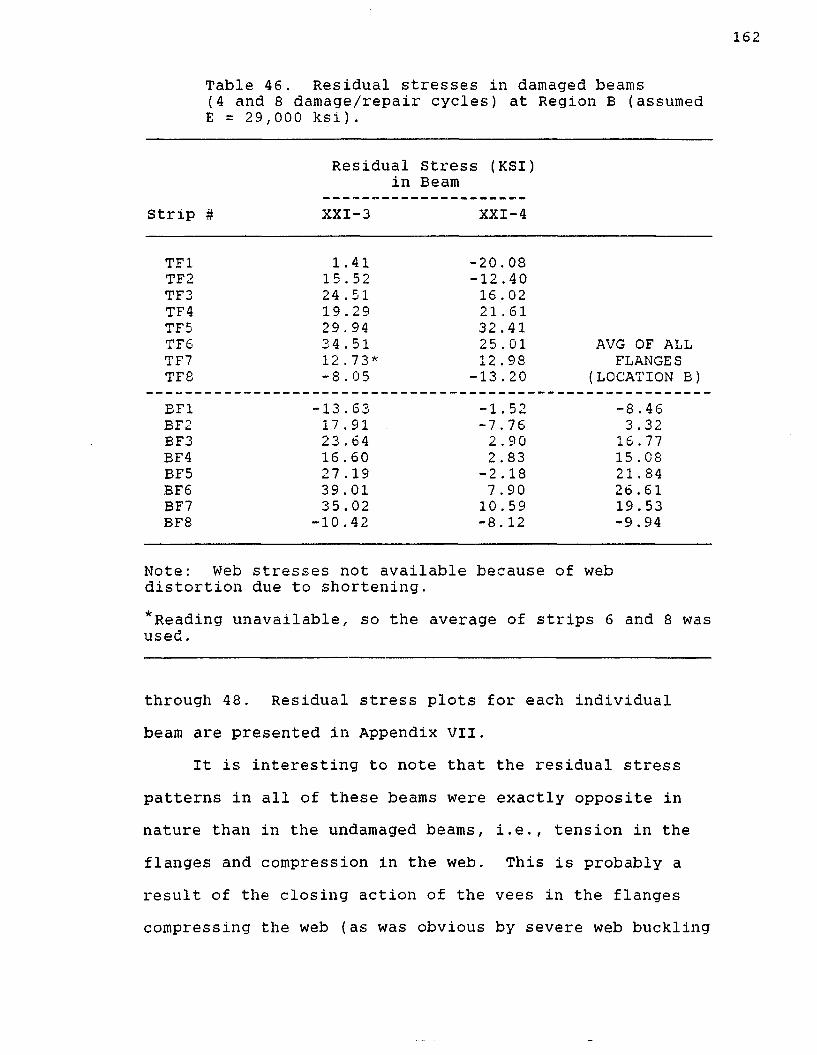
162
Table 46. Residual stresses in damaged beams (4 and 8 damage/repair cycles) at Region B (assumed E = 29,000 ksi).
Residual Stress (KSI) in Beam
Strip # XXI-3 XXI-4
TF1 1.41 -20.08TF2 15.52 -12 .40TF3 24 .51 16.02TF4 19 .29 21 .61TF5 29 . 94 32 .41TF6 34 .51 25 .01 AVG OF ALLTF7 12 . 73* 12 .98 FLANGESTF8 -8 .05 -13.20 (LOCATION B)BF1 -13.63 -1 . 52 -8.46BF2 17.91 - -7 .76 3.32BF3 23 .64 2 .90 16 . 77BF4 16 .60 2.83 15 . 08BF5 27 .19 -2 . 18 21 .84BF6 39 .01 7 .90 26.61BF7 35.02 10.59 19.53BF8 -10.42 -8. 12 -9.94
Note: Web distortion
stresses not available due to shortening.
because of web
*Reading unavailable, so the average of strips 6 and 8 was used.
through 48. Residual stress plots for each individual beam are presented in Appendix VII.
It is interesting to note that the residual stress patterns in all of these beams were exactly opposite in nature than in the undamaged beams, i.e., tension in the flanges and compression in the web. This is probably a result of the closing action of the vees in the flanges compressing the web (as was obvious by severe web buckling

163
Table 47. Residual stresses in damaged beams(4 and 8 damage/repair cycles) at Region B(measured E values used).
Strip #
Residual Stress (KSI) in Beam
XXI-3 XXI-4
TF1 1.76 -26.66TF2 18 .04 -16.55TF3 18 .00 22 .04TF4 19.16 29.21TF5 32.31 44 .14TF6 40.22 34 .22 AVG OF ALLTF7 14 .74* 17 . 90 FLANGESTF8 -10.74 -19 .12 (LOCATION B)BF1 -17.01 -2.02 -10.88BF2 20.81 -10.36 4 .14BF3 25 .51 3.89 20.30BF4 16 .49 3.83 17 .68BF5 29 .35 -2 .97 26.81BF6 45 .47 10.79 34 .13BF7 43 .71 14.61 26 . 13BF8 -13.86 -11.76 -13.22
Note: Web stresses not available because of webdistortion due to shortening.*Reading unavailable, so used.
the average of strips 6 and 8 was
after a number of damage/repair cycles. The residual stress distribution is ideal for column members, and thus, it is likely that sweep-type heat straightening using vee heats is viable for column repair. However the web buckling, if not controlled could definitely limit the number of times a given column could be sufficiently repaired.
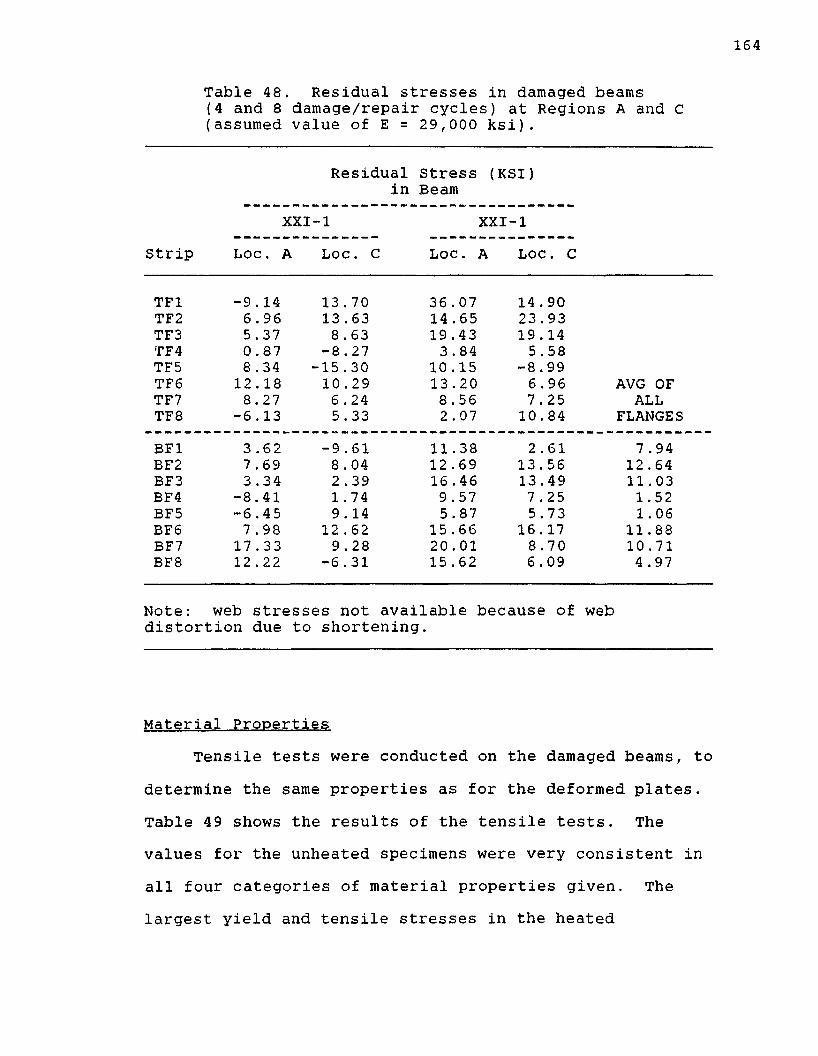
164
Table 48. Residual stresses in damaged beams(4 and 8 damage/repair cycles) at Regions A and c(assumed value of E = 29,000 ksi).
Strip
Residualin
Stress (KSI) Beam
XXI-■1 XXI -1Loc. A L OC. C LOC . A LOC . C
TF1 -9 .14 13 . 70 36 .07 14 . 90TF2 6 .96 13 .63 14.65 23.93TF3 5.37 8.63 19 .43 19 . 14TF4 0 .87 -8.27 3 .84 5.58TF5 8.34 ■15 .30 10 .15 -8.99TF6 12 .18 10 .29 13 . 20 6.96 AVG OFTF7 8. 27 6 .24 8.56 7 . 25 ALLTF8 -6 .13 5 .33 2 .07 10.84 FLANGESBF1 3.62 -9 .61 11 .38 2 .61 7 .94BF2 7 .69 8.04 12 .69 13 . 56 12.64BF3 3 .34 2.39 16 .46 13.49 11 .03BF4 -8.41 1 .74 9.57 7 . 25 1.52BF5 -6.45 9 . 14 5.87 5.73 1 . 06BF6 7 .98 12 . 62 15 .66 16 .17 11.88BF7 17 .33 9 .28 20.01 8.70 10.71BF8 12 . 22 -6.31 15.62 6.09 4 .97
Note : web stresses not available because of webdistortion due to shortening
Material PropertiesTensile tests were conducted on the damaged beams, to
determine the same properties as for the deformed plates. Table 49 shows the results of the tensile tests. The values for the unheated specimens were very consistent in all four categories of material properties given. The largest yield and tensile stresses in the heated

165
Table 49. Material properties of damaged beam specimens.
Specimen/Strip
Yield Stress (ksi
MaximumStress(ksi)
Percent Elong.*
Percent Red. in Area
XXI-1/(UH) 45.4 67 .4 43 63XXI-1/ 2 57.7 73 .6 30 62XXI-1/ 4 53 .9 73.4 36 64XXI-1/ 8 49.4 70.2 29 64XXI-2/(U H ) 47 .6 68.3 42 66XXI-2/ 2 63 .5 78.0 31 60XXI-2/ 4 51.3 75.4 32 61XXI-2/ 8 52.2 71.0 31 65XXI-3/(UH) 45.8 68 . 0 43 65XXI-3/ 2 70.9 82.5 22 59XXI-3/ 4 56.6 75 . 3 26 57XXI-3/ 8 52.7 75.9 27 42XXI-4/(UH) 46 . 8 68. 1 45 66XXI-4/ 2 88.1 99 .1 15 41XXI-4/ 4 51.3 76.3 24 52XXI-4/ 8 49 . 8 71.5 23 61Rate of Strain = 0. 2206 in/in per minute up to yield
= 0. 8824 in/in per minute up to failure.
*All values have been converted to represent an ASTMstandard sized specimen (see ASTM A370 section 11.6.1). A1-inch gage length was used.
specimens were observed in the vee apex region (recall the same characteristic in the damaged plates), although the stresses were also fairly large in the mid-vee region and at the open end of the vee. changes in ductility also followed the same pattern as in the plates. In fact, all of the property changes in beam XXI-1 resembled those for plate XXV-8 (recall that this was the only plate heated with a 0.75 depth vee). This was to be expected, since

166
the heating parameters were identical for these two members.
Table 50 shows the moduli of elasticity for all of the tensile specimens. The values differ from the damaged plate values in that they were not as low in general, and the lowest values were found in the middle region of the flanges rather than at the open end of the vee. It seems possible that, from the results of the damaged plates and the damaged beams, one can assume that original E values for a given specimen (before damage) will be more closely maintained when 3/4-depth vees are used.
Changes in all the material properties became more evident with the increasing number of damage/repair cycles. Table 51 shows the percentages of individual properties in relation to unheated specimens taken from each beam and in relation to the ASTM standard values (yield stress = 36 ksi, tensile stress = 67 ksi, and percent elongation = 34). Although, after two damage/repair cycles, the property changes still compared well with plate XXV-8, after four bends, the increase in yield and tensile stress, and the loss in ductility were sharp. This trend continued until, after eight cycles, the yield stress was a significantly high 88.1 ksi, with a ductility loss of 67 percent. Figures 53 through 55 illustrate the trends in stress increase and ductility loss as a function of repair cycle number.
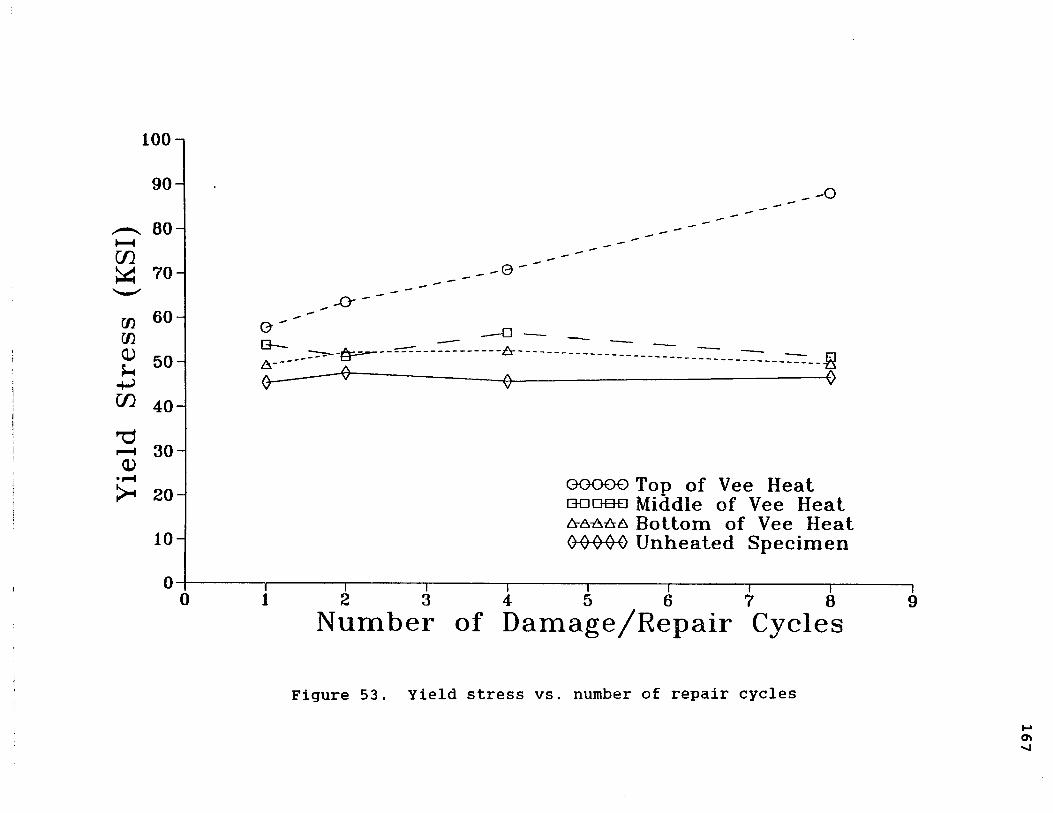
© g o o © Top o f Vee H eat Q D D B O Middle o f Vee H eat a a a a a B o tto m o f Vee H eat 0 0 0 0 0 U n h e a te d S p e c im e n
i i i i--------- 1--------- 1--------- 1--------- 1--------- 10 1 2 3 4 5 6 7 8 9
N u m b er of D a m a g e /R e p a ir Cycles
Figure 53. Yield stress vs. number of repair cycles

Ten
sile
St
ress
(K
SI)
1 0 0 -j
90-
80
0
.-jgi-r _ _ .......701 « §
□A
60H
50
40-
30-
pn_ o o g o o Top of Vee Heat^u_1 qobdo Middle of Vee Heat
a a m a Bottom of Vee Heat l ° “j 000-0-0 Unheated Specimen
0 1 2 3 4 5 6 7 8N u m b er of D a m a g e /R e p a ir C ycles
Figure 54. Tensile stress vs. number of repair cycles
168

45
40d2 35• r H
cdfctf)30d°25w
20ds «
<L>^ 105
0
— 0
Gk
S- - 8 - -
C A -Q-— □
' A
0440-0 Unheated Specimen a a a a a Bottom of Vee Heat bobde Middle of Vee Heat o o g o o Top of Vee Heat
i-------- 1---------1-------- 1-------- 1---------1---------1---------1---------11 2 3 4 5 6 7 8 9
N u m b er of D a m a g e /R e p a ir Cycles
Figure 55. Percent elongation vs. number of repair cycles

170
Table 50. Moduli of elasticity of damaged beam specimens.
Specimen/Strip
Modulus of Elasticity (ksi x 103 )
XXI-1/(U H ) 32 .3XXI-1/ 2 33.9XXI-1/ 4 24 . 1XXI-1/ 8 31.6XXI-2/(UH) 29.4XXI-2/ 2 24 .7XXI-2/ 4 17 . 9XXI-2/ 8 29 .4XXI-3/(U H ) 26.9XXI-3/ 2 33.7XXI-3/ 4 28.8XXI-3/ 8 38.7XXI-4/(U H ) 38.7XXI-4/ 2 39.2XXI-4/ 4 ----------
XXI-4/ 8 — — —
As mentioned in Chapter III, the point at which loss in ductility becomes dangerous is case specific. However, the extreme losses encountered in the repetitively damaged beams show that there is probably a limit to the number of times that any given member should be repaired. It seems that after two cycles, the properties resemble those after one cycle. Thus, whatever is safe to straighten once could be safely straightened twice under the same conditions.
The ductility losses are significantly greater after 4 and 8 damage/repair cycles, respectively. These findings are further substantiated by the fact that during
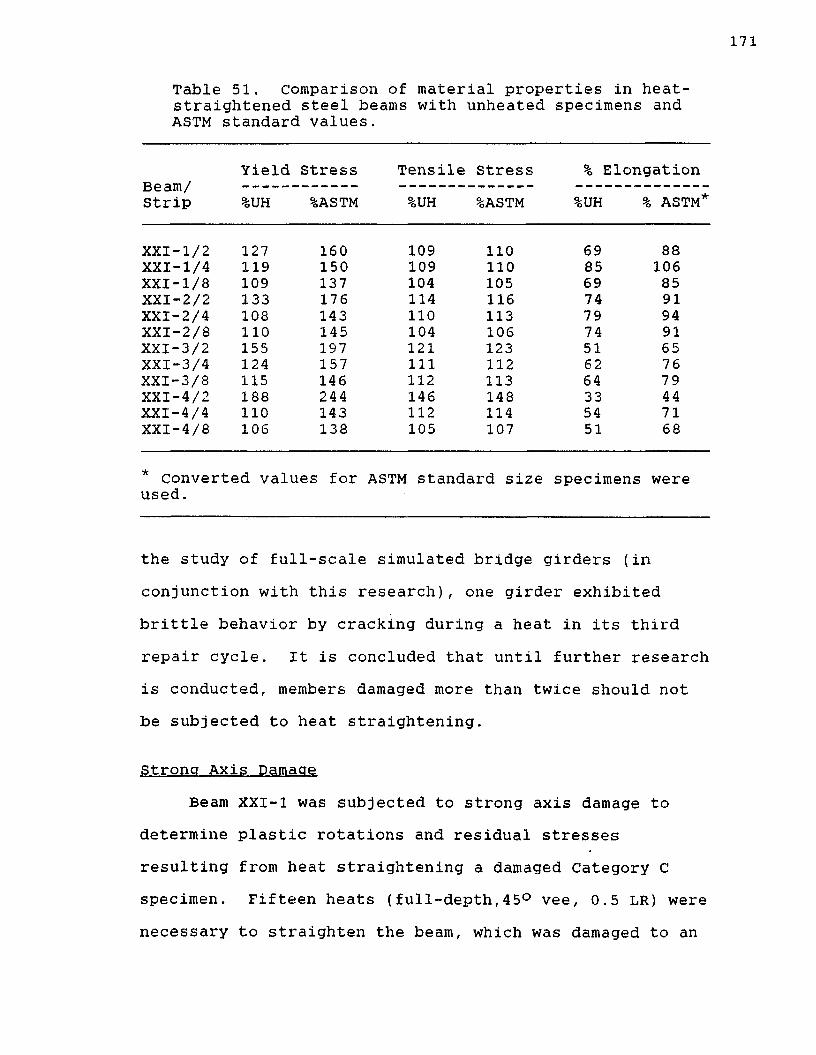
171
Table 51. Comparison of material properties in heat- straightened steel beams with unheated specimens and ASTM standard values.
Beam/Strip
Yield Stress Tensile Stress % Elongation%UH %ASTM %UH %ASTM %UH % ASTM*
XXI-1/2 127 160 109 110 69 88XXI-1/4 119 150 109 110 85 106XXI-1/8 109 137 104 105 69 85XXI-2/2 133 176 114 116 74 91XXI-2/4 108 143 110 113 79 94XXI-2/8 110 145 104 106 74 91XXI-3/2 155 197 121 123 51 65XXI-3/4 124 157 111 112 62 76XXI-3/8 115 146 112 113 64 79XXI-4/2 188 244 146 148 33 44XXI-4/4 110 143 112 114 54 71XXI-4/8 106 138 105 107 51 68
* Converted values: for ASTM standard size specimens wereused.
the study of full- scale simulated bridge girders (inconjunction with this research), one girder exhibited brittle behavior by cracking during a heat in its third repair cycle. It is concluded that until further research is conducted, members damaged more than twice should not be subjected to heat straightening.
Strong Axis DamageBeam XXI-1 was subjected to strong axis damage to
determine plastic rotations and residual stresses resulting from heat straightening a damaged Category C specimen. Fifteen heats (full-depth,45° vee, 0.5 LR) were necessary to straighten the beam, which was damaged to an

172
angle of approximately 6.5°. It should be noted that some local buckling occurred in the top flange during the damaging process, resulting from the compression it experienced. This local buckling was removed by hot mechanical straightening before heat straightening was applied.
Plastic Rotations (Category S)As in the other shapes studied, the plastic rotations
in the Category S wide flanges were related to those of the plates. To illustrate the geometric relationship, consider the wide flange shape in Figure 56a. Two flange legs are folded (Figure 56b) to become a "continuation" of the web (Figure 52c). The shape then resembles a plate with a partial depth vee applied along with a rectangular heat (Top flanges not considered).
The geometric considerations appear very similar to those used for angles (see Chapter IV). However, it is likely that load ratio does not have the significant affect that it had on the angles, because the stresses are lower in the stiffening element of the wide flange shape. In fact, for a load ratio of 0.5, the stresses are 20.2 ksi as compared to the value of 28.71 ksi calculated for the laterally unsupported angle in Chapter IV (Table 23).
With the load ratio not considered as a multiple factor in comparing with the plate equation, the form of Equation lib may be used to predict plastic rotations for
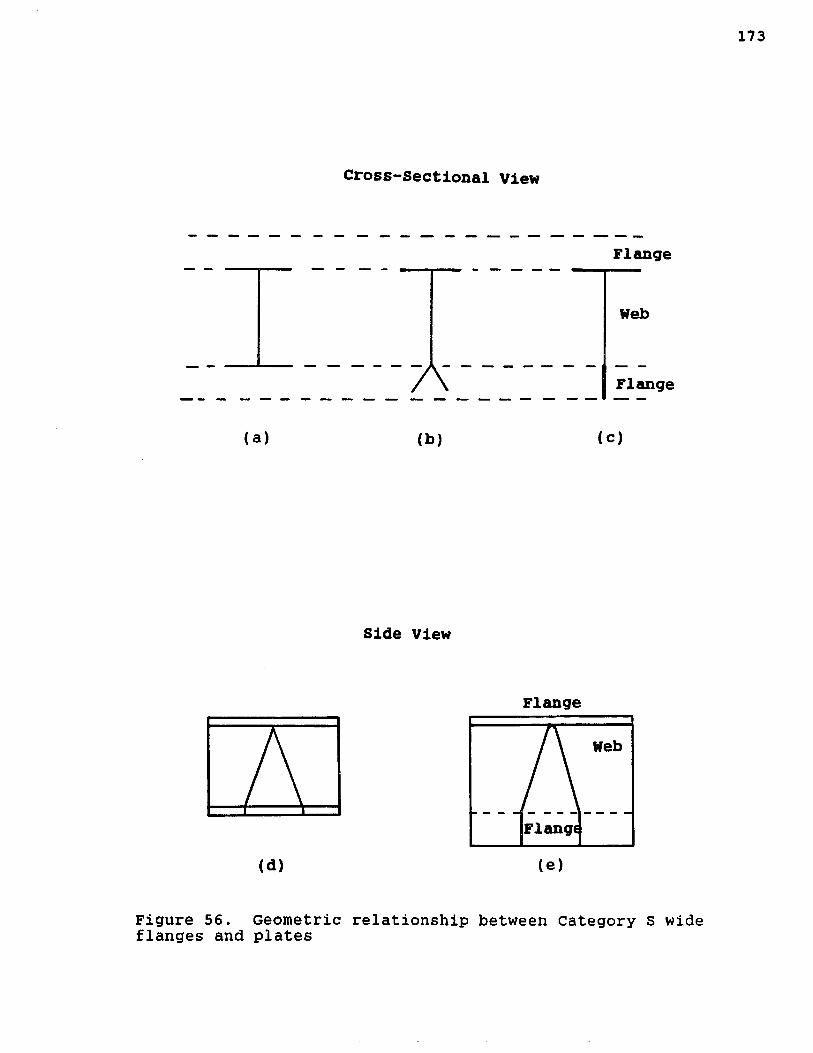
Cross-Sectional view
Flange
Web
A Flange
(a) (b) (c)
Side View
5(d)
Flange
Web
Flangi(e)
Figure 56. Geometric relationship between Category S wide flanges and plates

174
the Category S beams:
4>wf(s) = 4>p [ 1 + 1/2 (ds )(bs )/w2 ] ........... (18)
For all Category S wide flanges, ds/w = 1. For W6x9 shapes, b s = 4", and w = 6" (in this case w is the depth of the web and bs is the width of the flange). With these values, the Equation 18 yields the following:
<t>wf (s) = <t>p [ 1 + 1/2 (1) (4/6) ]= 1.33 <))p
The individual plastic rotations for the Category S beams are presented in Table 52. As for the Category W beams, higher plastic rotations were experienced than for plates under the same heating conditions. The average actual plastic rotation was 7.57 milliradians, as compared to the value of 5.32 milliradians from the plate equation 4b. Thus, the predicted value is 7.08 or 93% of the actual. It is therefore apparent that Equation 18 well represents the plastic rotations in the damaged Category S wide flange specimen (Figure 57).
Plastic rotations were also found for five undamaged Category S beams (Table 32 in Chapter V ) . Most of these values were significantly higher than those determined by Equation 18 (although specimen IV-6 matched the Equation 18 almost exactly). Comparisons are shown in Table 53.Similar results were obtained by Boudreaux, where beams

Plastic
Rotation
(rad
x 10
E-03
) 12-i Wide Flange Equation 18 (Category S)
OOOOO Average Plastic Rotations for W6x9 Category S (15 Heats) Modified Plate Equation 4b1 0 -
9 -
8 -
7 -
6 -
4 -
3 -
2 -
W6x9 (Category S) Load Ratio = 0.50
7010 30 50 60 80 9020 400Vee Angle (Degrees)
Figure 57. Comparison of data from Beam XX-1 with Equations 18 and 4b
175

176
Table 52. Individual plastic rotations for a damaged, Category S wide flange beam (specimen XX-1).
Heat Number Plastic Rotation (milliradians)
1 3 .832 11.633 8.604 8.335 8.346 6.197 7.878 6.729 9.03
10 7.4111 9.9712 3.1113 3 . 8514 8.1515 10.49
Average 7 . 57
with lower load ratios experienced the largest movements relative to Equation 18.
Differences between damaged and undamaged specimens are likely a result of their significantly different residual stress patterns (see below). An in-depth theoretical study is necessary to conclude this. Because of the relatively low number of heats applied to each undamaged specimen, along with wide scatter in plastic rotation values and differences in residual stresses, it is suggested that they not be used as a basis for predicting plastic rotations damaged specimens.

177
Table 53, Category
Comparison of S wide flanges
plastic rotation in to Equation 18.
undamaged
Beam vee M/Mp
Plastic Rotations (milliradians)
Actual Eqn. 18Ratio
ofEqn./Actual
1-1 20 0.00 3.04 1.09 2 .781-2 45 0.00 5 .35 2.45 2.181-4 30 0.00 4 .19 1.63 2 .56
IV-5 45 0.25 7.31 4.76 1.53IV-6 45 0.50 7 .17 7.08 1.01
Residual StressesThe residual stress distribution for Beam XX-1 is
shown in Figure 58. The individual values are shown inTable 54. The stress pattern resembles those of the undamaged specimens, with compression throughout both flanges and tension in the center portion of the web. However the compressive stresses are much higher than in the undamaged specimens, especially near the junctions of the flanges and the web (some undamaged specimens actually had low tensile stresses in this region). Compressive stresses are greatest near the flange tips, as in most of the other types of specimens studied, and these stresses are much higher than commonly assumed residual stresses in wide flange shapes.
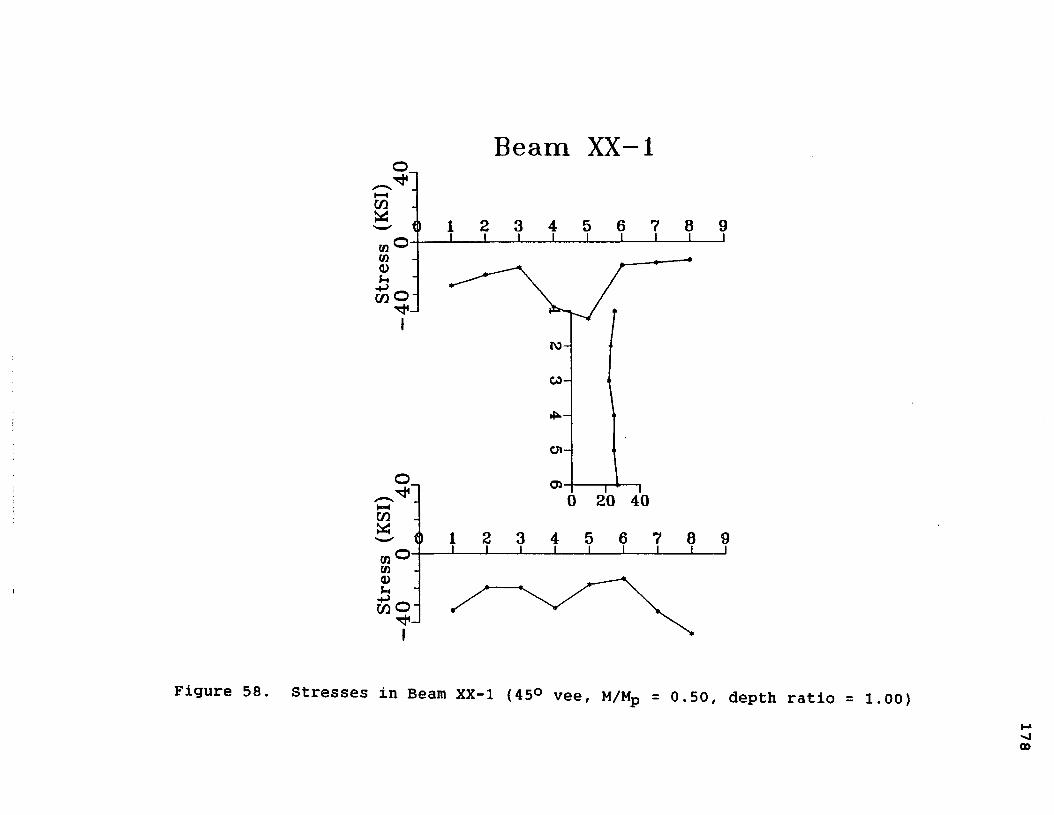
Beam XX-1
C3-
C>
Figure 58. Stresses in Beam XX-1 (45° vee, M/Mp = 0.50, depth ratio

179
Table 54. Residual stresses in a damaged, Category S-wide flange beam (specimen XX-1).
Residual Stress (ksi)Strip # Top Flange Web Bottom Flange
1 -25.34 25.70 -33.102 -19.07 23.04 -19.583 -14.72 22.15 -19.874 -37 .77 24 .90 -31.685 -44.44 24 .75 -18.056 -13 .41 26 .83 -14 .507 -11.93 ----- -33.578 -10.44 -46 .62
ConclusionsThe damaged beam study answered many previously asked
questions about heat straightening. General equations used for other, more simple rolled shapes were found to be useful for predicting plastic rotations for several wide flange specimens damaged about their weak axes and for one specimen damaged about its strong axis. The plastic rotations were quite consistent (with the exception of the first heat of each repair cycle), regardless of the number of heats previously applied within a given repair cycle or the number of damage/repair cycles previously experienced. A statistical study allowed for the
Residual stress patterns were also consistent for various categories of beams: (1) Category W, 1 and 2damage/repair cycles; (2) Category W, 4 and 8 damage/repair cycles; and (3) Category S. The stresses were found to be quite different than those in undamaged
180
specimens heated with the same heating patterns. It is likely that these stresses are responsible for differences in plastic rotations experienced in damaged and undamaged specimens.
Material properties were affected by each damage/repair cycle experienced. Most significantly, yield stress increased greatly and percent elongation was drastically reduced after, at most four damage/repair cycles (possibly three). A suggestion of an upper limit of 2 damage/repair cycles on heat straightening was made. Properties after 1 and 2 damage/repair cycles were similar to each other and resembled those of a plate which was damaged once and subjected to the same heating parameters (3/4-depth vee).
It is likely that using full depth vees will reduce the detrimental effect of loss in ductility experienced most noticeably above the vee apex of a 3/4-depth vee. It has been concluded from the damaged beams as well as the damaged plates that full-depth vees do not cause any more shortening than 3/4-depth vees. Shortening in Category W beams can be predicted using the same equation used to predict shortening in plates. The shortening in the beams causes severe web buckling, and the buckling increases with each damage/repair cycle.
The following chapter presents the conclusions of the research presented in the preceding chapters. Included

181
are the significance of the results as well as suggestions for future research.

CHAPTER VIICONCLUSIONS
For the first time, extensive studies were conducted to study the effects of the heat straightening process on damaged steel specimens. Topics of study included plastic rotations, residual stress patterns, material properties, degree of damage, repetitive damage, and shortening. The various structural shapes studied were plates, angles, channels, and wide flange sections, some of which were subjected to various heating configurations. This chapter summarizes the important findings from this research.
Plastic RotationsA new set of equations has been derived to predict
plastic rotations in both plates and rolled shapes. These formulas were verified by a significant amount of new experimental data added to that previously available, especially for heavily damaged members. This effort represents the first time that a statistically significant number of heats has been applied and measurements recorded in the straightening of damaged members and is considered of major significance. Prior research has almost exclusively centered on applying heats to undamaged members and measuring the curving effect. While a fair amount of data has been generated in the past, the typical
182

183
approach has been to heat many different specimens, but using only a few heats on each specimen (usually less than four). This approach does not reflect the actual heat straightening process where a minimum of 20 heats are typical and the total may reach 100. It also does not account for any effects of damage such as changed residual stress patterns.
The experimentally measured plastic rotations on damaged members typically averaged less than those on identical undamaged members. This behavior is explained by a trend where the first few heats tended to produce higher plastic rotations than those that followed. Obviously, the impact of these first heats on the average value is less as the number of heats are increased. The cause of the phenomenon is attributed to the residual stress patterns. These patterns do not stabilize until after the first few heats at which point the pattern tends to have a detrimental effect on the plastic rotations.
A second significant aspect of this study is that an analytical model was conceptualized and quantified for rolled shapes. The resulting formulas agree well with the experimental results and are suitable for design office use. Prior to this research, the only formulas available were developed for plates only. Past researchers have suggested that these plate equations also be used for rolled shapes. However, the experimental evidence showed that such equations were grossly inaccurate when applied
184
to rolled shapes. The formulas developed here are rationally based and consistent with the concept that rolled shapes can be viewed as folded plates. If the shape is first unfolded, the heating pattern analyzed, and then the shape refolded, it becomes apparent that the plastic rotations are usually magnified over those computed using a plate formula.
Related to the above is a third significant aspect of this study: The development of a new formula forcomputing the plastic rotations of plates. The rational basis for this formula is associated with the understanding that the primary strain during the application of a vee heat occurs in the central two-thirds area of the vee itself. The developed formula is suited for design office use and agrees well with most of the previously published data. It particularly reflects the behavior associated with plastic rotations when straightening damaged plates.
A summary of the basic equations for plates and rolled shapes are as follows:For plates straightened about their major axis:
<> p = [0.5 + 0.00125(T-750) ] (0.9 + 3.4 M/Mp ) e p (T ) sin (0/3 )
For angles:
<t>a = <|>p [1 + 1/2 (ds ) (bs)/w2][i + 2(M/Mp) ]

185
For channels and Category S wide flanges:
= ^wffs) = 4>p £ + 1/2 (ds )(bg)/w2]
For Category W wide flanges:
4»wf(w) = <t>p U + 1/4 (ds ) (bs) /w2]
Residual StressesFor the first time, residual stresses were
experimentally determined in various vee-heated, undamaged and damaged plates, angles, channels, and wide flanges, using the sectioning method. For undamaged plates subjected to various load and depth ratios (4 heats each), stress distributions were found to be fairly consistent within a practical range of vee angles (20° through 60°). The patterns resembled in shape the normalized residual stress pattern found by Roeder's finite element computer program for single vee heats on undamaged plates. Compressive stresses near the flange tips averaged 100 percent higher than commonly assumed stresses in structural plates.
Damaged plates experienced lower stresses than the undamaged plates though the pattern was similar. Degree of damage (strain) seemed to affect the stresses. It was observed that residual stresses were similar at different locations along a smooth curvature distribution (characteristic of large angles of damage), where the

186
strains were quite large. At lower angles of damage, the residual stresses were highly variable at different locations along the yield zone, where curvature is also more variable. The number of heats applied to damaged plates did not seem to be a significant influencing factor on their residual stresses.
Residual stresses were found for both damaged and undamaged angles. The stress patterns were similar, regardless of the location of the stiffening element with respect to the vee apex. The similarity in stress patterns of damaged and undamaged specimens is probably one reason why the plastic rotations of both were similar.
Stresses in the undeformed Category W wide flange beams exhibited compressive stresses in most, if not all of both flanges, and tensile stresses in the central portion of the web. However, just the opposite was the case for the damaged Category W specimens, with tensile stresses throughout most of both flanges (some compressive stresses near the flange tips). The differences in the two patterns are probably one reason why plastic rotations in some of the undamaged beams were significantly higher than in the damaged specimens. Stresses in Category S beams (undamaged and damaged) resembled those for undamaged Category W beams in shape (though different in magnitude). Stresses in the damaged Category W specimens were different when compared to the undamaged specimens

187
(again, probably a reason for differences in plastic rotations).
Material PropertiesThis study is one of the few cases where material
properties were determined from tensile tests conducted on specimens taken from the damaged plates and damaged beams. The properties of yield stress, tensile strength, percent elongation, percent reduction in area, and modulus of elasticity were recorded. Specimens were taken from the top, middle, and bottom of the plates (one flange was used for the beams), and one specimen was taken from an unheated portion of the member.
Most of the plates exhibited similar material properties, with the properties being highly variable depending on their location within the particular plate.In general, for the heated area there was an increase in yield stress, a decrease in percent elongation, and little change in tensile stress when compared to the unheated specimens. These changes were most significant at the top of the vee, and greatest in the case of a 3/4-depth vee.
As was shown in the repetitively damaged beams, the same effects on the material properties occurred, and these effects were magnified each time a beam went through the damage/repair cycle. The extreme losses in ductility after two cycles lead to the suggestion that members damaged more than twice should not be heat straightened.

188
The cracking of a beam during its third repair cycle in a related field study verifies this conclusion.
Moduli of elasticity were also found to be quite variable in the heated portions of both the plates and the beams. In the plates, low values of E were found primarily at the open end of the vee. However, in the beams, the lowest values of E (in some cases they were not too low) were found at the intersection of the flange and web. It is possible that in both cases, too much heat was experienced in these regions. However, it is also possible that some of the values simply represent normal scatter in E values.
ShorteningA plate that is damaged about its strong axis and
straightened using vee heats will undergo some shortening. It was concluded from "before and after" measurements on several damaged plates and Category W beams that the use of depth ratios between 0.75 and 1.00 will result in similar amounts of shortening. In the W6x9 wide flange beams, the shortening caused the thin web to buckle. This buckling grew progressively worse after each damage/repair cycle. It is possible that this buckling might be prevented, and it might not be as severe in thicker webs. Regardless of web buckling, however, shortening itself might be a limiting factor on the use of heat straightening in some damage situations. A general

189
formula was developed to predict shortening which applies to all sections:
S = 0.02 (w) ( <J) D ) (19)
where s is shortening in inches, w is the width or depth of the plate element that is being vee-heated, and <1>D is the angle of damage in degrees.
Significance of ResultsThe results of this study answered many questions
concerning the actual repair of damaged steel that in past studies were ignored or only briefly addressed. Using the material developed here, an engineer can classify damage, and based on the classification, be able to predict: (1)the number of heats required to straighten the damage, (2) the residual stresses resulting from the straightening,(3) the amount of shortening that the member will experience as a result of the damage/repair cycle, and (4) the tensile properties of the material.
This study has pointed out several characteristics of heat-straightened steel that are entirely different in damaged specimens than for undamaged specimens. The undamaged studies, past and present, were useful, especially in determining changes in plastic rotations and residual stresses brought about by variations in heating parameters. However, this study indicates the importance of not assuming too much about the use of heat

190
straightening, based on limited studies of undamagedspecimens.
Recommendations for Future ResearchMany variables exist in actual damage situations, and
heat straightening research, in a scientific sense, is relatively new. Therefore, there is no doubt that in the future, more developments will be made to contribute to existing knowledge of heat straightening. For example, research is currently being conducted at Louisiana State University on full-scale simulated bridge girders, including composite members, and the effects of axial loads. In light of the research conducted here the following recommendations are given:
1. Through the understanding of the relationship between plastic rotations in plates to those of various, more complex shapes, current heating patterns may require modification to increase plastic rotations in these shapes. Also, the out-of-plane movements experienced in angles probably could be prevented with the use of some form of modified heating pattern. It is recommended that a comprehensive study be undertaken to determine the most effective heating patterns for common damage situations.
2. Often, damage is more involved than simple bending about a single axis. Twisting, as well as localized buckling of structural components, can occur.For these cases, it is recommended that residual stresses,
191
material properties, and plastic rotations resulting from heat straightening be measured. Field measurements of actual structures would be particularly helpful.
3. The effect of fatigue life for heat-straightened members is still an unknown quantity. It is recommended that a comprehensive study be conducted to assess the fatigue life and fracture characteristics of damaged steel repaired by heat straightening.
4. In order to further verify the analytical models developed here, it is recommended that additional measurements of plastic rotations be taken on angles, wide flanges and channels of different sizes.
5. There are indications that high load ratios may result in fracture during heat straightening, particularly if damage is severe or repetitive. It is recommended that a test series be conducted to determine the possible effects of high load ratios.
Recommendations for Applying Heat Straightening in Practice1. The same damaged areas should not be repaired by
heat straightening more than twice.2. Where practical, full-depth vee heats are
preferable to 3/4-depth vee heats. The effects on material properties are less severe, and axial shortening is no larger than for partial depth vees.
3. The angle of damage, <J)D , rather than radius ofcurvature is the best measure of degree of damage.

192
4. The formulas given here for computing plasticrotations should be used in determining the number of heats required to straighten a given angle of damage. The number of heats, n, required to repair a damaged member can be computed by
n = <l>D/<t>
where is the angle of damage, and <|) is the plasticrotation from one vee heat.
5. The residual stresses in heat straightened steelare typically larger than normally found in undamaged steel. This phenomenon could result in a somewhat reduced capacity for some column types. However, the residual stress values are no larger than those of welded built-up sections. Therefore, the current AISC (1986) design curve (a single column curve) is applicable for computing capacity after heat straightening. For codes where multiple column curves have been adopted, the heat straightened column should be in the same category as welded built-up members.
6. Heat straightening can be applied to degrees of damage having strains up to 100 times the yield strain.
7. Material properties of heavily damaged steel (around 100 times yield strain) after heat straightening were approximately the same as those of undamaged steel and less damaged steel (around 30 times yield). This research indicates no justification for limiting the
193
amount of damage that can be repaired in fracture critical areas.

REFERENCES
American Institute of Steel Construction (1986),Manual of steel Construction. Load Resistance Factor Design. 1st edition.
American Railway Engineering Association (1946) Shortening Eyebars to Equalize the Stress,"Bulletin No. 460.
Avent, R. R., and Wells, s. (1979) "Factors Affecting the strength of Thin-Wall Welded Columns,"Engineering and Industrial Research Station Report No. MSSU-EIRS-CE-79-7, Mississippi State University, Mississippi State, MS, May.
Avent, R. R., and Wells, S. (1982), "Experimental Study of Thin-Web Welded H Columns.",Journal of the Structural Division. ASCE, Vol. 108, No. ST7, July.
Avent, R. R. , (1989) "Heat-Straightening of Steel:Fact and Fable," Journal of Structural Engineering. ASCE, Vol. 115, No. 11, November.
Avent, R. R. and Fadous, G. M. (1989), "Heat-Straightening Prototype Damaged Bridge Girders," Journal of Structural Engineering. ASCE, Vol. 115,No. 7, July.
Avent, R. R. and Fadous, G. M. (1987), "Heat-Straightening Effects on the Behavior of Full-Scale Simulated Bridge Girders," First Interim Report of Phase 2 . Louisiana Transportation Research Center, Louisiana State University, Baton Rouge.
Avent, R. R. and Boudreaux, R. J. (1987), "Heat-Straightening Effects on the Behavior of Plates and Rolled Shapes," Second Interim Report of Phase 1. Louisiana Transportation Research Center, Louisiana State University, Baton Rouge.
Avent, R. R. (1987), "Use of Heat-Straightening Techniques for Repair of Damaged Steel Structural Elements in Bridges," Phase 1: Interim Report. Louisiana Transportation Research Center, Louisiana state University, Baton Rouge.
194

Barsom, J. M. and Rolfe, S. T. (1987), Fracture & Fatigue Control in Structures - Applications of Fracture Mechanics. 2nd Edition. Prentice-Hall, Englewood Cliffs, New Jersey.
Benjamin, J. R. and Cornell, c. A. (1970),Probability. Statistics, and Decision for Civil Engineers. McGraw-Hill, New York.
Bernard, P. and Schulze, K. (1966), "FlameStraightening in Ship-building," Mittelunge der BEFA (Beratungsstelle fur Autogen Technik), Vol. 17, No. 11, pp. 2 06 (German).
Blodget, 0. W. (1972), "Distortion . . . How Metal Properties Affect It," Welding Engineer. February, pp. 40-46.
Boudreaux, R. J. (1987), "Heat Straightening of Steel: Identifying the Important Parameters andPredicting Member Response," MS Thesis, Louisiana State University, Baton Rouge.
Brockenbrough, R. L.(1970), "Theoretical Stresses and Strains from Heat Curving," Journal of the Structural Division. ASCE, Vol. 96, No. ST7, Proc. Paper 7410, July, pp. 1421-1444.
Brockenbrough, R. L. and Johnston, B. G. (1970),"Criteria for Heat Curving steel Beams and Girders," Journal of the Structural Division. ASCE, Vol. 96,No. ST10, October, pp. 2209-2226.
Brockenbrough, R. L. and Ives, K. D. (1970), "Experimental Stresses and Strains from Heat Curving," Journal of the Structural Division. ASCE, Vol. 96, No. ST7, Proc. Paper 7400, July, pp. 1305- 1331.
Brockenbrough, R. L. and Johnston, B. G. (1968), uss Steel Design Manual. U. S. Steel Corporation, Pittsburgh, PA.
Burbank, B. B. (1968), "Straightening DistortedWeldments," Report to the Ship structure Committee, Report No. SR-185, July.
Ciesicki, H. and Butler, S. (1958), "Flame Camber Your Own Beams," Industry and Welding. April.
Crooker, T. W. and Harrison, H. L. (1965), "TheEffects of Flame Cambering on the Bending strengths of I-Beams," Welding Journal. Vol. 44,No. 12, December, Research Supplement, pp. 545s-548s.
deBejar, L. A., Robinson, P. F. and Avent, R. R . ,"Risk Consistent Estimate of Heat-Straightening Applications. I: Plates," Journal of Structural Engineering, ASCE, (submitted for review).
deBejar, L. A., Robinson, P. F. and Avent, R. R.,"Risk Consistent Estimate of Heat-Straightening Applications. II: Beams," Journal of structural Engineering, ASCE, (submitted for review).
Ditman, O. (1961), "Determination of ThermalShrinkage in structural steel," MS Thesis, University of Washington.
Enaineering-News Record (1959), "How Fire Destroyed and Fire Repaired Air Force Hangers," June 18, p p . 50-53.
Fadous, G. M. (1987), "Heat-Straightening Effects on the Behavior of a Full-Scale Simulated Bridge Girder," MS Thesis, Louisiana State University, Baton Rouge.
"Flame Buckled This Steel . . . And FlameStraightened It," (1959) Part 1, Welding Engineer. February, pp. 43.
For Chin, W. (1962), "Linear Shrinkage of Steel," MS Thesis, University of Washington.
Gipson, G. S. and Ortiz, J. C. (1986), "Toward an Analytical Description of the Heat-Straightening Phenomenon - The Thermal Problem," SECTAM XIII Proceedings.
Graham, R. (1975), "Investigation of FlameStraightening Methods for steel Structures," Boeing Co. Manufacturing Development Report, MDR 2-32075, October 30.
Harrison, H. L. (1952), "Straightening Structural Members in Place," Welding Journal. Vol. 31, No. 5, May Research Supplement, pp. 257s-262s.
Harrison, H. L. and Mills, B. D., Jr. (1951),"Effects of Light Peening on the Yielding of steel," Welding Journal. Vol. 30, No. 5, May Research Supplement, pp. 251s-253s.

Harrison, H. L. (1950), "A Study of the Holt Method of Heat (Contraction) Straightening," MS Thesis, University of Washington.
Hicks, C. R. (1982), Fundamental Concepts in theDesign of Experiments. Third Edition. Holt, Rhinehart and Winston, New York.
Higgins, T. R. (1966), "Discussion on the Effects of Flame Cambering on the Bending Strength of I-Beams," Welding Journal. Vol. 45, No. 6, June Research Supplement, pp. 284s-288s.
Holt, J. E. (1955), "Flame Straightening: A Friendin Need," Welding Engineer. Vol. 40, No. 10, October, pp. 44-46, No. 12, December, pp. 30-31.
Holt, J. E. (1938), Contraction as a Friend in Need. Typed and Copyrighted.
Holt, R. E. (1971), "Primary Concepts in FlameBending," Welding Engineer. Vol. 56, No. 6, June, pp. 416-424.
Holt, R. E. (1965), "Flame Straightening Basics,"Welding Engineer. Vol. 50, No. 9, September, pp. 49- 53 .
Holt, R. E. (1977), "How to Control and CorrectWarping," Welding Design and Fabrication. June, pp. 98- 102.
Horton, D. L. (1973), "Heat Curved Mild Steel Wide Flange Sections: An Experimental and TheoreticalAnalysis," MS Thesis, University of Washington.
Issa, R. R. (1978), "An Experimental Study of Various Factors Affecting the Bond Strength of Epoxy Repaired Timber Structures," MS Thesis, Mississippi State University.
Ki’nara, H. , Hisida, M. and Fujita, Y. (1961), "On the Residual Stresses Due to Spot Heating," Document No. X-267-61, International Institute of Welding. Commission X.
"Kinks Go Up in Flames," (1981) Engineering News Record. April 9, p. 17.
Maeda, T. and Yada, T. (1963), "Fundamental Nature of Shrinkage Distortion Due to Spot Heating on a Rectangular Plate," Document No. X-327-63, international Institute of Welding. Commission X.

Maeda, T. and Yada, T. (1961), "Investigation ofShrinkage Due to Multiple Spot Heating," Document No. X-268-61, International Institute of Welding. Commission X.
Masubuchi, K. (1960), "Calculation and Measurement of Residual Stresses Due to Spot Heating," Document No. X-259-60, International Institute of Welding. Commission X.
Moberg, K. L. (1979), "Damage Assessment andContraction Straightening of Steel Structures," MS Thesis, University of Washington.
Morris, J. J. (1949), "Controlled Distortion - An Aid to Metal Working," Welding Journal. Vol. 28, No. 11, November, pp. 1080-1082.
Meyers, P. S. (1976), "Fundamentals of Heat Flow in Welding", Welding Research Council Bulletin. No. 123, July.
Newman, E. M. (1959), "Repair of Fire Damaged Structural Steel," Military Engineer. No. 344, November-December, pp. 448-450.
Nicholls, J. I. and Weerth, D. E. (1972),"Investigation of Triangular Heats Applied to Mild Steel Plates," Engineering Journal. AISC, October, pp. 137-141.
"Oxyacetylene Torches Straighten Fire-Warped Steel," (1959), Welding Engineer. March, pp. 31-34.
Pattee, H. E., Evans, R. M. and Monroe, R. E. (1970), "Effect of Flame and Mechanical Straightening on Material Properties of Weldments," Summary Report on Ship structure Committee on Project SR-185, straightening Distorted Weldments.
Pattee, H. E., Evans, R. M. and Monroe, R. E. (1969), "Flame Straightening and Its Effect on Base Metal Properties," Summary Report to Ship Structure Committee concerning the first phase of Project SR- 185, Straightening Distorted Weldments, Battelle Memorial Institute, Columbus, Ohio, August.
Pfeiffer, R. (1963), "The Flame straightening of Sheeting and Sheet Metal Structures," Mitteilungen der BEFA, Vol. 14, No. 9, pp. 1-7 (German).

Roeder, C. W. (1986), "Experimental Study of Heat Induced Deformation," Journal of Structural Engineering. ASCE, Vol. 112, No. 10, October, pp.2247-2262.
Roeder, C. W. (1987), "Predictions of Deformations Due to Heat Curving," Bridges and Transmission Line Structures. ASCE, New York, pp. 101-110.
Roeder, c. W. (1985), "Use of Thermal Stress for Seismic Damage Repair," Final Report on NSF Grant CEE-82-05260. University of Washington, Seattle, October.
Rothman, R. L. (1973), "Flame straightening Quenched and Tempered Steels in Ship Construction," ship Structures Committee, Report No. 247.
Rothman, R. L. and Monroe, R. E. (1973), "Effect of Temperature and Strain Upon Ship Steels," Ship Structures Committee, Report No. 235.
Shanafelt, G. O. and Horn, W. G. (1984), "Guidelines for Evaluation and Repair of Damaged Steel Bridge Members," NCHRP Report No. 271, Transportation Research Board, National Research Council, Washington, DC, June.
Structural stability Research Council (SSRC) (1976), Guide to Stability Design Criteria for Metal Structures. Third Edition. John Wiley & Sons, New York.
Thatcher, w. M. (1967), "Horizontally Curved steel Girders - Fabrication and Design Considerations," Engineering Journal. AISC, July.
Tsalman, L. B. (1959), "Straightening WeldedStructures by Heating with an Oxy-Acetylene Flame," Welding Production. 5, pp. 29-31 (Russian).
U.S. Steel Corporation (1966), "Steels for Elevated Temperature service," ADUSS 43-1089.
Wanatabe, M. and Satoh, K. (1951), "On the Correction of Distortion in Welded Thin Plate Structures," Journal of the Japan Welding Society. Vol. 20, pp. 194-202 (Japanese).
Weerth, D. E. (1971), "Theoretical and Experimental Analysis of Heat Curved Mild steel," MS Thesis, University of Washington.

APPENDIX I
RESIDUAL STRESSES (UNDAMAGED PLATES)
200

Stri
p N
um
ber
Plate 1-1
50 -40 -30 -20 -10 0 10 20 30 40 50Residual Stress (KSI)
Figure A 1 . stresses in Plate i-l (20° vee, M/Mp=0.00, depth ratio=1.00)

Stri
p N
um
ber
Plate 1-2co-
<Q -
co-
-50 -40 -30 -20 10 20 30 40 50Residual S tress (KSI)
Figure A2. Stresses in Plate 1-2 (45° vee, M/Mp =0.00, depth ratio=1.00)
202

Strip
Numb
erPlate 1-3
co-
30 -20 -10 0 10 20 30 40 50Residual Stress (KSI)
Figure A3. Stresses in Plate 1-3 (60° vee, M/Mp=0.00, depth ratio=1.00)
203

Stri
p N
um
ber
Plate I I - 1
co-
-50 -40 -30 -20 -10 0 10 20 30 40 50Residual Stress (KSI)
Figure A 4 . Stresses in Plate Il-l (20° vee, M/Mp=0.00, depth ratio=1.00)
204

Stri
p N
um
ber
Plate VI-4
co-
o 30 -20 -10 0 10 20 30 40Residual Stress (KSI)
Figure A5. Stresses in Plate VI-4 (45° vee, M/Mp =0.50, depth ratio=0.75)
205

Plate VI-6
CO
CO 30 - 2 0 -10 0 10 2 0 30 40 50Residual Stress (KSI)
Figure A 6 . Stresses in Plate VI-6 (45° vee, M/Mp =0.00, depth ratio=0.75)foo

Stri
p N
um
ber
Plate V I -10
oo-
CQ-
co-
-50 -40 -30 - 2 0 -10 0 10 2 0 30 40 50Residual Stress (KSI)
Figure A 7 . Stresses in Plate VI-10 (82° vee, M/Mp=0.50, depth ratio=0.75)
207

Stri
p N
um
ber
Plate VI-1203
00
co-
30 -20 -10 0 10 20 30 40 50Residual Stress (KSI)
Figure A 8 . Stresses in Plate VI-12 (82° vee, M/Mp =0.00, depth ratio=0.75)
208

APPENDIX II
PLASTIC ROTATIONS (DAMAGED PLATES)
209
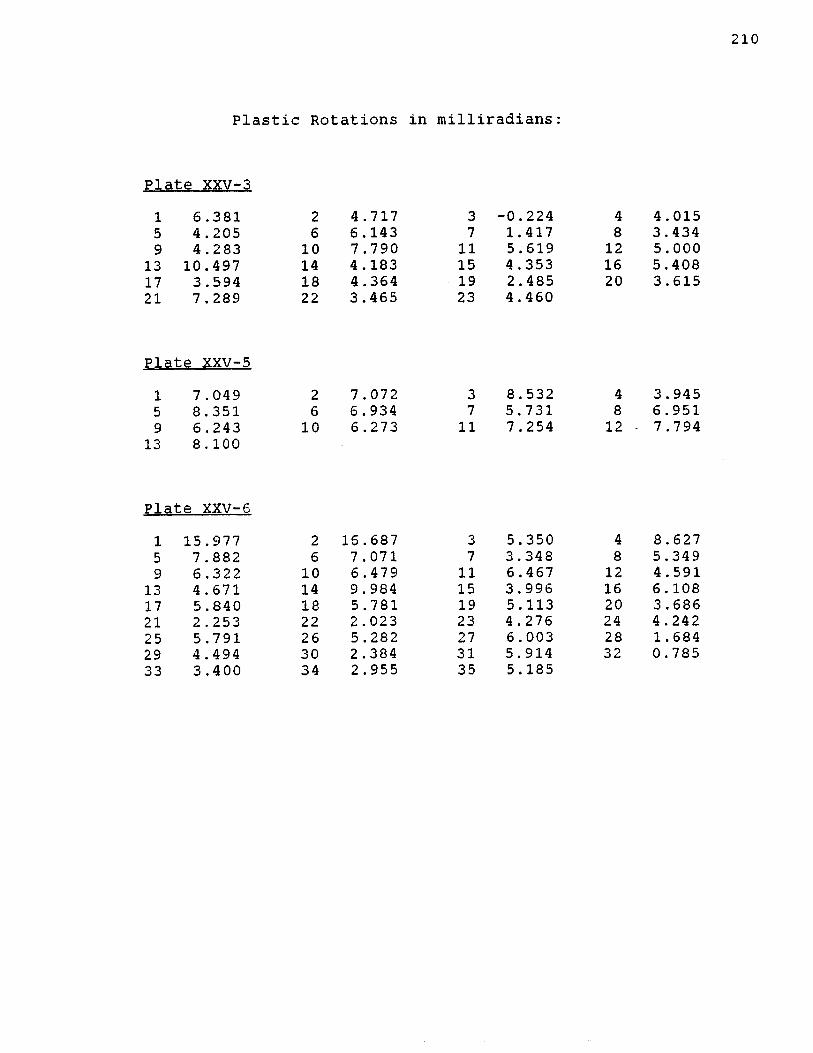
210
Plastic Rotations in milliradians:
Plate XXV-31 6 .381 2 4.7175 4 . 205 6 6 .1439 4 .283 10 7 .790
13 10.497 14 4 .18317 3 .594 18 4.36421 7 . 289 22 3.465
Plate XXV-51 7.049 2 7 .0725 8.351 6 6.9349 6.243 10 6.273
13 8.100
Plate XXV-61 15.977 2 16 .6875 7.882 6 7 .0719 6.322 10 6 .479
13 4.671 14 9.98417 5.840 18 5.78121 2.253 22 2.02325 5.791 26 5 .28229 4.494 30 2.38433 3.400 34 2 .955
3 -0.224 4 4 .0157 1.417 8 3 .434
11 5.619 12 5.00015 4 .353 16 5.40819 2 .485 20 3 .61523 4 .460
3 8.532 4 3 .9457 5.731 8 6 .951
11 7 . 254 12 7 .794
3 5.350 4 8.6277 3 .348 8 5 .349
11 6 .467 12 4.59115 3.996 16 6.10819 5.113 20 3 .68623 4 . 276 24 4.24227 6 .003 28 1.68431 5.914 32 0.78535 5.185

211
Plastic Rotations in
Plate XXV-71 6 .632 2 8.0645 2.574 6 2.9359 6 .644 10 6.228
13 7 .940 14 5.36817 2.910 18 11.55821 3.926 22 2.00125 5.226 26 4 .93129 3.302 30 3.85933 5.937 34 4 .37237 4.759 38 5 .47241 3.366 42 5 .85045 4 .607 4b 2.87649 6 .330 50 6 .23153 9 .332 54 4.37957 4.560 58 8.455Plate: XXV-81 7.795 2 4 .4655 8.042 6 5.5289 5 .700 10 5.611
13 4.528 14 5 . 35917 6.170 18 -0 .82021 2 .625
milliradians:
3 8.255 4 8.1277 5.900 8 8.000
11 2.870 12 3.22515 3.950 16 7 .47919 12.121 20 7 .18123 4.266 24 4 .32727 1.980 28 4.72531 4.412 32 3.76235 1.911 36 5.28939 10.323 40 8.30043 10.552 44 4 .47747 5.608 48 10.25451 2.524 52 5.92355 2.545 56 3.240
3 4 .451 4 4.3177 4 .140 8 5.580
11 6 .457 12 2 . 62415 4 . 579 16 3 .92019 4 .485 20 2.895

Ht
123456789
1011121314151617181920212223242526272829303132333435
212
Plastic Rotations in milliradians:
Plate XXV-4
P.R. Ht # P.R. Ht # P.R.
2 . 506 36 6.036 71 7 .4909.638 37 3 . 003 72 4 .359
-3.984 38 4.250 73 3.68210.555 39 2.330 74 3.9825.475 40 5 .980 75 1.441
-3 .768 41 0.241 76 1.9242 . 839 42 5.465 77 4 .1733 .582 43 1.544 78 2.4534 . 101 44 3.875 79 2.3297 .883 45 0.350 80 4 .1203.604 46 8. 535 81 3 .8173 .516 47 7 .337 82 3.4184 . 204 48 5 . 046 83 3 . 6286.636 49 4.024 84 1. 0484.578 50 1.812 85 2.9152 .498 51 1.675 86 1 .4285 . 109 52 2 .489 87 9 . 9522 .330 53 3 .156 88 7 .7572 .436 54 3.350 89 -0.1804 .782 55 2 .434 90 4 .7417 .160 56 3.079 91 2.6131 .046 57 3.025 92 0.8392 . 556 58 2.907 93 6. 1565.015 59 1.147 94 3 .803
-0.233 60 4.342 95 3.5083 .695 61 3.803 96 5.6389 .314 62 6. 164 97 1 .165
14 .585 63 1.878 98 2.6995.270 64 4 . 542 99 0.8956 .704 65 4.057 100 1.5053.811 66 5.167 101 0.7354.972 67 3.622 102 1.6953.692 68 3.981 103 1.8303 .277 69 2 .314 104 2.0705 .112 70 3.679 105 4.620------------ — ------------ 106 9.675

213
Plastic Rotations (milliradians)
Plates: XXV-9 XXV-10 XXV-11 XXV-12
Ht # P.R. P.R. P.R. P.R.
1 4 .137 2.286 5.404 5 .8082 4 . 239 3 . 527 18.663* 5 .0743 3.538 2.508 -8.177* 4 .7994 1.492 2 .749 4 .585 2 . 5305 2.044 1.993 2.928 5 .4146 4 .630 2.795 4 .228 6.5957 -0.073 3.813 6.870 2 . 2798 3 .396 1 .672 2.351 5 .1959 1.641 1. 815 4 .418 3 .440
10 2 .072 2.324 2.996 3.89111 3 . 595 1.420 5 . 294 4.92512 2 .167 0.763 3.434 0 . 79313 1.993 3.060 2.335 2 . 09214 2 .480 1 .734 1.822 4 .72815 1.499 0.602 7.941 4 . 85316 2 .842 2 .676 3.546 6 .63617 0.531 2 . 868 1.707 4.38018 4 .071 1 .653 5 .426 4 . 76619 0.375 0.279 2 . 971 -1.82520 2 .592 3 .449 4 .286 8.325
*Error in measurement between these two heats.Note: The heating temperature for plates XXV-9 throughXXV-12 was 1100°F.

APPENDIX III
RESIDUAL STRESSES (DAMAGED PLATES)
214

Stri
p N
um
ber
_ _______________ Plate XXV—3
ao-
e--
<£>-
uo-
■rf-
co-
CM-
t-H-
o-l-50 -40 -30 -20 -10 0 10 20Residual Stress (KSI)
Figure A 9 . Stresses in Plate XXV-3 (45° vee, M/Md =0Angle of Damage = 6.40°, assumed E = 29,000 ksi)
30 40 50
.25, depth ratio=l
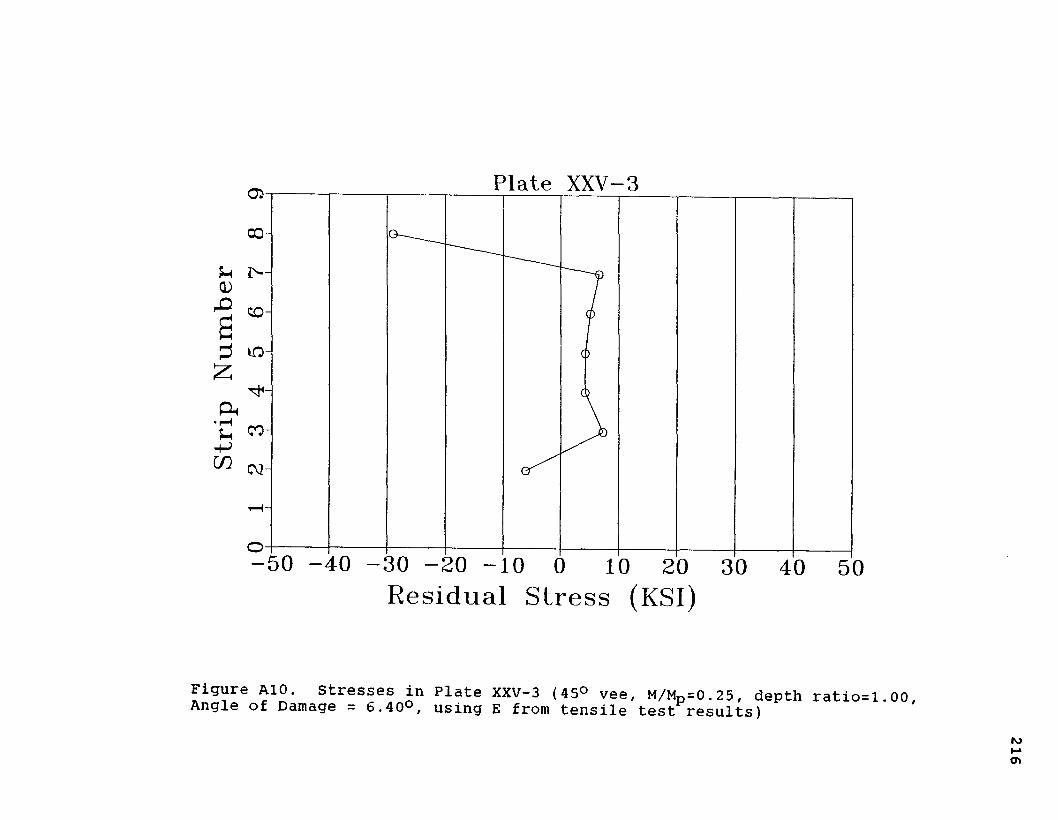
Plate XXV—305
00-
O 50 -40 -30 -20 0 0 10 20 30 40 50Residual Stress (KSI)
Figure A10. Stresses in Plate XXV-3 (45° vee, M/Mp=0.25, depth ratio=1.00,Angle of Damage = 6.40°, using E from tensile test results)

Stri
p N
um
ber
Plate XXV—4
oo-
co-
CV2-
O 30 -20 -10 0 10 20 30 40 50Residual Stress (KSI)
Figure All. Stresses in Plate XXV-4 (45° vee, M/Mp =0.25, depth ratio=1.00,Angle of Damage = 23.62°, assumed E = 29,000 ksi)

Stri
p N
um
ber
Plate XXV- 405
co-
cu-
-50 -40 -30 -20 -10 0 20 30 40 50Residual Stress (KSI)
SiSLeeof“ ;n.aaer-S? r fi?S Pl3te T ^ 4 (45° V66' M/MP=°-25, depth ration. Angie ot Damage - 23.62°, using E from tensile test results)

Stri
p N
um
ber
Plate XXV-503
co-
CQ-
co-
O 30 -20 -10 0 10 20 30 40 50Residual Stress (KSI)
Figure A13. Stresses in Plate XXV-5 (45° vee, M/Mp =0.50, depth ratio=1.00,Angle of Damage = 5.58°, assumed E = 29,000 ksi)

Stri
p N
um
ber
Plate XXV- 5
oo-
o 30 -20 -10 0 10 20Residual Stress (KSI)
40 50
Figure A14. Stresses in Plate XXV-5 (4 5° vee, M/Mp =0.50, depth ratio=1.00,Angle of Damage = 5.58°, using E from tensile test results)
220

Stri
p N
um
ber
Plate XXV—6
oo-
co-
-50 -40 -30 -20 -10 0 10 20 30 40 50Residual Stress (KSI)
Figure A15. Stresses in Plate XXV-6 (45° vee, M/MD =0.50, depth ratio=1.00,Angle of Damage = 11.80°, assumed E = 29,000 ksi)
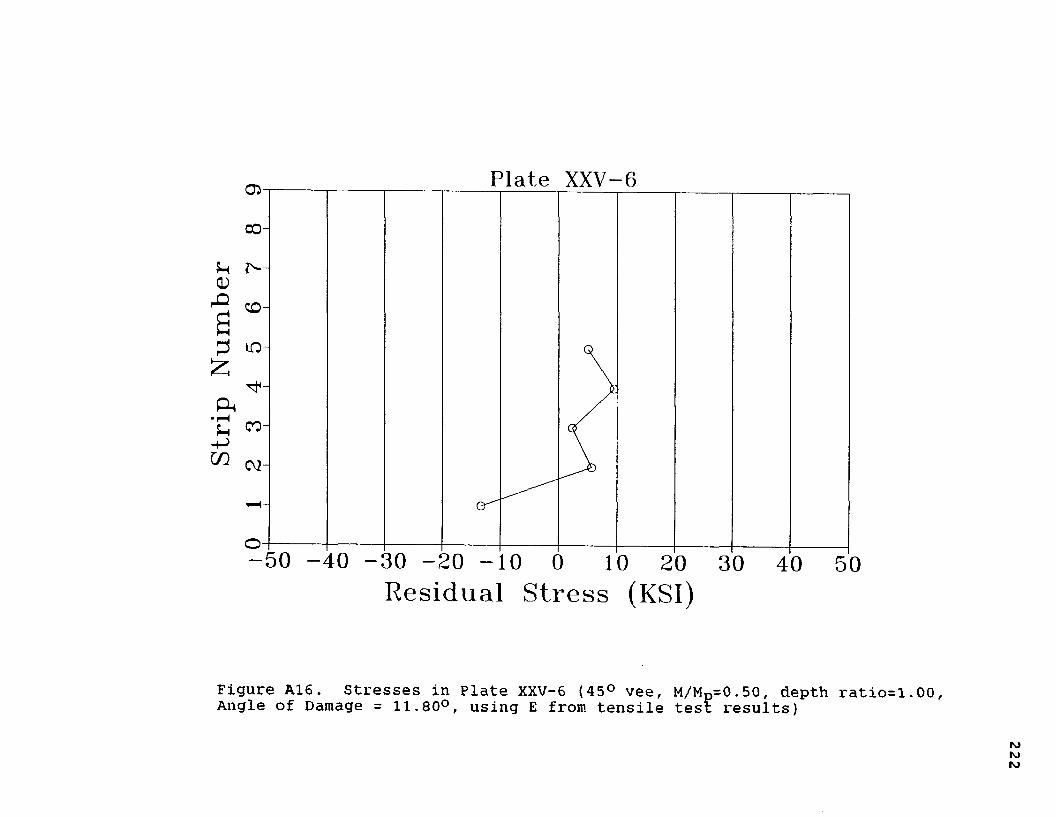
Stri
p N
um
ber
Plate XXV- 6
co-
co-
o 30 -20 -10 0 10 20 30 40 50Residual Stress (KSI)
Figure A16. Stresses in Plate XXV-6 (45° vee, M/Mp=0.50, depth ratio=1.00,Angle of Damage = 11.80°, using E from tensile test results)

Stri
p N
um
ber
CT>-
00-
CQ-
uo-
co-
CV2-
Plate XXV—7
-50 -40 -30 -20 -10 0 10 20 30 40 50Residual Stress (KSI)
Figure A17. Stresses in Plate XXV-7 (45° vee, M/Mp =0.33, depth ratio=1.00,Angle of Damage = 18.77°, assumed E = 29,000 ksi)

Stri
p N
um
ber
Plate XXV—703-
co-
o
o30 - 2 0 - 1 0 0 1 0 20 3 0 4 0 5 0
Residual Stress (KSI)
Figure A18. Stresses in Plate XXV-7 (45° vee, M/Mp =0.33, depth ratio=1.00, Angle of Damage = 18.77°, using E from tensile test results)
N)ro
APPENDIX IV
PLATE THICKNESSES* (AFTER REPAIR)
*Refer to Figure 26 in text for points of measurement.
225

:i
12345678
■i]
12345678
226
Plate XXV-3
Thickness (inches) at Location:aa a b c d e ee
0 .495 0,.504 0,. 513 0.,520 0,.513 0.,506 0.,4950 .495 0,. 502 0,.505 0,.523 0 .503 0,.500 0,.4950,.495 0,.501 0 ..506 0., 532 0.,503 0.,505 0.,4950,.495 0,.507 0..518 0.. 543 0,.507 0,.502 0,.4950,,495 0., 507 0., 524 0. 538 0 .,512 0 .500 0.,4950,.495 0,. 503 0 ..523 0..532 0 ,.516 0,.498 0.,4950.,495 0..503 0., 519 0. 535 0. 510 0.,498 0.,4950,.495 0,, 503 0.,517 0..538 0,.510 0,.500 0.,495
Plate XXV-4
Thickness (inches) at Location:aa a b c d e ee
0 ,.495 0,, 516 0,. 536 0,.630 0.,538 0,.517 0,.4950 .495 0 .525 0 . 542 0 .679 0,.532 0 . 520 0 .4950..495 0.,525 0., 539 0.,692 0. 524 0.,525 0..4950,.495 0,.526 0,.590 0,.690 0,.560 0,.538 0,.4950.,495 0.,519 0., 599 0.,677 0. 557 0.,521 0,,4950,.495 0,.507 0,.588 0,.654 0,.576 0,.515 0,.4950,,495 0., 501 0., 563 0.,621 0. 554 0., 502 0.,4950,.495 0,.499 0,.551 0,.602 0..532 0,.497 0,.495

227
Plate XXV-5
Thickness (inches) at Location:Strip aa a b c d e ee
1 0.495 0.510 0.514 0.490 0.512 0.505 0.4952 0.495 0.504 0.510 0.498 0.509 0.503 0.4953 0.495 0 . 502 0.505 0. 513 0.504 0.500 0.4954 0 .495 0.500 0.506 0.517 0.503 0.499 0.4955 0.495 0.499 0.514 0.514 0.505 0.495 0.4956 0 .495 0.496 0.511 0.516 0 . 505 0.495 0.4957 0 . 495 0 .494 0 . 508 0.522 0 . 504 0.501 0.4958 0.495 0.500 0.509 0.522 0 . 509 0.499 0.495
Plate XXV-6
Thickness (inches) at Location:Strip aa a b c d e ee
1 0.495 0.511 0.521 0 .481 0 . 522 0 . 506 0 .4952 0.495 0.516 0.522 0.521 0.523 0.515 0.4953 0.495 0.518 0.520 0.545 0.521 0.517 0.4954 0.495 0.522 0.530 0.561 0.533 0.522 0.4955 0.495 0.516 0.534 0.556 0.527 0.520 0.4956 0.495 0.510 0.545 0.530 0.528 0.511 0.4957 0.495 0.506 0.549 0 . 556 0 . 534 0.510 0.4958 0.495 0.497 0.537 0.533 0. 535 0.498 0.495

228
Plate XXV-7
Thickness (inches) at Location:Strip aa a b c d e ee
1 0.495 0. 513 0.528 0.515 0.534 0.492 0.4952 0.495 0.513 0.519 0. 573 0.519 0.505 0.4953 0.495 0.512 0.524 0.599 0.515 0.511 0.4954 0.495 0.518 0 . 557 0.603 0.521 0.520 0.4955 0.495 0.512 0.568 0.588 0 .517 0.516 0.4956 0.495 0.503 0.563 0. 582 0.521 0.512 0.4957 0.495 0.499 0 . 542 0.581 0.519 0.509 0.4958 0.495 0.487 0.523 0 . 548 0.505 0 .496 0.495
Plate XXV-8
Thickness (inches) at Location:Strip aa a b c d e ee
1 0.495 0.501 0 . 506 0.507 0.505 0.500 0.4952 0.495 0.499 0.502 0.502 0 .497 0.495 0.4953 0.495 0.495 0.493 0.521 0.491 0.502 0.4954 0.495 0.496 0.491 0. 524 0 .488 0.496 0.4955 0.495 0.490 0.489 0.521 0.485 0.492 0 .4956 0.495 0.489 0.488 0.518 0 .484 0 .492 0.4957 0.495 0.495 0.503 0. 524 0.502 0.497 0.4958 0.495 0.499 0.501 0.522 0.502 0.498 0.495

APPENDIX V
RESIDUAL STRESSES (UNDAMAGED WIDE FLANGES)
229

*3H-<QC<B>*-*\S>
03ftf|(B0101(B01
tilIB0)3HI
t-0oo<(B(B
XVIIoooO.(B•dftS'n0)ftH-oII
Stress (KSI)Stress (KSI) 40-404040
-CO-CO
-Cl
-03- 0 5
o
-CD-CD
L CO— CO
tdCD23
oo
&
0£Z
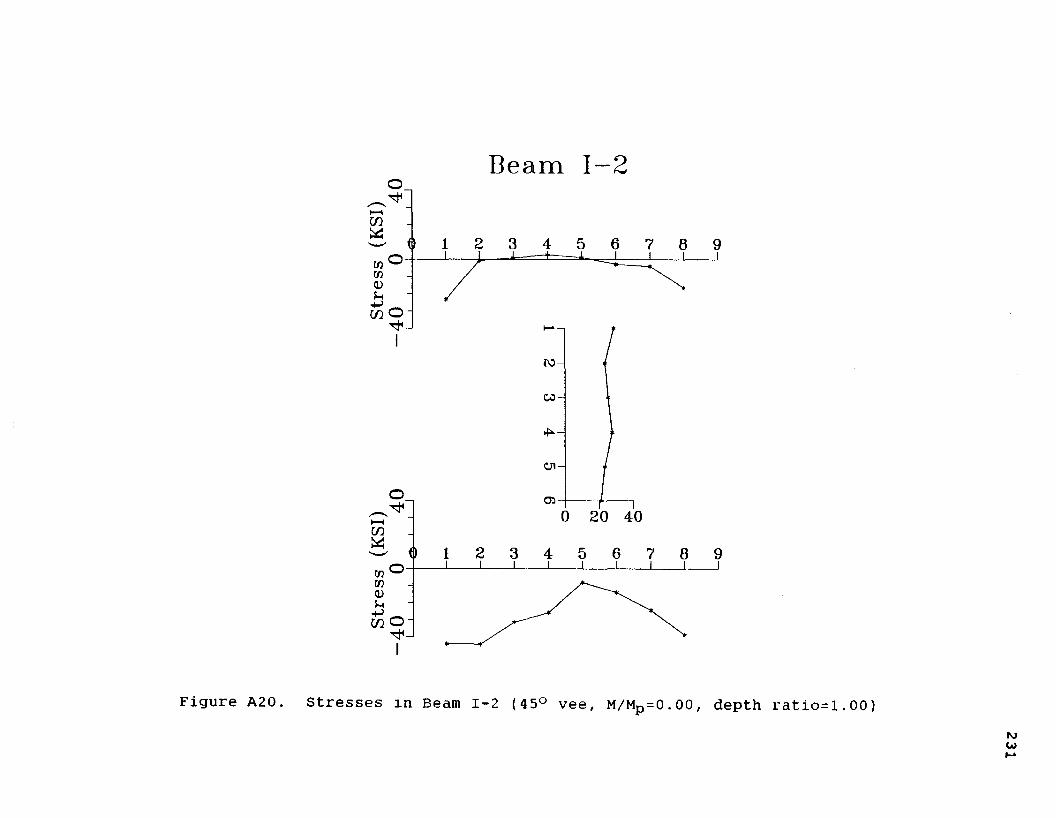
Beam 1—2
o
co-
O 05
O
m o-
Figure A20. Stresses in Beam 1-2 (45° vee, M/Mp =0.00, depth ratio=l.
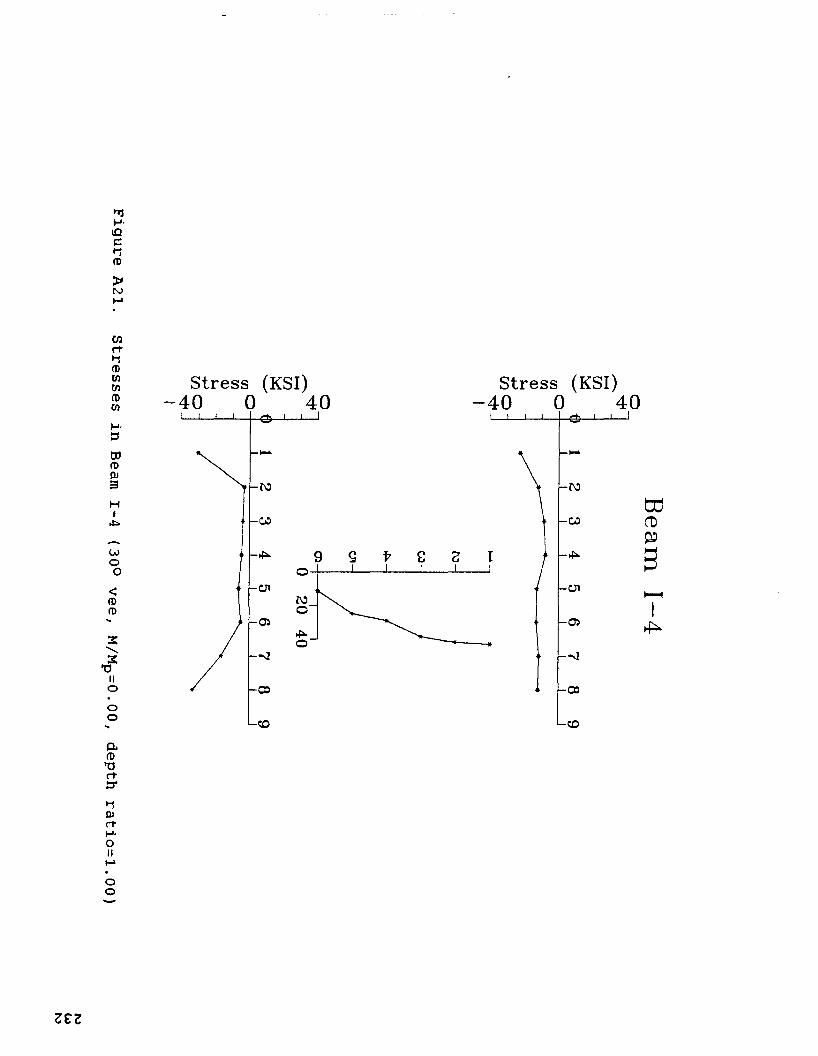
zzz

Figure A22.
Stresses in
Beam II-l
(20° vee,
M/Mp=0.00, depth
ratio=1.00)
Stress (KSI)Stress (KSI) 40-4040-40
— CO-CO
-OS-OSo — a
-oo-00
L-cO
££Z
Beam II

«1H-uaC<o>tv>OJ
COr+c-iCPCOCO(PCOH-3w<p013HHILOrf*cnO<(PCP
IIooo
Stress (KSI)40404040
-ro— 05-OD
-cn—05
O — J
-03-03
LCO— CO
eoCD03
CO
aCP•o r+or0)r+H-OIIoo

Figure A24.
Stresses in
Beam III-2
(20° vee,
M/Mp=0.50, depth
ratio=1.00)
Stress (KSI) Stress (KSI)-40 0 40 -40 0 40
-to
-to-CO
— CJl
-05-05O
-03 — 00
i-co
9ZZ
Beam III-

*1H-IQC*1a>>fOcn
Uift*1(Dcncnn>cnH-3CO(D0)3H<IU14*LnO<(t>(0
•fII0ro01
Stress (KSI)Stress (KSI) 4040 40
o -
o
-CD-05
td05P
<Icn
CLCOVft3*0Jr+M-oIIoo
9€Z

Figure A26.
Stresses in
Beam IV-6
(45° vee,
M/Mp=0.50, depth
ratio=1.00)
Stress (KSI) 40Stress (KSI) 4040
G1o “
-00-CDLCO
L£Z
Beam IV

APPENDIX VI
PLASTIC ROTATIONS (DAMAGED WIDE FLANGES)
238

239
Plastic Rotations in milliradians:
First Repair Cycle Second Repair Cycle
Beam: XXI-1 XXI-2 XXI-3 XXI-4 XXI-2 XXI-3 XXI-4
Ht 1 10.97 12 .16 6 .15 10.39 11.93 10.23 9.842 4 .93 5.52 7.61 10.06 6.12 5.30 5.683 5 . 27 5 .88 5.70 8.00 5.16 4 . 92 6 .434 5 .18 5 .70 6.85 6.38 6.64 5.98 7 .805 7 .54 4 . 16 6.85 7 . 15 8.69 8.29 6 .186 7 . 53 6.45 7 .64 6.45 4.94 5.4 1.21*7 8 .36 8.54 5.01 4.77 0.74 4.72 6.398 8 . 12 5.82 7 .40 6.84 6.52 5.76 7 .609 10.66 8.01 8.77 6.89 4.77 2 . 88 7 .00
10 7 .04 7.85 7 .34 6.41 5.73 5.92 5.6511 5.52 6.35 7 .00 7 . 18 7 .76 7 . 16 6.6412 7 .05 7 . 59 7 . 83 5.90 7 . 11 5 .76 5 .4713 6.35 7 .97 6.35 4.46 7 .09 6 . 15 6 . 9414 5.22 7 . 16 6 .46 4 .98 7 .34 5.47 5.7215 3.38 6 . 17 5 .00 5 . 00 6 .35 5 . 20 5 . 1816 6 . 15 4.03 5 . 50 4.82 6.44 5 . 70 6 .0117 7 .12 3 .74 5 .45 3 .49 4 .64 4 .28 5 .7018 2.75 4 . 19 5 . 52 5.25 4.82 4 .30 ----19 0.43 4 .53 ---- ---- 5 .90 2.41 ----20 6 . 67 3 . 81 ---- 6 .37 6.69 ----21 ---- ---- ---- ---- 7 .39 4.30 ----22 ---- ---- ---- ---- 5 . 20 4 .75 ____23 _ mm mm ” 8.34
*Load applied after heat.

240
Plastic Rotations in milliradians:
3rd Repair Cycle 4th Repair Cycle 5th R.C
Beam: XXI-3 XXI-4 XXI-3 XXI-4 XXI-4
Ht 1 11.199 11.598 7 .158 9.941 10.2142 4.693 6 .420 9.744 7.611 4.9863 7 .794 7 .343 7 .120 10.086 7 .1214 7 .348 2 . 898 2 . 292 6 .022 5.0565 8.654 5.729 8.652 9.082 9 .2176 7 .847 7 .618 8.812 8 .298 6 . 9487 4 . 948 4 . 473 5.420 2.609 3 .1268 5 .691 6 . 386 6 .928 8 .054 8.3019 5 . 580 6.252 7.357 8.078 5.895
10 4 .478 4 .949 4.703 5 .176 2 .40811 6 .437 7 .380 4 .321 3.872 5 . 19912 5.875 5.468 4.276 4 .772 8.35113 3.602 3 . 083 4.750 3 . 174 6.41614 5.966 6 . 910 5.471 4 .480 6 .48515 4 . 773 6.934 7.475 4.729 5.69716 5.449 3.783 7 .769 3.310 3.76117 5 .270 4 .503 1.013* 2 .162 5 .74318 6 .621 5.990 7 .342 7 .634 4 . 77519 5.450 4 .481 5 .000 6.374 1.19420 -------------- 2.973 5.248 6.914 3 .31121 7 .725 6.071 — — — — — 5 .000
*Load applied after heat.

241
Plastic Rotations in milliradians:
Beam XXI-46th Repair 7th Repair 8th Repair
Ht # 1 14.892 11.378 14.1832 11.687 8.488 11.9703 10.209 6.986 11.3934 8.863 8.000 10.6795 8. 753 9.757 9 .0196 8.372 6.432 7 .6047 9.545 10.911 8.3498 8.533 4.050 11.4359 4.729* 5 . 761 8.285
10 6.013 6.865 9.30011 5.382* 7 .429* 7 .40912 7 . 905 8.533 4 .054*13 4.527* 6.440* 19 .45714 ----- 6.193 -----15 8.08516 14.975
* These heats consisted of 1 vee only (All other heats on this page consisted of two vees). Two vees were used during the final three repairs of beam XXI-4 due to time constraints.

APPENDIX VII
RESIDUAL STRESSES (DAMAGED WIDE FLANGES)
242

Beam XXI-1
40-20 C
Figure A 2 7 . Stresses in Beam XXI-1, Region BCycle, assumed value of e = 29,000 ksi)
9
{1 Damage/Repair
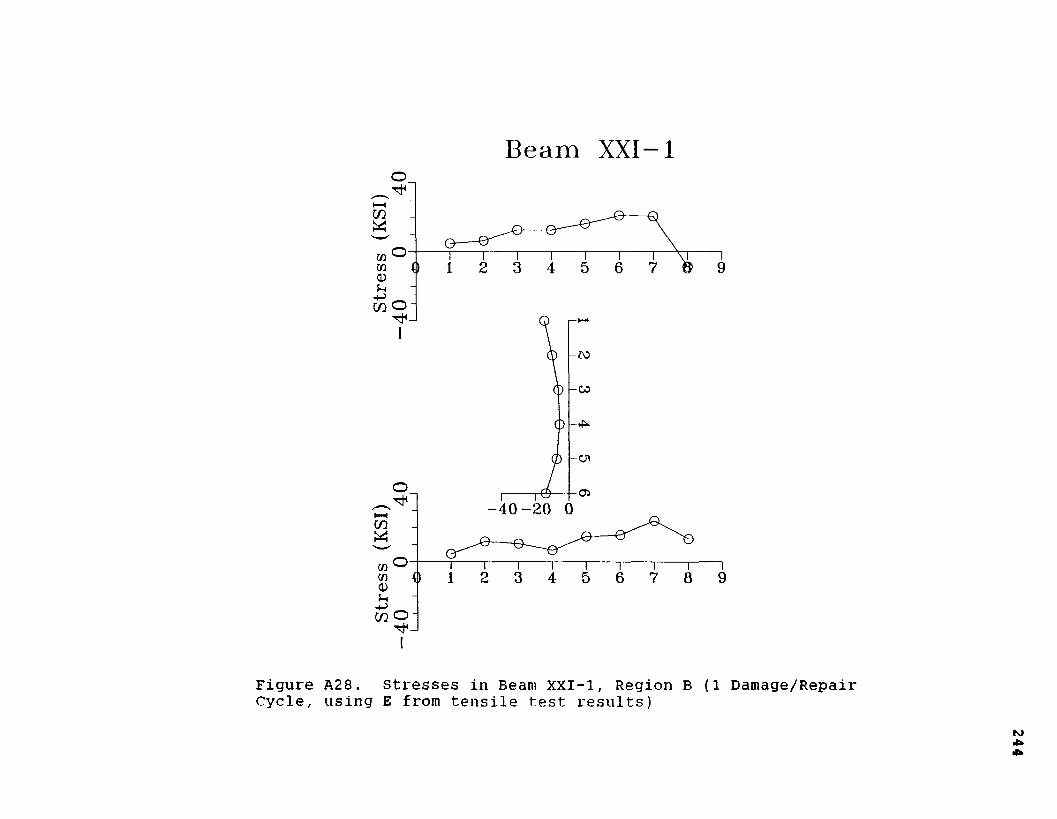
Stre
ss
(KSI
) St
ress
(K
SI)
Beam XXI-1
o
o -
-ro
-co
-cnO 05
-40-20 0
O
o-
Figure A28. Stresses in Beam XXI-1, Region B (1 Damage/RepairCycle, using E from tensile test results)
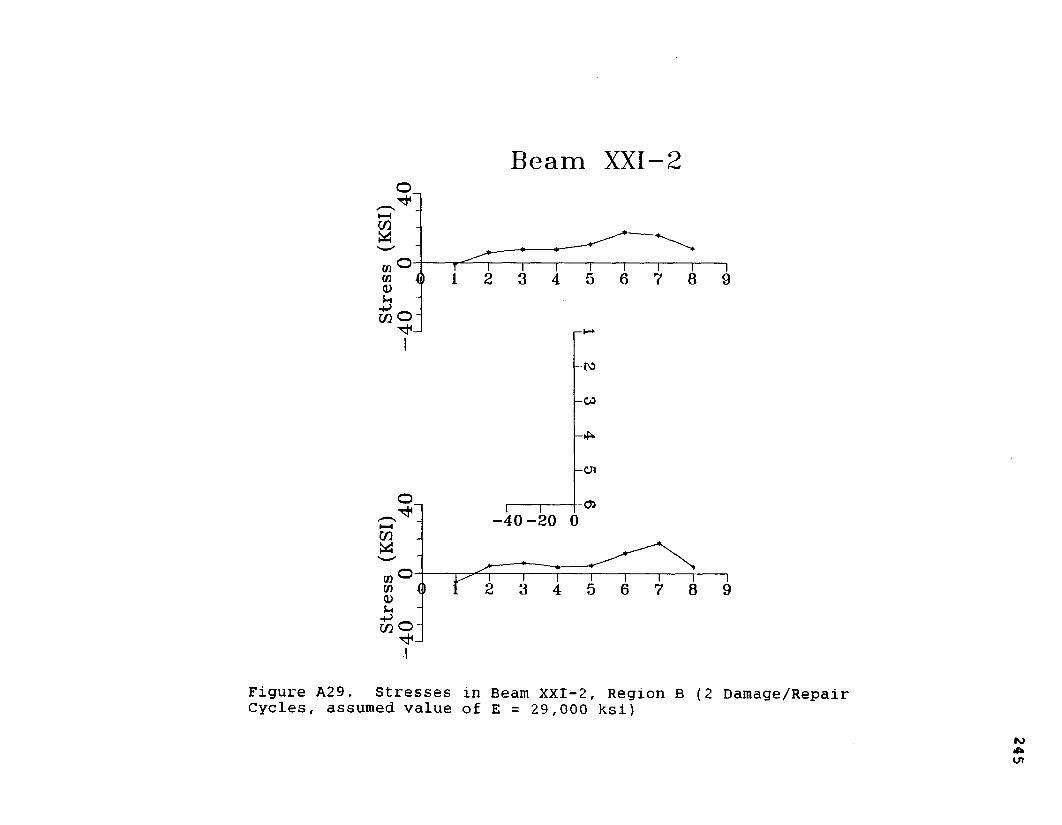
Beam XXI-2
m o -
-w
-4 0 -2 0 0
Figure A29. Stresses in Beam XXI-2, Region B (2 Damage/RepairCycles, assumed value of E = 29,000 ksi)
245

Beam XXI-2
40-20 0
Figure A30. Stresses in Beam XXI-2, Region B (2Cycles, using E from tensile test results)
9
i9
Damage/Repair
246
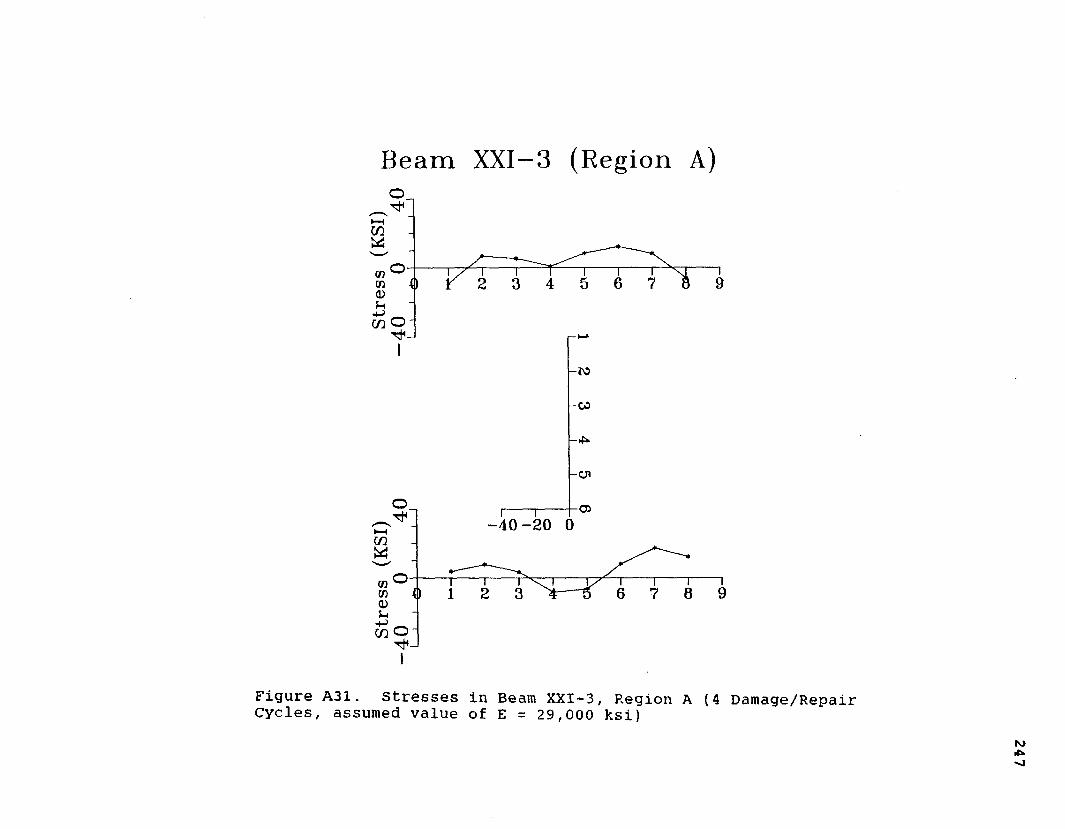
B e a m XXI-3 (Region A)O
-CO
-cnO <35
-4 0 -2 0 0
Figure A31. Stresses in Beam XXI-3, Region A (4 Damage/RepairCycles, assumed value of E = 29,000 ksi)
247
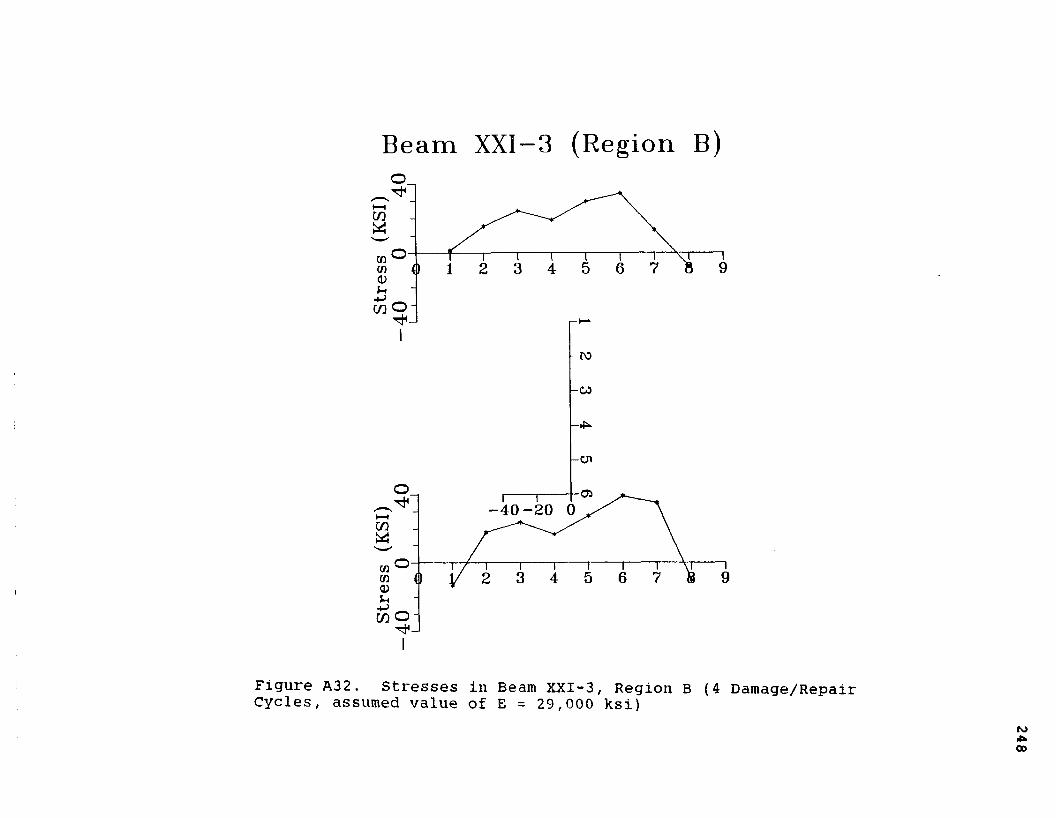
Beam XXI-3 (Region B)
o.I—tc/3«_m o-w0)uW O
I
0
- ro
-co
-cn
-4 0 -2 0 0
Figure A32. Stresses in Beam XXI-3, Region BCycles, assumed value of E = 29,000 ksi)
19
i9
(4 Damage/Repair
248

Beam XXI-3 (Region B)O
O
-CO
O-4 0 -2 0 0
O
Figure A33. stresses in Beam XXI-3, Region B (4 Damage/RepairCycles, using E from tensile test results)

Beam XXI-3 (Region C)
o
in o -
-co
-mO
-4 0 -2 0 0
O
Figure A34. Stresses in Beam XXI-3, Region C (4 Damage/RepairCycles, assumed value of E = 29,000 ksi)
250

B e a m XXI— 4 (Region A)o
HH
GO o-
-co
-40-20 0
Figure A35. Stresses in Beam XXI-4, Region A (8 Damage/RepairCycles, assumed value of E = 29,000 ksi)
251

Stre
ss
(KSI
) St
ress
(K
SI)
Beam XXI-4 (Region B)o
3-"tf-
-co
O os-4 0 -2 0 0
O
o -
Figure A3b. Stresses in Beam XXI-4, Region B (8 Damage/RepairCycles, assumed value of E = 29,000 ksi)

Beam XXI-4 (Region B)o_
cncn0U
0
O'rj<-
-w
CJ
<
-40-20 0
Figure A 3 7 . Stresses in Beam XXI-4, Region BCycles, using E from tensile test results) (8 Damage/Repair
253

Beam XXI-4 (Region C)
~ro
-co
-4 0 -2 0 0
Figure A38. Stresses in Beam XXI-4, Region C (8 Damage/RepairCycles, assumed value of E = 29,000 ksi)
VITA
Paul Franklin Robinson was born on July 29, 1963, in Shreveport, Louisiana. He graduated from J. Frank Dobie High School in Pasadena, Texas, in 1981, after which he enrolled at Louisiana Tech University in Ruston. There he received his Bachelors and Masters Degrees in Civil Engineering. In January, 1988, he began working toward his Ph.D at Louisiana State University in Baton Rouge.Upon graduation, he will begin employment at Hudson Engineering, a division of McDermott, International, in Houston, Texas.
255
Candidate:
Major Field:
T itle o f D issertation:
DOCTORAL EXAMINATION AND DISSERTATION REPORT
Paul Franklin Robinson
Civil Engineering
Behavioral Characteristics of Damaged Steel Repaired by Heat Straightening
Approved:
Major Professor and Chairman
Dean of the Graduate School
E X A M IN IN G CO M M ITTEE:
r ,
VCcujg, It. A &erp
Date of Examination:
July 8. 1991