behavior of post-tensioned girder anchorage zones
TRANSCRIPT

William C. StoneResearch Structural EngineerCenter for Building TechnologyNational Bureau of StandardsWashington, D.C.
John E. Breen*The Carol Cockrell Curran
Chair in EngineeringDepartment of Civil Engineering
The University of TexasAustin, Texas
Behavior of Post-TensionedGirder Anchorage Zones
U tilization of precast and prestressedconcrete is increasing in bridge con-
struction. However, problems occurringin both bridges and buildings indicatethat design procedures and criteria forpost-tensioned anchorage zone tensilestresses need further examination andrefinement.'
Substantial cracking along the tendonpath has occurred in precast segmentalbridges in Texas,2 Florida,t and in acast-in-place box girder bridge reportedby Dilger and Ghali s In these bridgesthe cable profiles had significant cur-vature, inclination, and eccentricity inand near the anchorage zones. In the
-Also. Director, Phil M. Ferguson Structural Engineer-ing Laboratory. University of Texas. Currently, Chair-man, ACI Committee 318. Building Code Require-ments for Reinforced Concrete. Recipient of PCI'sStato-ot-the-Art Award in 1981 (paper published inJan.-Feb. 1980 PCI JOURNAL).
`Personal communication between Dan Sledek (Con-crete Construcdon Magazine, Addison. Illinois), andFigg and Muller Engineers, Tallahassee, Florida,1980.
case of the Texas bridge, there was ad-ditional concern over the anchoragehardware geometry.
Similar cracking was reported in theconstruction of the Olympic Stadium inMontreal and in post-tensioned slabstructures and other thin web applica-tions, Significant anchorage zonecracking experienced in preliminarytests for a major lightweight concretebridge in California indicated thatlightweight concrete may he even morevulnerable.
This anchorage zone cracking wascontrolled by auxiliary reinforcement.While these cracks do not reduce initialstrength, they provide a path for pene-tration of moisture and salts and thuspresent potential corrosion and frostdamage threats. The formation of thesecracks negates one of the major benefitsleading to the choice of prestressed con-crete, namely, the minimization of ser-vice load cracking.
Major and contradictory changes have°taken place in the AASHTO, ACT, and
64

PCI design specifications for anchoragezones in recent years, based more on theresults of field experience and proprie-tary data than on published analyses ortest procedures. Current design recom-mendations,r e5 while vague, seem bothconservative and workable for many ap-plications where massive end blockswith large cover can be used with rela-tively straight or gently curving tendonsin cast-in-place post-tensioned con-struction. However, they do not givesufficient guidance for the wide range ofthin web post-tensioned applications.
A study of anchorage zone tensilestresses was undertaken at the Univer-sity of Texas at Austin. Its goal was toprovide more specific guidance tobridge designers and constructors inorder to better assess the requirements ofpost-tensioning anchorages indepen-dent of the recommendations of thehardware supplier.
NATURE OF ANCHORAGEZONE STRESSES
Linear elastic theory indicates that if aconcentrated load is applied through abearing plate across the width of the fi-nite rectangular block, compressive andtensile stresses are set up as shown inFig. 1. Two important tension fields areshown on this figure:
1. Bursting Stress: located along theaxis of loading, normal to the axis, andaway from the point of loading.
2. Spalling Stress: located on or nearthe end face, parallel to the end face andaway from the point of loading.
In any post-tensioned anchorage, theload must be applied over a finite area.The compressive stress immediatelyunder the anchor is called:
3. Searing Stress: the load divided bythe net bearing area.
The role which each of these threestresses plays in the behavior of the an-chorage zone has not been fully under-stood.'
SynopsisThe post-tensioned anchorage
zones of several thin-webbed con-crete box girders, which were de-signed in accordance with AASHTOand ACI requirements, have crackedalong the tendon path during stress-ing. This cracking presents paths forpotential corrosion and frost damage.In addition, such cracking negates amajor benefit of prestressed concrete,namely, the minimization of serviceload cracking.
This paper summarizes the majorobservations from an extensive ana-lytical and experimental study of thebehavior of post-tensioned anchoragezones with single large tendons. Theexperimental program investigatedthe primary variables affecting theformation of the tendon path crack:tendon inclination and eccentricity,section height and width, concretetensile splitting strength, anchor widthand geometry, and the effect of sup-plementary anchorage zone rein-forcement, both active and passive.
Three-dimensional linear elastic fi-nite element computer analyses wereused to generalize these results. Afailure theory was developed to ex-plain tendon path crack initiationbased upon peak spalling strains atthe edge of the anchorage. The theoryagreed well with the test data.
In the next issue of the PC! JOUR-NAL, a companion paper will discussthe practical implications emanatingfrom this study and provide designrecommendations together with anumerical design example.
Bursting Stresses
Anchorage zone distress is signalledby the sudden formation of a crack alongthe tendon path. The cracking load de-
PCI JOURNAL/January-February 1984 65

r1 . 2a^
T5 = SPALLING TENSILE STRESS
Tb = BURSTING TENSILE STRESS
LOADAXIS
0/4 .
7A4Q
0/4
+ = - TENSION- - COMPRESSION
COMPRESSION TENS 3N
SHADED AREAINDICATES COMPRESSION
(a) (b)
(c)
Fig, 1. Transverse stresses in a rectangular block loaded by a plate.
rn

(a)
D E' C
A B ^lfz
Z M fr r r r rre N
f x = BURSTING STRESS DISTRIBUTION
£FX = O : £f XG + ZfxC+=O
Fig. 2. Equilibrium considerations within the lead-in zone.
pends on the relative size of the loadedarea with respect to the size of the over-all loaded face and on the eccentricity,inclination, and curvature of the tendon.In addition, the anchorage device shapeand the action of supplemental rein-forcement affect the cracking load.
St. Venant's principle, applied to amember subjected to a concentratedload P (see Fig. 2), indicates that a sec
-tion at a distance approximately equal tothe depth of the section from the appliedload should exhibit an essentially uni-form normal stress distribution. The
longitudinal stress distribution withinthe lead-in zone ABCD is not uniformand cannot be analyzed by the usuallaws of strength of materials. In fact, thedistribution of stresses on Section EE' isvery nonuniform, with very highstresses at points near the loading axisand very small stresses at all otherpoints.
Fig. 2b is a free body of the upper partof the lead-in zone. Equilibrium of hori-zontal forces requires a shear stress -r.Transverse stresses ff are required forequilibrium of moments about M. Fi-
PCI JOURNAL/January-February 1984 67

2&
0.6 f x (TENSi0N)
a%=0
0.4 010
x
N 0.25 Z
„x0.2050 ^_ 2a
0.75
0.90
0 0 0/4 °"2 a 1.50 2a
Fig. 3. Bursting stresses for various loaded areas (Guyon, Ref. 10).
nally, vertical equilibrium of forces re-quires the resultant transverse (burst-ing) stress distribution to be zero.Therefore, both tensile and compressivestresses must occur within the lead-inzone. However, these equilibrium con-siderations are not sufficient for deter-mining the transverse stress distribu-tion. Various analytical solutions for theanchorage zone stress distribution arediscussed in detail in Ref. 1.
In actual anchorage practice, the loadacts over a reasonably large finite area.For this case the classical elasticityanalysis indicates that the burstingstresses are relatively small (see Fig. 3).Bursting stresses are plotted for a con-stant P for various values of a'/a, where2a is the section height and 2a' is theanchor width. Standard design practiceprovides supplementary local rein-forcement for the total resultant tensileforce obtained by integrating the areaunder such curves. Experience gainedfrom anchorage zone cracking problemswith the Corpus Christi Bridge, 2 inwhich the anchorage zones were rein-forced based on a similar set of experi-mentally derived bursting curves,s indi-cated that design based solely uponsuch consideration of bursting stressesmay be unconservative.
Spalling StressesThe spalling tensile stresses are max-
imum at the loaded surface and decreaserapidly away from the surface (see Fig.1). The total spallingtensile force is thusrelatively small. In contrast to the atten-tion paid to bursting stresses, the spall-ing stresses have sometimes been ne-glected or dismissed because they are solocalized. However, the peak spallingstress can be much higher than thebursting stresses in almost every practi-cal anchorage application.
This phenomenon is especially signif-icant since in this experimental programcracking occurred along the tendon pathwith calculated bursting stresses farbelow the tensile strength of the con-crete. Like bursting stresses, the spall-ing stress distribution is greatly affectedby geometric variables such as eccen-tricity, inclination, and section propor-tions. Most previous anchorage zone re-search has been limited to straight ten-dons and has been interpreted in thecontext of bursting stresses. The adventof comprehensive finite element pro-grams allows more realistic modelling ofspecimens with complex geometries.These analyses (reported in Refs. 1 and7) indicate the key role of spallingstresses in crack formation,
68

GROUT TUBE PLATE ANCHOR
TRUMPET
0BASE PLATE
CONE ANCHOR
0BELL ANCHOR
Fig. 4. Typical anchor hardware geometry.
Bearing Stress
The maximum compressive stress de-veloped by a post-tensioning system oc-curs beneath the anchor, In the case of aflat plate, or bearing-type anchor, theaverage hearing stress is equal to thepost-tensioning load divided by the netarea of the anchor. Current design spec-ifications in the United States, whilespecifying the need to examine burstingand spalling stresses, usually phrasetheir strictest recommendations in termsof allowable bearing stress. On the otherhand, most European specifications
permit significantly higher allowablebearing stresses in post-tensioned con-crete design. Little study has beengiven to this apparent over-conservatismin the American codes.
In addition to the geometric effectssuch as inclination, eccentricity, width,and bearing area, the effects of frictionand normal forces along the tendon ductfor curved tendons, the effect of anchorhardware geometry (see Fig. 4), and theeffects of other externally applied loadssuch as lateral post-tensioning on theanchorage zone stress state must all beconsidered.
PCI JOUANALIJanuary-February 1984 69

Fig. 5a. Typical box girder details (1 in. = 25.4 mm).
EXPERIMENTAL PROGRAMThe experimental program was bro-
ken into three interrelated phases. Thefirst and third phase involved the testingof forty one-quarter scale models of thinweb anchorage zones. Full-scale thinweb anchorage sections were tested inthe second phase. The primary reason
for using the models was to efficientlyexamine a broad spectrum of anchoragezone geometries and reinforcingschemes. Similitude requirements werederived to relate the prototype and themodel specimens.
The post-tensioned anchorage zoneproblem is aggravated in thin web sec-tions such as in precast segmentally
70

10 GAGE WIRE @ 3"
*2 DEFORMED BARS @ 3"
TLO.6ø SHEATHED
270 ksi TENDON
Fig. 5b. Rectangular model dimensions and reinforcement (1 in. = 25,4 mm).
constructed box girder bridges. The fi-nite element analyses (Ref. 1) indicatedthat the anchorage zone stress state wasa localized phenomenon. In fact, as longas the tendon was not anchored at theweb-flange interface, only the web sec-tion was of primary importance.
To simplify fabrication, the first seriesof models was cast so as to replicate arectangular web section for a typical boxgirder bridge segment (Figs. 5a and 5h).In this series of tests, the full tendoncapacity of some specimens with curvedtendons could not be developed due tosplitting off of cover concrete at the ten-don dead-end. In order to avoid thisproblem in the full-scale tests (whichdealt primarily with curved tendons), aportion of the top and bottom flange wasretained (see Figs. 6a and 6h). In orderto verify similitude between the quar-ter-scale models and prototype speci-mens, the third series included modelswith both rectangular and I-section de-tails, as in the prototype specimens.
All specimens were fabricated withthe mild steel reinforcement shown. Insome specimens supplementary spiralsor orthogonal reinforcement were addedin the vicinity of the anchorages. Detailsof fabrication and reinforcement aregiven in Ref. 7 and briefly summarizedlater in this paper in the section on fab-rication procedures.
Specimen Design
Based upon an extensive examinationof actual box girder geometries, the re-duced web section shown in Fig. 5 waschosen for the prototype. The modelsused a scale factor of 1/a for linear dimen-sions and 16 for loads and areas. Detailsare given in Figs. 5 and 6.
A specially designed microconcretewas used for the models with mechani-cal properties very similar to those of theprototype concrete. Using this micro-concrete with carefully selected rein-forcing steel results in reinforced con-crete models with material stress andstrain scale factors close to unity .9
The microconcrete indirect tensilestrength, as measured by split cylindertests, was usually significantly higherthan that of the prototype concrete de-spite the fact that their compressivestrengths were nearly identical. Thistrend has frequently been reported inthe literature,9 and is attributable to amore solid bond in tension as a result offiner aggregate.
The substantial number oftests in thisinvestigation indicates that normalizingthe measured tendon loads at crackingby adjusting by the scale factor S andby the measured split cylinder tensilestrength yields nearly identical valuesin model and prototype.
PCI JOURNALJJanuary-February 1984 71
58"*
CROSS SECTION ELEVATION
A' 7 U STIRRUPS@13
. 3 BARS@ 10 1/2"
SHEAR REINFORCEMENT
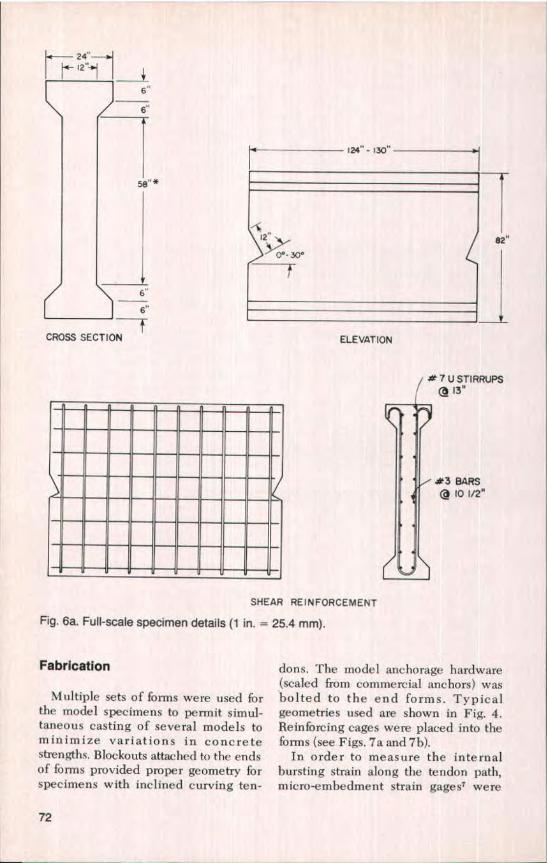
Fig. 6a. Full-scale specimen details (1 in. = 25.4 mm).
Fabrication
Multiple sets of forms were used forthe model specimens to permit simul-taneous casting of several models tominimize variations in concretestrengths, Blockouts attached to the endsof forms provided proper geometry forspecimens with inclined curving ten-
dons. The model anchorage hardware(scaled from commercial anchors) wasbolted to the end forms. Typicalgeometries used are shown in Fig. 4.Reinforcing cages were placed into theforms (see Figs. 7a and 7b).
In order to measure the internalbursting strain along the tendon path,micro-embedment strain gages ? were
72

(a)1
'i_. ...1t- 11/8]
•
1 !J2"^
i3 Ga wIRe {B16mm^(A}
5^= 2 S/6 'T1PJ*
!4 1/2^
3/6'
CROSS SECTION
933!/4"- 29I/a ' +;
ELEVATION
Fig. 6b. I-section model details (1 in. = 25.4 mm).
used. Since lateral variation of thebursting strain attenuates rapidly andnonlinearly from a maximum at the ten-don duct towards the side faces, gagesglued to the concrete surface would notaccurately indicate the magnitude of themaximum bursting strain. A suitablecompliant concrete embedment gage,shown in Fig. 8, was developed.
In later models these embedmentstrain gages were attached to the face ofthe end forms to monitor the spallingstrain distribution. These readings ver-ified the results of three-dimensional fi-nite element analyses which were con-ducted for each set test specimen.
Any supplementary anchorage zonereinforcement was wired into place, the
PCI JOURNALJJanuary-February 1984 73

Fig. 7a. Aligning straight tendon profile prior to casting.
Fig. 7b. Aligning curved tendon profile prior to casting.
74

0.25I^ ^4/ao Nut
Washer
o.oa"
•___-io G. Aluminum wire, 4/40 threaded ends
i0.25 Heat Shrink Tubing
a) 0.0312" Foil strain gageb) Liquid epoxy sealant
C) Butyl rubber waterproofingd) Teflon wrap
/Butyl rubber end seal
Lead wires
Fig. 8. Micro-embedment gage (I in. = 25.4 mm).
tendon was passed through the cage,and the forms were sealed. Microcon-crete was placed into the forms in sev-eral layers with both internal and exter-nal vibration. Twenty 3 x 6-in. (76 x 152mm) cylinders were cast for each mix.Specimens and cylinders were moistcured fora days until form removal. Thecuring process was then continued untilthe desired compressive strength wasachieved.
Fabrication of the prototype speci-mens was similar except for the use ofready-mixed concrete instead of micro-concrete. All anchors in the prototypeseries were a commercial twelve-strandbearing-type plate anchor with a light-weight trumpet.
Test Procedure
Post-tensioning forces were applied tothe specimens using centerhole hy-draulic rams as shown in Fig. 9. For the
model tests, the loading system con-sisted of a hand-pumped 20-ton (178 kN)double acting ram with two in-line loadcells for direct monitoring of the load.For the full-scale tests, a 500-ton (4.45mN) centerhole ram, powered by a con-tinuous flow electric console pump, wasused with the load being sensed by twohydraulic pressure transducers.
One of the critical aspects of the test-ing program was to replicate the mannerin which the load was applied to thestructure during actual construction. Forthis reason single multiple strand ten-dons which passed through the speci-men were used to transfer the load fromthe ram through the specimen to a stiffdeadman anchor which was grouted intoplace at the far end. The deadmansimulated the abutting face of a seg-mental bridge unit,
Commercial strand and duct systemswere used so that realistic friction andnormal forces would develop along the
PCI JOURNAL/January-February 1984 75

a)
8 5
(I) 500 TON CENTER HOLE RAM (6) TENDON BACKSTOP(2) SPACER BLOCK [ 7) LATERAL POST- TENSIONING JACK(3) REAR SPACER BLOCK (8) LOAD CELL FOR 7(4) 26 STRAND ANCHOR HEAD (9) FULL SCALE CURVED TENDON SPECIMEN(5) DEAD MAN - FRICTION LOAD CELLS
Fig. 9. Full-scale testing frame showing identification of component parts.
r7 -- 4
62
9

duct from the curvature of the tendon.Model loads were increased in 1-kip(4.45 kN) increments until failure. Forthe prototype units, 10-kip (44.5 kN)load increments were used. After eachload step a data scan was made of thestrain gages, pressure transducers, loadcells, and displacement transducersusing the laboratory data acquisitionsystem. The information was stored onmagnetic tape for subsequent analysisand reduction.
TEST RESULTSThe following sections present the re-
sults of 50 model and prototype testspecimens. Details are given in Ref 7.The results are compared to the findingsof an extensive series of accompanyingfinite element analyses. The finite ele-ment program PUZGAP3D is detailedin Ref. 1.
Using an empirical cracking criterionbased on the correlation between peakcalculated spalling strains and observedcracking loads, the finite elementmethod (FEM) was used to extrapolatebeyond the range of experimental datato provide a more general comparison ofthe effect of variables. Variables in-cluded the effects of anchorage hard-ware geometry (plate, bell, cone), ten-don inclination and eccentricity, thick-ness, bearing area, and the efficiency ofvarious types of supplemental anchor-age zone reinforcement, both active andpassive.
As a means of non-dimensionalizingthe data presented in the following sec-tions, the normalized cracking load P,Tlfdpis divided by the cross sectional areas ofthe web, 2at. (Note that the magnitudeof the split cylinder tensile strength, fa,differs appreciably between prototypeand model specimens. Some of the plotspresent model results while others pre-sent prototype results. The value off,,,used to plot the finite element analysisresults corresponds to the predominanttype of specimen plotted. Because of
this there are some apparent discrepan-cies when several figures are compared.However, the results for a given figureare generally consistent.)
General Concepts of Thin WebAnchorage Zone Failure
Despite the many variables investi-gated in the experimental program, thepost-tensioned anchors in thin webgirders tended to exhibit a generallyconsistent sequence of failure. The ac-tual loads at which various stages werereached were affected by variables suchas inclination, ecpentricity, and supple-mentary reinforcement, but the overallfailure sequence was generally thesame.
The failure sequence for a plate an-chor specimen with no supplementaryreinforcement is summarized in Figs.10a through lot. The basic stages are asfollows:
1. Initial cracking occurs along thetendon path, beginning at a distanceabout equal to the width of the bearingplate in front of the anchor.
2. With increased load, the crack ex-tends both towards the loaded face andaway from it.
3. Diagonal cracks form on the endface, emanating from the four corners ofthe bearing plate.
4. Diagonal cracks propagate to theside faces of the web.
5. A generally sudden explosive-typefailure occurs, with complete destruc-tion of the side face and the noticeableformation of a cone of crushed concreteahead of the anchor.
In specimens with no supplementaryconfining reinforcement, Stages 4 and 5are often almost simultaneous. The mainjustification for including thesupplementary anchorage zone rein-forcement is to raise the initial crackingloads and to provide a significantamount of reserve strength betweencracking and ultimate.
PCI JOURNAUJanuary-February 1984 77

PROPAGATES UNDERINCREASED LOAD
— —
CF"TENDON PATH CRACK"
STAGE ( I ) FIRST CRACKING
STAGE (2) CRACK EXTENSION
UPPER DIAGONAL CRACK
STAGE (3)
DIAGONAL P --~TENDON PATH CRACK
CRACKSON END
LOWER DIAGONAL CRACKP>PCR
END FACE STAGE (4) DIAGONAL CRACKVIEW FORMATION ON SIDE FACE
EXPLOSIVE SIDE FACEFAILURE
PULT
STAGE (5) ULTIMATE
Fig. 1Oa. Failure sequence for plate anchors.
78

Fig. 10b. Tendon path crack.
Cover and Thickness Effects
To investigate the effect of cover, atest series was conducted in which sim-ilar anchors were used while varying theweb thickness. The cover is expressedas the ratio of the width of the bearingplate divided by the thickness (2u'It) oras the cover-to-thickness ratio on a givenface.
Fig. 11 shows the non-dimensionalcracking trends with respect to cover.The solid line,which forms a reasonableand conservative lower hound for theexperimental data, was based on the 3DFEM predictions discussed in Ref. 1.Fig. 11 indicates that for specimens withlike values off, the section will crackwhen approximately the same uniformcompressive stress (Fc,.12at) is applied,regardless of the ratio of cover concrete(Clt). It does not mean, however, thatthe absolute cracking load remains thesame as cover is increased.
Clearly, the thickness of the section isan important variable. Since the sectionswith like values of f p crack when a uni-
oar
U
Fig. 10c. Diagonal cracks at anchor.
PCI JOURNAUJanuary-February 1984 79
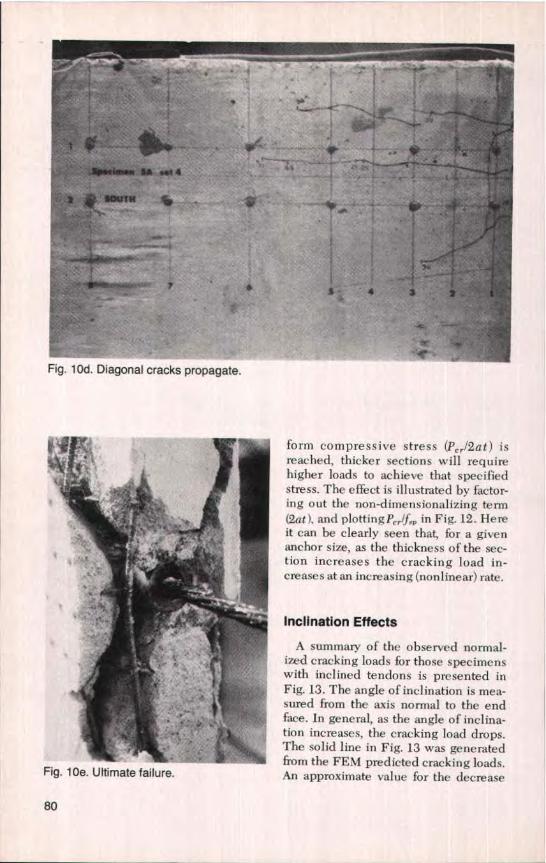
Fig. 10d. Diagonal cracks propagate.
Fig, 1 Oe. Ultimate failure.
80
form compressive stress (P,,.12at) isreached, thicker sections will requirehigher loads to achieve that specifiedstress. The effect is illustrated by factor-ing out the non-dimensionalizing term(at), and plottingPP ,/f,,, in Fig. 12. Hereit can be clearly seen that, for a givenanchor size, as the thickness of the sec-tion increases the cracking load in-creases at an increasing (nonlinear) rate.
Inclination Effects
A summary of the observed normal-ized cracking loads for those specimenswith inclined tendons is presented inFig. 13. The angle of inclination is mea-sured from the axis normal to the endface. In general, as the angle of inclina-tion increases, the cracking load drops.The solid line in Fig. 13 was generatedfrom the FEM predicted cracking loads.An approximate value for the decrease

Fig. 1 Of. Cone of crushed concrete.
1,25^^2a^rt–
O
1.0 ® 2 a,2a
O
.75 _
O ^t^a
N
50 0 MODEL DATAa.
O PROTOTYPE DATA
• 3D FEM PREDICTED
2 .4 .6 .8 I.o ^
.5 .4 .3 .2 .E 0 ( COVERTHICKNESS
Fig. 11. Cover effects.
PCI JOURNAL)January-February 1984 81

asy
. 60
cr0
2040
20 HtH
0 MODEL DATA
0 PROTOTYPE DATA
0 .2 .4
.5 4 .3
Fig. 12. Thickness effects.
• 3D FEM PREDICTED
C _ COVERt THICKNESS
i 1 2Q,6 .8 I.0 = t
.2 .1 0 t
in the normalized cracking load is onepercent per degree of inclination.
The experimental values for 0 = 0 hada'lt ratios from 0.71 to 0.88 and matchdata shown in Fig. 11. However, there isa discrepancy in the finite elementmethod results. The inclined tendonshave a re-entrant corner and the indi-cated strains due to this notch effectwere always higher. A somewhat higherstrain criterion was needed to reflectthis change. Details are presented inRef, 7.
Bearing Area Effects
A summary of the seven specimenswhich dealt with the effects of bearingarea on the behavior of the anchoragezone is presented in Fig. 14. In contrastto the cover series, the width of the
specimen remained constant and thesize of the anchor was successively re-duced to obtain higher bearing stressesfor a given load. In general, it was ob-served that the cracking load increasedslightly for increases in the size of thebearing plate.
The results of the FEM analysis agreewith the test data. The relative flatnessof the curve can be seen by observingthe increase in P.r I2atff for dramaticchanges in A, /A,, where A, is the loadedarea of the bearing plate and A2 is thearea concentric with and geometricallysimilar to the plate (notation used as inthe ACI Building Code).
To illustrate the above, forA,/As = 1,the cracking load is 40 percent abovethat for the case ofA,/A2 = 0.2. Thus, the40 percent increase in cracking load cor-responds to a 500 percent increase in
82

a-w
Ua
10 20 30 40 50
ANGLE OF INCLINATION {6'}
Fig. 13. Inclination effects.
bearing area. It should be noted that in-creased A1 /A2 values correspond to in-creased a'la values which should resultin decreased bursting stresses. Withslight rearranging, the ACI equation forbearing stress after allowance for pre-stress losses (Section 18.13, ACI 318-77Commentary) yields the following for-mula:
0.6 .f, VA2 /A, <J (from ACI)
PCI JOURNALIJanuary-February 1984
Poliou = fallow 'A1
= 0.6f A2/A 1'A,=0.6ff\A!A1
for ff = 4000 psi (27.6 MPa) (average,most tests), and f, = 8.3 /f (models).
Note that a lower value of around 6.[j would be more appropriate for pro-totype concretes.
Then, Pal row lf p = 4.57 [[AA.
For comparison, these values are
83

Cal1.14
o
O p O ^^AASHTO
61
CEB–FIP
3D-FEM ,^ ^—65 AC I ^i^ (IMMEDIATE) — ^/ ACI
/ ^ AFTER LOSSES)a , /
49
/
0 MODEL DATA
0 PROTOTYPE DATA
f 3D FEM PREDICTED.^ 20
-- \ `q
A 2 -
.16I.t}i
4 6 8 q
A 3 /A2
Fig. 14. Bearing area effects.
plotted as a broken line labeled ACI(after losses) below the experimentaldata in Fig. 14. Also plotted is a similarcurve labeled ACI (immediate) which isbased on the ACI bearing stress equa-tion immediately after tendon anchor-age:
f"a..= 0.8f,% V A,/A, — 0.2 z 1.25f'.t
This expression is in very goodagreement with the data trends and is
quite conservative. Both expressionsfollow the correct trend and are conser-vative, since the ultimate load is gener-ally greater than the cracking load.Since, with certain types of supple-mentary reinforcement, both crackingand ultimate loads can be raised signifi-cantly, the ACI curves are in actualityvery conservative.
A similar examination can be made ofthe AASHTO anchorage bearing stresscriterion of AASHTO Section
84

O MODEL DATA• 3D FEM PREDICTEDo PROTOTYPE DATA
0.BI
a
c1
Ua-
E
0•
—al2dH-0.49
12a^ iL0.33 –
2Q
0.16
t=.3a ALL TESTS
a = 10 MODELa = 41 PROTOTYPE1" = 2.54 cm
0 0.10
0.2a 0,30 0.40 0.50
ECCENTRICITYFig. 15. Eccentricity effects.
1.6.1(B)(4). This provision allows apost-tensioned anchorage bearing stressat service load of 3000 psi (20.7 MPa)but not to exceed 0.9f . . For the modelseries ff was about 4006 psi (27.6 MPa),2a was 20 in. (508 mm) and t was 3 in.(76 mm). To illustrate the effects of thiscriterion in Fig, 14 the following proce-dure was used:
fog,,,,. = 3000 c 0.9 (4000) psi (where 1psi = 6.9 kPa)
PCI JOURNAL/January-February 1984
Pa^zo^ = .fauaeo A = 300() A 1
Again, for the mode is f. = 8.3 v fT , so:
= 3000A _ 5.72 A,
fgF 8.3 v 4000
By nondimensionalizing the abovequantities as in Fig. 14, since A2 = t2 , thefollowing expression is obtained:
P.,.. = 5.72 A, t = 5.72 ^'
f, 2at 2at t A, 2a
85
Pu /fsp r,993
Per /fsp 82.48Q Ply /fsp =Par/fsp 77.2
0 6O P" 'f 20
2a
1 }}
P /f 5a.2Lr Sp
a
a._
2o = 20" (1" = 2. 54 cm)2a'=2" PLATE, CONE2o'= 2.7 BELL
1=0.45ae=0
MR28 MI-2CONE PLATE
(extrapolated)
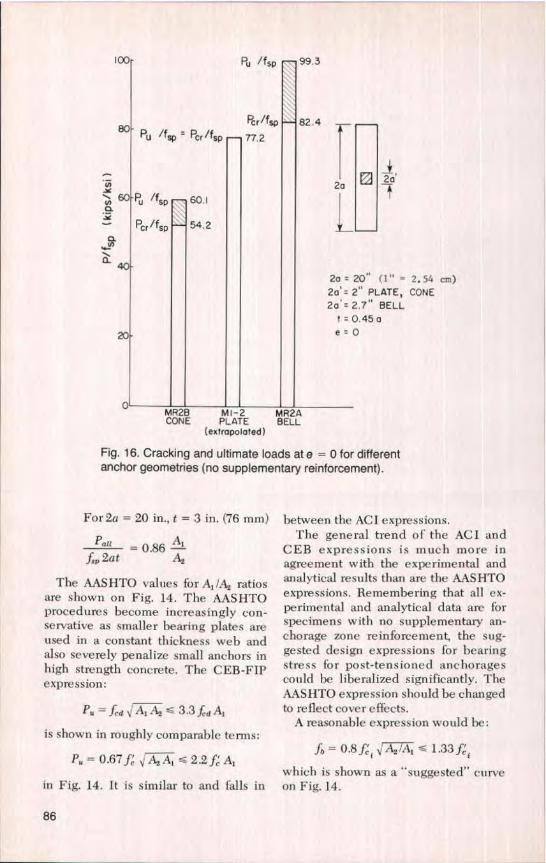
Fig. 16. Cracking and ultimate loads ate = 0 for differentanchor geometries (no supplementary reinforcement).
For 2a = 20 in., t = 3 in. (76 min)
PaU =O86 A'fp 2at A2
The AASHTO values for A 1 1Ap ratiosare shown on Fig. 14, The AASHTOprocedures become increasingly con-servative as smaller hearing plates areused in a constant thickness web andalso severely penalize small anchors inhigh strength concrete. The CEB-FIPexpression:
P- = fdJ A^ A -_3.3f^dAZ
is shown in roughly comparable terms:
between the ACI expressions.The general trend of the ACI and
CEB expressions is much more inagreement with the experimental andanalytical results than are the AASHTOexpressions, Remembering that all ex-perimental and analytical data are forspecimens with no supplementary an-chorage zone reinforcement, the sug-gested design expressions for bearingstress for post-tensioned anchoragescould be liberalized significantly. TheAASHTO expression should be changedto reflect cover effects.
A reasonable expression would be:
fn=0.8f { v^A, 1,33f,P„=0.67ff AEA,-_22ffA,
which is shown as a "suggested" curvein Fig. 14. It is similar to and falls in on Fig. 14.
86

+ ULT 100–ULTIMATELOAD
2a
HH4a I a = IQ..
60
0 = I -PLATE, CONE0 = 1.37 BELL
a1 - '45a CR 484–CRACKING
or .30 ULT 49.5
465LOADt
a [^ 44 .4
e = .60 CR 4a$ n
ULT
CR
M18-4 M2B -4 MIA-4 M88-4 M2A-4 MR3CONE CONE PLATE PLATE PLATE BELLf=3" t=4.5" t=3 t =3' t=4.5' t=4.5"
Fig. 17. Cracking and ultimate loads ate = 0.6a for different anchorgeometries (no supplementary reinforcement) (1 in. 25.4 mm).
Eccentricity Effects
A series of nine tests dealt with theeffect of eccentricity of the anchorage inaweb. The general trend, shown in Fig.15, indicates that increased eccentricityresults in a decrease in the crackingload. As a measure of this, an anchor lo-cated one-third of the distance from thecentroidal plane toward the edge willcrack at a load 25 percent below that forcentroidal loading. An anchor locatedtwo-thirds of the way towards the edgewill crack at it load approximately 50percent below the centroidal loading.
The trend appears to be fairly linear.The superimposed solid line representsthe finite element analysis predictedcracking load. If the anchor is so eccen-tric that it is located within the flangeregion, these results may not be mean-ingftil.
Comparison of Anchorage Types
Tests were run with the three types ofanchorages shown in Fig. 4. The generaltrend apparent from Figs. 16 and 17 wasthat conical anchorages cracked at loads
PCI JOURNALJJanuary-February 1984 87

30 to 50 percent lower than those forplate anchors tested under identical cir-cumstances. The somewhat larger butequivalent bell anchors cracked at loads7 to 9 percent above those observed forplate anchors.
Ultimate load data indicated that forplate and conical anchors without sup-plemental anchorage reinforcement,specimens failed at loads at or onlyslightly above the cracking load. Thebell anchors which in effect includesupplemental anchorage reinforcementin their basic design developed sub-stantially higher loads beyond cracking:20 percent higher for an eccentricity ofe = 0, and 106 percent higher for an ec-centricity ofe = 0.6 a.
Passive ReinforcementEffects — Spirals, OrthogonalGrids
There are basically two reasons foradding supplementary reinforcement tothe post-tensioned anchorage zone. Themost important reason is to preventcomplete failure in the event thatcracking should occur, and thus to en-sure that the safety of the structure isunimpaired. However, in most cases,the addition of supplementary rein-forcement will also tend to raise thecracking load, due to the confinement ofthe concrete. Thus, the second reasonfor adding supplementary reinforce-ment is to increase the surface crackformation Ioad, adding to the resistanceto corrosion and to the aesthetics of thepost-tensioned application.
The reinforcing schemes tested dur-ing the rectangular model series' indi-cated that spiral reinforcement was farsuperior to conventional orthogonal orgrid-type reinforcement. However, insome cases it may be impractical to usespiral reinforcement because of conges-tion in the anchorage zone. For suchsituations, orthogonal reinforcement,while less efficient, will provide someincrease in the cracking load and a sub-
stantial increase in the ultimate capac-ity. General trends for both types ofpas-sive reinforcement are discussed below.
Spiral Reinforcement
Confinement reinforcement in theform of a spiral placed concentricallyaround the duct and extending along theduct from the face of the anchor bearingsurface proved very effective. A typicalspiral in the prototype would be 8 in.(203 mm) in diameter, have a 2-in. (51mm) pitch, and be fabricated from ^ or' in. (9.5 or 12.7 mm) diameter GR 40 orGR 60 wire. Lengths varied from 13 to26 in. (330 to 660 mm). Model spiralswere scale replicas. Test results for spi-rally reinforced specimens (summarizedin Fig. 18) indicate the following trends:
1. For a given volumetric percentageof spiral reinforcement, the spirals fabri-cated from smaller diameter bar stock [ %in. (9.5 mm) versus ½ in. (12.7 mm) forthe prototype tests] were observed toperform better than equivalent spiralsfabricated from larger bar stock. Whilethis trend may not be a general rule, itindicates that for a given requiredquantity of reinforcement, greater effi-ciency is achieved through the use ofspiral fabricated from smaller bars at acloser pitch, rather than from large barsat a greater pitch.
2. Within the range investigated in thefull-scale tests, long spirals [26 in. (660mm) in length affixed to the anchor]performed no better than the short spi-rals [ 13 in. (330 mm) in length] . For thecase of the inclined, curved, multiplestrand tendons, however, careful atten-tion must be paid to the possibility ofcracking along the tendon path at thepoint of maximum tendon curvature (seeFig. 26).
In most practical applications thatpoint would be well-removed from theanchorage zone, and from the influenceof any spiral reinforcement in the an-chorage zone. While continuing anchor-age zone reinforcement into the zone of
88

n_L0C3)Z>-mc
TCDQC
coWA
SPIRAL REINFORCEMENT/ (STRAIGHT TENDON)a
f200
1 90 SPIRAL REINFORCEMENT150 60 kpa LPT 6' FRCMI LOADED FACE
(STRAIGHT TENDONS (INCLINED, MULTIPLE STRAND
o U
0Z _°
X00
IAJ
2 100 0 -- ORTHOGONAL REINFORCEMENTa
_,
- 4 r (STRAIGHT TENDON
2 IQ_ 1 -- ORTHOGONAL REINFORCEMENT SPIRAL REINFORCEMENT—I0 (STRAIGHT TENDONS) {INCLINED MUPLTI STRANDU I
ONI
a 50 __ 50-
4 30 Q5 60 lays LPT AT 6" FROM LOADED FACE30° INCLINED, CURVED
D0 ,S-^- SPIRAI. REINFORCEMENT
MULTIPLE STRAN TENDON
0 50 100 150 200
A sfy /10000 lb.
1a)PERCENT INCREASE IN CRACKING LOAD ABOVE
UNREINFORCED SECTION
Fig. 18. Supplementary reinforcement efficiency.w
0 50 100 150
A Sfy /l0000 lb.
(b) PERCENT INCREASE 1N ULTIMATE LOAD ABOVE
CRACKING LOAD FOR UNREINFORCED SECTION

maximum curvature would seem logicalin such situations, calculations indicatethat the reinforcement required to resistsuch multistrand effects is much smallerthan that required for confinement inthe anchorage zone.
At first cracking, all spiral confine-ments tested in the prototype specimensseries maintained crack widths belowthe maximum 0.013 in. (0.33 nim) cur-rently implicitly specified by the ACICode .5
A measure of the spiral's effectivenessin delaying surface cracking and in in-creasing the ultimate anchorage capac-ity can be clearly seen in Fig. 18. Instraight tendon specimens the spiralreinforcement raised the cracking loadby 100 percent (i.e., more than twice thecracking load) over that witnessed incompanion tests with no supplementaryanchorage zone reinforcement. Ultimateloads were increased more than 200percent above the cracking load for theunreinforced section. These resultswould apply to both single and multiplestrand tendons.
However, for specimens with 30-deginclined, curved, multiple strand ten-dons, supplementary spirals in the an-chorage zone raised cracking loads byonly 7 percent. Part of the reason for thiswas due to the fact that first cracking forthe specimens in this series occurredbeyond the zone of spiral reinforcement,in the area of maximum tendon curva-ture. The anticipated rise in crackingload with the addition of the spiral isthus counterbalanced by the tendencyfor cracking which occurs due to themultistrand effects discussed later inthis paper. However, model tests ofsingle strand tendons indicate that ifcracking were prevented in the region ofmaximum curvature (say, by the properuse of spiral reinforcement in that zone),first cracking would occur in the anchor-age zone at a load approximately 14 per-cent above that for a specimen withoutreinforcement.
Fig. 18 clearly indicates that passive
supplementary reinforcement is signifi-cantly Iess effective in raising crackingloads for inclined, curved, multiplestrand tendon applications than forstraight tendons. however, the ultimateload can be substantially raised by theaddition of spiral reinforcement, al-though again not as much as for straighttendon applications. For supplementaryspiral confinement with inclined ten-dons at 30 deg, the ultimate loads were61 and 77 percent above the crackingload for the unreinforced section formultiple strand tendons and singlestrand tendons, respectively. It may bepossible to raise the ultimate capacity ofmultiple strand tendons still further bythe addition of supplementary spiralreinforcement in the region of maximumcurvature, but no experimental verifica-tion of this is available at present. Thedesign of such reinforcement is dis-cussed in a companion paper. 12 For ten-dons inclined at angles other than 30deg, it would seem reasonable, pendingfurther experimental study, to assume alinear variation in the increases incracking and ultimate loads between thesets of values given for straight and 30-deg inclined tendons.
The percentage increases above re-flect the observed mean less two stan-dard deviations for each grouping. Spi-ral reinforcement is assumed to be de-signed in accordance with the methoddescribed in Ref. 12 which suggests aminimum confinement similar to a col-umn spiral designed by the ACI Code .5
Design procedures and recommenda-tions for spirally reinforced zones willbe summarized in a companion paper.Fig. 18 also indicates the strength gainto be flat-topped for increasing amountsof spiral reinforcement.
Orthogonal Reinforcement
While spiral reinforcement is the mostefficient means of providing passivereinforcement in anchorage zones, itmay not always be feasible to use it due
90

Fig. 19. Anchorage zone reinforcement design as per Guyon (Ref. 10).
to problems of congestion. For suchcases, orthogonal reinforcement in theform of closely spaced stirrups, or matssimilar to those recommended byCuyont° and shown in Fig. 19, is an ac-ceptable remedial method of raising thecracking and ultimate loads.
In this study, widely varying amountsof passive reinforcement were used inthe form of closely spaced additionalstirrups surrounding the anchor andtendon and extending along the tendonFor a distance equal to the depth of themember. The percentage of steel cross-ing the tendon axis in the bursting re-gion varied from 0.5 to 2.0 percent. Fulldetails are given in Ref. 7. Heavily re-inforced specimens exhibited onlynominally higher cracking and ultimateloads than those with fairly lightamounts of reinforcement.
As shown in Fig. 18, for straight ten-don applications orthogonal reinforce-ment raises the cracking load by 60 per-cent above the observed cracking loadin companion specimens with no rein-forcement. Ultimate failure occurred atloads at least 70 percent above thecracking load for the unreinforced sec-tion. No tests were done to investigatethe performance of orthogonal rein-forcement for inclined tendon applica-tions because the spiral was so clearlysuperior.
Fig. 20 shows the ultimate load trendsfor spiral and orthogonally reinforcedanchorage zones. These substantiate thenon-productivity of using large amountsof supplemental reinforcement and
show the pronounced benefit of the spi-ral confinement.
Active Reinforcement Effects
For most practical situations, the in-elusion of passive reinforcement in theform of spirals will be the most effectivemethod of anchorage zone reinforce-ment. However, in situations whereminimization of cracking is desirable,the use of lateral prestress in the an-chorage zone offers the designer a pow-erful tool. The use of lateral prestresscan significantly raise the cracking load.
Laboratory tests of two full-scale spec-imens and the results of the three-di-mensional finite element analysis indi-cated the following:
1.The optimum location for the lateralprestress load is as close to the loadedface as possible, as shown in Fig. 21.
2. For a lateral post-tensioning pre-compression of 100 psi (690 kPa)[nomi-nal lateral precompression force over anarea equal to one-half of the sectiondepth times the web width (see Fig.21 a)] placed at the optimum location,the cracking load was observed to be 33percent higher than that for an identicalspecimen without supplementary rein-forcement (active or passive). Crackingoccurred on a plane following the ten-don path, but slightly above it and ex-tended from the loaded face to theweb-flange junction. Crack width mea-surements indicated the crack initiatedin the region of maximum curvature.Thus, first cracking appeared at a load
PCI JOURNAt,Uanuary-February 1984 91

N
O
TOTAL As fs (kips)
Fig. 20. Normalized ultimate loads—reinforcement series.
somewhat lower than that predicted bythe program.
3. Given that the inclined, curved,multiple strand tendon appears to be theworst case for design, it can be seen inFig. 18 that lateral post-tensioning offersthe most effective means of raising boththe cracking and ultimate loads. Al-
though no lateral post-tensioning testswere done for straight tendons, it ap-pears reasonable to assume that its per-formance relative to the spiral will besimilar.
Several additional important pointsshould be made concerning the imple-mentation of lateral post-tensioning in
92

PLPT
3/2aLPT- MIN COVER TO LOAD
a ^\
A \\B
a —/I
2a'= ANCHOR WIDTH
(a) LATERAL COMPRESSIVE STRESS ALONGAB - LPT /a-t
i1 I
TWIN GROUTED TENDONSSYMMETRICAL ABOUT DUCTSO THAT NO MOMENT WILLBE SET UP IN WEB SECTION.
(b) TYPICAL IMPLEMENTATION IN ACTUAL BOX SECTIONWEB TO AVOID MOMENT
Fig. 21. Lateral post-tensioning details.
practical situations. Upon first consider-ation it might be assumed that shrink-age, creep, and anchor set losses wouldbe a severe deterrent to the use of lateralpost-tensioning, owing to the shortlength of the tendon. For the case of asegmental bridge using precast box sec-tions (one of the most likely situations to
need lateral post-tensioning), three con-siderations make lateral post-tensioninghighly practical and easy to implement:
1. Since most segmental bridges arenow built using industrialized proce-dures, the precast box segments are con-structed well before they are erected.This reduces shrinkage problems to a
PCI JOURNALJJanuary-February 1984 93

minimum, since nearly all losses due toshrinkage occur in the first 100 daysfrom the date of casting.
2. A lateral prestress load capable ofraising the cracking load by 33 percentonly required 100 psi (690 kPa) com-pression across the web section. At thispressure, creep losses are small.
3. Losses at the lateral post-tensioninganchorage due to slip associated withseating the chucks can be minimized byusing a positive seating method such asa secondary jack for pressing the wedgesin before the load is released from thestressing jack. Alternatively, threadedbar-type tendons with lock-off nuts can.be used.
Grouted tendons are recommended toprevent possible loss of the tendonsshould a failure occur at the anchoragesometime after stressing as well as toprovide corrosion protection and tominimize the danger of water freezingin the ducts.
The Bearing Stress Role
The cracking load is fairly insensitiveto appreciable changes in the bearingarea. The two full-scale tests designed toinvestigate the effect of bearing stresshad differences in normalized crackingloads of only 12 percent, despite a 73percent difference in anchorage bearingarea. Furthermore, these tests wereconducted on straight tendon, concen-trically loaded specimens. Crackingloads for inclined and eccentric tendonswith no supplementary anchorage rein-forcement are substantially less thanthose for a straight concentric tendon,given identical anchors.
While bearing stress should be a fac-tor in a design equation, results indicateit should be a minor one. Present speci-fications which base anchorage designprincipally on bearing stress are notonly overconservative for straight ten-don, concentric load applications, butinapplicable and generally unconserva-tive for inclined and eccentric tendon
situations. A more accurate general in-dicator of cracking trends is thusneeded.
The Bursting Stress Role
Since most previous research as sum-marized in Ref. 1 focused on a burstingstress design criterion it is important tohave a clear understanding of thebursting stress variation for all geomet-ric variables studied. One measure ofthis is the peak tensile bursting stressdeveloped for a given load. Since theanalytically computed bursting andspalling stresses (strains) were in gen-eral agreement with the physical teststrainmeter data it will simplify compar-isons to use the three-dimensional finiteelement method analytical solution re-sults.
Reference will be made to specificmeasured data where important trendswere observed. Table 1 provides asummary of all three-dimensional finiteelement studies pertinent to the physi-cal test program. Data are provided for a1-kip (4.45 kN) load. Since the solutionis linear, comparable data for any tendonload can be obtained by multiplying theindicated results by the load. Valuescorresponding to specific test specimensat their measured cracking loads arepresented later in this paper.
For concentric straight tendon speci-mens with varying thicknesses, columnorb in Table 1 indicates that the rnaxi-mum bursting stress decreases expo-nentially with increasing thickness.This is expected, and the trend is illus-trated in Fig. 22. The solid line in thisfigure represents the predicted peakbursting stress at the model tendon de-sign load of25 kips (111.3 kN)1400 kips(1.78 mN) prototype] = 0.8f,,,.
Even at the higher loads which actu-ally caused cracking in the test speci-mens the measured peak burstingstresses are insufficient to explain whycracking occurred, since the split cylin-der tensile strength of the concrete
94

Table 1. Summary of Results Using Three-Dimensional Finite Element Analysis.
Geometric variables Maximum values at 1-kip load
Spalling Spalling Bursting Burstingt 2a e 2a 0 strain ( €) stress (psi)' strain ^,u,e) stress (psi)
Parameter (in.) (in.) (in.) (in.) (deg.) a,r, Qra e,. 0-ra Notes
3 20 0 2 0 5.04 19.2 2.88 6.48Eccentric- 3 20 4 2 0 13.72 51.2 2.8 5.76 *ity 3 20 6 2 0 16.48 123.0 2.8 4.72
3 20 8 2 0 22.9 171.0 2.0 336
3 20 0 3 0 3.92 19.2 2.48 5.84Bearing 3 20 0 2.62.5 0 424 16.48 2.8 6.0stress 3 20 0 2.125 0 4.88 18.76 2.56 5.68
3 20 0 2 0 5.04 19.2 2.72 6.1 *3 20 0 1.5 0 5.84 22.0 2.48 5.3 *
1 20 0 1 0 10.4 39.6 8.0 20.62 20 0 2 0 7.6 28.8 4.0 10.1
Width 3 20 0 2 0 5.04 192 2.88 6.484 20 0 2 0 4.4 18.4 2.0 4.645 20 0 2 0 3.8 13.08 1.6 3.686 20 0 2 0 3.12 9.68 1.28 32
3 20.5 0 2.625 0 8.04 34.0 5.02** 13.9** t3 20.5 0 2.625 15 40.32 164.0 3.76** 115** 1'
Inclina- 3 20.5 0 2.625 30 57.76 229.0 2.87** 9.12** ttion 6.72tt 23.911 t
3 20.5 0 2.625 45 80.8 325.0 3.16 * * 9.52 ** t8.72tt 323}t t
Lateral 3 20.5 0 2.625 30 24.1 94.4 1.68** 2.99** f, tpost- 5.5211 19.4tt t, ltensioning 3 20.5 0 2.625 30 5024 197.6 -0.856** -7.04** t, §
4.3211 13.611 t,
CD Metric (SI) conversion factors: I in. = 25.4 mm; 1 kit, - 4.45 kN. `Tendon duct not included in finite element method mesh.50.3 kip lateral post-tensioning at 0.780a from loaded face. tOuet, friction and normal (radial) forces included in mesh.*Peak bursting stress (strain) at 4a' from loaded face along tendon duct. tO.3 kip lateral post-tensioning at 0.146a from loaded Face.
ttPeak transverse stress (strain) at point of maximum tendon curvature (nut a conventional bursting stress).

CONCRETE TENSILE STRENGTH
PEAK BURSTING STRESSvrs.
SECTION WIDTH
PEAK BURSTING STRESSAT OBSERVED CRACKINGLOADS FOR TESTS
O MI-2, M2-2, M3-2
PEAK BURSTINGSTRESS AT DESIGN LOAD
=25 kips (3D-FEM)
3
a
U)U)w
I-U)
U)rr0mYwa-
\O.=MEASURED
0'
3D-FEMPREDICTED
MODEL SPECIMEN THICKNESS (in.}
Fig. 22, Peak bursting stress as a function of section thickness.
(which is shown on Fig. 22) is consider-ably in excess of the highest burstingstress expected or measured. For exam-ple in the first line of Table 1 with t = 3in. (76 mm), e = 0, 6 = 0, the calculatedpeak bursting stress at a 1-kip (4.45 kN)load would be 6.48 psi (44.7 kPa).
The cracking load for the corre-sponding test specimen (M2-2) was 34kips (151.3 kN). Thus, at cracking, thecalculated peak bursting stress is 6.48(34) = 220 psi (1.5 MPa) as plotted onthe dashed line of Fig. 22. This value iswell below the measured tensile capac-ity of the concrete for that particularspecimen Lf p = 627 psi (4.3 MPa)I .
The experimentally measured valuesshowed peak bursting stresses at crack-ing based on measured strains to be ap-proximately 30 to 50 percent higher thanthose predicted by the computer analy-sis, as also shown in Fig. 22. These val-ues are plotted above the three-dimen-sional finite element method predictedvalues and again clearly fall well belowthe measured tensile strength of theconcrete, The observed bursting strainsat cracking were generally well belowthe 150 microstrain recommended byREisch" as the lowest limiting strainwhich would cause cracking.
The most important evidence that the
96

z
rru)0U
2a
Fig. 23. Experimental bursting strain distribution—inclination series t1 in. = 25.4 mm).
bursting stress is not the propercriterionfor anchorage zone cracking behaviorcomes from eccentric straight tendontests.
Two different analytical approaches
(the Guyon symmetrical prism method'oand a three-dimensional finite elementanalysis) both indicate that the peakbursting stress decreases significantlywith increased tendon eccentricity. This
PCI JOURNAUJanuary-February 1984 97

trend was substantiated experimentally.The test results shown in Fig. 15, how-ever, also showed that cracking load wasappreciably reduced with increasing ec-centricity.
Thus, there is a direct conflict be-tween the experimental results and pre-dictions using a critical bursting stresstheory. However, the finite elementanalysis indicated a good correlationbetween peak spalling stress values andcracking loads. As indicated in Fig. 15,the finite element method analysisbased on spalling (not bursting) stressresults is in good agreement with testobservations.
For inclined tendon specimens, Table1 shows that the computed burstingstress also decreases with increasedangle of inclination. Fig. 23 shows clearexperimental verification that the mea-sured bursting stress (strain) decreasedwith increase in the tendon inclination.Again, a critical bursting stress criteriondirectly contradicts the experimentallyobserved cracking trend of Fig. 13which showed that cracking loads de-crease with increasing inclination. Onceagain, the three-dimensional finite ele-ment predictions in Fig. 13 based onpeak spalling (not bursting) stress re-sults are in good agreement.
Spalling Stress Role
When these major contradictions werenoted between the bursting stress vari-ation and the actual cracking loadtrends, a detailed examination was un-dertaken of the state of stress in the an-chorage zone using the three-dimen-sional finite element program. It wasfound that the computed tensile spallingstress along the end face increasedrapidly with increasing eccentricity.The maximum value calculated was lo-cated near the edge of the plate anchor.While no evidence was seen in any testspecimens of external cracks due tospalling stresses, the variation in mag-nitude of the computed spalling stress
also correlated with the observedcracking load variations in the inclined,bearing stress, and cover series speci-mens.
Studies of the role of the spallingstresses in anchorage zone behavior ledto the formulation of a failure hypothe-sis. Since the spalling stress (strain) ap-pears to be the best indicator of tendonpath crack initiation, even though"spalling cracks" do not occur, a methodof predicting first cracking through theuse of analytically derived spallingstresses (strains) was developed.
Anchorage Failure Mechanism
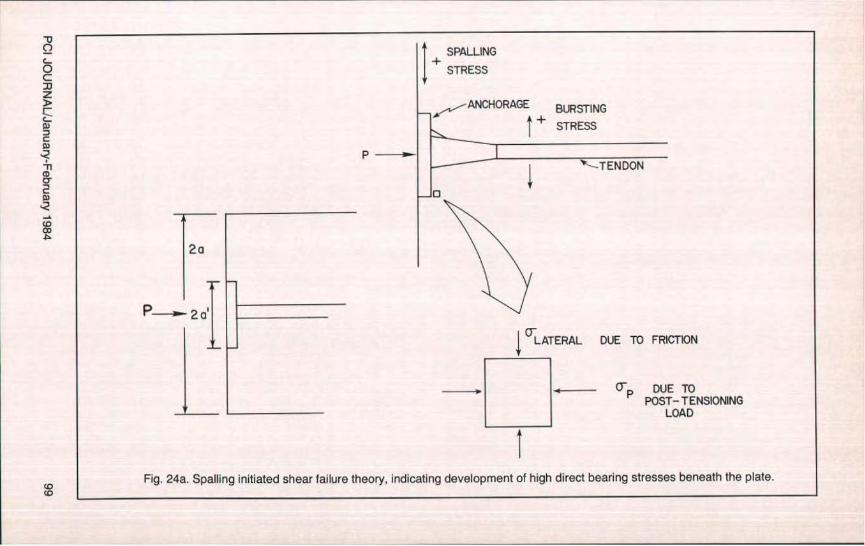
Detailed comparison of analytical andexperimental data for a wide range ofvariables indicated that several keyphases were common in the overall be-havior of plate (bearing) type anchor-ages under load as shown in Figs. 24athrough 24d. These phases suggested ageneral failure mechanism which couldalso he adapted to cone and bell an-chors. The key phases were:
1. Appearance of the longitudinaltendon path crack on the side faces, usu-ally beginning at a distance approxi-mately equal to the width of the anchorplate from the loaded face.
2. Appearance of tipper and lower di-agonal cracks on both the end faces andthe side faces emanating from the cor-ners of square anchors or of radial cracksfrom circular anchors.
3. Ultimate failure consisting of anexplosive side face blow out, usually oc-curring shortly after formation of the di-agonal cracks.
4. After failure a cone (pyramid) ofcrushed concrete was observed (see Fig.10f) beneath the anchor plate with thetelltale presence of powdered concretealong its edges indicative of a shear fail-ure.
To further investigate the shear typefailure noted in Phase 4, a study wasmade of both the calculated spallingtensile stress (strain) and maximum
98
c0cn
SPALLINGSTRESS
^. -ANCHORAGE BURSTING+ STRESS
1 '* -TENDON
2o
'LATERAL DUE TO FRICTION
_..^ DUE TOPOST- TENSIONING
LOAD
fi
Fig. 24a, Spalling initiated shear failure theory, indicating development of high direct bearing stresses beneath the plate.

MOHR CIRCLE T
LATERAL
Fig. 24b. As lateral confining stress is reduced, shearing stress increases, asshown by the increase in diameter of Mohr's circle.
N
shearing stress (strain) in the vicinity ofthe anchor plate edge. The shearingstress values offered no direct correla-tion which would explain the crackingbehavior.
This phenomenon may be becausethe analytical program could not accu-rately model the lateral friction forcesdeveloped beneath the anchor plate.The spalling stress values, however,followed a definite trend which indi-cates that the following sequence is theprobable mechanism leading to the an-chorage zone failure for plate bearinganchors and with minor modificationsfor cone and bell type anchors:
1. Due to large friction forces devel-oped directly beneath the anchor plate,Poisson ratio type lateral expansion ofthe Concrete in this vicinity is con-strained.
2. A complex, triaxial compressivestress state is thus set up which permitsdevelopment of extremely high ,directbearing stresses (up to 3ff) beneath theplate (see Fig. 24a).
3. The confining lateral forces at theedge of the plate are reduced by thepresence of the spalling tensile stress(strain). As this reduction in lateral con-fining stress takes place, the effect onthe state of stress would he to increasethe shearing stress, as can be seen fromthe increase in diameter of'Mohr's circleas illustrated in Fig. 24h.
4. At some level of applied load theconfining stress is sufficiently reduced(though still in compression) so that aninternal shear failure occurs along theplane of maximum shear stress.
5. The maximum shearing stressplane occurs at an angle of 45-degcounterclockwise from the primarystress a„ axis and thus propagates toform the 45-deg pyramidal "cone" seenfor all plate-type anchors (see Fig. 24c).
6. Simultaneous with the formation ofthe cone, a tendon path crack propagatesfrom the tip of the cone, as shown in Fig.24d. (Note that Phases 5 and 6 can bedelayed by the presence of supplemen-tary anchorage zone reinforcement. Thisdelay can be substantial when spiralsand lateral post-tensioning which en-hance confinement are used.)
7. The cone is forced into the anchor-age zone, setting up large lateral forceswhich eventually produce the upperand lower diagonal cracks (see Fig. 10b).
8. Increases in load above that re-quired for formation of diagonal crackslead to ultimate explosive failure of theside faces, bounded by the upper andlower diagonal cracks (Figs. 24d and l0e).
Multistrand Side Face FailureMechanism
For thin web post-tensioning applica-tions where significant tendon curva-

45°
PCR —I•—II
11/NDON PATHCRACK
SHEARCONE
Fig. 24c. The maximum shearing stress plane occurs at an angle of 45 degcounterclockwise from the primary stress axis.
PULTIMATE
)NE
TH
RUPTURELATE
`LEVIER DIAGONAL CRACK
Fig. 24d. The ultimate explosive failure of the side faces is bounded by theupper and lower diagonal cracks.
tares are required and multiple strandtendons are used, a second mechanismmay govern the failure of the section.Any time a loaded tendon follows acurved path, normal and friction forceswill be set up as shown in Fig. 25.Equilibrium of'torces in the vertical (x)direction yields:
dH dOPsin 2 +(P+dp)sin2 —N=0 (1)
2P sin + dP sin 22̂ =N (2)
where N represents summation of all
normal force components over the ele-mental length ds. The normal force ap-plied to the tendon duct per unit lengthis thus:
p = Nlds (3)
Also, from small angle theory:
do do
sm _ — (4)2 2
Substituting Eq. (4) into Eq. (2)yields:
2P dO +dP 20 =N (5)
PCI JOURNAL1January-February 1984 101

P +dP
^f ds
-- P
Lz
P +dPP
11l
Fig. 25. Radial and friction forces due to tendon curvature.
ButdPCIO-,02
Thus, Pd6 = N (6)
Substituting Eq, (3) into Eq. (6)yields:
p=Pdo
= R (7)
whereP = post-tensioning load (kips)R = radius ofcurvatureata given point
(in.)p = normal load on tendon duct per
unit length (kips per in.)
From calculus:
+x(d'\2]3/2
R = ^^TJ (8)
dz1
Most curved tendon profiles can bedescribed by the polynomial equation:
X =Azs +Bz2 +Cz+D (9)
Substitution into Eq. (8) yields:
R = [1 + (3AZ2 + ZBz + C)2]'5 (10)^6Az+2B^
102

If the value of R is relatively small,very large normal components of thepost-tensioning force are set up whichcan cause tendon path cracking at loadsbelow those which would initiatecracking in the anchorage zone proper.In these cases the multiple strand bun-dle tries to flatten out because of thenormal force components.
This action creates large lateral forceson the tendon duct and the side walls.Figs. 26 and 27 illustrate this failure se-quence which was observed in the full-scale tests. This is more likely to occurwhen the anchorage zone is well-rein-forced and the point of maximumcurvature occurs well away from the an-chorage and does not have supplemen-tary reinforcement.
This same tendency also can occurwhenever multiple strand tendons passaround a close radius and can occur atsubstantial distances from the anchoragezones. An empirical design method tocontrol this effect will be presented in asubsequent paper.12
CONCLUSIONS ANDRECOMMENDATIONS
General
At the inception of this study thecommon American practice for post-ten-sioned anchorage zone reinforcementdesign was for the structural designer tospecify tendon force and location and toallow the contractor to choose a post-tensioning system. Both contractor anddesigner then usually relied on thehardware supplier to furnish detailedadvice on the use of the system. Oftenthe supplier's knowledge was based onlimited tests, on practical experience(generally with enlarged cast-in-placeend blocks), and on the published workof such investigators as Guyon'' or Zie-linski and Rowe 13 who relied on theclassical bursting stress approach for thedesign of supplementary reinforcement.
Although these designs usuallyworked well for straight tendon appli-cations with little eccentricity, theywere insufficient to control anchoragezone cracking in some thin member ap-plications such as in precast segmentalbox girder bridge web sections. In theseapplications, the tendons were often notonly eccentric, but also highly inclinedin order to pick tip a portion of the deadload shear. Because of the highly pro-prietary nature of the industry, thosecompanies which did have experiencewith such problems were often reluctantto publish this knowledge in the publicliterature. American specifications suchas AASHTO and the ACI Building Codewere framed in very limited terms ofallowable bearing stresses, and did notreflect the effects of section aspect ratio,of tendon eccentricity, curvature, andinclination, nor of the effect of supple-mentary reinforcement.
This investigation provides a startingpoint for the practicing engineer to ad-dress many common thin web post-ten-sioning applications as well as a sepa-rate method to check and evaluate therecommendations of the hardware sup-plier. The results of this study reflect acomposite formed from three sources.These include physical tests of fortyquarter-scale microconcrete models,physical tests of nine full-scale proto-type concrete specimens designed toreplicate post-tensioning conditionsfound in thin web sections, and resultsof an extensive series of three-dimen-sional linear elastic finite element com-puter analyses.
The model test results were found tomatch the prototype behavior whenscaled properly through the use of thegeometric scale factor and the measuredsplit cylinder tensile strength of theconcrete.
Various reinforcing schemes (both ac-tive and passive) were investigated. Ex-perimental data from the prototype testsrevealed an interesting additional fail-ure mechanism due to "multistrand"
PCI JOtJRNAUJanuary-February 1984 103

P D - IB 5
D O ^' a
•0 a
o. 0 v . I. b . P r•
e .^
(a) UNSTRESSED TENDON
p D,p..b
9 o a
° , b '. p • ° ° LEDGE'S
^ O 1(b) TENDON AT STRESSING LOAD
LARGE RADIAL FORCES DUE TO
a I
a 4 * y
0.
o °
a p pD
•
(c) FAILURESIDE FACE RUPTURE ATPOINT OF SHARPESTCURVATURE
Fig. 26. Multistrand failure in a curved tendon.
11 FLATTENING OUT" OF TENDONBUNDLE INITIATE CRACKING INVICINITY OF SHARPEST CURVATURE
104

Fig. 27a. Failure due to multistrand effect in Specimen FS3B, at ultimate load 590 kips(2624 kN). Shown above: side face rupture at point of maximum curvature.

effects. Sections with significant tendoncurvature and with multiple strands inthe same duct generated large lateralsplitting forces at the point of minimumradius of curvature due to the flatteningout of the multiple strands within thecon fines of the duct.
In the test program and analytical in-vestigations, the scope was restricted tothe anchorage of single large tendons inan anchorage zone. Both studies shouldbe expanded to cover the practical caseof multiple tendons anchored in closeproximity.
Major Conclusions
The design recommendations result-ing from this study will he presented ina companion paper.'2
The results of this study indicate aradical departure from previous meth-ods of analyzing the anchorage zonecracking problem. Former solutionswere basically limited to anchors for aconcentric, straight tendon. For thegeneral range of variables investigated,the major conclusions are:
1. Design of anchorage zone rein-forcement using the bursting stress cri-terion is erroneous when the tendon isinclined or eccentric.
2. Bearing stresses as high as 2.5ffwere routinely achieved before ultimatefailure. Specifications limiting allow-able bearing stresses to less than f areoverly conservative and inappropriatefor controlling anchorage zone cracking.
3. While anchorage zone designbased upon the ACI Building CodeCommentary formula using the squareroot of relative bearing areas will beconservative tinder certain cir-cumstances, it cannot be relied upon tohe conservative when the tendon ishighly eccentric or inclined, or whenvery thin web sections are used.
4. A new failure theory which recog-nizes the complex role of the end facespalling stress in the vicinity of the an-chor as the trigger mechanism for an an-
chorage zone shear failure was con-firmed experimentally.
5. Tendon path cracks can occur atpoints well removed from the anchoragezone in sections where the tendon pro-file has significant curvature and multi-ple strand tendons are used. This is dueto the tendency for the bundle to flattenout within the confines of the duct, thuscreating lateral forces sufficiently highto cause not only cracking but side facerupture as well.
6. The failure mechanism for platetype anchors is:
(a) The large friction forces developedbeneath the anchor plate locally con-strain the lateral expansion of the con-crete due to Poisson's ratio effect.
(b) A complex, triaxial compressivestress state is set up which permits de-velopment of extremely high directbearing stresses (up to 3ff) beneath theplate.
(c) The confining lateral forces at theedge of the plate are reduced by thepresence ofthe spalling tensile stresses.
(d) At some load level which dependson the section and tendon geometry, theconfining stress is sufficiently reducedthat a shear failure occurs along theplane at approximately 45 deg, and thusthe shear crack propagates to form a 45-deg pyramidal "cone" beneath the an-chor.
(e) Simultaneous with the formation ofthe cone, a tendon path crack propagatesfrom the tip of the cone. The cone isthen forced into the anchorage zone set-ting up large lateral forces which even-tually produce a set of "upper andlower" diagonal cracks which typicallyform at the corners of the anchor andpropagate away from the tendon path atangles of approximately 45 deg.
(fl Increases in load above that re-quired for formation of the diagonalcracks lead to ultimate explosive failureof the side faces, bounded by the upperand lower diagonal cracks.
7. Anchor geometry can affect thecracking load. Tests using plate-, bell-,
106

and cone-type anchors indicate the fol-lowing factors should be applied to cal-culated cracking loads for plate anchors:
P late: 1.00 P,.,. plateBell: 1.08 P, r plateCone: 0.61 P,,. plateThe three anchor types are shown in
Fig. 4. The "cone" type anchor has stiffbearing walls in the conical section. Athin-walled transition trumpet on a plateanchor would not be classified as a"cone" type anchor.
These values are for sections withoutsupplementary anchorage zone rein-forcement. Ultimate loads for unrein-forced plate- and cone-type anchors oc-curred at loads only nominally above thecracking load. Unreinforced hell an-chors exhibited ultimate failure at loadsapproximately 25 percent above thosewhich cause cracking.
Tests of spirally reinforced plate andcone anchorages indicate nearly identi-cal factors were still applicable butapplied to ultimate loads. No tests weredone on spirally reinforced bell anchors.Since the bell action somewhat simu-lates the spiral action, it was concludedfurther confinement was redundant.
Reinforcement Conclusions
1, When using passive reinforcement,spirals exhibit much better performancethan standard orthogonal reinforcementboth for increasing cracking and ulti-mate loads, and for controlling crackwidths. Spiral reinforcement has theeffect of changing the cracking patternfrom a single tendon path crack to a se-ries of parallel cracks which exhibit areduction in the average crack width.The spiral advantage is greater for thin-ner web sections, making it the pre-fi:rred choice of passive reinforcement.
2. The ultimate load for anchorageswith spiral reinforcement is as much as45 to 60 percent higher than that for an-chorages with orthogonal reinforcement(bar grid) with ten times the reinforce-ment ratio of the spiral.
3. For a given volumetric percentageof spiral reinforcement, the spirals fabri-cated from smaller wires performedbetter than spirals fabricated from largerwires, This indicates that spirals shouldbe fabricated with as short a pitch dis-tance as possible while permitting ag-gregates to pass freely.
4. Within the range investigated, longspirals (2t to 2.5t in length affixed to theanchor, where t is the web width of theanchor zone) performed no better thanshort spirals.
5. With inclined, curved, multiplestrand tendons, careful attention mustbe paid to the possibility of crackingalong the tendon path at the point ofmaximum curvature. in most practicalapplications that point would he wellremoved from the anchorage zone, andfrom the influence of any short spiralreinforcement in the anchorage zone.Continuing anchorage zone reinforce-ment into the zone of maximum curva-ture is logical in some cases. However,calculations indicate that the requiredreinforcement ratio is usually muchsmaller than that required in the an-chorage zone. A secondary calculationmethod is presented in a subsequentpaper to design the additional rein-torcement required for curved tendonapplications.
6. Active reinforcement (lateralpost-tensioning) is the most efficientmeans of controlling anchorage zonecracking. A relatively small precompres-sion of 100 psi (690 kPa) across the an-chorage zone of a section with an in-clined, curved, multiple strand tendonraised the cracking load 33 percentabove that for an unreinforced section.The optimum location for the lateralprestress is as close to the loaded face aspossible.
Similitude Conclusions
1. The tensile strength of the micro-concrete used for constructing the mod-els was found to he substantially higher
PCI JOUR NAUJanuary-February 1984 107

than that for the corresponding proto-type concrete,
2. Cracking and ultimate loads mustbe normalized with respect to the indi-rect tensile strength (f,) when usingmodel results for prediction of crackingin corresponding prototype structures.
3. When adjusted for geometric scalefactor and split tensile strength, excel-lent reliability (±10 percent) can be ex-pected for model tests using straighttendons, including the effects of cover,eccentricity, and bearing area.
4. Specimens with inclined tendonscan also be accurately modeled; how-ever, careful attention must be made todetailing the model tendon whensharply curved multiple strand proto-type sections are to be modeled. Due tothe importance of multistrand effects infull-scale strictures, the model tendonshould be a precise scaled-down versionof the prototype tendon and duct sys-tem.
5. Crack patterns observed in proto-type specimens can be accurately re-produced in the models. However, crackwidths in the models (after adjustment
by the scale factor) were on the average40 percent smaller than those observedin the full-scale specimens,
6. As with the full-scale tests, theformation of upper and lower diagonalcracks around the anchor act as a visualindicator of the proximity of ultimatefailure. For unreinforced plate anchors acone of crushed concrete was observedbeneath the anchor at failure.
ACKNOWLEDGMENTThis paper is based on results of Re-
search Project 208 "Design Criteria forPost-Tensioned Anchorage ZoneBursting Stresses," conducted for theTexas Department of Highways andPublic Transportation in cooperationwith the Federal Highway Administra-tion by the University of Texas at AustinCenter for Transportation Research atthe Phil M. Ferguson Structural Engi-neering Laboratory. The contents of thispaper reflect the views of the authorsand do not necessarily reflect the viewsor policies of the sponsoring agencies.
REFERENCES
1. Stone, W. C., and Breen, J. E., "Analysisof Post-Tensioned Girder AnchorageZones," Research Report 208-1, Centertier Transportation Research, The Uni-versity of Texas at Austin, August 1980.
2. Breen, J. E., Cooper, R. L., and Calla-way, T. M., "Minimizing ConstructionProblems in Segmentally Precast BoxGirder Bridges," Research Report No.121-6F, Center for Highway Research,The University of Texas at Austin, Au-gust 1975.
3. Dilger, W. H., and Ghali, A., "RemedialMeasures for Cracked Webs of Pre-stressed Concrete Bridges," PCI JOUR-NAL, V. 19, No, 4, July-August 1974, pp.76-85.
4. AASHTO, Standard Specifications forHighway Bridges, 12th Edition, Ameri-
can Association of State Highway andTransportation Officials, Washington,D.C., 1977.
5. ACI Committee 318, "Building CodeRequirements for Reinforced Concreteand Commentary (ACI 318-77)," Ameri-can Concrete Institute, Detroit, Michi-gan,1977.
6. Rhodes, B., and Turner, F. H., "Designof End Blocks for Post-Tensioned Ca-bles," Concrete, December 1962.
7. Stone, W. C., Paes-Filho, W., and Breen,J. E., "Behavior of Post-Tensioned Gir-der Anchorage Zones," Research Report208-2, Center for Transportation Re-search, The University of Texas at Aus-tin, August 1980.
8. CEB-FIP Committee, Model Code forConcrete Structures, Comit@ Euro-In-
106

ternational du Beton and the FederationInternationale de ]a Precontrainte, En-glish Translation, 1978.
9. AC! Committee 444, "Models of Con-crete Structures—State-of-the-Art," Con-crete Internatumal, V. 1, No. 1, January1979, pp. 77-95.
10. Guyon, Y., The Limit State Design ofPrestressed Concrete, V. II: The Designof the Member, Translated by F. H.Turner, John Wiley & Sons, New York,1974.
11. Ruseh, H., Grasser, E., and Rao, P. S.,"Fundamentals of Design for UniaxialStress Conditions in Concrete Mem-
bers," Munich, August 1961. (Translationfrom German, October 1963, by J. V.McMahon and J. E. Breen, University ofTexas at Austin.)
12. Stone, W. C., and Breen, J. E., "Design ofPost-Tensioned Girder AnchorageZones" (to be published in March-April1984 PCI JOURNAL).
13. Zielinski, T., and Rowe, R. E., "An In-vestigation of the Stress Distribution inthe Anchorage Zones of Post-TensionedConcrete Members,"Cement and Con-crete Association, Research Report No. 9,London, September 1960.
APPENDIX — NOTATION
2a = section height, in.2a' = width of anchor plate (assumed
square), in.A areaA, = bearing area of anchor plate, sq
in.AQ = area of anchorage surface con-
centric with and geometricallysimilar to anchor plate, sq in.
A, = area of supplementary rein-forcement which crosses ten-don path perpendicularly in an-chorage zone of length 6a' fromloaded face
CIt = ratio of cover concrete to sectionthickness
ds = elemental lengthe = tendon eccentricity, in.f = Stress
I; = allowable bearing stress, ksi
= compressive strength of con-crete at time of stressing, ksi(except when used as f,'; whenunits must he in psi)
}ca = CEB effective concrete com-pressive strength
f,^I = specified tensile strength ofpost-tensioning tendon, ksi
J;P = split cylinder tensile strength,
ksiIs = transverse stress
h = heightLPT = lateral post-tensioningM = momentN = summation of all normal force
components over elementlength ds
p = normal load on tendon duct perunit length (kips per in.)
P = post-tensioning load, kips= allowable post-tensioning load,
kipsP,, = cracking load, kipsPu= ultimate load, kipsR = radius of curvature at a given
point, in.t = section thickness, in.; web width
of anchor zoneTb= bursting tensile stressT, = spalling tensile stressx = vertical directionz = horizontal directionexb = bursting straine,.e = spalling strainO = angle of tendon inclination, de-
greescr,, = normal stress due to post-ten-
sioning loadCrib = bursting stress
= spalling stressr = shear stress
PCI JOURNALIJanuary-February 1984 109