beginnings of a learning organization
TRANSCRIPT

Beginnings of a Learning OrganizationDriving change through collaboration, productive inquiry, and information sharing
Michael Rothlisberger

What is holding us back?
Sea of data What is helpful?
“Go Chair better”In what ways? With what information? With what resources?
What is important? Why? Values of institution and units and individuals
Not convincing, but collaborating
Ownership vs. obedience
Supporting How?
Common language and focus
All on the same page

Now
NextFuture
Collaboration
Systems for
Sharing
Inquiry and
Dialogue
Learning opportunities
Connect to the
environment
Strategic Leadership
Collective Vision
SSU’s Learning Organization PathwayAdapted from: Marsick & Watkins (2003)

Inquiry and
DialogueSystems
for Sharing
Collaboration
Now
NextFuture
SSU’s Learning Organization PathwayAdapted from: Marsick & Watkins (2003)
Collaboration
Systems for
Sharing
Inquiry and
Dialogue
Learning opportunities
Connect to the
environment
Strategic Leadership
Collective Vision

Systems for
Sharing
Inquiry and
Dialogue
Collaboration
• Does not need to be high-tech• Clear, common language• Focused on goals• Continually refined by learning of organization
• We aren’t pushing a prescription• Create mechanisms for discussion, sharing, and refinement of shared information• Provoke more questions• Get to what we don’t know, but need to
• Get people involved – we aren’t convincing a solution, but working together to find one• Different in every context – encourage working together and in sub-groups• Consensus is secondary to active involvement

Larger Project
Spring Waitlist Dashboard
Baseline Latest Baseline Latest Baseline Latest Baseline LatestHSCollege # waitlist # waitlist as % enroll as % enroll # waitlist # waitlist as % enroll as % enrollHSAcademic Affairs AAF 0 0 0.0% 0.0% 0 0 0.0% 0.0%
HSCollege of Arch and Cnst Mgt ARCH 367 109 19.5% 4.8% 223 35 11.9% 1.5%
HSCollege of the Arts ART 513 277 7.7% 3.4% 321 182 4.8% 2.2%
SCColes College of Business BUS 1,755 1,179 8.9% 5.0% 255 265 1.3% 1.1%
HSCollege of Comp & Soft Eng CSE 300 123 4.0% 1.4% 88 32 1.2% 0.4%
HSBagwell College of Education EDU 107 69 2.2% 1.2% 27 18 0.6% 0.3%
HSCollege of Eng and Eng Tech EET 702 300 7.5% 2.9% 377 78 4.0% 0.7%
HSCollege of Health & Hum Ser HHS 106 48 2.0% 0.8% 95 20 1.7% 0.3%
Improving HSHonors College HON 32 34 11.9% 10.5% 32 34 11.9% 10.5%
Same College of Hum & Soc Sci HSS 3,157 2,432 8.2% 5.4% 1,671 1,396 4.3% 3.1%
Worsening College of Science & Math SCM 3,321 2,439 11.7% 7.9% 1,885 1,288 6.7% 4.2%
University College UCL 47 55 3.2% 3.1% 26 28 1.8% 1.6%
HS 10,407 7,065 8.4% 4.9% 5,000 3,376 4.0% 2.4%
Last updated: 1/20/2020 10:50am
Total Waitlist (seats) Net Waitlist (seats)
College
AAF
ARCH
ART
BUS
CSE
EDU
EET
HHS
HON
HSS
SCM
UCL
Campus
Kennesaw
Marietta
Online
Other
1
0
-1
1,370
Number of Sections
with Waitlist311
Number of Courses
with Waitlist (net)
7,065
Number of Seats
Waitlisted
3,376
Number of Seats
Waitlisted (net)
• Assembled through collaboration• Dashboard is output, not solution;
frames other activities• Commonly understood metrics• Everyone using the same measures• Provides focus on targets

Larger Project
Student Success Pool Dashboard
Scorecard for FY2020CollegeCollege Total AwardARTCollege of the Arts 11.11 25.00 20.00 19.44 75.56 220,000$ CSECollege of Computing & Software Engineering 15.56 13.89 26.67 16.67 72.78 310,000$ UCLUniversity College 20.00 22.22 30.00 0.00 72.22 180,000$ HSSCollege of Humanities & Social Sciences 4.44 16.67 13.33 22.22 56.67 290,000$ HHSWellstar College of Health & Human Services 17.78 19.44 6.67 2.78 46.67 140,000$ ACMCollege of Architecture & Construction Mgmt 2.22 2.78 16.67 25.00 46.67 70,000$ BUSColes College of Business 6.67 11.11 10.00 8.33 36.11 120,000$ EETCollege of Engineering & Engineering Technology 0.00 5.56 23.33 5.56 34.44 80,000$ SCMCollege of Science & Math 8.89 8.33 0.00 13.89 31.11 50,000$ EDUBagwell College of Education 13.33 0.00 3.33 11.11 27.78 40,000$ Grand Total 1,500,000$
Total20% 25% 30% 25%DFW Returned Degrees Teaching
Fiscal Year
19
20
21
22College
ACM
ART
BUS
CSE
EDU
EET
HHS
HSS
SCM
UCL
0.00%
5.00%
10.00%
15.00%
20.00%
25.00%
30.00%
EDU HHS ACM EET ART BUS UCL HSS CSE SCM
DFW Rates
74.00%
76.00%
78.00%
80.00%
82.00%
84.00%
86.00%
88.00%
EDU ACM EET HSS BUS ART UCL CSE SCM HHS
Returning Students
0 200 400 600 800 1,000 1,200 1,400 1,600
HSS
BUS
EDU
HHS
EET
SCM
CSE
UCL
ART
ACM
Degrees Conferred
0 100 200 300 400 500 600 700 800
ART
EDU
ACM
UCL
HHS
EET
HSS
BUS
SCM
CSE
Weighted Credit Hours per Full-Time Faculty
Top
Middle
Bottom
Score compared to last year
75.5664.4464.4448.3343.3342.7840.5638.8930.5629.44
FY2016/17 FY2018 • Assembled through collaboration
• Dashboard is output, not solution; frames other activities
• Commonly understood metrics
• Everyone using the same measures
• Provides focus on targets

Simple but pertinent information
• Frequently updated• Everyone on the same page• Provides information that can inform behavior• Enough detail for action, enough overview for understanding• May have had access to the information before, but now it is succinct,
relevant, timely and in one place
Row Labels Full Name Max Capacity Seats Filled Seats Available Waitlisted Seats Net Available Sum of %FullCLASS 10732 6769 3963 269 4066 63.07%
ENGL 1102 572 566 6 53 -19 98.95%PSYC 1101 80 80 0 15 -15 100.00%AFRS 1501 150 153 -3 76 -13 102.00%POLS 1101 360 358 2 15 -13 99.44%COMM 2810 30 30 0 9 -9 100.00%HIST 2112 130 129 1 9 -8 99.23%ENGL 2222 150 149 1 9 -8 99.33%CRJU 1101 40 40 0 8 -8 100.00%HIST 2111 120 120 0 5 -5 100.00%PHIL 2030 25 25 0 4 -4 100.00%SOCI 3360 30 30 0 4 -4 100.00%POLS 2401 49 49 0 3 -3 100.00%SOCI 1160 60 60 0 3 -3 100.00%PSYC 2103 40 40 0 3 -3 100.00%CRJU 4301 40 40 0 2 -2 100.00%CRJU 3121 40 40 0 2 -2 100.00%

Presented around a theme of focus that is context specific
• Addresses focus at hand• But conversation must also consider things outside of the measures
• Used as a tool to frame discussion
• Avoid “complete representativeness”
Production per Faculty Member # Sections #Course Credit Hours # Seats #Student Credit Hours Average Class SizeFictional College
Department 1 4.18 12.03 78.33 230.63 19.18Department 2 3.84 11.37 64.11 189.05 16.63Department 3 3.63 9.19 45.63 131.88 14.35Department 4 4.41 11.31 70.25 190.38 16.83Department 5 3.94 11.44 76.83 218.06 19.05Department 6 4.26 12.52 124.00 363.48 29.04
College Total 4.11 11.51 79.34 228.67 19.86

Regular communication, support, and check-ins

Savannah State UniversityDivision of University Advancement
Phillip AdamsVice President
Savannah State University
Dashboards, Data and Dollars:A Process for Strategic Resource Alignment
Sametria R. McFall, PhD, MPAAssistant Vice President
Academic Affairs
SSU is a unit of the University System of Georgia

Enrollment and the Value Proposition
Rising Costs
Greater Options
Government Mandated Policy Changes
Differently Prepared Students/First Generation Students
Larger Institutions
Infrastructure
Dashboards, Data and Dollars:A Process for Strategic Resource Alignment
Threats to Historically Black Colleges and Universities

Dashboards, Data and Dollars:A Process for Strategic Resource Alignment
Threats to Strategic Processes
Too Much Data/Information
Ineffective Communication
Self Preservation Mindset
Common GoalsDifferent Strategies Fatigue

ØEstablished in 1890ØThe oldest public historically black college or university in the
state of GeorgiaØThe oldest institution of higher learning in the city of SavannahØDeveloped to educate Black citizens during a time of pervasive
discriminationØIncreasingly diverse ØTripled in building/space acquisition since its inceptionØUpward trajectory through 2016ØRecent decline in enrollment
Dashboards, Data and Dollars:A Process for Strategic Resource Alignment
Savannah State University Then and Now

Dashboards, Data and Dollars:A Process for Strategic Resource Alignment
2199 23282566
2779 28113123
32803097
34623832
4061
4552 45824772 4915 4800
4955
41923850
3488
0
1000
2000
3000
4000
5000
6000
2000 2001 2002 2003 2004 2005 2006 2007 2008 2009 2010 2011 2012 2013 2014 2015 2016 2017 2018 2019
Enrollment by Term
Enrolled Linear (Enrolled)

Dashboards, Data and Dollars:A Process for Strategic Resource Alignment
Why Focus on Data?
Fiscal Climate
Alignment of Resources to Institutional Priorities
Focus on Student Success
SACSCOC Reaffirmation & Accreditation
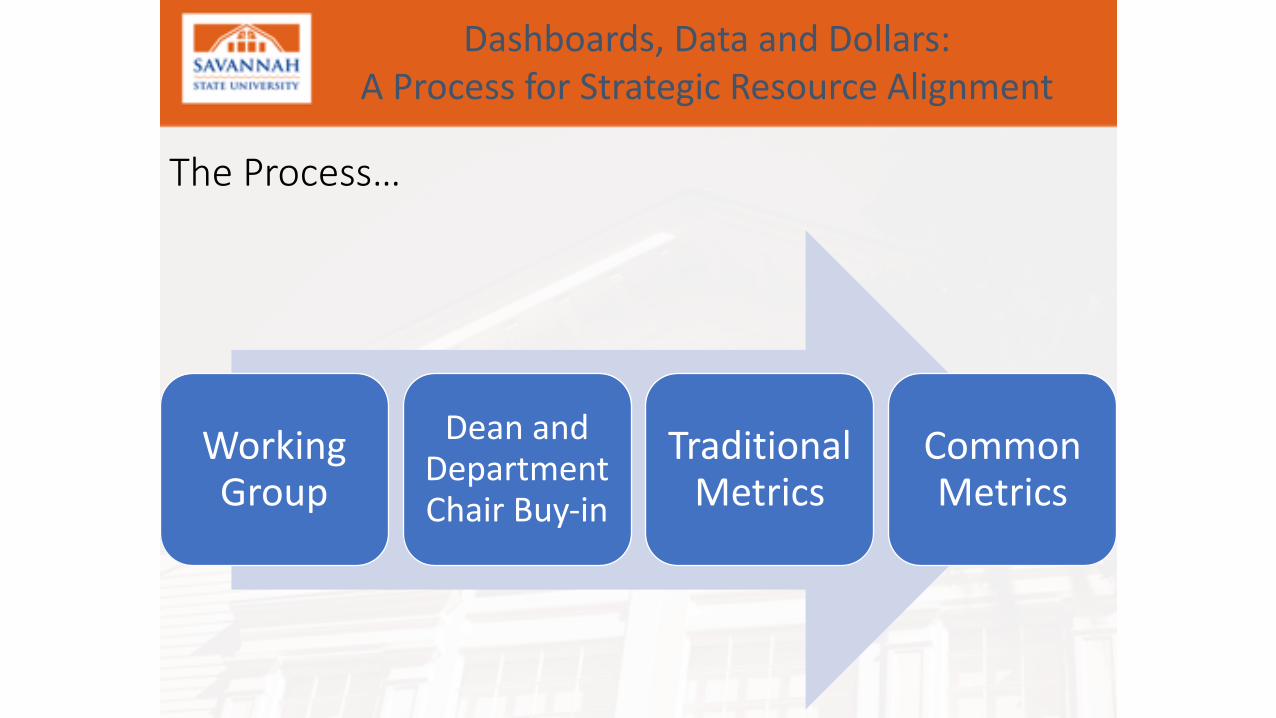
Working Group
Dean and Department Chair Buy-in
Traditional Metrics
Common Metrics
Dashboards, Data and Dollars:A Process for Strategic Resource Alignment
The Process…

• Number of Declared Majors• Number of FT and PT faculty per Department• Student to FT Faculty Ratios• Faculty Qualifications
• Rank, Tenure Status, Terminal Degree, etc.• Faculty Productivity
• Number of Courses per Faculty & Semester Credit Hours Generated• Number of Degrees Conferred• DFW Rates• Retention/Progression of Majors• Number of Under-Enrolled Courses• Number of Credit Hours Required for Degree Program• Waitlist for Courses
Dashboards, Data and Dollars:A Process for Strategic Resource Alignment
The Process…

• Number of Declared Majors• Number of FT and PT faculty per Department• Student to FT Faculty Ratios• Faculty Qualifications
• Rank, Tenure Status, Terminal Degree, etc.• Faculty Productivity• Number of Degrees Conferred• DFW Rates• Retention/Progression of Majors• Number of Under-Enrolled Courses• Number of Credit Hours Required for Degree Program• Waitlist for Courses
Dashboards, Data and Dollars:A Process for Strategic Resource Alignment
The Process…

Dashboards, Data and Dollars:A Process for Strategic Resource Alignment
The Process…*All figures are per FT Faculty per semester
Row Labels # Sections #Course Credit Hours # Seats #Student Credit Hours Average Class SizeCLASS
English, Languages and Cultures 4.18 12.03 78.33 230.63 19.18Political Science and Public Affairs 3.84 11.37 64.11 189.05 16.63Social Work 3.63 9.19 45.63 131.88 14.35Fine Arts, Humanities and Wellness 4.41 11.31 70.25 190.38 16.83Journalism and Mass Communications 3.94 11.44 76.83 218.06 19.05Social and Behavioral Sciences 4.26 12.52 124.00 363.48 29.04
CLASS Total 4.11 11.51 79.34 228.67 19.86COBA
ACCT, CIS & GLIB 3.47 10.18 98.53 295.35 29.02Business 3.95 11.58 121.05 356.89 30.82
COBA Total 3.72 10.92 110.42 327.83 30.03COST
Chemistry & Forensic Sciences 3.82 8.27 87.64 200.73 24.26Marine & Environmental Sciences 3.21 9.79 49.50 155.86 15.93Mathematics 4.27 12.69 88.12 261.85 20.63Biology 4.75 9.19 143.81 311.25 33.88Engineering Technology 3.50 11.83 69.93 234.87 19.85
COST Total 3.90 10.66 86.21 235.48 22.10COTE 4.14 12.43 38.00 114.00 9.17Grand Total 3.99 11.16 84.53 240.23 21.53
WARNING! To use this slicer, you must refresh the pivot table after each selection (under the data tab)

• Research/Contracts and Grants• Course Releases• DFWI Rates• Waitlists• Qualitative Measures• Number of Declared Majors• Student to FT Faculty Ratios• Faculty Productivity
• Number of Courses per Faculty & Semester Credit Hours Generated• Retention/Progression of Majors
Dashboards, Data and Dollars:A Process for Strategic Resource Alignment
Additional Metrics
The Process…
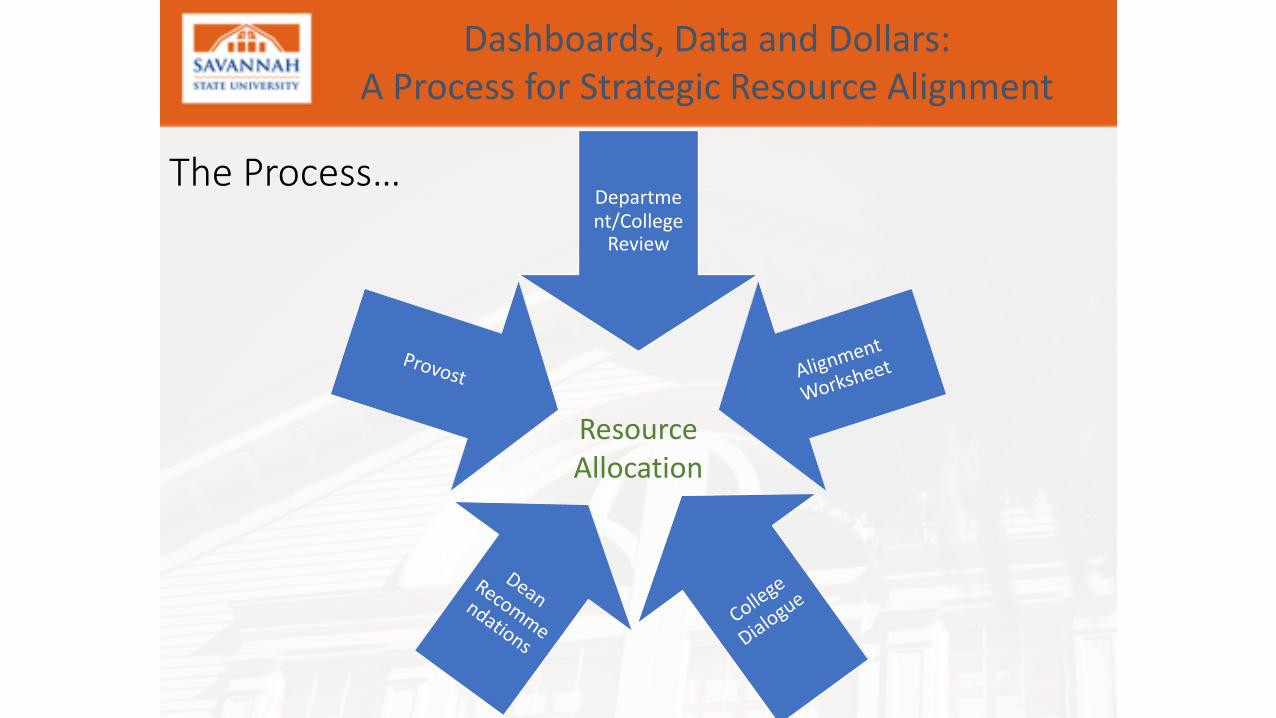
Department/College
Review
Alignment
Worksheet
College
DialogueDean
Recommendations
Provost
Dashboards, Data and Dollars:A Process for Strategic Resource Alignment
The Process…
Resource Allocation

Common Process
Increased
Engagement
Promote
Effective
Programs
Improve Student
Retention
Improve the Decision making Process
Dashboards, Data and Dollars:A Process for Strategic Resource Alignment
Outcomes…
Transformation

Dashboards, Data and Dollars:A Process for Strategic Resource Alignment
Brynjolfsson, Erik, and Kristina McElheran. 2016. "The Rapid Adoption of Data-Driven Decision-Making." American Economic Review, 106 (5): 133-39.
Fong, Jim and Caldwell, Danielle. 2016. Leading by Gut or by Data: The Data Driven State of Higher Ed Decision Making. Helix Education, 1-12.
Marsick, V. J., & Watkins, K. E. (2003). Demonstrating the Value of an Organization’s Learning Culture: The Dimensions of the Learning Organization Questionnaire. Advances in Developing Human Resources, 5(2), 132–151.
Thomas, Eric (2016). A Threat to HBCUs – Race and Higher Education in the South. Diverse Issues in Higher Education, Retrieved from https://diverseeducation.com/article/84459/