beginning teachers’ engagement with … of the impact of the california formative assessment and...
TRANSCRIPT
Marnie ThompsonLaura Goe
Pamela Paek Eva Ponte
Beginning Teachers’ Engagement with BTSA/CFASST
Study of the Impact of the California Formative Assessment and Support System for Teachers
August 2004
CFASST Report 1 ETS RR-04-30
Study of the Impact of the California Formative Assessment and Support System for Teachers
Report 1
Beginning Teachers’ Engagement with BTSA/CFASST
Submitted to the California Commission on Teacher Credentialing, April 2004
Revised and Reissued as an ETS Research Report, August 2004
Marnie Thompson
Laura Goe
Pamela Paek
Eva Ponte

Copyright © 2004. Educational Testing Service and the California Commission on Teacher Credentialing.

Acknowledgements
The evaluation that sits at the core of this report could not have been designed or completed without the significant substantive and practical contributions of the field research team who conducted the classroom-based case studies: Michael Foster, Jennifer Goldstein, and Phyllis Levy. Jennifer Goldstein, in particular, made important contributions to the design and content of the survey described in this report.
We also wish to thank the staff of the California Commission on Teacher Credentialing, especially Amy Jackson and Teri Clark, for their help throughout the course of the evaluation.
Table of Contents List of Tables and Figures............................................................................................................... ii
Executive Summary ....................................................................................................................... iii
Introduction..................................................................................................................................... 1
Overview of BTSA/CFASST and the IAIPSL Study..................................................................... 2
BTSA/CFASST .......................................................................................................................... 2
The IAIPSL Study Design .......................................................................................................... 2
Conceptual Model of BTSA/CFASST............................................................................................ 3
The BTSA/CFASST Survey........................................................................................................... 4
Survey Objectives ....................................................................................................................... 4
Construction of the Survey ......................................................................................................... 4
Theoretical Dimensions and Associated Survey Items............................................................... 5
CFASST Engagement Score....................................................................................................... 8
Selecting the Survey Sample ...................................................................................................... 9
Data Collection ......................................................................................................................... 10
Characteristics of the Survey Sample ....................................................................................... 11
Survey Results .......................................................................................................................... 12
Interviews with BTSA Graduates ................................................................................................. 17
Purpose of the Interviews ......................................................................................................... 17
Selecting the Interview Sample ................................................................................................ 17
Data Collection and Analysis ................................................................................................... 17
Characteristics of the Interview Sample ................................................................................... 18
Does the Interview Data Confirm the CFASST Engagement Score? ...................................... 20
Insights About BTSA/CFASST from the Interviews ............................................................... 20
Conclusions................................................................................................................................... 37
References..................................................................................................................................... 40
Appendices.................................................................................................................................... 43
Appendix 1: Conceptual Model for BTSA/CFASST .............................................................. 44
Appendix 2: Survey Form........................................................................................................ 45
Appendix 3: Dimension, Sub-Dimension, and Item Scoring .................................................. 55
Appendix 4: BTSA Programs Sampled for the Survey ........................................................... 58
Appendix 5: Telephone Interview Protocol............................................................................. 60
IAIPSL Study, Report 1: Beginning Teachers’ Engagement with BTSA/CFASST i
List of Tables and Figures Figure 1. IAIPSL Reports. .............................................................................................................. 1
Table 1. Characteristics of the Survey Sample Schools and California Elementary Schools ..... 11
Table 2. Characteristics of the Survey Sample Teachers and California Elementary Teachers.. 12
Table 3. Survey Sample Teachers’ BTSA/CFASST Experiences and Relationships with Support Providers, Reported as Proportion of Survey Respondents............................ 13
Table 4. Percentage Agreement with Support Providers’ Help with Improving Specific Aspects of Teaching..................................................................................................... 15
Table 5. CFASST Engagement Level.......................................................................................... 16
Table 6. Distribution of Interview Sample Across Low, Middle, and High Engagement CFASST Levels ........................................................................................................... 17
Table 7. Characteristics of Interview Sample Schools and California Elementary Schools ....... 18
Table 8. Characteristics of the Interview Sample Teachers and California Elementary Teachers ....................................................................................................................... 19
Table 9. Multiple Regression Analysis for Variables Predicting Teachers’ CFASST Engagement Score from Phone Interview Data (N = 64) ............................................ 20
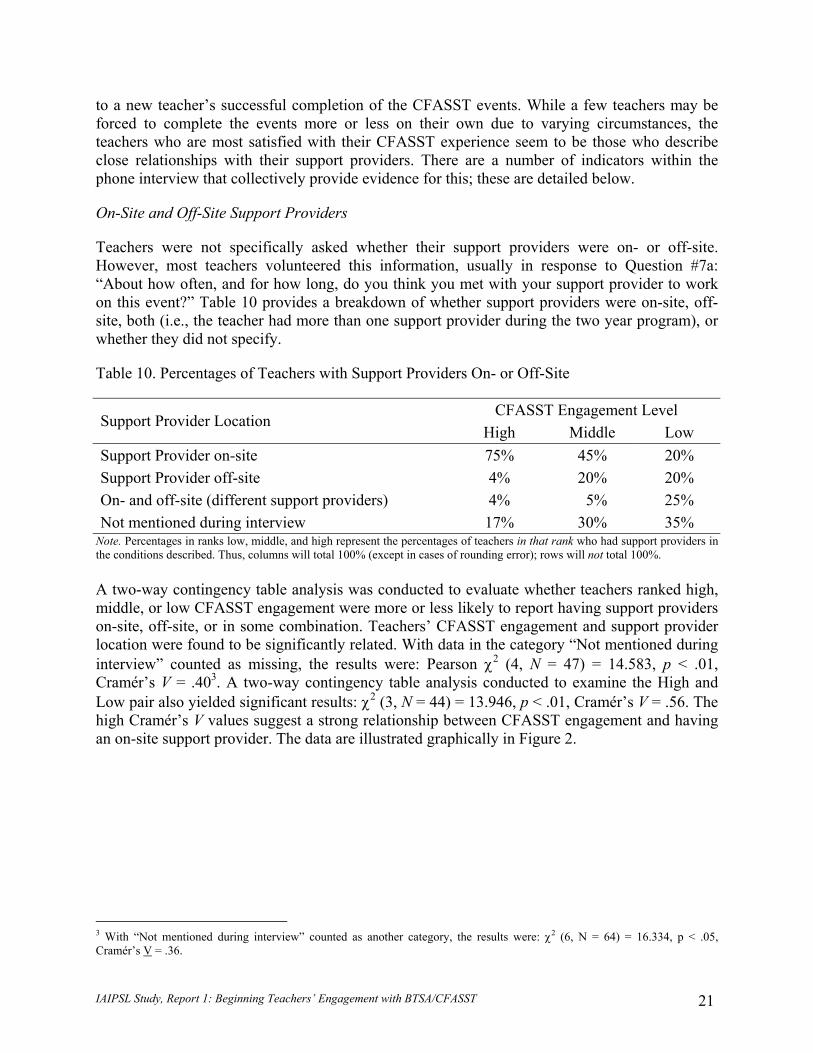
Table 10. Percentages of Teachers with Support Providers On- or Off-Site................................ 21
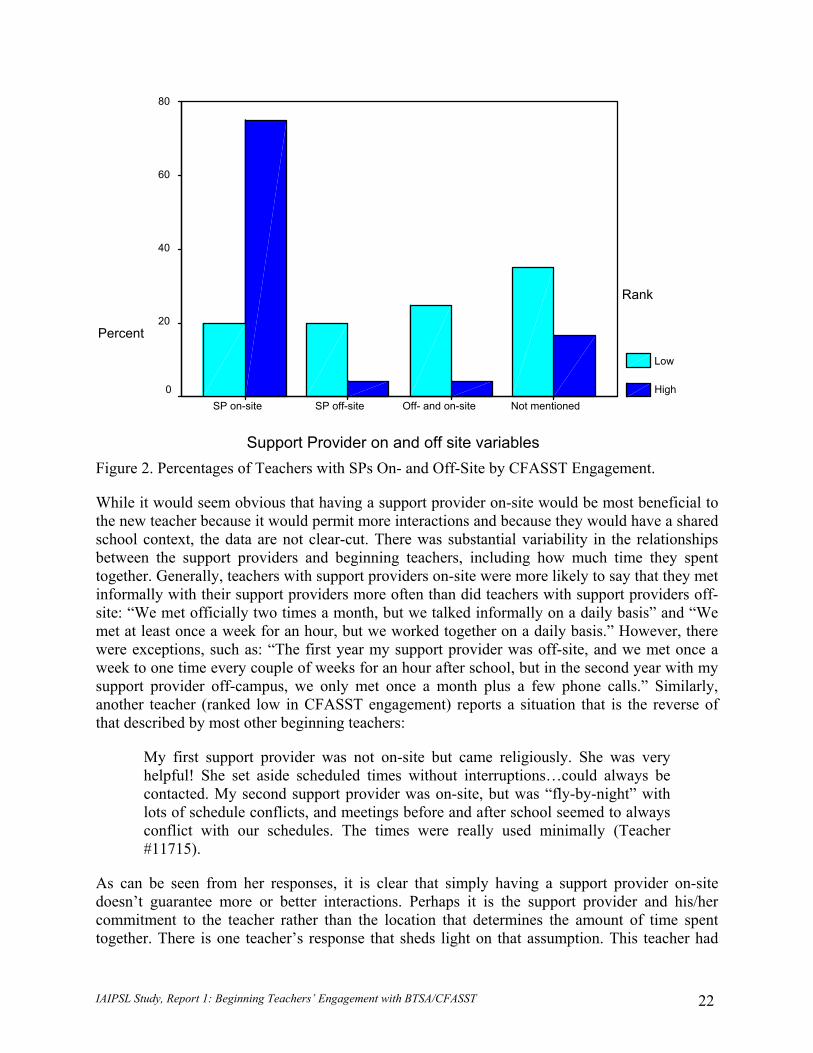
Figure 2. Percentages of Teachers with SPs On- and Off-Site by CFASST Engagement. ......... 22
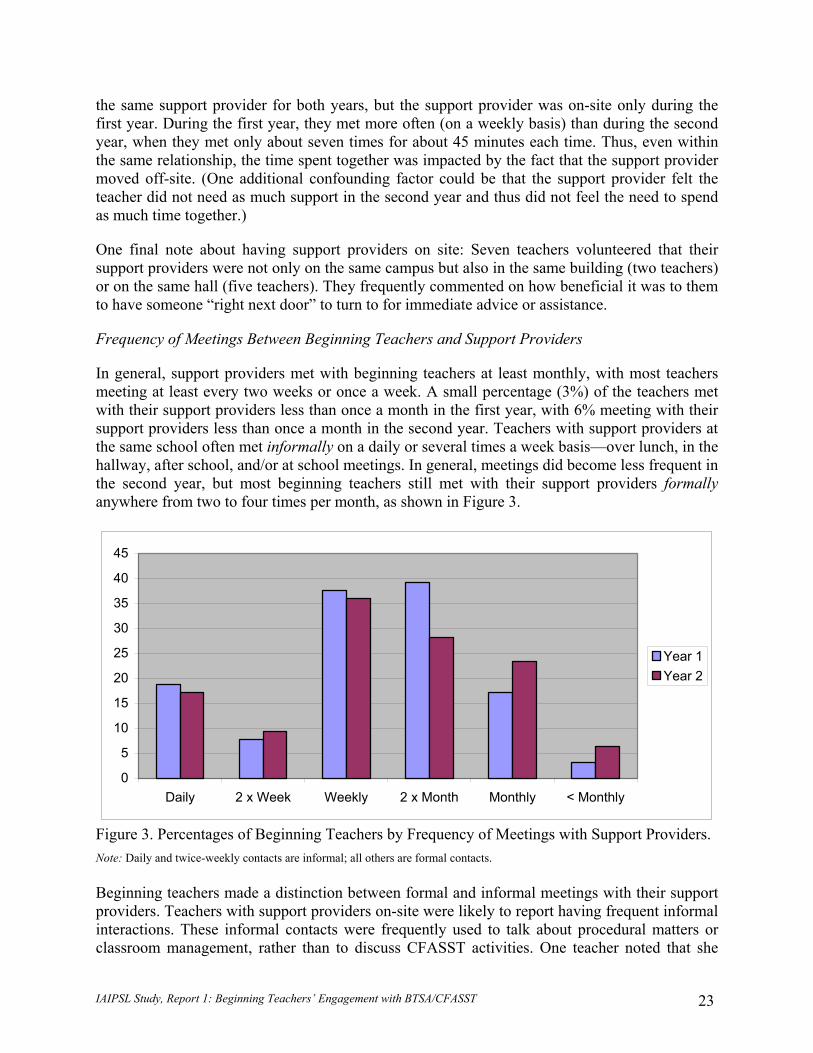
Figure 3. Percentages of Beginning Teachers by Frequency of Meetings with Support Providers. ..................................................................................................................... 23
Table 11. Monthly Time Support Providers and Beginning Teachers Spent Together in Formal Meetings....................................................................................................................... 24
Table 12. Topics Discussed by Support Providers and Beginning Teachers ............................... 27
Figure 4. Percentage of Each Event Completed by 64 Participants in Phone Interviews. .......... 28
Table 13. Group Means for Event Completion—Year 1.............................................................. 29
Table 14. Group Means for Event Completion—Year 2.............................................................. 29
Table 15. Inquiry Events from CFASST Years 1 and 2 ............................................................... 30
Table 16. Teachers’ Understanding of Differentiation ................................................................. 33
IAIPSL Study, Report 1: Beginning Teachers’ Engagement with BTSA/CFASST ii
Executive Summary This report is the first of four that stem from a study of The Impact of Approved Induction Programs on Student Learning (IAIPSL), conducted by Educational Testing Service (ETS) and funded by the California Commission on Teacher Credentialing (CCTC). The purpose of the study is to investigate the implementation and impact of the California Formative Assessment and Support System for Teachers (CFASST), within the context of the Beginning Teacher Support and Assessment program (BTSA). This first report focuses on what we have learned about how BTSA/CFASST is being implemented and experienced at the level of the beginning teacher. Because BTSA/CFASST programs vary widely in implementation, and because beginning teachers vary in the degree to which they engage with the learning opportunities made available, a first step in the study is to gauge individual teachers’ engagement with the program. A conceptual model that focuses on the beginning teacher/support provider relationship, context, and activities within BTSA/CFASST was developed by ETS researchers and BTSA program staff. The model is made up of four dimensions: 1) Support for BTSA/CFASST; 2) Support Provider Availability/Access; 3) Rapport Between Support Provider and Beginning Teacher; and 4) Substantive Focus on Teaching and Learning. This conceptual model guided the construction of instruments used to gather information from beginning teachers in multiple methods: surveys, telephone interviews, classroom observations, on-site interviews, and student test scores. This report presents and analyzes quantitative and qualitative findings from a written questionnaire and follow-up telephone interviews with BTSA/CFASST “graduates.” Using a variety of program quality measures, 78 BTSA programs were identified for survey research. Within these programs, 1,125 third-year BTSA “graduates” who teach in grades 3-5 were asked to complete surveys concerning their BTSA and CFASST experiences. Responses were received from 287 teachers from 107 school districts affiliated with 78 BTSA programs. Survey results were used to calculate a “CFASST engagement score” based on the four dimensions named above. Respondents were classified into high, middle, or low engagement CFASST levels based on these scores. Subsequently, a sub-sample of 64 teachers, drawn from the extremes of the CFASST engagement score scale, were interviewed to verify the reliability and validity of the survey data, to provide more nuanced information about their experiences in the program, and to recruit a sample of teachers for case studies.
The survey sample was found to be consistent with its statewide counterpart with respect to the characteristics of the schools the teachers work in. Findings from the survey indicate that most teachers had some form of orientation (all but 5%) and a support provider (except for 7% of teachers the first year and 3% the second year; numbers that, though low, represent a challenge to the core of the BTSA experience). Just over half of the teachers said that their principals were at least generally aware of and somewhat supportive of BTSA/CFASST. This means that almost half the teachers felt their principals were unaware or unsupportive. The majority of teachers (more than 70%) thought that their support providers were “warm and supportive,” and tended to trust them to the point of feeling comfortable enough to “share everything” with them. A majority of teachers felt they were well-matched to their support providers on multiple dimensions (personality and experience with teaching similar subject matter, grade levels, and students). Three-fifths of beginning teachers had support providers who were located in the same
IAIPSL Study, Report 1: Beginning Teachers’ Engagement with BTSA/CFASST iii
school, meaning that two-fifths had remote support providers. There was high variability in terms of the frequency of meetings between the beginning teachers and their support providers, ranging from less than once a month to more than once a week. For half the beginning teachers, meetings with their support providers lasted between 30 minutes and an hour, with another third saying that their meetings lasted for longer than an hour. For most teachers, the primary focus of the meetings was on emotional support, with instructional support and support for managing student behavior coming just behind. A large majority of teachers reported that they improved in specific aspects of teaching through their support provider’s help. About half of the teachers reported completing all the CFASST events, with others completing several, a few, or none.
Interview data confirmed these findings and also revealed that having a support provider was often identified as one of the best, if not the best part of being in BTSA. Interview data also indicated a strong relationship between CFASST engagement and having an on-site support provider, although the reasons for that relationship were not clear. The interview data also gave voice to teacher complaints about the program, the primary one being the large amount of paperwork required. A related complaint concerned the repetitive and time-consuming nature of the program. Findings from a cross-analysis of the survey and interview data confirmed the levels generated by the CFASST engagement model.
IAIPSL Study, Report 1: Beginning Teachers’ Engagement with BTSA/CFASST iv
Introduction This report is the first of four that stem from a study of The Impact of Approved Induction Programs on Student Learning (IAIPSL), conducted by Educational Testing Service (ETS) and funded by the California Commission on Teacher Credentialing (CCTC). The IAIPSL study began in July 2002 and continued through April 2004. The purpose of the study is to investigate the implementation and impact of the California Formative Assessment and Support System for Teachers (CFASST), within the context of the Beginning Teacher Support and Assessment program (BTSA)1. The study addresses three research questions:
• What is the impact of BTSA/CFASST on the teaching effectiveness of beginning teachers who participate in the program?
• What is the impact of BTSA/CFASST on the learning of the students of beginning teachers who participate in the program?
• What are the features of successful BTSA/CFASST programs that make them more effective in impacting beginning teachers’ growth as teachers?
In addition, the IAIPSL study provides the grist for a “meta-evaluation” in which the study is examined for insights into the processes and validity of conducting evaluation research on statewide induction programs such as BTSA/CFASST.
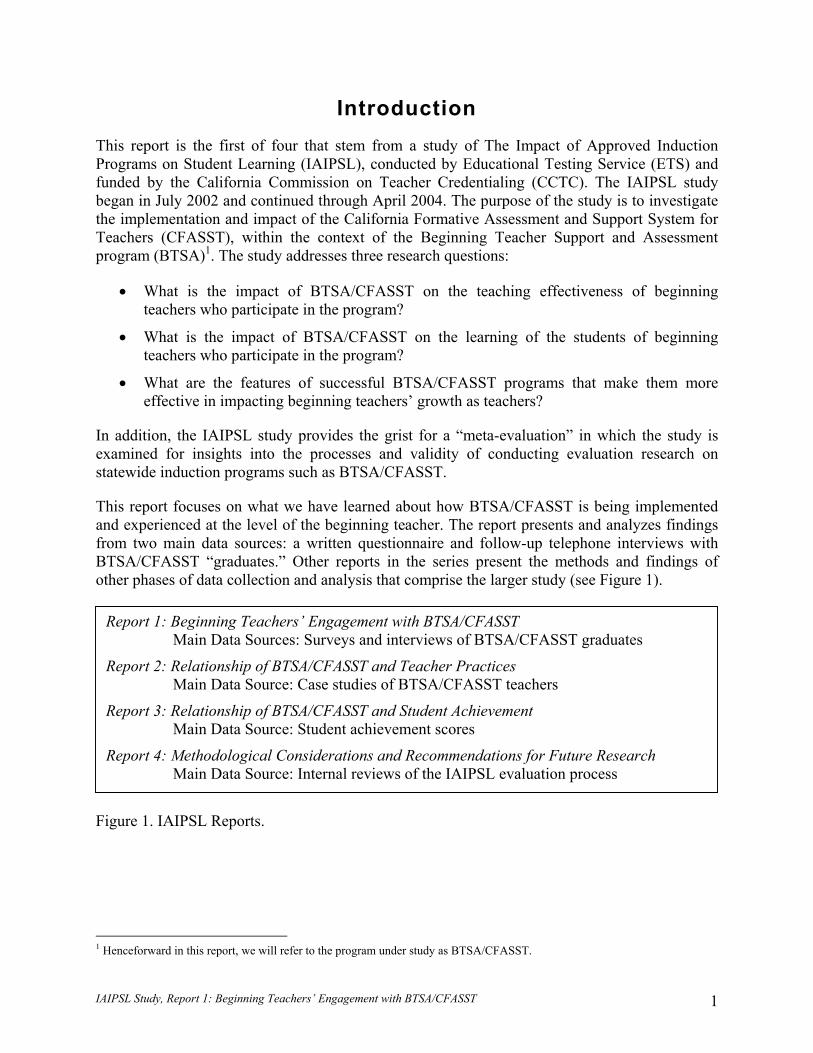
This report focuses on what we have learned about how BTSA/CFASST is being implemented and experienced at the level of the beginning teacher. The report presents and analyzes findings from two main data sources: a written questionnaire and follow-up telephone interviews with BTSA/CFASST “graduates.” Other reports in the series present the methods and findings of other phases of data collection and analysis that comprise the larger study (see Figure 1).
F
I
1
Report 1: Beginning Teachers’ Engagement with BTSA/CFASST Main Data Sources: Surveys and interviews of BTSA/CFASST graduates
Report 2: Relationship of BTSA/CFASST and Teacher Practices Main Data Source: Case studies of BTSA/CFASST teachers
Report 3: Relationship of BTSA/CFASST and Student Achievement Main Data Source: Student achievement scores
Report 4: Methodological Considerations and Recommendations for Future Research Main Data Source: Internal reviews of the IAIPSL evaluation process
igure 1. IAIPSL Reports.
AIPSL Study, Report 1: Beginning Teachers’ Engagement with BTSA/CFASST 1
Henceforward in this report, we will refer to the program under study as BTSA/CFASST.
Overview of BTSA/CFASST and the IAIPSL Study We begin with an overview of BTSA/CFASST and the IAIPSL study. Reports 2, 3, and 4 are also available for more detailed information about the study’s goals, methods, and findings (Thompson, Paek, Goe, & Ponte, 2004a; Thompson, Paek, Goe, & Ponte, 2004b; Thompson, Ponte, Paek, & Goe, 2004).
BTSA/CFASST
CFASST is a structured professional development program for first and second year teachers that is used as part of the statewide BTSA program in which most beginning teachers in California participate. In 2003, all but 9 of 142 BTSA programs in the state employed CFASST as a central component. In its current form, BTSA/CFASST engages first and second year teachers in a series of 12 “events” (6 in each year) based on the California Standards for the Teaching Profession (CSTP). Previous forms of BTSA/CFASST, covering essentially the same topics in very similar ways, were organized with 10 events in Year 1 and 7 events in Year 2.
With the guidance of an experienced teacher who has been trained as a support provider, beginning teachers work through the CFASST events by gathering information about best practices, planning lessons, and receiving feedback on their teaching through observations by the support provider. Beginning teachers also reflect on their practice and develop ways of applying what they have learned to future lessons. This is facilitated by ongoing formative assessment in which the beginning teacher and his or her support provider assess the teaching practice of the beginning teacher and set goals for professional growth, using a formative assessment tool based on the CSTP, called the Descriptions of Practice (DOP).
Materials that guide the beginning teacher and support provider through the BTSA/CFASST events include questions to the teacher and spaces for written responses and reflections. These materials are kept in folders within a hard shell “CFASST box,” which is also referred to by many participants as, simply, “the box.” Teachers also refer to these materials as the CFASST “forms.” (For more information about the purpose and content of the BTSA/CFASST program, including the CSTP and the DOP, see California Commission on Teacher Credentialing & the California Department of Education, 2001.)
The IAIPSL Study Design
The IAIPSL study employed a quasi-experimental design to investigate the implementation of BTSA/CFASST and its impact on teacher practices and student outcomes. The study sample was drawn from the population of teachers who were in their third year of teaching in the 2002-2003 school year and who had participated in BTSA in their first two years of teaching.
Because BTSA is a statewide program for all new teachers with Multiple Subject or Single Subject preliminary credentials, there was no natural control group by which to estimate program impacts. That is, the only beginning teachers who were not enrolled in BTSA were distinctly different from those who were enrolled, in that they entered the profession with less pre-service preparation. Furthermore, in 2002-2003, almost every BTSA program in the state employed CFASST as a central component. To identify a comparison group for the study, we capitalized
IAIPSL Study, Report 1: Beginning Teachers’ Engagement with BTSA/CFASST 2
on a feature of BTSA/CFASST implementation that had been identified in previous studies (Thompson, 2001; WestEd, 2002), namely that implementation of BTSA and CFASST was highly variable in quality across and within programs, such that some BTSA enrollees engaged with the program in a deep and sustained way, while others received far less of the “treatment.” A considerable portion of engagement variability stems from program-level differences in such matters as ease and frequency of access to support providers; time to meet and work on the CFASST events; and training and monitoring of support providers. This allowed us to identify a sample of BTSA graduates who had a high level of engagement with BTSA/CFASST and compare them to a sample that had less engagement with the program.
We began the study with a survey of 1,125 third year teachers from 78 BTSA programs and 107 districts. This survey, which asked teachers about their experiences with BTSA and CFASST, was completed by 287 teachers (a response rate of 26%). Entering teachers’ survey responses into a model of BTSA/CFASST, we calculated a CFASST engagement score for each teacher We then classified each respondent into one of three levels, based on his or her CFASST engagement score: high, middle, or low. We contacted a sub-sample of 64 survey respondents for further study, attempting to draw from the top and bottom of the scale of CFASST engagement. These 64 teachers were interviewed by phone for further information regarding their CFASST experiences and to validate the survey results. The methods and findings from the survey and interviews are the focus of this report.
From the 64 teachers who were interviewed by phone, we recruited 34 teachers for case studies that involved classroom observations and face-to-face interviews. Through the observations and interviews, we developed ratings on ten measures of teaching practice that have been empirically and/or theoretically linked with effective teaching: instructional planning, reflection on practice, questioning practices (three measures), feedback practices (three measures), depth of student understanding, and overall teaching practice. By associating these measures of teaching practice with the CFASST engagement ratings derived from the survey, we were able to examine the relationship between engagement with the BTSA/CFASST program and teaching practice (see Report 2: Thompson et al., 2004a).
To estimate the impact of BTSA/CFASST on student learning, we collected student achievement test data for the students of teachers who responded to the survey. We were able to obtain usable data for the students of 144 survey respondents. By linking the student test scores with the CFASST engagement ratings derived from the survey, we are able to examine the relationship between engagement with the BTSA/CFASST program and student learning. We hypothesize that the higher a teacher’s CFASST engagement score, the higher their students will score on standardized tests. Report 3 presents the results of these analyses (Thompson et al., 2004b).
Conceptual Model of BTSA/CFASST The study’s overall direction was guided by a conceptual model of BTSA/CFASST that was jointly developed by the research team and state-level BTSA/CFASST leadership (see Appendix 1). This complex model addresses the many program contributors (e.g., BTSA program directors, trainers, state level leadership, support providers), influencers (e.g., school principals), and contextual features (e.g., alignment of district goals to BTSA/CFASST goals) that affect
IAIPSL Study, Report 1: Beginning Teachers’ Engagement with BTSA/CFASST 3
BTSA/CFASST program implementation at the local level. Because this study was most interested in the impact of BTSA/CFASST on teachers and students at the classroom level (and used beginning teachers as a primary informant), a section of the larger model that relates to beginning teachers’ direct experience of the program was further developed, based on earlier research on BTSA/CFASST implementation (Center for the Future of Teaching and Learning, 2001; Mitchell & Boyns, 2002; Olebe, 2001; Paek et al., 2001; Thompson, 2001; Thompson & Paek, 2001). This portion of the conceptual model consists of four dimensions:
• Support for BTSA/CFASST • Support Provider Availability/Access • Rapport Between Support Provider and Beginning Teacher • Substantive Focus on Teaching and Learning
Each of these is described in the following section, as they guided the construction of the survey.
The BTSA/CFASST Survey CFASST is used within the context of BTSA, a multi-faceted state level program that draws on and exists within complex, local contexts that exert a strong influence on implementation. A beginning teacher’s experience of BTSA/CFASST is mediated most directly by his or her experiences with his or her support provider, but a number of program and contextual factors influence the support provider and beginning teacher experiences, such as access to support providers; time available to meet and work on the CFASST events; and training and monitoring of support providers. To understand the range of experiences in BTSA and CFASST, we surveyed BTSA graduates on several of aspects of their experience with BTSA, CFASST and their first two years of teaching.
Survey Objectives
The BTSA/CFASST survey had several purposes: 1) To learn about the implementation of BTSA/CFASST from a sample of teachers from a range of BTSA programs; 2) To provide data by which to rate individual teachers’ experiences in BTSA/CFASST in relation to the quality and intensity of those experiences (the CFASST engagement score). These ratings, in turn, were used to classify teachers’ experiences in the program as “high,” “middle,” or “low” engagement; and 3) Using these ratings and classifications, to select a sample of teachers for in-depth study, drawing from the top and bottom of the CFASST engagement score scale.
Construction of the Survey
The survey (Appendix 2) has seven sections addressing different aspects of teacher experience, learning, and attitudes: 1) experiences with beginning teacher support programs in general; 2) experiences with BTSA; 3) experiences with CFASST; 4) pre-service preparation; 5) current teaching assignment; 6) experiences and thinking as a teacher; and 7) background information.
The survey’s overall construction was guided by the four dimensions of the conceptual model: Support for BTSA/CFASST; Support Provider Availability/Access; Rapport Between Support
IAIPSL Study, Report 1: Beginning Teachers’ Engagement with BTSA/CFASST 4

Provider and Beginning Teacher; and Substantive Focus on Teaching and Learning. Survey items were based on a number of relevant sources, including the 13 BTSA Formal Program Review Standards, selected items from the 2002 Statewide BTSA survey, and a scale developed previously for a set of nine CFASST beginning teacher case studies (Thompson, 2001). In the 2001 case studies, we used a seven-item scale focused on the support provider’s training and commitment to CFASST principles, the nature and frequency of contact between support provider and beginning teacher, and the number of CFASST events completed.
Theoretical Dimensions and Associated Survey Items
As mentioned above, the survey incorporates items that are conceptually related to constructs important to BTSA/CFASST implementation at the beginning teacher level. In this section, we present our rationale and hypotheses for the constructs measured by each dimension and explain how each item contributes to its associated construct. Many of the hypotheses stem from earlier case study research (Thompson, 2001). For the score ranges of each item and formulas for how items were combined to form sub-dimension scores, see Appendix 3.
Dimension 1: Support for BTSA
We postulate that the more support for BTSA evident at the school and teacher level, the more effective the program will be in supporting beginning teachers. By effective we mean the program’s ability to provide teachers with a successful professional learning experience. We foresee teachers’ learning experiences to have a positive influence on teachers’ practices, which will in turn lead to higher student performance. Within this dimension, there are several sub-dimensions.
A. Beginning teacher’s orientation to program. The more informed a beginning teacher is about the program, the better his or her experience with it. Group or individual orientation sessions (conducted by the support provider) are the main way this is accomplished. Beginning teachers who attend both types of orientations are expected to be better informed than those attending one or the other type of session, and these teachers, in turn, are expected to be better informed than those who do not attend any orientation session. (Survey Items 10, 11.)
B. Support provider’s participation in CFASST training. Earlier research shows that those support providers who attend CFASST training sessions are better informed about the philosophy and structure of CFASST, and thus better prepared to help their assigned beginning teachers through their BTSA experience. (Survey Item 37.)
C. Principal support and involvement. Greater awareness, support, and involvement from the principal leads to a stronger experience with the program. For example, a principal who is aware and supportive of the beginning teacher/support provider relationship will work to protect the time they have to meet together. (Survey Item 29.)
D. Support provider assignment. The support provider is central to the effectiveness of the program, serving as mentor and guide. Despite the centrality of the support provider, some beginning teachers are never assigned a support provider. Certainly the program will not be as effective if there is no assigned support provider. Furthermore, having a two-year connection to the same support provider leads to a more fruitful professional relationship. That is, the program
IAIPSL Study, Report 1: Beginning Teachers’ Engagement with BTSA/CFASST 5
will be more effective if the support provider and beginning teacher have an officially sanctioned, well-established, on-going relationship. (Survey Items 12, 13, 14.)
E. Beginning teacher release time or sub support. In order for the beginning teacher to have time to work on BTSA/CFASST activities, including observing other teachers in their classrooms, he or she needs to be provided with some release time or substitute teacher support. The offer of release time also communicates school or district support for the program, which may lead to greater commitment on the part of the beginning teacher and support provider. (Survey Item 32.)
F. BTSA as a mandatory program. Implementing BTSA as a mandatory program for all eligible new teachers suggests that the program is important and valuable, which in turn develops commitment and interest on the part of beginning teachers, support providers, other teachers, and principals. (Survey Item 9.)
Dimension 2: Support Provider Availability/Access
Previous research and common sense suggest that a critical feature in the beginning teacher/support provider relationship is the availability of the support provider to meet with the beginning teacher formally and informally. The more available and accessible the support provider is, the more support he or she can provide, and thus the greater the beginning teacher’s opportunity to learn.
A. Common planning periods. In some programs, beginning teachers and support providers have no time during the school day to meet, so they must meet before or after school or on weekends. This puts a strain on both participants, leading to fewer meetings, shorter meetings, and more interruptions to meetings. Having a common planning period affords a steady opportunity for the beginning teacher and support provider to meet together and thus improves the likelihood of interaction. (Survey Item 31.)
B. Support provider’s geographical proximity to beginning teacher. Previous case study research has shown that beginning teachers and support providers meet more regularly when they are located in the same school building. Being in the same wing of the school building improves the likelihood of both informal and formal interactions. (Survey items 22, 23.)
C. Support provider’s caseload. The BTSA Program Review Standards require that support providers have reasonable caseloads in relation to their other obligations (e.g., teaching, mentoring other teachers, performing administrative duties), so that they have the time to create strong relationships with and provide useful support to their beginning teachers. Appropriate caseload varies according to the support provider’s status as a full- or part-time teacher, full- or half-time support provider, and so forth. In general, a support provider who is a full-time teacher can support one or two beginning teachers. Full-time support providers should support no more than 12 beginning teachers. (Survey Items 24, 25.)
D. Support provider/beginning teacher meetings. Beginning teachers and support providers who meet frequently and hold reasonably long meetings at regular intervals are more likely to engage in meaningful work on the CFASST events and other BTSA activities. (Survey Items 26, 27, 28.)
IAIPSL Study, Report 1: Beginning Teachers’ Engagement with BTSA/CFASST 6
Dimension 3: Rapport Between Support Provider and Beginning Teacher
BTSA/CFASST is built around the notion of formative assessment, which entails the beginning teacher exposing their practice, as well as their thoughts, worries, and concerns about teaching. Thus, a great deal of rapport and trust is required between the beginning teacher and support provider. This dimension captures these characteristics of the beginning teacher/support provider relationship.
A. Quality of beginning teacher/support provider relationship. The closer and friendlier the personal relationship of the beginning teacher and support provider, the more trust and rapport beginning teachers will have toward their support providers. (Survey Items 15, 16, 17, 18.)
B. Time the support provider spent supporting the beginning teacher with regard to emotional and logistical issues. Activities like providing a friendly ear, commiserating, reassuring, providing help navigating school policies and procedures, and assisting with paperwork build trust and rapport between the support provider and the beginning teacher. (Survey Items 34a-b.)
Dimension 4: Substantive Focus on Teaching and Learning
Induction programs in general, and mentor-based programs in particular, can have multiple approaches and purposes. BTSA/CFASST is intended to address a range of new teacher needs, including needs for emotional and logistical support. However, the central focus of BTSA/CFASST is on the substantive aspects of teaching and student learning, including classroom management, instructional approaches, and teaching specific subject matter. This focus is an aspect of BTSA/CFASST that is central to the hypothesis that the program should have an impact on teacher practices and student learning. To measure the degree of focus on teaching and learning, we collected survey data on a number of sub-dimensions that contribute to the support provider and beginning teacher establishing and maintaining conversation and inquiry around teaching and learning issues.
A. Beginning teacher’s release time. In those cases where teachers were offered release time or sub support, we asked beginning teachers if they actually made use of those resources, the presumption being that if they did not make use of release time, it would have been very difficult for them to observe other teachers in their classrooms, a known method for new teachers to learn important teaching techniques. The model suggests that beginning teachers who made use of the available release time are probably more engaged in teaching and learning-focused activities. (Survey Item 33.)
B. CFASST event completion. The CFASST events, including the Individual Induction Plans (IIPs), focus teachers on important areas of teaching and learning. Thus, teachers who complete more CFASST events will have a stronger program experience. (Survey Items 38, 39, 40, 41.) It should be noted that the current form of CFASST (CFASST 1.0) replaced the previous form (called the Review Version) in many, but not all BTSA programs in the summer of 2001, midway through the first and second years of teaching for the cohort of teachers in this study. Thus, the CFASST event numbering system changed from 1-17 to 1-12 for some teachers, but
IAIPSL Study, Report 1: Beginning Teachers’ Engagement with BTSA/CFASST 7

not all. Items 39 and 41 are worded in a way that enables users of either version of CFASST to provide a rough estimate of the number of events they completed.
C. Use of Individual Induction Plans. In theory, all BTSA programs make use of IIPs or Professional Growth Plans, which should have a focus on specific teaching and learning issues. The frequency with which IIPs are completed is one indicator, then, of focus on teaching and learning. (Survey Item 4.)
D. CSTP. The CSTP articulate a vision of effective practice that is weighted toward a substantive teaching and learning focus. Thus, beginning teachers who participate in programs that use the CSTP will have a stronger teaching and learning focus in their work with their support providers. (Survey Item 5.)
E. Beginning teacher/support provider match. A support provider with experience in the specific teaching and learning issues confronted by the beginning teacher (i.e., has experience working with students from similar backgrounds and age and/or teaching the same subject matter) can provide better support. (Survey Items 19, 20, 21.)
F. Support provider knowledge of grade and subject matter. Even if a support provider did not have recent experience with a teacher’s grade and subject matter, they still may have proven themselves to be knowledgeable and thus able to support the beginning teacher effectively. Conversely, recent experience does not necessarily connote knowledge or helpfulness. (Survey Item 35c.)
G. Time the support provider spent supporting the beginning teacher with regard to teaching and learning issues. The more time support providers spend with beginning teachers focusing on issues like instructional and assessment strategies, curriculum, standards, and instructional resources, the better the beginning teachers will be prepared for their teaching assignment. (Survey Items 34c-e.)
H. Perceived quality of support provider support. The items included in this sub-dimension address the beginning teacher’s perceptions of the effectiveness of the support provider in regard to important areas of teaching and learning. (Survey Items 35a-b, d-h.)
CFASST Engagement Score
The dimensions and sub-dimensions described above collectively contribute to an overall measure of a beginning teacher’s engagement with BTSA/CFASST, or CFASST engagement score. The CFASST engagement score is calculated in two steps. First, the scores on each of the four dimensions were rescaled so that each had the same highest possible score: 36 points. (This step was needed because the dimension maximums varied widely as a function of different items having different score maximums and the different number of items and sub-dimensions making up each dimension.) Then, these rescaled totals were weighted as follows:
• Support for BTSA/CFASST—weight of 1 • Support Provider Availability/Access—weight of 1.5 • Rapport Between Support Provider and Beginning Teacher—weight of 1 • Substantive Focus on Teaching and Learning—weight of 1.5
IAIPSL Study, Report 1: Beginning Teachers’ Engagement with BTSA/CFASST 8
Greater weights are applied to the Substantive Focus on Teaching and Learning and Support Provider Availability/Access dimensions because of the centrality of these features to the beginning teacher’s experience, as identified in earlier research (Thompson, 2001). The result of the rescaling and weighting is a CFASST engagement scale running from 0 to 180 points.
Selecting the Survey Sample
Selecting BTSA Programs from Which to Draw the Survey Sample
BTSA is a state-sponsored program, but it is administered through more than 100 individual BTSA programs run by school districts or consortia of school districts and institutions of higher education. In the 2002-2003 school year, there were 144 BTSA programs in the state of California. State-sponsored evaluations of BTSA programs have shown a great deal of variation in implementation fidelity and quality across individual programs. Thus, a first step in constructing the survey sample was to select a sample of BTSA programs that represented strong and weak implementation, in order to maximize the variation in CFASST engagement at the individual teacher level.
From the BTSA programs that used CFASST in the period under study, we examined a number of data sources to get an idea of overall program quality (as distinct from program quality at the individual teacher level). No single source provided completely reliable or applicable data on all programs, so we triangulated multiple sources, including:
2001-2002 CCTC surveys of participating beginning teachers, support providers, program staff, and site administrators. This is a set of statewide population surveys that provide information on several types of BTSA participants and how well BTSA was perceived to meet teachers’ needs (e.g., professional match with support provider, the amount of support and resources). We aggregated data from the surveys at the program level, taking the average of all four surveys on relevant items. Relevant items were those that provided information on the level of engagement in the program on the part of the beginning teacher, such as frequency and duration of meetings. We counted the number of items rated above the statewide mean to get a proxy for how well a program was functioning. The resulting scores ranged from 8 to 33.
2000-2001 School Improvement Research Group survey. The School Improvement Research Group (SIRG), under contract to the BTSA Task Force, conducted statewide population surveys of BTSA participants in each of several years. We aggregated and analyzed data from the 2000-2001 survey, as this was one of the years that our study participants were engaged in BTSA/CFASST. As with the 2001-2002 CCTC survey, we tallied the number of items that were above the statewide mean for relevant items, which resulted in scores ranging from 5 to 113.
Formal Program Review data. BTSA programs go through a Formal Program Review (FPR) against the California Standards of Quality and Effectiveness for Professional Teacher Induction Programs every three to four years. Program scores ranged from 1-13, based on the number of standards the program had met in their last review. (Currently, here are 20 FPR standards, but at the time of this analysis, the additional standards had not been implemented.) In the course of selecting programs for the survey sample, CCTC program staff indicated concerns about the
IAIPSL Study, Report 1: Beginning Teachers’ Engagement with BTSA/CFASST 9
validity of FPR ratings that had been completed before the 2001-2002 school year, so this data was eventually replaced by the quality ratings described next. Quality ratings supplied by cluster BTSA staff. To facilitate leadership, communication, and management of BTSA, the State has been divided into six regions, known as “clusters.” In each cluster, the state employs (among other staff) a Professional Development Consultant (PDC), who is charged with monitoring and assisting BTSA programs in the cluster and thus has knowledge of each program. PDCs for each of the six BTSA clusters were asked to rate the programs they supervise as high, medium, or low, based on their best understandings of how programs were functioning. There was considerable hesitation on the part of some PDCs, who did not want to rate any of their programs as low, even when we explained the purpose of the ratings and that this data was confidential and to be triangulated with other data sources. Two PDCs rated only some programs, so we did not have PDC quality ratings for all programs.
Using these data sources, we constructed a list of high, middle, and low implementation BTSA programs through the following process. First, we sorted the programs from high to low on the basis of their scores on the first three data sources, sorting first on the 2001-2002 CCTC survey score, second on the 2000-2001 SIRG survey score, and third on the FPR score (the sort order being based on our judgment of the currency and reliability of the data source). This ordering was then reviewed by three CCTC staff members, who suggested that we collect quality ratings from the PDCs in place of the FPR data. We collected the PDCs’ quality ratings and re-did the sortings, using the PDC quality ratings as the third data source. Using the resulting ranking of programs, we selected the highest and lowest ranked programs until we had a list of programs that would collectively yield a sufficiently large survey sample (at least 1,000 teachers), with the sample roughly split between programs at the high and low ends of the list. The final list of programs included 78 programs representing all six clusters, listed in Appendix 4.
Identification of Teachers for the Survey
Within the selected programs, we intended to survey all third year teachers who were graduates of two years of BTSA and who were teaching in grades 3, 4, or 5 in the 2002-2003 school year. To identify qualifying teachers, we began with the CCTC’s database of teachers who were enrolled in BTSA in the 2001-2002 school year. From this database, we selected grade 3, 4, or 5 teachers who were in their second year of BTSA in the 2001-2002 school year. We then contacted the program directors of the selected BTSA programs and asked them to verify the current school location and grade level of these teachers and to add teachers who were qualified BTSA graduates working in grades 3-5 in the 2002-2003 school year. Not all program directors complied. Our final survey sample consisted of 1,125 teachers.
Data Collection
Survey Distribution and Return
The survey was distributed via mail to the school addresses of 1,125 teachers from the 78 selected BTSA programs in mid-October, 2002. Surveys were returned via mail to ETS by mid- November. In some programs, the program directors encouraged their BTSA graduates who had received the survey to complete and return the survey. A letter that indicated the purposes of the
IAIPSL Study, Report 1: Beginning Teachers’ Engagement with BTSA/CFASST 10
survey, the voluntary nature of participation, and assurances of the necessary safeguards to confidentiality accompanied each survey. The survey was confidential, but not anonymous, because we needed to be able to connect teacher names to student test score data and to recruit a sub-sample for observational studies. The survey and resulting data were handled in accordance with all state, federal, and professional standards in regard to research on human subjects.
Response Rate
We expected a 30% response rate, and of those programs where the program director verified teachers by name, school, and grade, we had a 30% response rate. For the programs that did not verify teacher data, we had a 17% response rate. Out of 1,125 surveys sent out, 287 were returned, an overall response rate of 26%. In our initial plans, we called for a 30% response rate in recognition of the geographically scattered and programmatically disconnected nature of the sample, as well as the limited resources and time frame we had to apply to the survey. The teachers to whom we sent surveys were no longer directly connected to BTSA and had no extrinsic incentive to respond. We were also unsure of the school locations of a sizable minority of the teachers to whom we sent surveys. We asked BTSA program directors to verify the current year schools and grades of these BTSA graduates and to add others who had later moved into their program, but not all program directors cooperated. Thus, as many as 33% of the teachers to whom we sent surveys may have changed schools or left teaching altogether (Ingersoll, 2003). Under these conditions, we were satisfied with a response rate of 26%, a response rate that is typical of mail-back surveys with no follow-up or incentive for participation. Even though the final response rate was close to our goal, we must acknowledge that this low response rate has a negative impact on the generalizability of the study. With many sampled teachers “missing in action,” the likelihood of response bias increases; that is, there is a good chance that the characteristics of teachers who responded to the survey were fundamentally different from those of teachers who did not respond. In the next section, we will present comparisons between the survey sample and California teachers overall to address the question of the sample’s representativeness.
Characteristics of the Survey Sample
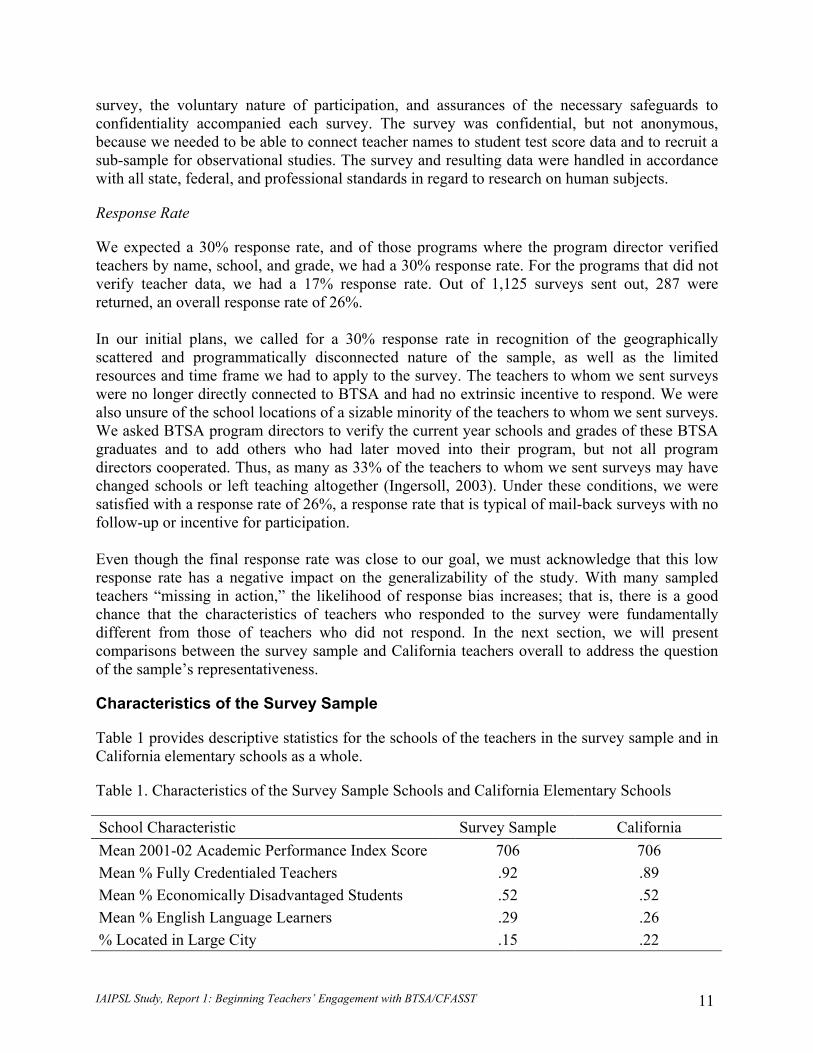
Table 1 provides descriptive statistics for the schools of the teachers in the survey sample and in California elementary schools as a whole.
Table 1. Characteristics of the Survey Sample Schools and California Elementary Schools
School Characteristic Survey Sample California Mean 2001-02 Academic Performance Index Score 706 706 Mean % Fully Credentialed Teachers .92 .89 Mean % Economically Disadvantaged Students .52 .52 Mean % English Language Learners .29 .26 % Located in Large City .15 .22
IAIPSL Study, Report 1: Beginning Teachers’ Engagement with BTSA/CFASST 11
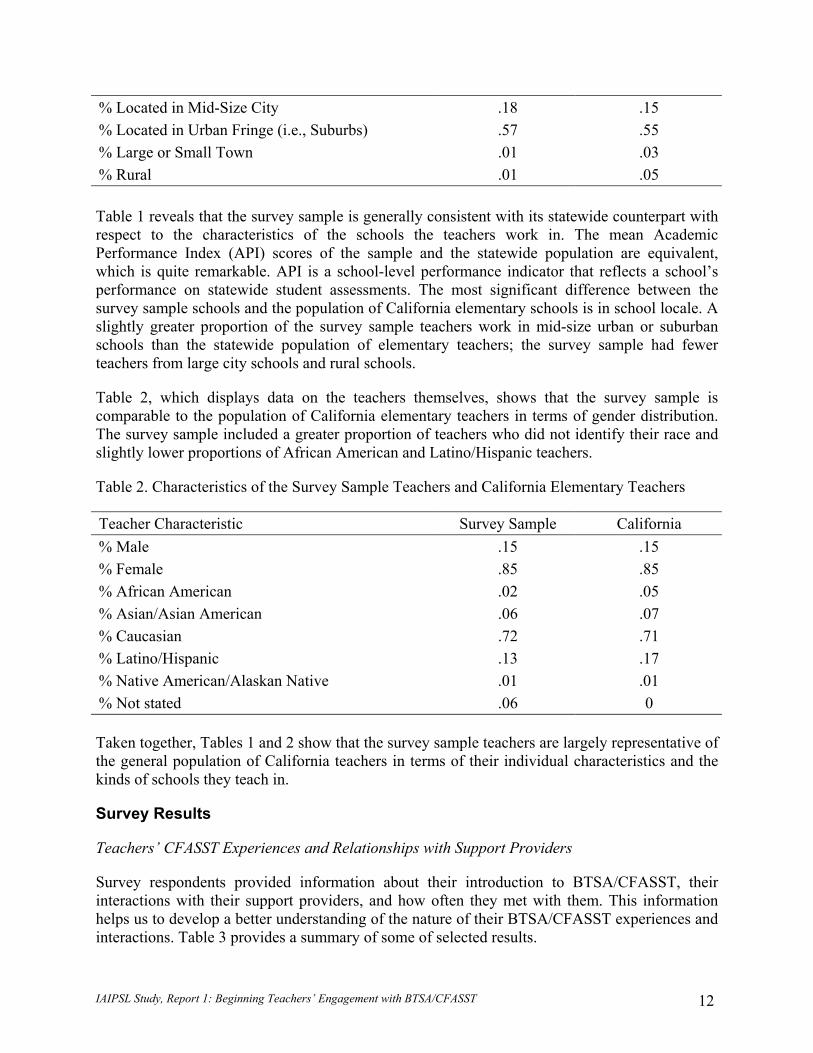
% Located in Mid-Size City .18 .15 % Located in Urban Fringe (i.e., Suburbs) .57 .55 % Large or Small Town .01 .03 % Rural .01 .05
Table 1 reveals that the survey sample is generally consistent with its statewide counterpart with respect to the characteristics of the schools the teachers work in. The mean Academic Performance Index (API) scores of the sample and the statewide population are equivalent, which is quite remarkable. API is a school-level performance indicator that reflects a school’s performance on statewide student assessments. The most significant difference between the survey sample schools and the population of California elementary schools is in school locale. A slightly greater proportion of the survey sample teachers work in mid-size urban or suburban schools than the statewide population of elementary teachers; the survey sample had fewer teachers from large city schools and rural schools.
Table 2, which displays data on the teachers themselves, shows that the survey sample is comparable to the population of California elementary teachers in terms of gender distribution. The survey sample included a greater proportion of teachers who did not identify their race and slightly lower proportions of African American and Latino/Hispanic teachers.
Table 2. Characteristics of the Survey Sample Teachers and California Elementary Teachers
Teacher Characteristic Survey Sample California % Male .15 .15 % Female .85 .85 % African American .02 .05 % Asian/Asian American .06 .07 % Caucasian .72 .71 % Latino/Hispanic .13 .17 % Native American/Alaskan Native .01 .01 % Not stated .06 0 Taken together, Tables 1 and 2 show that the survey sample teachers are largely representative of the general population of California teachers in terms of their individual characteristics and the kinds of schools they teach in.
Survey Results
Teachers’ CFASST Experiences and Relationships with Support Providers
Survey respondents provided information about their introduction to BTSA/CFASST, their interactions with their support providers, and how often they met with them. This information helps us to develop a better understanding of the nature of their BTSA/CFASST experiences and interactions. Table 3 provides a summary of some of selected results.
IAIPSL Study, Report 1: Beginning Teachers’ Engagement with BTSA/CFASST 12
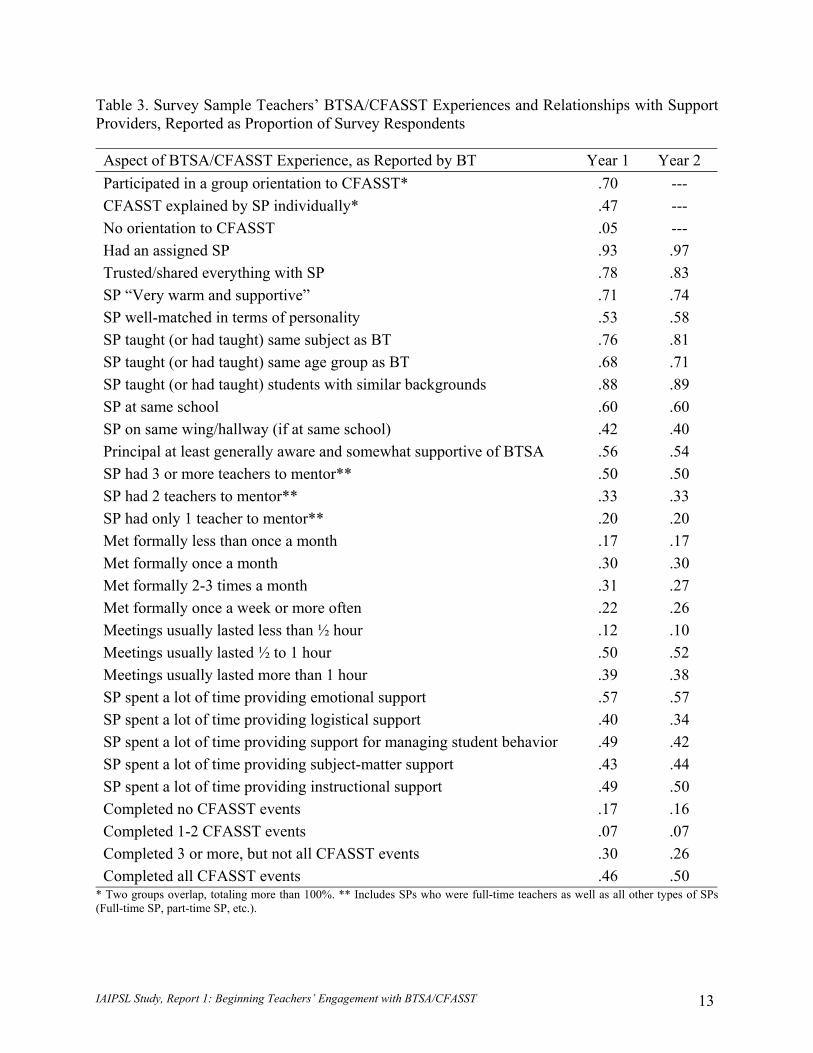
Table 3. Survey Sample Teachers’ BTSA/CFASST Experiences and Relationships with Support Providers, Reported as Proportion of Survey Respondents
Aspect of BTSA/CFASST Experience, as Reported by BT Year 1 Year 2 Participated in a group orientation to CFASST* .70 --- CFASST explained by SP individually* .47 --- No orientation to CFASST .05 --- Had an assigned SP .93 .97 Trusted/shared everything with SP .78 .83 SP “Very warm and supportive” .71 .74 SP well-matched in terms of personality .53 .58 SP taught (or had taught) same subject as BT .76 .81 SP taught (or had taught) same age group as BT .68 .71 SP taught (or had taught) students with similar backgrounds .88 .89 SP at same school .60 .60 SP on same wing/hallway (if at same school) .42 .40 Principal at least generally aware and somewhat supportive of BTSA .56 .54 SP had 3 or more teachers to mentor** .50 .50 SP had 2 teachers to mentor** .33 .33 SP had only 1 teacher to mentor** .20 .20 Met formally less than once a month .17 .17 Met formally once a month .30 .30 Met formally 2-3 times a month .31 .27 Met formally once a week or more often .22 .26 Meetings usually lasted less than ½ hour .12 .10 Meetings usually lasted ½ to 1 hour .50 .52 Meetings usually lasted more than 1 hour .39 .38 SP spent a lot of time providing emotional support .57 .57 SP spent a lot of time providing logistical support .40 .34 SP spent a lot of time providing support for managing student behavior .49 .42 SP spent a lot of time providing subject-matter support .43 .44 SP spent a lot of time providing instructional support .49 .50 Completed no CFASST events .17 .16 Completed 1-2 CFASST events .07 .07 Completed 3 or more, but not all CFASST events .30 .26 Completed all CFASST events .46 .50
* Two groups overlap, totaling more than 100%. ** Includes SPs who were full-time teachers as well as all other types of SPs (Full-time SP, part-time SP, etc.).
IAIPSL Study, Report 1: Beginning Teachers’ Engagement with BTSA/CFASST 13
Most teachers had some form of orientation (all but 5%) and a support provider (except for 7% of teachers the first year and 3% the second year; numbers that, though low, represent a challenge to the core of the BTSA experience). Just over half of the teachers said that their principals were at least generally aware of and somewhat supportive of BTSA/CFASST (meaning that almost half felt their principals were unaware or unsupportive). The majority of teachers (more than 70%) thought that their support providers were “warm and supportive” and tended to trust them to the point of feeling comfortable enough to “share everything” with them. A majority of teachers felt they were well-matched to their support providers on multiple dimensions (personality and experience with teaching similar subject matter, grade levels, and students). Three-fifths of beginning teachers had support providers who were located in the same school (meaning that two-fifths had remote support providers). There was high variability in terms of the frequency of meetings between the beginning teachers and their support providers, ranging from less than once a month to more than once a week. For half the teachers, meetings with their support providers lasted between 30 minutes and an hour, with another third saying that their meetings lasted for longer than an hour. For most teachers, the primary focus of the meetings was on emotional support, with instructional support and support for managing student behavior coming just behind.
As mentioned earlier, the organization and number of BTSA/CFASST events changed between the first and second years that this cohort of teachers experienced the program. In the 2000-2001 school year, all BTSA/CFASST users worked with a program that included 17 events, 10 in Year 1, and 7 in Year 2. This version of CFASST is known as the Field Review version. In the 2001-2002 school, CFASST 1.0 was issued. This version includes 12 events, six in Year 1 and six in Year 2. However, many teachers continued to use the Field Review version throughout all or part of the 2001-2002 school year. The 12 events in CFASST 1.0 map back to the 17 events in the Field Version, as they are built of the same parts and maintained significantly the same content, but it is not a one-to-one correspondence. This confusion about the numbering system for events meant that we could not ask survey respondents to check off the events they had completed. Instead, we asked them to tell us whether they completed all the events, several but not all events, 1-2 events, or no events. About half of the teachers reported completing all the CFASST events, with others completing several, a few, or none. It is notable that almost a quarter of all teachers in the sample completed two or fewer events in each year.
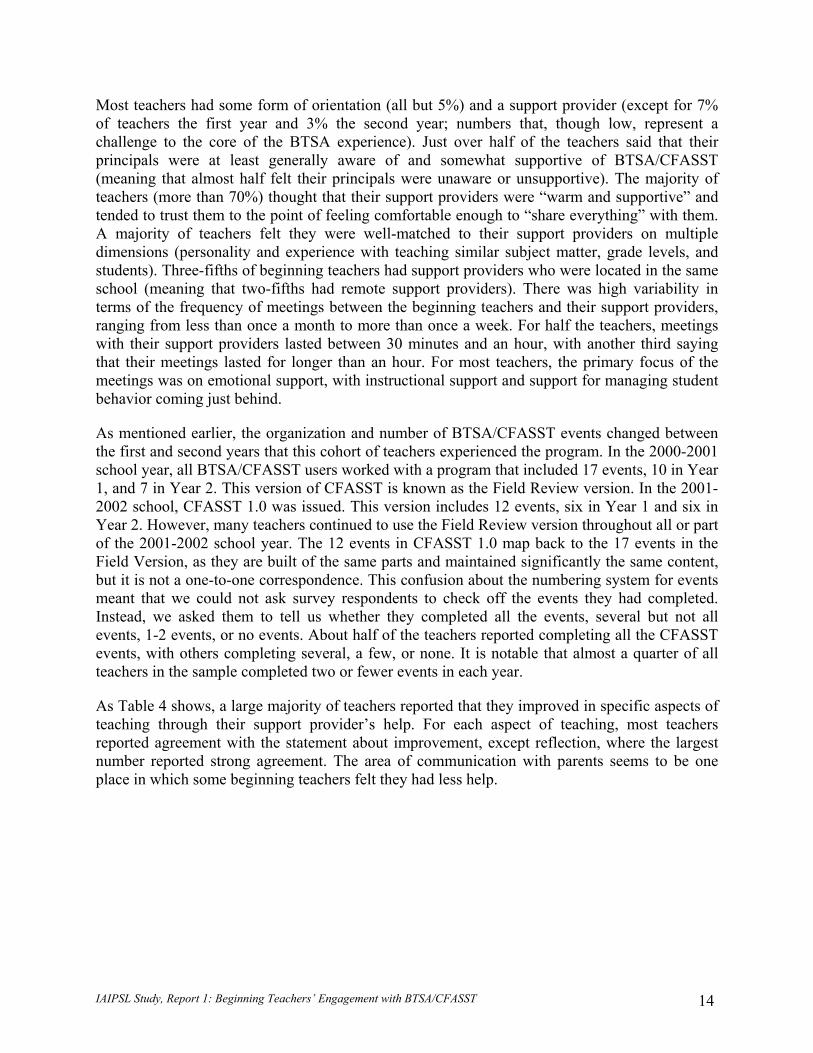
As Table 4 shows, a large majority of teachers reported that they improved in specific aspects of teaching through their support provider’s help. For each aspect of teaching, most teachers reported agreement with the statement about improvement, except reflection, where the largest number reported strong agreement. The area of communication with parents seems to be one place in which some beginning teachers felt they had less help.
IAIPSL Study, Report 1: Beginning Teachers’ Engagement with BTSA/CFASST 14
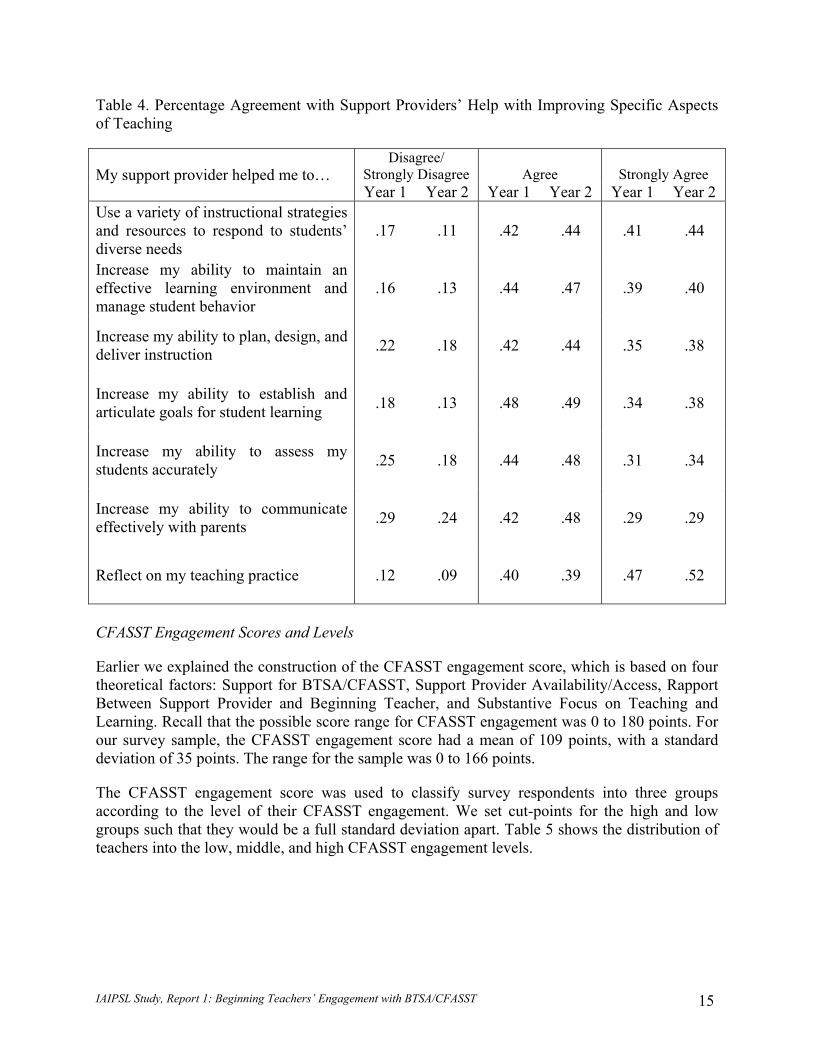
Table 4. Percentage Agreement with Support Providers’ Help with Improving Specific Aspects of Teaching
Disagree/ Strongly Disagree
Agree
Strongly Agree My support provider helped me to…
Year 1 Year 2 Year 1 Year 2 Year 1 Year 2 Use a variety of instructional strategies and resources to respond to students’ diverse needs
.17 .11 .42 .44 .41 .44
Increase my ability to maintain an effective learning environment and manage student behavior
.16 .13 .44 .47 .39 .40
Increase my ability to plan, design, and deliver instruction .22 .18 .42 .44 .35 .38
Increase my ability to establish and articulate goals for student learning .18 .13 .48 .49 .34 .38
Increase my ability to assess my students accurately .25 .18 .44 .48 .31 .34
Increase my ability to communicate effectively with parents .29 .24 .42 .48 .29 .29
Reflect on my teaching practice .12 .09 .40 .39 .47 .52
CFASST Engagement Scores and Levels
Earlier we explained the construction of the CFASST engagement score, which is based on four theoretical factors: Support for BTSA/CFASST, Support Provider Availability/Access, Rapport Between Support Provider and Beginning Teacher, and Substantive Focus on Teaching and Learning. Recall that the possible score range for CFASST engagement was 0 to 180 points. For our survey sample, the CFASST engagement score had a mean of 109 points, with a standard deviation of 35 points. The range for the sample was 0 to 166 points.
The CFASST engagement score was used to classify survey respondents into three groups according to the level of their CFASST engagement. We set cut-points for the high and low groups such that they would be a full standard deviation apart. Table 5 shows the distribution of teachers into the low, middle, and high CFASST engagement levels.
IAIPSL Study, Report 1: Beginning Teachers’ Engagement with BTSA/CFASST 15
Table 5. CFASST Engagement Level
Range N % Low Level of Engagement 0-97 82 29 Middle Level of Engagement 98-132 130 45 High Level of Engagement 133-166 75 26 Total 0-166 287 100
Relationship Between CFASST Engagement Levels and Other Variables
To investigate whether teachers’ CFASST engagement is related in any way to personal or school context factors, we analyzed teachers’ CFASST engagement levels (treated as an independent variable) in relation to a number of teacher-level and school-level variables. We found that there were only two variables that were statistically significant in their association with CFASST engagement level. The first one was a categorical ranking of teachers’ years of experience in the classroom, based on Item 56 of the survey. Though BTSA is targeted to teachers in their first and second years of teaching, it is not uncommon that teachers who have more years of experience in the classroom (as interns, pre-interns, teacher assistants, or as a teacher in an out-of-state classroom) also enroll in the program. In addition, teachers may self-report more years of teaching experience by counting their clinical experiences in their teacher preparation programs. Sixty-four percent of the survey respondents reported that they had taught for three years, counting the year the survey was completed, which is the years of teaching experience we expected from most respondents. Twenty-nine percent reported having more than three years’ experience, while 6% reported having less than three years experience. A chi-square test showed a significant relationship between reported years of teaching experience and CFASST engagement level (χ2= 13.029, df = 6, p < .05). Teachers with higher CFASST engagement levels tended to report teaching for a longer period of time. We also found a significant relationship between CFASST engagement level and the decile ranking of the API score of a teacher’s school (F (2, 279) =3.745, p < .05). Teachers who had a higher CFASST engagement level tended to teach in schools in higher API deciles. In policy analysis literature, California schools are often divided into deciles based on their API scores, with higher deciles corresponding to stronger student achievement. Variables for population status and multi-track year-round school were not significantly related to CFASST engagement levels. Similarly, the percent of emergency credentialed teachers, fully credentialed teachers, socio-economically disadvantaged students, students whose parents are college graduates, and ethnic background of students did not have significantly different means for the various CFASST engagement levels.
IAIPSL Study, Report 1: Beginning Teachers’ Engagement with BTSA/CFASST 16
Interviews with BTSA Graduates Purpose of the Interviews
In order to collect data with which to triangulate the information collected from surveys, as well as to identify and recruit candidates for case studies, we interviewed a sub-set of survey respondents to the survey by phone. In addition, the interviews provided a rich data source for understanding the experiences of BTSA participants and gaining insight into program implementation, especially by analyzing the interview data by the respondent’s CFASST engagement classification.
Selecting the Interview Sample
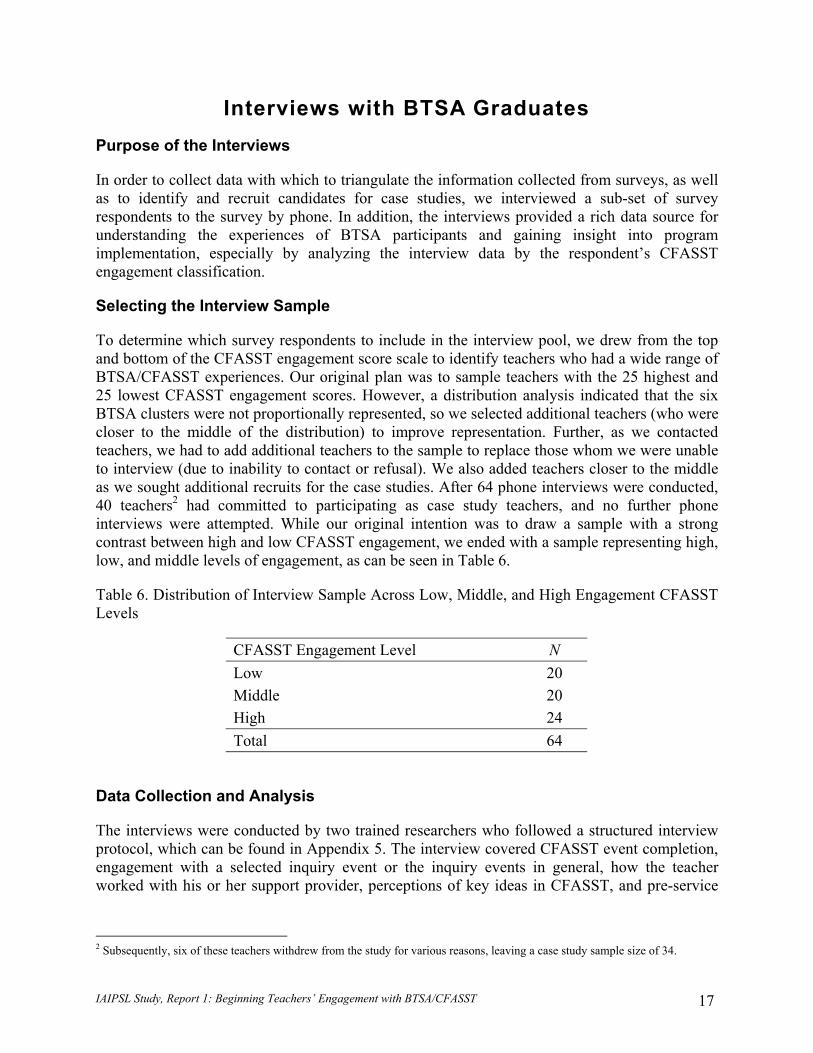
To determine which survey respondents to include in the interview pool, we drew from the top and bottom of the CFASST engagement score scale to identify teachers who had a wide range of BTSA/CFASST experiences. Our original plan was to sample teachers with the 25 highest and 25 lowest CFASST engagement scores. However, a distribution analysis indicated that the six BTSA clusters were not proportionally represented, so we selected additional teachers (who were closer to the middle of the distribution) to improve representation. Further, as we contacted teachers, we had to add additional teachers to the sample to replace those whom we were unable to interview (due to inability to contact or refusal). We also added teachers closer to the middle as we sought additional recruits for the case studies. After 64 phone interviews were conducted, 40 teachers2 had committed to participating as case study teachers, and no further phone interviews were attempted. While our original intention was to draw a sample with a strong contrast between high and low CFASST engagement, we ended with a sample representing high, low, and middle levels of engagement, as can be seen in Table 6.
Table 6. Distribution of Interview Sample Across Low, Middle, and High Engagement CFASST Levels
CFASST Engagement Level N Low 20 Middle 20 High 24 Total 64
Data Collection and Analysis
The interviews were conducted by two trained researchers who followed a structured interview protocol, which can be found in Appendix 5. The interview covered CFASST event completion, engagement with a selected inquiry event or the inquiry events in general, how the teacher worked with his or her support provider, perceptions of key ideas in CFASST, and pre-service
2 Subsequently, six of these teachers withdrew from the study for various reasons, leaving a case study sample size of 34.
IAIPSL Study, Report 1: Beginning Teachers’ Engagement with BTSA/CFASST 17
preparation. The interview ended with an attempt to recruit the teacher to participate in the case study component of the IAIPSL study. Interviews lasted 30 to 60 minutes.
Interviews were scheduled by contacting the teachers at their schools by telephone and arranging a time to talk. In many cases, the teachers took the initiative to locate their CFASST boxes to have them on hand during the interview, as a prompt to jog their memories. Interviews were tape recorded, and following each interview, the interviewers completed a rough transcript. These transcripts were then elaborated and corrected on the basis of a more careful review of the tape at a later time by another reviewer. The transcripts were then downloaded into a qualitative analysis program (QSR Nud*ist 4) for further analysis. The purpose of the qualitative analyses was to explore patterns of responses that could be used to triangulate findings with the survey data, as well as to collect comments that were particularly germane to the research questions. Additional quantitative analyses were also performed, based on frequencies of responses culled from the qualitative analyses and the teachers’ status as high, middle, or low CFASST engagement.
Characteristics of the Interview Sample
School and Teacher Characteristics of the Interview Sample
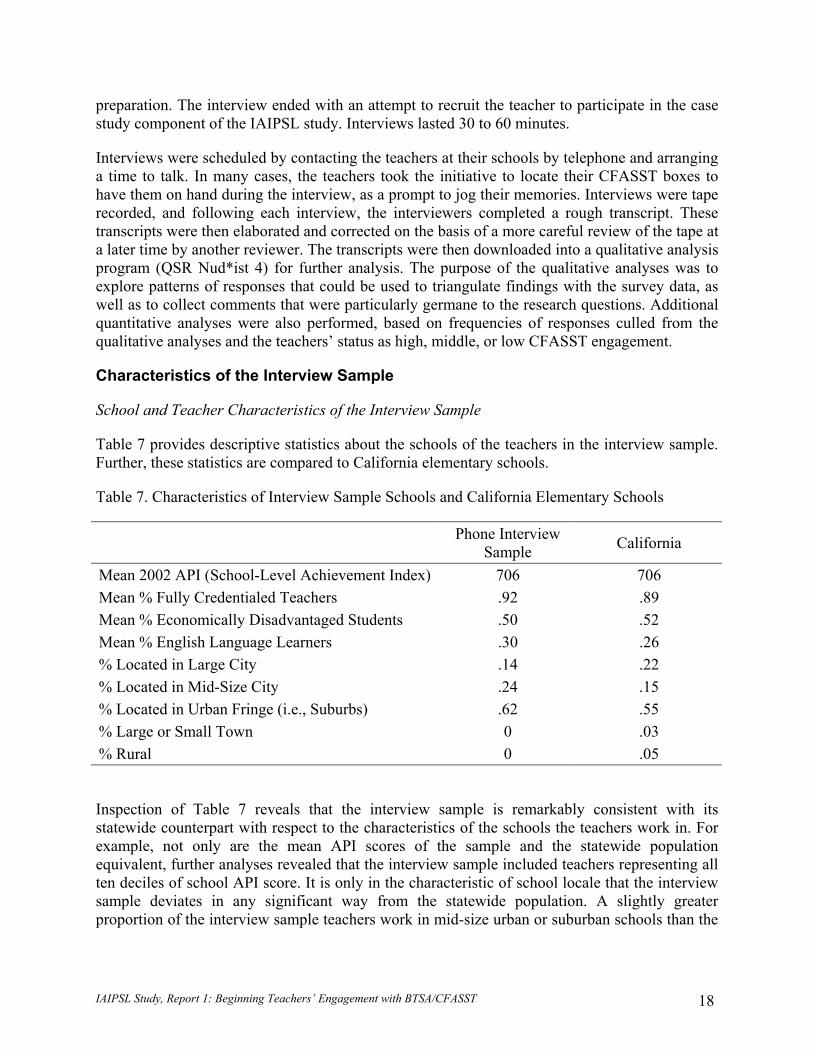
Table 7 provides descriptive statistics about the schools of the teachers in the interview sample. Further, these statistics are compared to California elementary schools.
Table 7. Characteristics of Interview Sample Schools and California Elementary Schools
Phone Interview Sample California
Mean 2002 API (School-Level Achievement Index) 706 706 Mean % Fully Credentialed Teachers .92 .89 Mean % Economically Disadvantaged Students .50 .52 Mean % English Language Learners .30 .26 % Located in Large City .14 .22 % Located in Mid-Size City .24 .15 % Located in Urban Fringe (i.e., Suburbs) .62 .55 % Large or Small Town 0 .03 % Rural 0 .05
Inspection of Table 7 reveals that the interview sample is remarkably consistent with its statewide counterpart with respect to the characteristics of the schools the teachers work in. For example, not only are the mean API scores of the sample and the statewide population equivalent, further analyses revealed that the interview sample included teachers representing all ten deciles of school API score. It is only in the characteristic of school locale that the interview sample deviates in any significant way from the statewide population. A slightly greater proportion of the interview sample teachers work in mid-size urban or suburban schools than the
IAIPSL Study, Report 1: Beginning Teachers’ Engagement with BTSA/CFASST 18
statewide population of elementary teachers; the interview sample had fewer teachers from large urban areas and no teachers in rural schools.
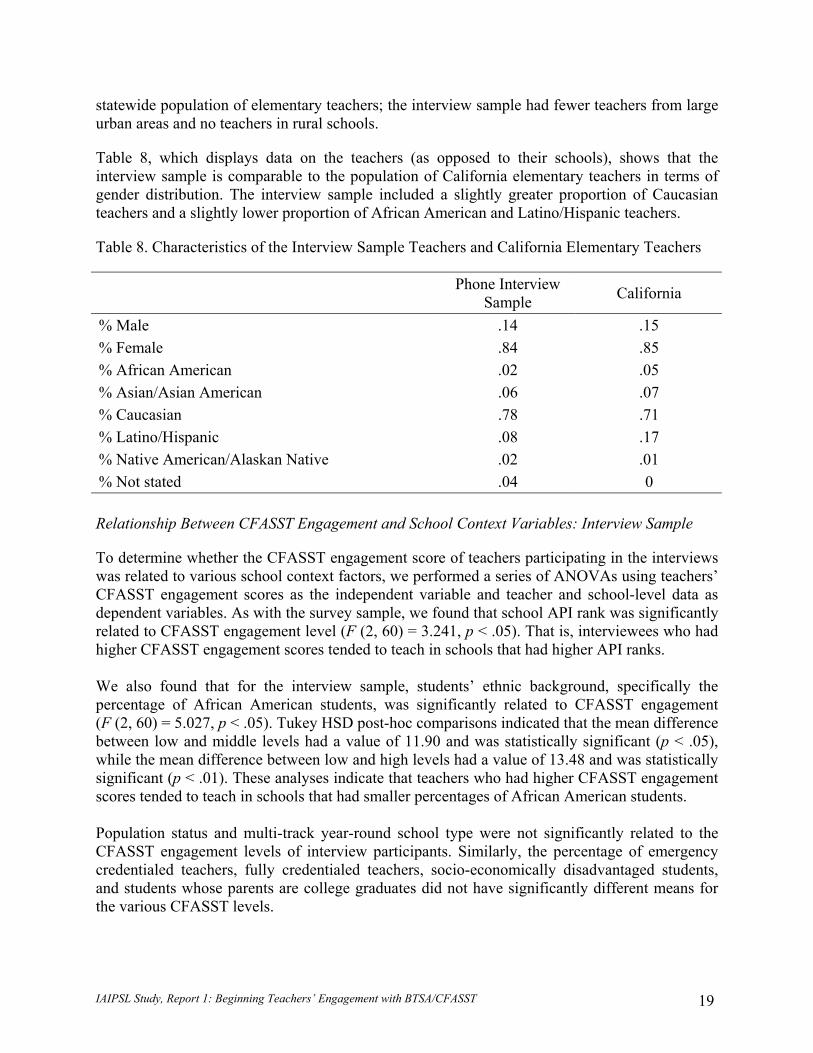
Table 8, which displays data on the teachers (as opposed to their schools), shows that the interview sample is comparable to the population of California elementary teachers in terms of gender distribution. The interview sample included a slightly greater proportion of Caucasian teachers and a slightly lower proportion of African American and Latino/Hispanic teachers.
Table 8. Characteristics of the Interview Sample Teachers and California Elementary Teachers
Phone Interview Sample California
% Male .14 .15 % Female .84 .85 % African American .02 .05 % Asian/Asian American .06 .07 % Caucasian .78 .71 % Latino/Hispanic .08 .17 % Native American/Alaskan Native .02 .01 % Not stated .04 0
Relationship Between CFASST Engagement and School Context Variables: Interview Sample
To determine whether the CFASST engagement score of teachers participating in the interviews was related to various school context factors, we performed a series of ANOVAs using teachers’ CFASST engagement scores as the independent variable and teacher and school-level data as dependent variables. As with the survey sample, we found that school API rank was significantly related to CFASST engagement level (F (2, 60) = 3.241, p < .05). That is, interviewees who had higher CFASST engagement scores tended to teach in schools that had higher API ranks. We also found that for the interview sample, students’ ethnic background, specifically the percentage of African American students, was significantly related to CFASST engagement (F (2, 60) = 5.027, p < .05). Tukey HSD post-hoc comparisons indicated that the mean difference between low and middle levels had a value of 11.90 and was statistically significant (p < .05), while the mean difference between low and high levels had a value of 13.48 and was statistically significant (p < .01). These analyses indicate that teachers who had higher CFASST engagement scores tended to teach in schools that had smaller percentages of African American students. Population status and multi-track year-round school type were not significantly related to the CFASST engagement levels of interview participants. Similarly, the percentage of emergency credentialed teachers, fully credentialed teachers, socio-economically disadvantaged students, and students whose parents are college graduates did not have significantly different means for the various CFASST levels.
IAIPSL Study, Report 1: Beginning Teachers’ Engagement with BTSA/CFASST 19
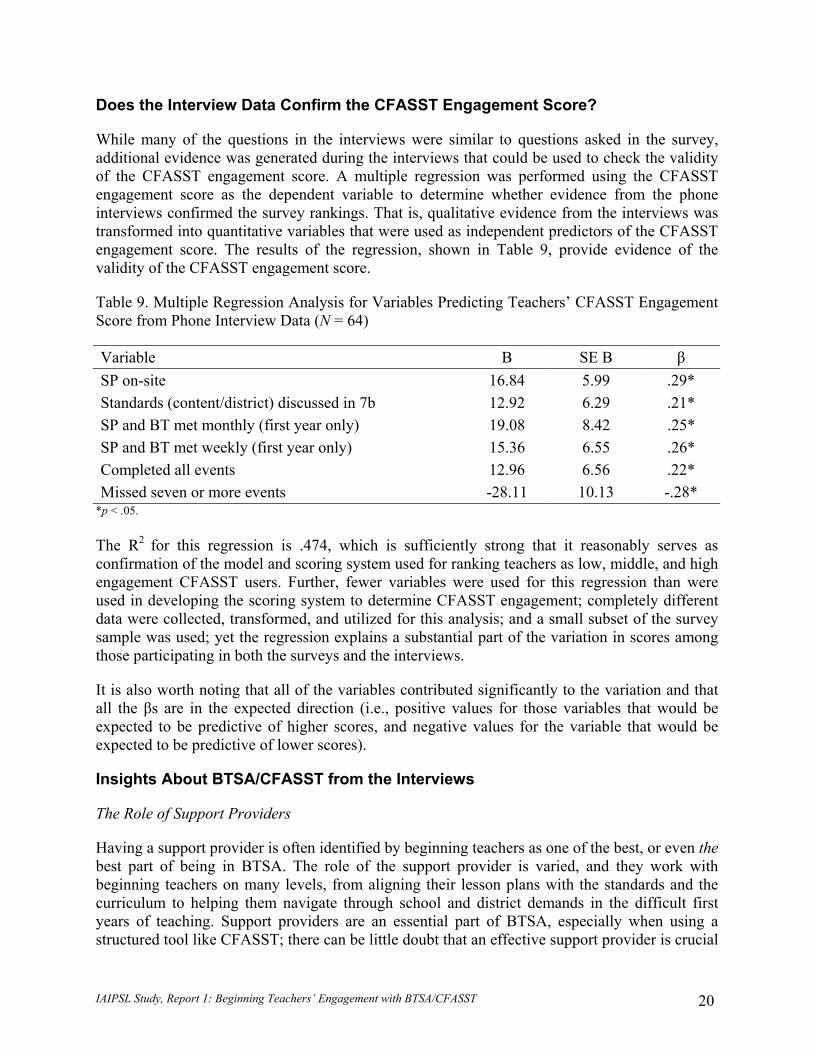
Does the Interview Data Confirm the CFASST Engagement Score?
While many of the questions in the interviews were similar to questions asked in the survey, additional evidence was generated during the interviews that could be used to check the validity of the CFASST engagement score. A multiple regression was performed using the CFASST engagement score as the dependent variable to determine whether evidence from the phone interviews confirmed the survey rankings. That is, qualitative evidence from the interviews was transformed into quantitative variables that were used as independent predictors of the CFASST engagement score. The results of the regression, shown in Table 9, provide evidence of the validity of the CFASST engagement score.
Table 9. Multiple Regression Analysis for Variables Predicting Teachers’ CFASST Engagement Score from Phone Interview Data (N = 64)
Variable B SE B β SP on-site 16.84 5.99 .29* Standards (content/district) discussed in 7b 12.92 6.29 .21* SP and BT met monthly (first year only) 19.08 8.42 .25* SP and BT met weekly (first year only) 15.36 6.55 .26* Completed all events 12.96 6.56 .22* Missed seven or more events -28.11 10.13 -.28*
*p < .05. The R2 for this regression is .474, which is sufficiently strong that it reasonably serves as confirmation of the model and scoring system used for ranking teachers as low, middle, and high engagement CFASST users. Further, fewer variables were used for this regression than were used in developing the scoring system to determine CFASST engagement; completely different data were collected, transformed, and utilized for this analysis; and a small subset of the survey sample was used; yet the regression explains a substantial part of the variation in scores among those participating in both the surveys and the interviews.
It is also worth noting that all of the variables contributed significantly to the variation and that all the βs are in the expected direction (i.e., positive values for those variables that would be expected to be predictive of higher scores, and negative values for the variable that would be expected to be predictive of lower scores).
Insights About BTSA/CFASST from the Interviews
The Role of Support Providers
Having a support provider is often identified by beginning teachers as one of the best, or even the best part of being in BTSA. The role of the support provider is varied, and they work with beginning teachers on many levels, from aligning their lesson plans with the standards and the curriculum to helping them navigate through school and district demands in the difficult first years of teaching. Support providers are an essential part of BTSA, especially when using a structured tool like CFASST; there can be little doubt that an effective support provider is crucial
IAIPSL Study, Report 1: Beginning Teachers’ Engagement with BTSA/CFASST 20
to a new teacher’s successful completion of the CFASST events. While a few teachers may be forced to complete the events more or less on their own due to varying circumstances, the teachers who are most satisfied with their CFASST experience seem to be those who describe close relationships with their support providers. There are a number of indicators within the phone interview that collectively provide evidence for this; these are detailed below.
On-Site and Off-Site Support Providers
Teachers were not specifically asked whether their support providers were on- or off-site. However, most teachers volunteered this information, usually in response to Question #7a: “About how often, and for how long, do you think you met with your support provider to work on this event?” Table 10 provides a breakdown of whether support providers were on-site, off-site, both (i.e., the teacher had more than one support provider during the two year program), or whether they did not specify.
Table 10. Percentages of Teachers with Support Providers On- or Off-Site
CFASST Engagement Level Support Provider Location
High Middle Low Support Provider on-site 75% 45% 20% Support Provider off-site 4% 20% 20% On- and off-site (different support providers) 4% 5% 25% Not mentioned during interview 17% 30% 35%
Note. Percentages in ranks low, middle, and high represent the percentages of teachers in that rank who had support providers in the conditions described. Thus, columns will total 100% (except in cases of rounding error); rows will not total 100%. A two-way contingency table analysis was conducted to evaluate whether teachers ranked high, middle, or low CFASST engagement were more or less likely to report having support providers on-site, off-site, or in some combination. Teachers’ CFASST engagement and support provider location were found to be significantly related. With data in the category “Not mentioned during interview” counted as missing, the results were: Pearson χ2 (4, N = 47) = 14.583, p < .01, Cramér’s V = .403. A two-way contingency table analysis conducted to examine the High and Low pair also yielded significant results: χ2 (3, N = 44) = 13.946, p < .01, Cramér’s V = .56. The high Cramér’s V values suggest a strong relationship between CFASST engagement and having an on-site support provider. The data are illustrated graphically in Figure 2.
3 With “Not mentioned during interview” counted as another category, the results were: χ2 (6, N = 64) = 16.334, p < .05, Cramér’s V = .36.
IAIPSL Study, Report 1: Beginning Teachers’ Engagement with BTSA/CFASST 21
Support Provider on and off site variables
Not mentioned Off- and on-siteSP off-siteSP on-site
Percent
80
60
40
20
0
Rank
Low
High
Figure 2. Percentages of Teachers with SPs On- and Off-Site by CFASST Engagement.
While it would seem obvious that having a support provider on-site would be most beneficial to the new teacher because it would permit more interactions and because they would have a shared school context, the data are not clear-cut. There was substantial variability in the relationships between the support providers and beginning teachers, including how much time they spent together. Generally, teachers with support providers on-site were more likely to say that they met informally with their support providers more often than did teachers with support providers off-site: “We met officially two times a month, but we talked informally on a daily basis” and “We met at least once a week for an hour, but we worked together on a daily basis.” However, there were exceptions, such as: “The first year my support provider was off-site, and we met once a week to one time every couple of weeks for an hour after school, but in the second year with my support provider off-campus, we only met once a month plus a few phone calls.” Similarly, another teacher (ranked low in CFASST engagement) reports a situation that is the reverse of that described by most other beginning teachers:
My first support provider was not on-site but came religiously. She was very helpful! She set aside scheduled times without interruptions…could always be contacted. My second support provider was on-site, but was “fly-by-night” with lots of schedule conflicts, and meetings before and after school seemed to always conflict with our schedules. The times were really used minimally (Teacher #11715).
As can be seen from her responses, it is clear that simply having a support provider on-site doesn’t guarantee more or better interactions. Perhaps it is the support provider and his/her commitment to the teacher rather than the location that determines the amount of time spent together. There is one teacher’s response that sheds light on that assumption. This teacher had
IAIPSL Study, Report 1: Beginning Teachers’ Engagement with BTSA/CFASST 22
the same support provider for both years, but the support provider was on-site only during the first year. During the first year, they met more often (on a weekly basis) than during the second year, when they met only about seven times for about 45 minutes each time. Thus, even within the same relationship, the time spent together was impacted by the fact that the support provider moved off-site. (One additional confounding factor could be that the support provider felt the teacher did not need as much support in the second year and thus did not feel the need to spend as much time together.)
One final note about having support providers on site: Seven teachers volunteered that their support providers were not only on the same campus but also in the same building (two teachers) or on the same hall (five teachers). They frequently commented on how beneficial it was to them to have someone “right next door” to turn to for immediate advice or assistance.
Frequency of Meetings Between Beginning Teachers and Support Providers
In general, support providers met with beginning teachers at least monthly, with most teachers meeting at least every two weeks or once a week. A small percentage (3%) of the teachers met with their support providers less than once a month in the first year, with 6% meeting with their support providers less than once a month in the second year. Teachers with support providers at the same school often met informally on a daily or several times a week basis—over lunch, in the hallway, after school, and/or at school meetings. In general, meetings did become less frequent in the second year, but most beginning teachers still met with their support providers formally anywhere from two to four times per month, as shown in Figure 3.
0
5
10
15
20
25
30
35
40
45
Daily 2 x Week Weekly 2 x Month Monthly < Monthly
Year 1Year 2
Figure 3. Percentages of Beginning Teachers by Frequency of Meetings with Support Providers. Note: Daily and twice-weekly contacts are informal; all others are formal contacts. Beginning teachers made a distinction between formal and informal meetings with their support providers. Teachers with support providers on-site were likely to report having frequent informal interactions. These informal contacts were frequently used to talk about procedural matters or classroom management, rather than to discuss CFASST activities. One teacher noted that she
IAIPSL Study, Report 1: Beginning Teachers’ Engagement with BTSA/CFASST 23
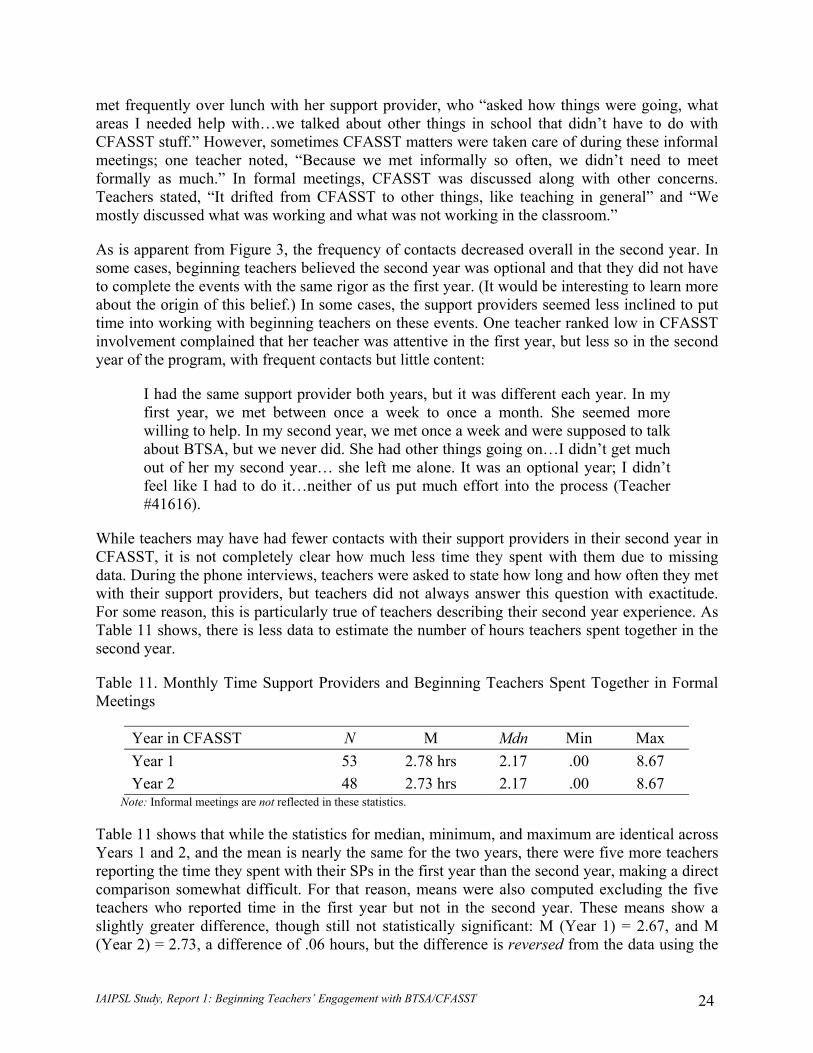
met frequently over lunch with her support provider, who “asked how things were going, what areas I needed help with…we talked about other things in school that didn’t have to do with CFASST stuff.” However, sometimes CFASST matters were taken care of during these informal meetings; one teacher noted, “Because we met informally so often, we didn’t need to meet formally as much.” In formal meetings, CFASST was discussed along with other concerns. Teachers stated, “It drifted from CFASST to other things, like teaching in general” and “We mostly discussed what was working and what was not working in the classroom.”
As is apparent from Figure 3, the frequency of contacts decreased overall in the second year. In some cases, beginning teachers believed the second year was optional and that they did not have to complete the events with the same rigor as the first year. (It would be interesting to learn more about the origin of this belief.) In some cases, the support providers seemed less inclined to put time into working with beginning teachers on these events. One teacher ranked low in CFASST involvement complained that her teacher was attentive in the first year, but less so in the second year of the program, with frequent contacts but little content:
I had the same support provider both years, but it was different each year. In my first year, we met between once a week to once a month. She seemed more willing to help. In my second year, we met once a week and were supposed to talk about BTSA, but we never did. She had other things going on…I didn’t get much out of her my second year… she left me alone. It was an optional year; I didn’t feel like I had to do it…neither of us put much effort into the process (Teacher #41616).
While teachers may have had fewer contacts with their support providers in their second year in CFASST, it is not completely clear how much less time they spent with them due to missing data. During the phone interviews, teachers were asked to state how long and how often they met with their support providers, but teachers did not always answer this question with exactitude. For some reason, this is particularly true of teachers describing their second year experience. As Table 11 shows, there is less data to estimate the number of hours teachers spent together in the second year.
Table 11. Monthly Time Support Providers and Beginning Teachers Spent Together in Formal Meetings
Note: Informal meetings are not reflected in these statistics.
Year in CFASST N M Mdn Min Max Year 1 53 2.78 hrs 2.17 .00 8.67 Year 2 48 2.73 hrs 2.17 .00 8.67
Table 11 shows that while the statistics for median, minimum, and maximum are identical across Years 1 and 2, and the mean is nearly the same for the two years, there were five more teachers reporting the time they spent with their SPs in the first year than the second year, making a direct comparison somewhat difficult. For that reason, means were also computed excluding the five teachers who reported time in the first year but not in the second year. These means show a slightly greater difference, though still not statistically significant: M (Year 1) = 2.67, and M (Year 2) = 2.73, a difference of .06 hours, but the difference is reversed from the data using the
IAIPSL Study, Report 1: Beginning Teachers’ Engagement with BTSA/CFASST 24
additional five teachers. On further examination of the data, it appears that there were two teachers whose time with support providers increased substantially in the second year (from 1.5 to 6.5 hours per month). Since it is clear that overall the frequency of contacts diminished somewhat (see Figure 3), it is likely that there was less time spent together in formal meetings in the second year of the CFASST program.
Support Providers at Same Grade Level
Interviewees volunteered information about whether their support providers were on the same grade level in 18 interviews. In the other 46 cases, this information was not offered and was not specifically asked in the interviews. Nine teachers who were ranked high engagement provided this information; five of them (56%) reported support providers at the same grade level. Four teachers who were ranked low engagement provided information on the grade level of their support providers; two of these (50%) had at least one support provider (over two years) who taught at the same grade level. Thus, high and low engagement teachers were about equally likely to have a support provider on the same grade level. Given that only 18 teachers volunteered information about their support provider being on the same grade level or not, it may not make sense to place too much stock in these trends. Nevertheless, the interview responses suggest that some teachers have strong opinions on this subject, as can be seen in the following excerpts. One middle-ranked 5th grade teacher reported her frustration with having a support provider on a different grade level:
[My first support provider] also taught 5th grade. My second year, the support provider was a first grade teacher. I did everything on my own. Since our grade levels were different, the support provider’s answer was “I don’t really know—I teach first grade.” Grade level is very important for the second year. So the first grade teacher didn’t work out even if she was on-site. I could go to her about behavior problems, but not BTSA (Teacher #20519).
Other low-ranked teachers stated: “I wish my support provider had been on-site and at my grade level; it made the program tough, and I went to other mentors for help a lot, too, who weren’t with BTSA” and “She wasn’t at my grade level so I’d go to others in my grade level to get help” and “I was supposed to be getting all this help from my district [support provider], and I was helped more by my grade-level teachers than her by far.” Thus, it is clear that many teachers who did not have a support provider at their grade level were forced to seek help and advice from other sources, usually teachers at their schools who taught at the same grade level. Although these other teachers may have been able to help with content and grade-specific needs of the beginning teacher, it is most likely that these teachers were not trained in CFASST and thus could not necessarily help them with their CFASST induction experience.
One high-ranked teacher discussed at length the importance of having a support provider on the same grade level:
My mentor teacher was fabulous. There was so much I gained from her in having her in the same grade level and being able to have a sounding board on the CFASST events…[It’s good to have] at least the same person both years and someone in your grade level, so when they come in, they can say “This is great!
IAIPSL Study, Report 1: Beginning Teachers’ Engagement with BTSA/CFASST 25
How about this?” and it applies to you, rather than a 6th grade teacher trying to tell a 2nd grade teacher about discipline when it’s two different things. I really enjoyed my experience and having someone connected to where I was (Teacher #31409).
One teacher reported that her BTSA program switched her to a different support provider who was at her grade level when her first support provider changed grade levels. Within that BTSA program, it is apparently a rule that teachers have a support provider at their own grade level. However, not all districts are willing (or perhaps able) to limit support provider assignments to the same grade or even the same school. One beginning teacher who was assigned a new support provider at a school “farthest away from me” complained: “It seems like the principal should assign someone at your grade level and at your school or in a class next door; it was important my first year for her to be on-site so I could have access when I needed her.” (Note also that the teacher believed that is the principal who assigns the support provider. We have no way of knowing whether this was the actual practice in the program or merely the beginning teacher’s perception.)
Not all teachers found having a support provider at a different grade level problematic, particularly if the support provider had previous experience at their level or some other quality that made them valuable to the beginning teacher. A high engagement teacher stated:
It [the assignment of her support provider] was a good match. She had the same demographics of students as I did, so she knew what to do even if the grade level was different. We met once a week by phone or email…sometimes in person. She was at a different school and I took a BTSA day to watch her class; she taught Spanish immersion and I understood what it was like for my kids who didn’t speak English to be in a class that was taught in a foreign language all day (Teacher #50422).
Another high engagement beginning teacher thought that having a teacher on a different grade level was actually beneficial, but for a specific reason:
She was teaching 2nd grade gifted and talented, and I was teaching 3rd grade gifted and talented, so it worked out perfect…I was really lucky to have someone who was a grade level down from myself. I went in to observe her during my time in BTSA…I used quite a few things she uses with her kids that have been working for her, and I brought that into my own classroom also (Teacher #60318).
In general, it seems that having a support provider at the same grade level is considered a real plus for new teachers. In specific cases, where there are other factors that are as important (or even more important) than grade level, having a support provider at a different grade level can be seen as acceptable. In some districts where experienced teachers who can serve as support providers are in short supply or are overloaded with beginning teachers, it may be difficult to ensure optimal assignments (i.e., same grade level, same school, even same hallway). In these cases, matching teachers on other factors may be necessary. It would be interesting in a future
IAIPSL Study, Report 1: Beginning Teachers’ Engagement with BTSA/CFASST 26
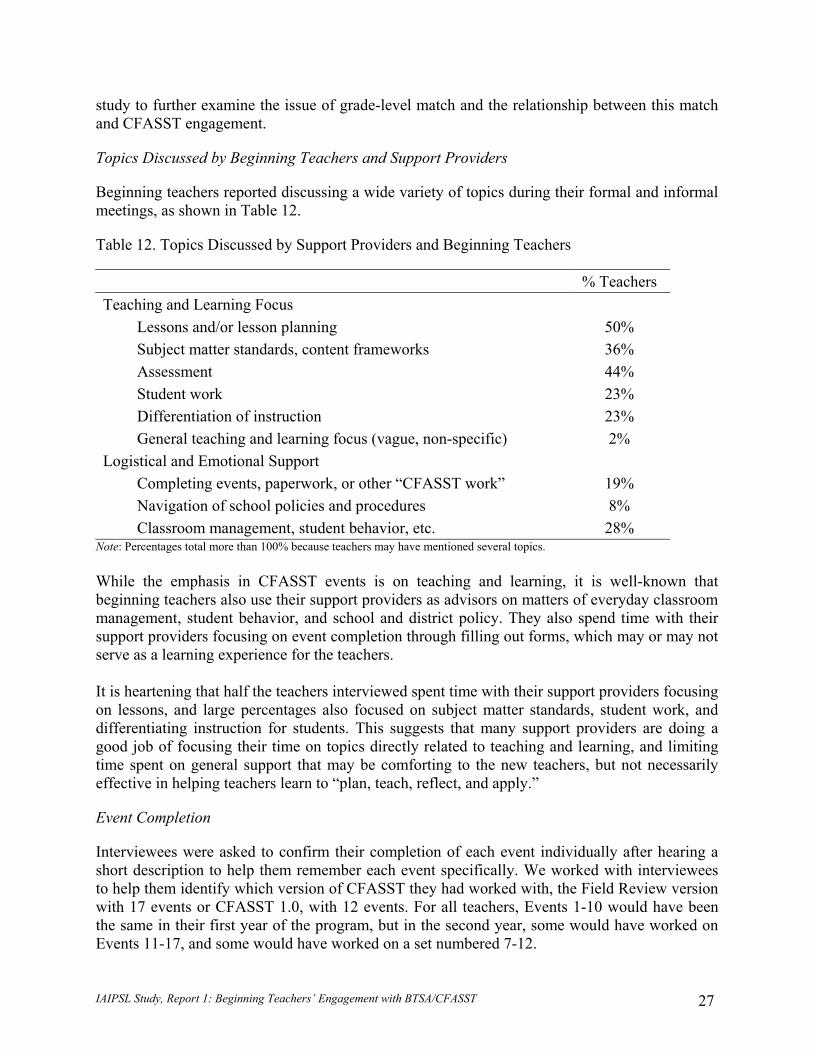
study to further examine the issue of grade-level match and the relationship between this match and CFASST engagement.
Topics Discussed by Beginning Teachers and Support Providers
Beginning teachers reported discussing a wide variety of topics during their formal and informal meetings, as shown in Table 12.
Table 12. Topics Discussed by Support Providers and Beginning Teachers
% Teachers Teaching and Learning Focus Lessons and/or lesson planning 50% Subject matter standards, content frameworks 36% Assessment 44% Student work 23% Differentiation of instruction 23% General teaching and learning focus (vague, non-specific) 2% Logistical and Emotional Support Completing events, paperwork, or other “CFASST work” 19% Navigation of school policies and procedures 8% Classroom management, student behavior, etc. 28%
Note: Percentages total more than 100% because teachers may have mentioned several topics. While the emphasis in CFASST events is on teaching and learning, it is well-known that beginning teachers also use their support providers as advisors on matters of everyday classroom management, student behavior, and school and district policy. They also spend time with their support providers focusing on event completion through filling out forms, which may or may not serve as a learning experience for the teachers. It is heartening that half the teachers interviewed spent time with their support providers focusing on lessons, and large percentages also focused on subject matter standards, student work, and differentiating instruction for students. This suggests that many support providers are doing a good job of focusing their time on topics directly related to teaching and learning, and limiting time spent on general support that may be comforting to the new teachers, but not necessarily effective in helping teachers learn to “plan, teach, reflect, and apply.”
Event Completion
Interviewees were asked to confirm their completion of each event individually after hearing a short description to help them remember each event specifically. We worked with interviewees to help them identify which version of CFASST they had worked with, the Field Review version with 17 events or CFASST 1.0, with 12 events. For all teachers, Events 1-10 would have been the same in their first year of the program, but in the second year, some would have worked on Events 11-17, and some would have worked on a set numbered 7-12.
IAIPSL Study, Report 1: Beginning Teachers’ Engagement with BTSA/CFASST 27
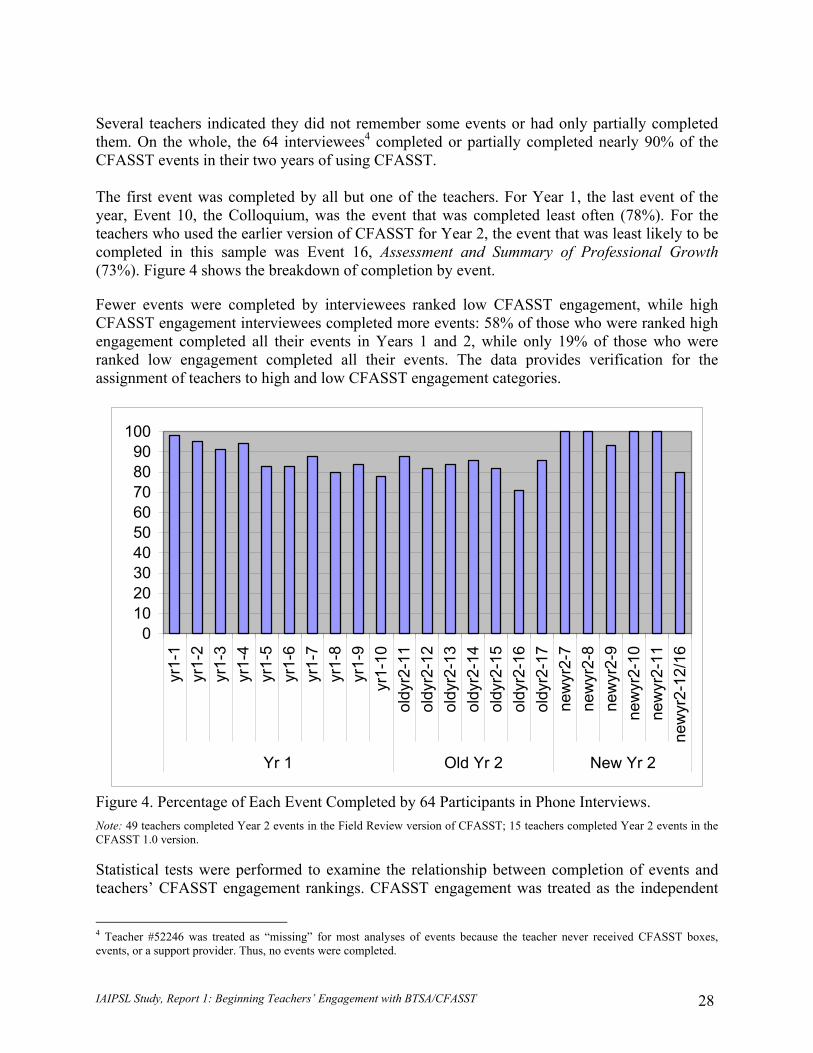
Several teachers indicated they did not remember some events or had only partially completed them. On the whole, the 64 interviewees4 completed or partially completed nearly 90% of the CFASST events in their two years of using CFASST. The first event was completed by all but one of the teachers. For Year 1, the last event of the year, Event 10, the Colloquium, was the event that was completed least often (78%). For the teachers who used the earlier version of CFASST for Year 2, the event that was least likely to be completed in this sample was Event 16, Assessment and Summary of Professional Growth (73%). Figure 4 shows the breakdown of completion by event.
Fewer events were completed by interviewees ranked low CFASST engagement, while high CFASST engagement interviewees completed more events: 58% of those who were ranked high engagement completed all their events in Years 1 and 2, while only 19% of those who were ranked low engagement completed all their events. The data provides verification for the assignment of teachers to high and low CFASST engagement categories.
0102030405060708090
100
yr1-
1yr
1-2
yr1-
3yr
1-4
yr1-
5yr
1-6
yr1-
7yr
1-8
yr1-
9yr
1-10
oldy
r2-1
1ol
dyr2
-12
oldy
r2-1
3ol
dyr2
-14
oldy
r2-1
5ol
dyr2
-16
oldy
r2-1
7ne
wyr
2-7
new
yr2-
8ne
wyr
2-9
new
yr2-
10ne
wyr
2-11
new
yr2-
12/1
6
Yr 1 Old Yr 2 New Yr 2
Figure 4. Percentage of Each Event Completed by 64 Participants in Phone Interviews. Note: 49 teachers completed Year 2 events in the Field Review version of CFASST; 15 teachers completed Year 2 events in the CFASST 1.0 version. Statistical tests were performed to examine the relationship between completion of events and teachers’ CFASST engagement rankings. CFASST engagement was treated as the independent
IAIPSL Study, Report 1: Beginning Teachers’ Engagement with BTSA/CFASST 28
4 Teacher #52246 was treated as “missing” for most analyses of events because the teacher never received CFASST boxes, events, or a support provider. Thus, no events were completed.
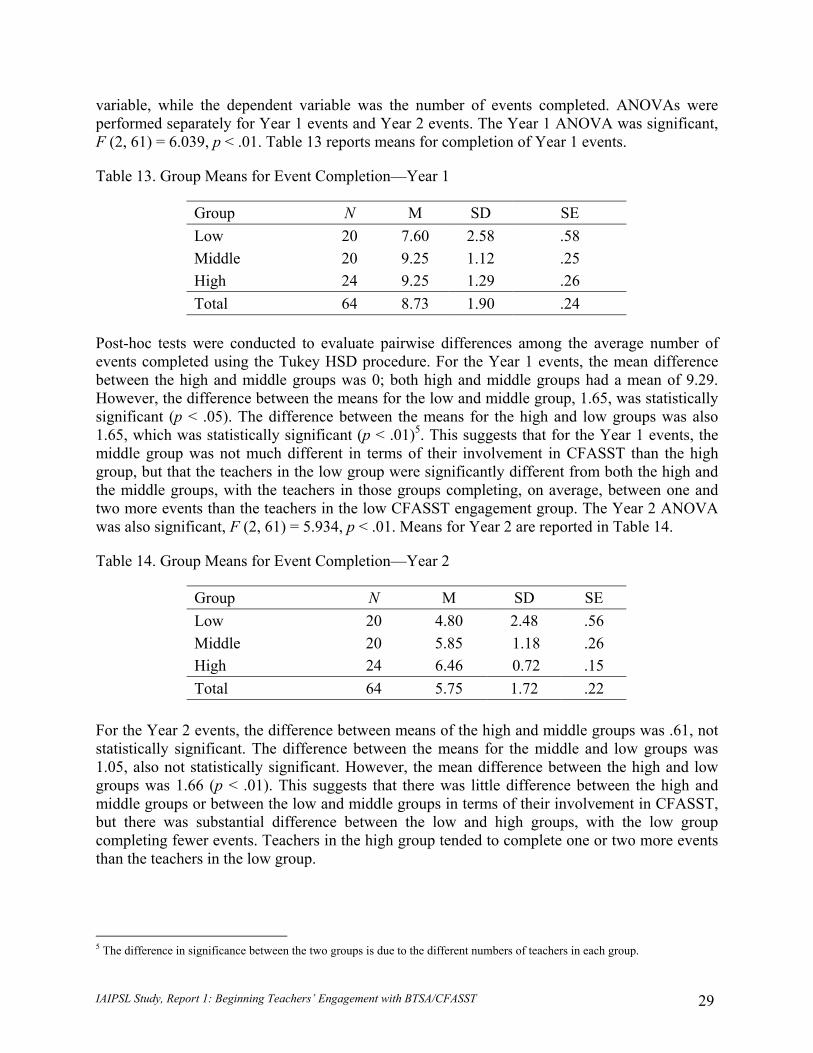
variable, while the dependent variable was the number of events completed. ANOVAs were performed separately for Year 1 events and Year 2 events. The Year 1 ANOVA was significant, F (2, 61) = 6.039, p < .01. Table 13 reports means for completion of Year 1 events.
Table 13. Group Means for Event Completion—Year 1
Group N M SD SE Low 20 7.60 2.58 .58 Middle 20 9.25 1.12 .25 High 24 9.25 1.29 .26 Total 64 8.73 1.90 .24
Post-hoc tests were conducted to evaluate pairwise differences among the average number of events completed using the Tukey HSD procedure. For the Year 1 events, the mean difference between the high and middle groups was 0; both high and middle groups had a mean of 9.29. However, the difference between the means for the low and middle group, 1.65, was statistically significant (p < .05). The difference between the means for the high and low groups was also 1.65, which was statistically significant (p < .01)5. This suggests that for the Year 1 events, the middle group was not much different in terms of their involvement in CFASST than the high group, but that the teachers in the low group were significantly different from both the high and the middle groups, with the teachers in those groups completing, on average, between one and two more events than the teachers in the low CFASST engagement group. The Year 2 ANOVA was also significant, F (2, 61) = 5.934, p < .01. Means for Year 2 are reported in Table 14.
Table 14. Group Means for Event Completion—Year 2
Group N M SD SE Low 20 4.80 2.48 .56 Middle 20 5.85 1.18 .26 High 24 6.46 0.72 .15 Total 64 5.75 1.72 .22
For the Year 2 events, the difference between means of the high and middle groups was .61, not statistically significant. The difference between the means for the middle and low groups was 1.05, also not statistically significant. However, the mean difference between the high and low groups was 1.66 (p < .01). This suggests that there was little difference between the high and middle groups or between the low and middle groups in terms of their involvement in CFASST, but there was substantial difference between the low and high groups, with the low group completing fewer events. Teachers in the high group tended to complete one or two more events than the teachers in the low group.
5 The difference in significance between the two groups is due to the different numbers of teachers in each group.
IAIPSL Study, Report 1: Beginning Teachers’ Engagement with BTSA/CFASST 29
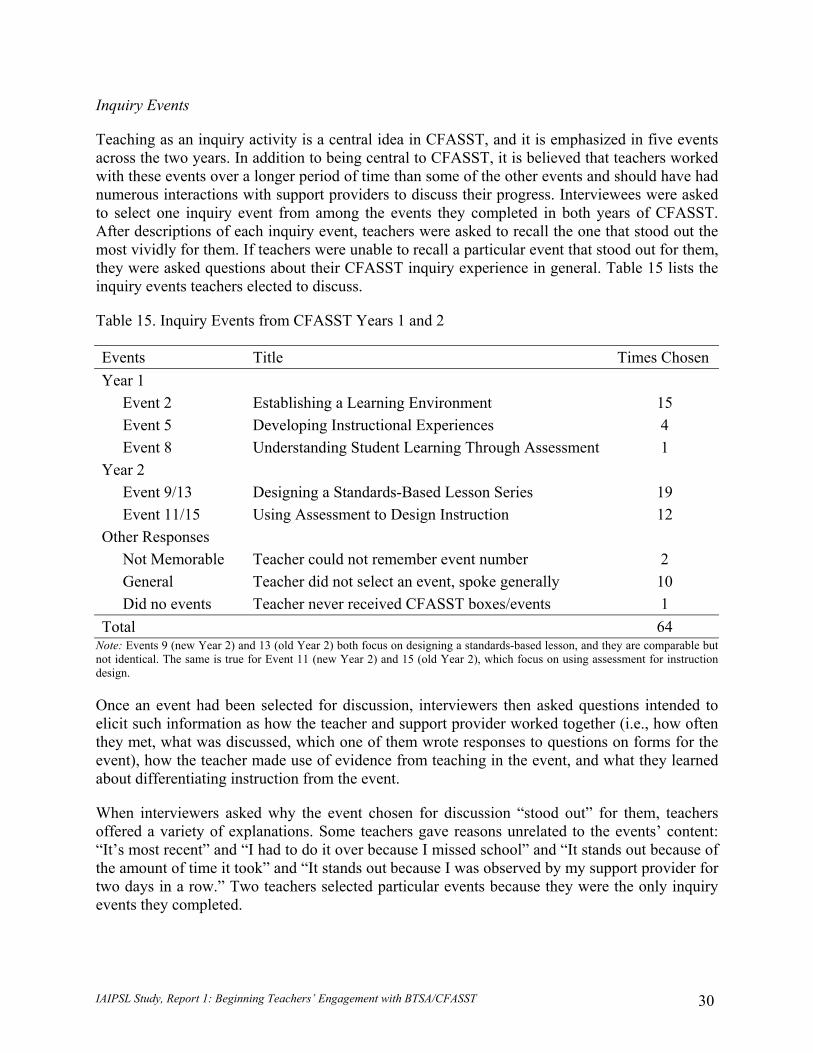
Inquiry Events
Teaching as an inquiry activity is a central idea in CFASST, and it is emphasized in five events across the two years. In addition to being central to CFASST, it is believed that teachers worked with these events over a longer period of time than some of the other events and should have had numerous interactions with support providers to discuss their progress. Interviewees were asked to select one inquiry event from among the events they completed in both years of CFASST. After descriptions of each inquiry event, teachers were asked to recall the one that stood out the most vividly for them. If teachers were unable to recall a particular event that stood out for them, they were asked questions about their CFASST inquiry experience in general. Table 15 lists the inquiry events teachers elected to discuss.
Table 15. Inquiry Events from CFASST Years 1 and 2
Events Title Times Chosen Year 1 Event 2 Establishing a Learning Environment 15 Event 5 Developing Instructional Experiences 4 Event 8 Understanding Student Learning Through Assessment 1 Year 2 Event 9/13 Designing a Standards-Based Lesson Series 19 Event 11/15 Using Assessment to Design Instruction 12 Other Responses Not Memorable Teacher could not remember event number 2 General Teacher did not select an event, spoke generally 10 Did no events Teacher never received CFASST boxes/events 1 Total 64
Note: Events 9 (new Year 2) and 13 (old Year 2) both focus on designing a standards-based lesson, and they are comparable but not identical. The same is true for Event 11 (new Year 2) and 15 (old Year 2), which focus on using assessment for instruction design.
Once an event had been selected for discussion, interviewers then asked questions intended to elicit such information as how the teacher and support provider worked together (i.e., how often they met, what was discussed, which one of them wrote responses to questions on forms for the event), how the teacher made use of evidence from teaching in the event, and what they learned about differentiating instruction from the event.
When interviewers asked why the event chosen for discussion “stood out” for them, teachers offered a variety of explanations. Some teachers gave reasons unrelated to the events’ content: “It’s most recent” and “I had to do it over because I missed school” and “It stands out because of the amount of time it took” and “It stands out because I was observed by my support provider for two days in a row.” Two teachers selected particular events because they were the only inquiry events they completed.
IAIPSL Study, Report 1: Beginning Teachers’ Engagement with BTSA/CFASST 30
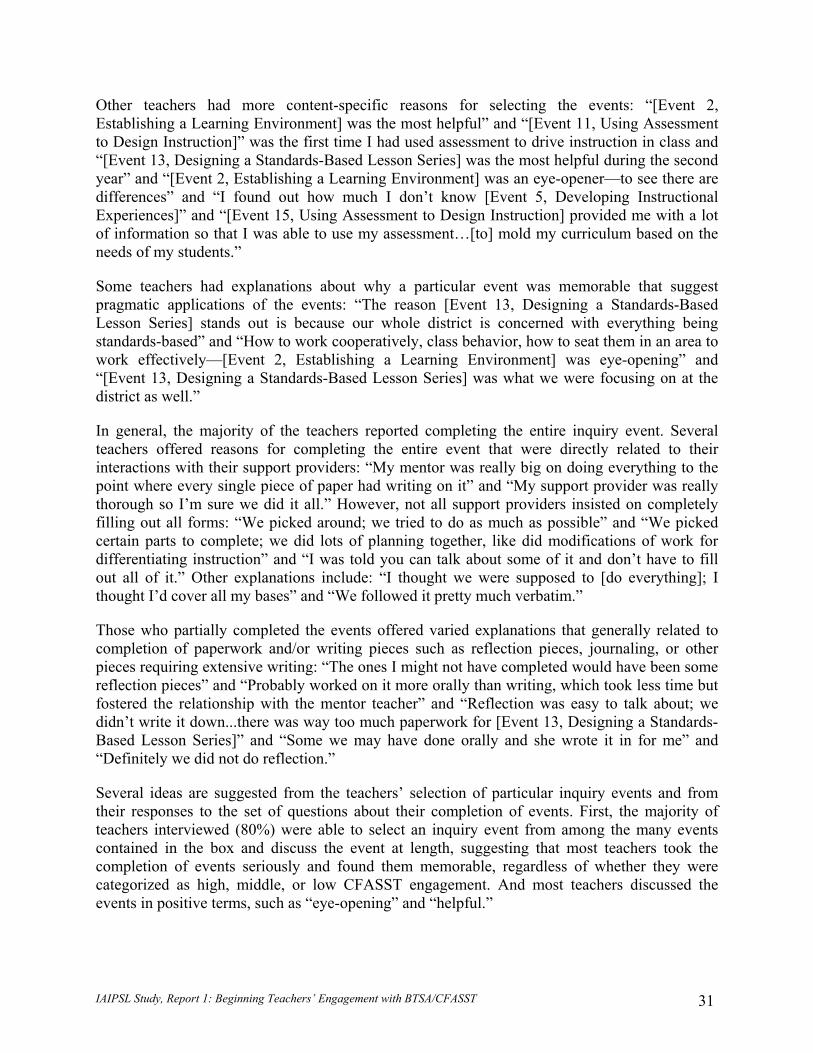
Other teachers had more content-specific reasons for selecting the events: “[Event 2, Establishing a Learning Environment] was the most helpful” and “[Event 11, Using Assessment to Design Instruction]” was the first time I had used assessment to drive instruction in class and “[Event 13, Designing a Standards-Based Lesson Series] was the most helpful during the second year” and “[Event 2, Establishing a Learning Environment] was an eye-opener—to see there are differences” and “I found out how much I don’t know [Event 5, Developing Instructional Experiences]” and “[Event 15, Using Assessment to Design Instruction] provided me with a lot of information so that I was able to use my assessment…[to] mold my curriculum based on the needs of my students.”
Some teachers had explanations about why a particular event was memorable that suggest pragmatic applications of the events: “The reason [Event 13, Designing a Standards-Based Lesson Series] stands out is because our whole district is concerned with everything being standards-based” and “How to work cooperatively, class behavior, how to seat them in an area to work effectively—[Event 2, Establishing a Learning Environment] was eye-opening” and “[Event 13, Designing a Standards-Based Lesson Series] was what we were focusing on at the district as well.”
In general, the majority of the teachers reported completing the entire inquiry event. Several teachers offered reasons for completing the entire event that were directly related to their interactions with their support providers: “My mentor was really big on doing everything to the point where every single piece of paper had writing on it” and “My support provider was really thorough so I’m sure we did it all.” However, not all support providers insisted on completely filling out all forms: “We picked around; we tried to do as much as possible” and “We picked certain parts to complete; we did lots of planning together, like did modifications of work for differentiating instruction” and “I was told you can talk about some of it and don’t have to fill out all of it.” Other explanations include: “I thought we were supposed to [do everything]; I thought I’d cover all my bases” and “We followed it pretty much verbatim.”
Those who partially completed the events offered varied explanations that generally related to completion of paperwork and/or writing pieces such as reflection pieces, journaling, or other pieces requiring extensive writing: “The ones I might not have completed would have been some reflection pieces” and “Probably worked on it more orally than writing, which took less time but fostered the relationship with the mentor teacher” and “Reflection was easy to talk about; we didn’t write it down...there was way too much paperwork for [Event 13, Designing a Standards-Based Lesson Series]” and “Some we may have done orally and she wrote it in for me” and “Definitely we did not do reflection.”
Several ideas are suggested from the teachers’ selection of particular inquiry events and from their responses to the set of questions about their completion of events. First, the majority of teachers interviewed (80%) were able to select an inquiry event from among the many events contained in the box and discuss the event at length, suggesting that most teachers took the completion of events seriously and found them memorable, regardless of whether they were categorized as high, middle, or low CFASST engagement. And most teachers discussed the events in positive terms, such as “eye-opening” and “helpful.”
IAIPSL Study, Report 1: Beginning Teachers’ Engagement with BTSA/CFASST 31
Second, teachers across all groups were more likely to select Event 13, Designing a Standards-Based Lesson Series, as the event that was most memorable for them, and in several cases, they noted that it was memorable because it coincided directly with what they were expected to do within their school districts. California’s focus on standards-based instruction and the increasing emphasis on standards-based test items in California’s standardized testing system have likely directly increased the usefulness for teachers of completing this particular event.
Third, after Event 13, teachers were most likely to select Event 2, Establishing a Learning Environment. Several teachers reported that this event was particularly useful because they needed the sort of guidance provided by this event when they were new to the profession. Teachers mentioned a number of specific areas where the event was most useful: establishing classroom organization, setting up a social environment for students, managing student behavior, grouping students, modifying instruction for different learners, working cooperatively, setting up the classroom, focusing on diversity, gearing teaching toward students’ prior learning, establishing schedules/routines, modeling/explaining expectations, consistency, and identifying problem areas in the classroom. The fact that teachers who selected this event came from high, middle, and low CFASST engagement levels suggests that this event, which is completed very early in the teacher’s first year, was important in the development of many teachers, regardless of the level of their continuing engagement with CFASST. Event 2 was one of the most likely to be completed by all teachers, with 95% of the teachers interviewed indicating that they had completed the event.
As noted above, teachers from all engagement levels were likely to find Event 2 useful and memorable. One teacher who was rated high in CFASST engagement had a particularly compelling reason for remembering this event, stating:
I came [to third grade] in the 10th day of school, and the children were from other classes that were chosen by their teachers because they were “in their way.” The students were taken to a portable—way out away from other third grade classes. The students were angry, and felt isolated and removed. My learning environment was so important to them because I had to make it a safe place for them to learn so they could develop (Teacher #50422).
Understanding of Differentiation
After discussing a particular event, teachers were asked, “What did you learn about differentiating instruction for different kinds of learners from this event?” Teachers who had elected to discuss events generally were asked, “What did you learn about differentiating instruction for different kinds of learners from CFASST?” Table 16 describes the levels of understanding and the numbers of teachers in each category.
IAIPSL Study, Report 1: Beginning Teachers’ Engagement with BTSA/CFASST 32
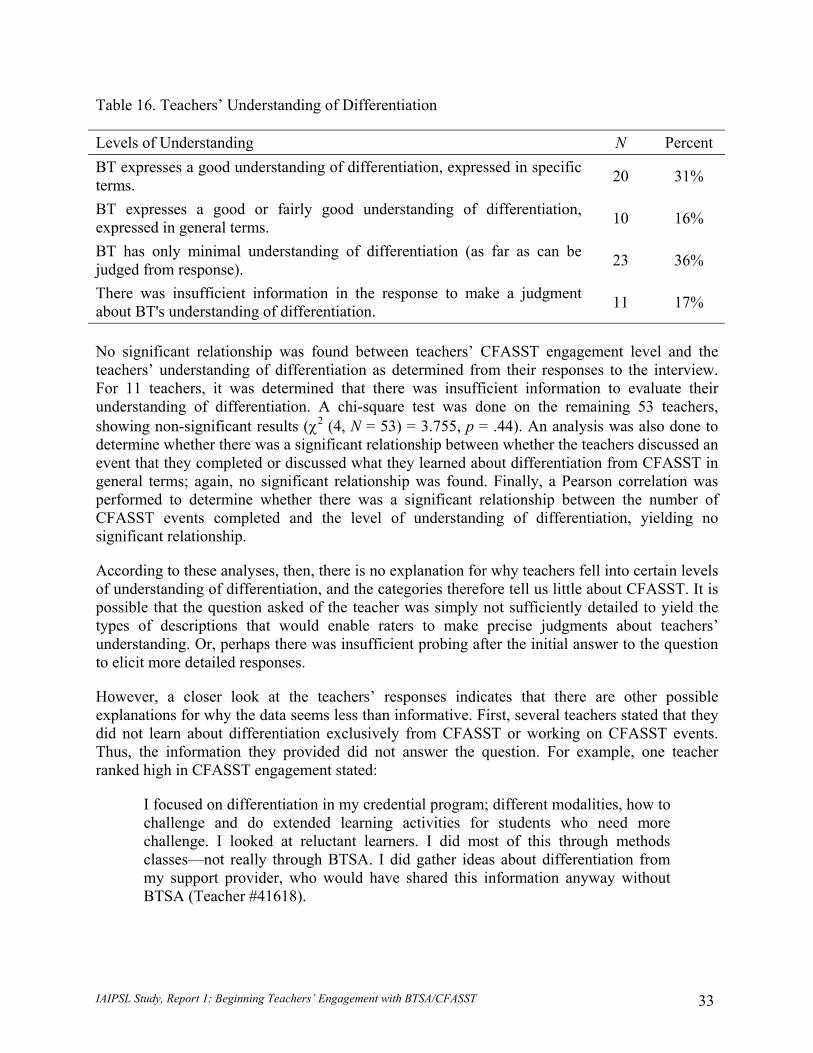
Table 16. Teachers’ Understanding of Differentiation
Levels of Understanding N Percent BT expresses a good understanding of differentiation, expressed in specific terms. 20 31%
BT expresses a good or fairly good understanding of differentiation, expressed in general terms. 10 16%
BT has only minimal understanding of differentiation (as far as can be judged from response). 23 36%
There was insufficient information in the response to make a judgment about BT's understanding of differentiation. 11 17%
No significant relationship was found between teachers’ CFASST engagement level and the teachers’ understanding of differentiation as determined from their responses to the interview. For 11 teachers, it was determined that there was insufficient information to evaluate their understanding of differentiation. A chi-square test was done on the remaining 53 teachers, showing non-significant results (χ2 (4, N = 53) = 3.755, p = .44). An analysis was also done to determine whether there was a significant relationship between whether the teachers discussed an event that they completed or discussed what they learned about differentiation from CFASST in general terms; again, no significant relationship was found. Finally, a Pearson correlation was performed to determine whether there was a significant relationship between the number of CFASST events completed and the level of understanding of differentiation, yielding no significant relationship.
According to these analyses, then, there is no explanation for why teachers fell into certain levels of understanding of differentiation, and the categories therefore tell us little about CFASST. It is possible that the question asked of the teacher was simply not sufficiently detailed to yield the types of descriptions that would enable raters to make precise judgments about teachers’ understanding. Or, perhaps there was insufficient probing after the initial answer to the question to elicit more detailed responses.
However, a closer look at the teachers’ responses indicates that there are other possible explanations for why the data seems less than informative. First, several teachers stated that they did not learn about differentiation exclusively from CFASST or working on CFASST events. Thus, the information they provided did not answer the question. For example, one teacher ranked high in CFASST engagement stated:
I focused on differentiation in my credential program; different modalities, how to challenge and do extended learning activities for students who need more challenge. I looked at reluctant learners. I did most of this through methods classes—not really through BTSA. I did gather ideas about differentiation from my support provider, who would have shared this information anyway without BTSA (Teacher #41618).
IAIPSL Study, Report 1: Beginning Teachers’ Engagement with BTSA/CFASST 33
Similar responses, with teachers crediting college courses, credential programs, workshops, and district training for their understanding of differentiation (all or in part), were obtained from 13 of the 64 respondents, or about 20%. A few of them did credit CFASST in part with their understanding of differentiation, so those could be categorized in terms of their understanding, while some clearly did not believe CFASST had contributed to their understanding of differentiation. Still others were perplexed about how much of their understanding of differentiation could be attributed to CFASST events: “It’s hard to separate out what I know from district training or CFASST.”
Another problem with the data for this question is that the question did not ask teachers to be specific about what they learned about differentiation. Thus, some teachers responded with vague or general statements that did little to reveal their understandings about differentiation, such as: “I learned that you have to differentiate” and “I learned that it is an ongoing process that we do every minute of every day” and “I learned it is very important for success” and “I learned that you need to do it, and it’s a hard thing to do” and “I learned that it is really hard” and “I learned that it works; it’s easier to see growth and to focus on what students really need.” It is clear from responses like these that the respondents did not necessarily lack understanding about differentiation, only that the terms they used to express what they learned were so vague that it is impossible to know what they did or did not understand.
Nevertheless, in spite of the difficulty in determining how well teachers participating in CFASST understand differentiation, or in attributing their understanding to its proper source, a number of teachers indicated that they benefited from working on the events in terms of their understanding of differentiation. For example, one high engagement teacher stated: “I didn’t learn so much about [differentiation] from this event. I focused on differentiation during college courses. But sometimes these events would show me which kids needed differentiation” (Teacher #20931). Thus, CFASST contributed to her ability to differentiate among her students (an application of knowledge) if not necessarily adding to her theoretical understanding of differentiation.
Another teacher ranked high on CFASST engagement was more explicit about how a particular event (Event 2, Establishing a Learning Environment) helped her with differentiation, even though she did not attribute her understanding of differentiation to the event itself:
It’s hard to say [what I learned about differentiation] just from an event. I know what I do now from it. It helped me first understand who was in my class. Second, it helped me put together guided reading groups to help me understand what kind of help I needed as well as what students needed (Teacher #40407).
Many teachers did credit CFASST and/or specific events with their understanding of differentiation: “The big thing I learned [in Event 13, Designing a Standards-Based Lesson Series] was differentiation!” and “I learned more about the students I focused on [in Event 11, Using Assessment to Design Instruction]; I wish I could have focused on all 32 students.” Along with these teachers, many more teachers reported that they learned something about differentiation from CFASST or from the event. Thus, the evidence from the interviews supports the idea that most teachers’ understanding of CFASST did benefit from working on the events, but little was learned from attempting to further analyze this finding.
IAIPSL Study, Report 1: Beginning Teachers’ Engagement with BTSA/CFASST 34
Helpfulness of CFASST
There were many different aspects of the CFASST experience that teachers interviewed found helpful. Across all CFASST engagement levels, 45% of teachers volunteered the word “helpful” to describe some aspect of their CFASST experience. A search through the text of the interviews for all uses of the term “helpful” revealed three main areas that teachers identified as being particularly helpful: interactions with support providers, attending meetings or trainings with other BTSA participants, and the CFASST events.
Regardless of engagement level, teachers volunteered that the events themselves were helpful. While teachers frequently praised their support providers for the mentoring they provided, they also stated that working through the events was particularly helpful, though not all events were equally useful. For instance, 33% of teachers ranked high in CFASST engagement indicated they found one or more events helpful, while 29% of teachers ranked in the middle group and 25% of teachers ranked in the low group responded likewise. It may be relevant that the low group was somewhat less likely to volunteer that they found the events helpful. Recall that the low group was less likely to find any of the events memorable, much less helpful.
One high engagement teacher provided a well-articulated description of how the events were helpful:
Certain CFASST events I thought were more helpful than others. Some of them I felt like it was a lot of paperwork. But the ones where she would come in and observe me and we reflected and met again and she’d observe another lesson. I thought those were really beneficial because she would come in and see my teaching style and say hey this was great, and you felt better because someone you respected was saying you did a good job but she’d say, but let’s look at this, I saw this, what do you think about this? So you’re fine-tuning and it’s in a helpful way, it’s not high pressure…(Teacher #31409).
Another perspective offered by a teacher (from the low CFASST engagement group) focuses on why the events were helpful:
The events were helpful since I could get to the core of different things like assessment and student work. I would not have done it without the events; when I was made to do it, it was helpful, but I would not have thought of it on my own until much later…When you’re asked to turn something in, you do it much better, so the experience was much more beneficial (Teacher #42510).
Teachers also volunteered that their interactions with support providers were helpful. In the high engagement group, 71% said their support provider contacts were helpful, while 60% of the middle group and 25% of the low group made similar statements. These percentages suggest that the low engagement group did not have experiences with their support providers that were as helpful as those of the other two groups. One could speculate that this might be because the low engagement teachers were less involved with CFASST in general and thus had fewer interactions with their SPs. There is also the possibility that contacts were as frequent, but that this group of teachers simply found those contacts to be less helpful.
IAIPSL Study, Report 1: Beginning Teachers’ Engagement with BTSA/CFASST 35
A teacher ranked high in CFASST engagement seemed to feel that her support provider was the most helpful part of program, though she admitted that the events were useful, too:
Overall, the BTSA program was helpful because of the support provider. The support provider was on-site, and daily contact was useful. As a new teacher, you are already so stressed so the CFASST box added more stress than anything else. Using the CFASST box did help me classify my students and try to look at their needs a little more, to understand that not every child will have the same needs, or the same background (Teacher #40815).
Teachers also volunteered that their interactions with other new teachers were helpful, including attending professional development trainings, seminars, and meeting with other teachers participating in BTSA. Teachers described their interactions with their peers as especially helpful, noting, “It’s helpful to know you are in the same boat as others when you are frustrated,” and “Going through the experience with other teachers was helpful,” and “It’s helpful to meet with people who were also in their first years of teaching and who had similar concerns.”
Beginning Teacher Complaints About BTSA/CFASST
Complaints about “too much paperwork” were very common among the phone interview participants. Thirty-three percent of the teachers interviewed complained about the volume of paperwork required for CFASST as a whole. Some of their comments are especially saddening because they focus on a very important point: Time spent doing paperwork means time that can’t be used in more constructive ways. Obviously, CFASST “paperwork” is designed to be constructive, particularly in allowing teachers to reflect on their activities. But teachers who complained about the paperwork tended to feel that it kept them from the activities that would have been more useful to them, as shown in the following comments.
I never discussed anything with my support provider. There was no time because there was too much paperwork. She was the best support provider in the world, but there was no time to talk to her. The focus was on the forms (Teacher #20602).
[CFASST] had some influence on my teaching, but there was too much paperwork. I would have rather spent more time on discussion and note-taking rather than filling out all the paperwork. Simpler, shorter forms would have been better (Teacher #20931).
I enjoyed [CFASST], which is why I did the optional second year. Going through the same experience with other teachers was helpful. The hands-on experience (observations) was more helpful than the paperwork, which was a little much. The idea is good, but BTSA could have made it more useful or productive, not just homework (Teacher #41616).
In reflection, I can understand the thrust of BTSA. However, it didn't help me at the time. Actually, it hurt me because it didn't allow me to work on areas I really needed help with—I had to “do paperwork” (Teacher #42305).
IAIPSL Study, Report 1: Beginning Teachers’ Engagement with BTSA/CFASST 36
It is clear from these comments that many teachers are unable to see the benefits of completing the written parts of events. The paperwork concern fed into concerns about BTSA/CFASST being too time consuming, with 5% of interviewees making this complaint. Typical comments include:
My major insight [about BTSA/CFASST] was that I hate BTSA except for the great support provider! I wished there was more time for verbal interaction, rather than paperwork. Plus, there was too much lost time due to leaving school to attend trainings. I had to deal with lots of substitutes and make sub plans for them (Teacher #20602).
BTSA was honestly not very helpful. In your first year, you have so much to do and this was an added pressure and took more time, going to the monthly meeting and having to do all this stuff (Teacher #51812).
About 9% of interview teachers complained that BTSA was “repetitive.” Teachers made comments such as: “I picked certain parts to complete…I did the stuff that wasn't repetitive…a lot of stuff was a waste [of time]” and “I felt the written part of CFASST was repetitive—the questions asked the same thing over and over, and I was writing the same thing over and over.” Teachers also noted that second year events were very repetitive of first year events, and they resented having to do the same things again. Similarly, 5% of teachers complained about CFASST being “boring.” These types of complaints have come up before in other evaluations of BTSA and CFASST (Lee, 2001; Pegram, Jinks, Tregidgo, & Thompson, 2001; Storms, Wing, Jinks, Banks, & Cavazos, 2000; Thompson, 2001; WestEd, 2002). It may be necessary to address these issues either through revision of CFASST events or in training of support providers to help beginning teachers understand why repetition and the questions on the forms are useful to their growth as a teacher. However, it is also worth examining the possibility that the time commitment to BTSA/CFASST may be out of proportion with what is actually gained, when compared with other activities the beginning teacher could engage in.
Conclusions We began this report by introducing a conceptual model that focuses on the beginning teacher/support provider relationship, context, and activities within BTSA/CFASST. The model has four dimensions: 1) Support for BTSA/CFASST; 2) Support Provider Availability/Access; 3) Rapport Between Support Provider and Beginning Teacher; and 4) Substantive Focus on Teaching and Learning. We used this model to develop a survey instrument and an interview protocol to learn more about the actual experiences of BTSA/CFASST “graduates.” Using a variety of program quality measures, 78 BTSA programs were identified for survey research. Within these programs, 1,125 third year BTSA “graduates” who teach in grades 3-5 were asked to complete surveys concerning their BTSA and CFASST experiences. Responses were received from 287 teachers from 107 school districts affiliated with 78 BTSA programs. Survey results were used to calculate a “CFASST engagement score” based on the four
IAIPSL Study, Report 1: Beginning Teachers’ Engagement with BTSA/CFASST 37
dimensions named above. Respondents were classified into high, middle, or low CFASST engagement levels based on these scores. Subsequently, a sub-sample of 64 teachers, drawn from the extremes of the CFASST engagement score scale, were interviewed to verify the reliability and validity of the survey data, to provide more nuanced information about their experiences in the program, and to recruit a sample of teachers for case studies.
There are a number of interesting highlights that emerge from the study thus far:
• The survey sample, drawn from 78 BTSA programs, is surprisingly representative of elementary teachers throughout California in many important ways, such as ethnicity, gender, and school-level variables such as API score and percentage of fully credentialed teachers. This fact will add greater relevance to the findings when outcome measures become available.
• An analysis of phone interview data supported the CFASST engagement levels that were generated from the survey data. Using only six independent variables drawn from the interviews as the independent variables, and using the survey scores as the dependent variable, an R2 of .474 was achieved, which serves as confirmation of the CFASST engagement model.
• There are some school-level factors that appear to be related to CFASST engagement level, including the schools’ API score (correlates with rankings for the survey sample and for the interview sample) and the percentage of minority students in the school (correlates with rankings for the interview sample).
• The only teacher variable that relates significantly with CFASST engagement level is years of teaching experience. There are three possible reasons for this relationship: 1) more experienced teachers can spend more time on CFASST because they are spending less time on classroom management and other issues that new teachers struggle with; 2) more experienced teachers are ready developmentally to focus attention on their own growth as teachers.
• Most teachers were introduced to CFASST through a group orientation, and only about half received an individual orientation (instead of or in addition to a group orientation). A few (5%) claim that they had no orientation to CFASST at all.
• While 93% of first year BTSA/CFASST users had a support provider, 7% did not. Since CFASST was designed to be used with the assistance of a support provider, it is unfortunate that so many new teachers had to “go it alone.” If this number is representative of the entire state, the number of teachers without SPs during their first year could be in the hundreds throughout California. For second year beginning teachers, there was better news: 97% stated that they had a support provider.
• The majority of first year teachers (71%) thought that their support providers were “warm and supportive,” and among second year teachers, 74% made that assertion.
• New teachers generally trusted their support providers, and 78% of first year teachers and 83% of second year teachers contended they “shared everything” with support providers.
• Meetings between support providers and beginning teachers were highly variable, with about a third of new teachers stating that they met with their support provider once a
IAIPSL Study, Report 1: Beginning Teachers’ Engagement with BTSA/CFASST 38
month and another third stating that they met with their support provider two or three times a month. The remaining third met even more often, with about 20% of first year teachers meeting formally with their support providers every week.
• Discussions between support providers and beginning teachers focused on emotional support, with instructional support and support for managing student behavior coming just behind. As Wang & Odell (2002) point out, mentoring programs that focus on emotional support are the least likely to effect reform. This is not to say that beginning teachers should not receive some measure of emotional support from their support providers as part of their induction experience, only that the balance of the induction experience needs to be dominated by a substantive teaching and learning focus.
• Teachers completed their CFASST events at varying rates. Some events were far less likely to be completed, particularly the Colloquium in the Year 2. Overall, teachers were more likely to complete second year events, which may reflect the recent change in credentialing requirements to include completion of an induction program.
• Even the low engagement CFASST users were likely to complete most events. The low engagement interview respondents completed more than seven events on average, and the middle and high groups completed more than nine events on average in Year 1. In the second year, the high engagement group completed more events (more than six on average) than the middle group (less than six) and the low group (less than five). It should be noted, however, that these are self-reports; judging from Box Reviews (e.g., Paek et al., 2001), teachers may have only partially completed some events.
• Teachers in the interview sample were most likely to choose Event 9, “Designing a Standards-Based Lesson Series,” as the inquiry event that was most memorable for them. Second to Event 9 was Event 2, “Establishing a Learning Environment.” Event 9 may stand out for teachers because of emphasis on standards-based instruction in recent years in California.
• While CFASST focuses to a great extent on differentiating learning experiences for students, there is no clear relationship between CFASST engagement and teachers’ understanding of differentiation, at least as revealed in our interviews. This may be because differentiation is also taught in many teacher preparation programs and discussed in district meetings and professional development. Thus, teachers are learning about differentiation from a variety of sources.
• Beginning teachers generally found BTSA/CFASST to be helpful, particularly in three main areas: interactions with support providers, attending meetings or training with fellow BTSA participants, and the CFASST events themselves. Eighty-nine percent of interview respondents stated that they found CFASST to be helpful to them overall.
• The complaints beginning teachers registered in the interviews were similar to those that have been mentioned in other contexts. The primary complaint is that there is too much paperwork. Thirty-three percent of phone interview respondents noted this problem. In the same vein, beginning teachers complained in interviews that the program takes too much of their time and it’s too repetitive. But even those who complained tended to temper their complaints with compliments for their support providers, who were the best feature of CFASST according to many respondents.
IAIPSL Study, Report 1: Beginning Teachers’ Engagement with BTSA/CFASST 39
References California Commission on Teaching Credentialing & the California Department of Public Instruction. (1999). California Standards for the Teaching Profession: Resources for professional practice.
Center for the Future of Teaching and Learning. (2001). Teaching and California's future: The status of the teaching profession 2001. Santa Cruz, CA: Center for the Future of Teaching and Learning.
Ingersoll, R. (2003). Is there really a teacher shortage? Seattle, WA: Center for the Study of Teaching and Policy.
Lee, G. (2001). Implementing CFASST Year 2: A comparative case study. Princeton, NJ: Educational Testing Service.
Mitchell, D.E., & Boyns, D.E. (2002). California Beginning Teacher Support and Assessment Program: The 2001 statewide evaluation technical report. Riverside, CA: School Improvement Research Group.
Olebe, M.G. (2001). Can state policy mandate teacher reflection? Issues in Teacher Education, 10(2), 9-21.
Paek, P., Thompson, M., Wing, J., Goe, L., Urrieta, L., Pegram, J., Jinks, T., & Storms, B. (2001). 2000-2001 evaluation of CFASST: Report on the 2001 box review. Princeton, NJ: Educational Testing Service.
Pegram, J., Jinks, T., Tregidgo, A., & Thompson, M. (2001). 2001 evaluation of the California Formative Assessment and Support System for Teachers (CFASST): An analysis of event feedback questionnaires for CFASST year 2 events. Princeton, NJ: Educational Testing Service.
Storms, B., Wing, J., Jinks, T., Banks, K., & Cavazos, P. (2000). CFASST (field review) implementation report 1999-2000: A formative evaluation report. Princeton, NJ: Educational Testing Service.
Thompson, M. (2001). Case studies of CFASST beginning teachers: A summary report. Princeton, NJ: Educational Testing Service.
Thompson, M., & Paek, P. (2001). Evaluation of CFASST, 2000-2001. Princeton, NJ: Educational Testing Service.
Thompson, M., Paek, P., Goe, L., & Ponte, E. (2004a). Study of the impact of the California Formative Assessment and Support System for Teachers: Report 2, Relationship of BTSA/CFASST engagement and teacher practices (CFASST Rep. No. 2, ETS RR-04-31). Princeton, NJ: Educational Testing Service.
Thompson, M., Paek, P., Goe, L., & Ponte, E. (2004b). Study of the impact of the California Formative Assessment and Support System for Teachers: Report 3, Relationship of BTSA/CFASST engagement and student achievement (CFASST Rep. No. 3, ETS RR-04-32). Princeton, NJ: Educational Testing Service.
IAIPSL Study, Report 1: Beginning Teachers’ Engagement with BTSA/CFASST 40
Thompson, M., Ponte, E., Paek, P., & Goe, L. (2004). Study of the impact of the California Formative Assessment and Support System for Teachers: Report 4, Methodological considerations and recommendations for future research (CFASST Rep. No. 4, ETS RR-04-30). Princeton, NJ: Educational Testing Service.
Thompson, M. (2001). Case studies of CFASST beginning teachers: A summary report. Princeton, NJ: Educational Testing Service.
Wang, J., & Odell, S. J. (2002). Mentored learning to teach according to standards-based reform: A critical review. Review of Educational Research, 72(3), 481-546.
WestEd. (2002). Independent evaluation of the Beginning Teacher Support and Assessment Program. San Francisco, CA: Author.
IAIPSL Study, Report 1: Beginning Teachers’ Engagement with BTSA/CFASST 41


Appendices
IAIPSL Study, Report 1: Beginning Teachers’ Engagement with BTSA/CFASST 43
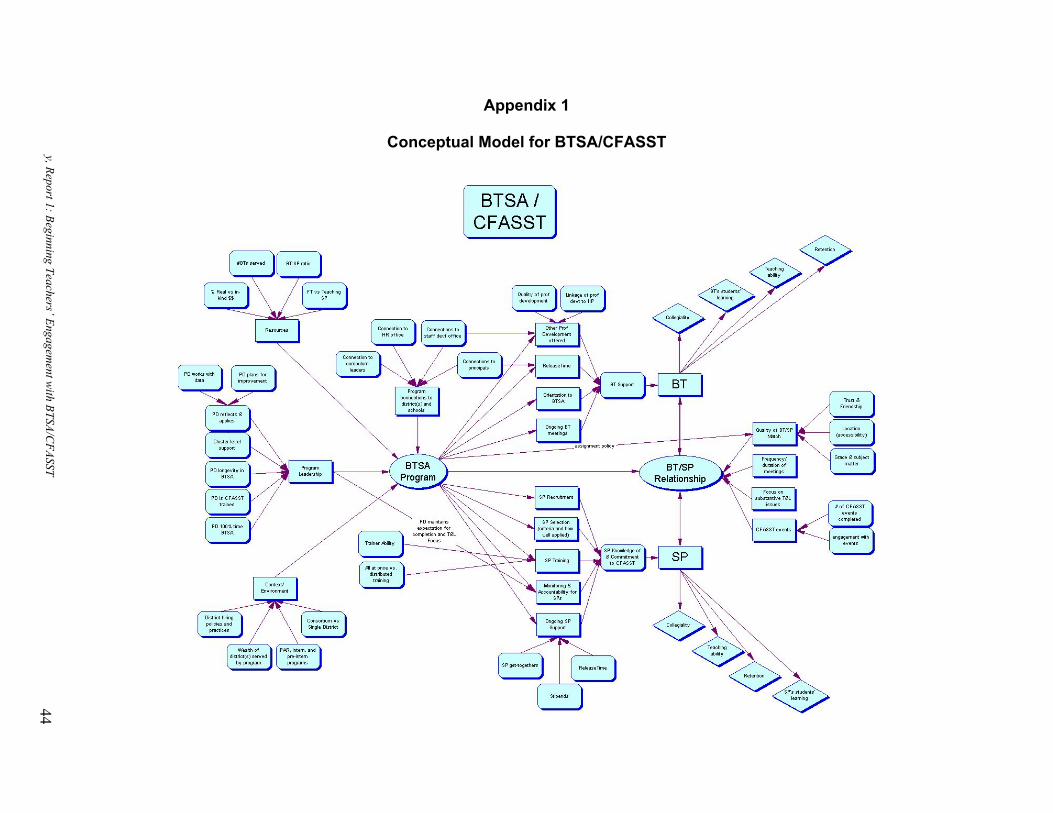
IAIPSL Study, Report 1: Beginning Teachers’ Engagement w
ith BTSA/CFASST
Appendix 1
Conceptual Model for BTSA/CFASST
44

Appendix 2
Survey Form
IAIPSL Study, Report 1: Beginning Teachers’ Engagement with BTSA/CFASST 45
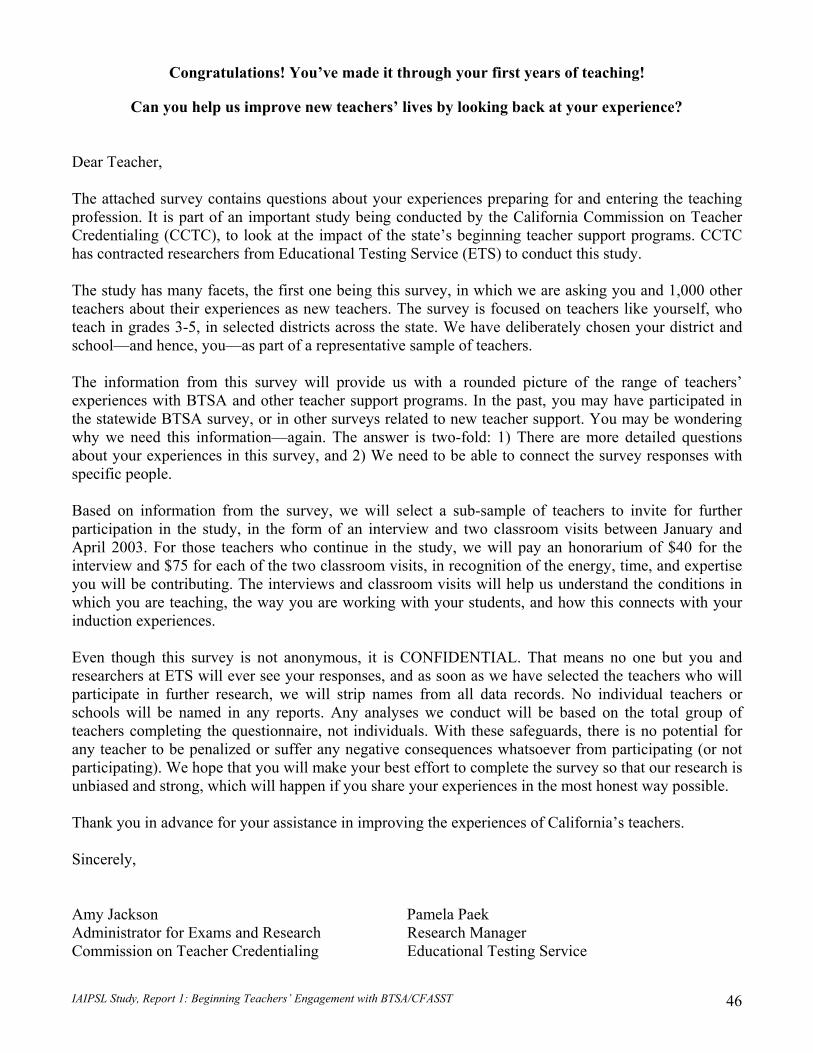
IAIPSL Study, Report 1: Beginning Teachers’ Engagement with BTSA/CFASST 46
Congratulations! You’ve made it through your first years of teaching!
Can you help us improve new teachers’ lives by looking back at your experience? Dear Teacher, The attached survey contains questions about your experiences preparing for and entering the teaching profession. It is part of an important study being conducted by the California Commission on Teacher Credentialing (CCTC), to look at the impact of the state’s beginning teacher support programs. CCTC has contracted researchers from Educational Testing Service (ETS) to conduct this study. The study has many facets, the first one being this survey, in which we are asking you and 1,000 other teachers about their experiences as new teachers. The survey is focused on teachers like yourself, who teach in grades 3-5, in selected districts across the state. We have deliberately chosen your district and school—and hence, you—as part of a representative sample of teachers. The information from this survey will provide us with a rounded picture of the range of teachers’ experiences with BTSA and other teacher support programs. In the past, you may have participated in the statewide BTSA survey, or in other surveys related to new teacher support. You may be wondering why we need this information—again. The answer is two-fold: 1) There are more detailed questions about your experiences in this survey, and 2) We need to be able to connect the survey responses with specific people. Based on information from the survey, we will select a sub-sample of teachers to invite for further participation in the study, in the form of an interview and two classroom visits between January and April 2003. For those teachers who continue in the study, we will pay an honorarium of $40 for the interview and $75 for each of the two classroom visits, in recognition of the energy, time, and expertise you will be contributing. The interviews and classroom visits will help us understand the conditions in which you are teaching, the way you are working with your students, and how this connects with your induction experiences. Even though this survey is not anonymous, it is CONFIDENTIAL. That means no one but you and researchers at ETS will ever see your responses, and as soon as we have selected the teachers who will participate in further research, we will strip names from all data records. No individual teachers or schools will be named in any reports. Any analyses we conduct will be based on the total group of teachers completing the questionnaire, not individuals. With these safeguards, there is no potential for any teacher to be penalized or suffer any negative consequences whatsoever from participating (or not participating). We hope that you will make your best effort to complete the survey so that our research is unbiased and strong, which will happen if you share your experiences in the most honest way possible. Thank you in advance for your assistance in improving the experiences of California’s teachers. Sincerely, Amy Jackson Pamela Paek Administrator for Exams and Research Research Manager Commission on Teacher Credentialing Educational Testing Service
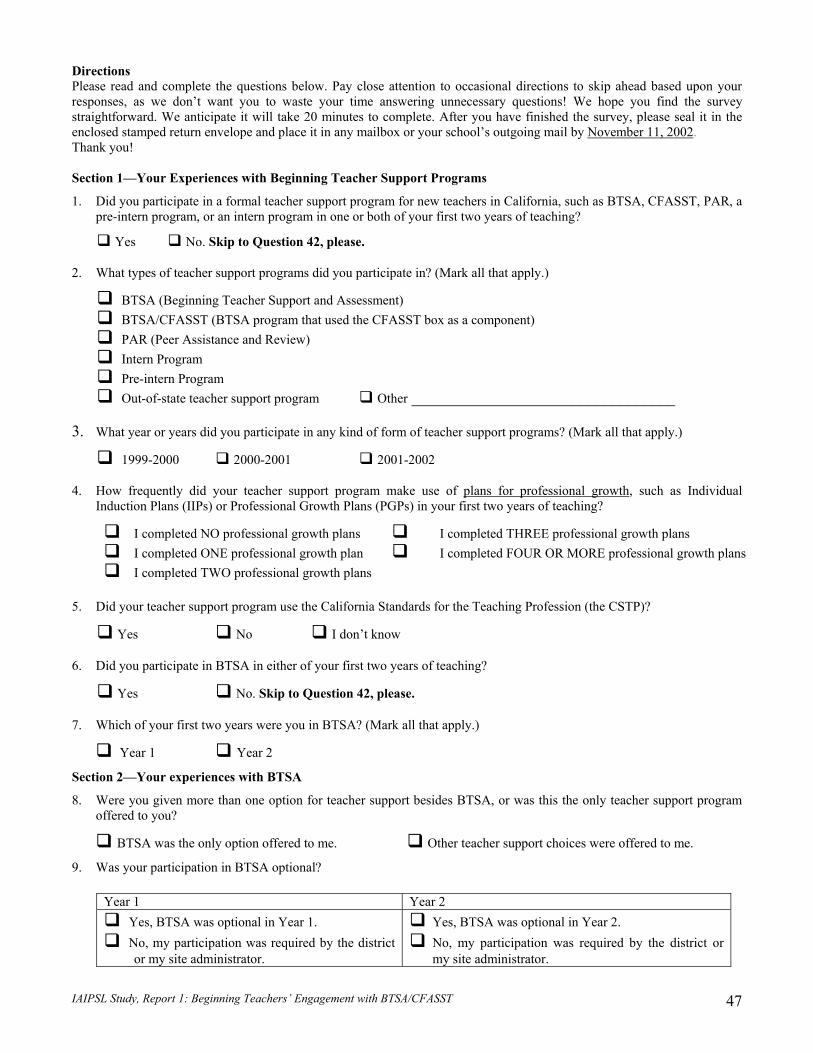
IAIPSL Study, Report 1: Beginning Teachers’ Engagement with BTSA/CFASST 47
Directions Please read and complete the questions below. Pay close attention to occasional directions to skip ahead based upon your responses, as we don’t want you to waste your time answering unnecessary questions! We hope you find the survey straightforward. We anticipate it will take 20 minutes to complete. After you have finished the survey, please seal it in the enclosed stamped return envelope and place it in any mailbox or your school’s outgoing mail by November 11, 2002. Thank you! Section 1—Your Experiences with Beginning Teacher Support Programs
1. Did you participate in a formal teacher support program for new teachers in California, such as BTSA, CFASST, PAR, a pre-intern program, or an intern program in one or both of your first two years of teaching?
Yes No. Skip to Question 42, please. 2. What types of teacher support programs did you participate in? (Mark all that apply.)
BTSA (Beginning Teacher Support and Assessment) BTSA/CFASST (BTSA program that used the CFASST box as a component) PAR (Peer Assistance and Review) Intern Program Pre-intern Program Out-of-state teacher support program Other _________________________________
3. What year or years did you participate in any kind of form of teacher support programs? (Mark all that apply.)
1999-2000 2000-2001 2001-2002 4. How frequently did your teacher support program make use of plans for professional growth, such as Individual
Induction Plans (IIPs) or Professional Growth Plans (PGPs) in your first two years of teaching?
I completed NO professional growth plans I completed ONE professional growth plan I completed TWO professional growth plans
I completed THREE professional growth plans I completed FOUR OR MORE professional growth plans
5. Did your teacher support program use the California Standards for the Teaching Profession (the CSTP)?
Yes No I don’t know 6. Did you participate in BTSA in either of your first two years of teaching?
Yes No. Skip to Question 42, please.
7. Which of your first two years were you in BTSA? (Mark all that apply.)
Year 1 Year 2
Section 2—Your experiences with BTSA
8. Were you given more than one option for teacher support besides BTSA, or was this the only teacher support program offered to you?
BTSA was the only option offered to me. Other teacher support choices were offered to me.
9. Was your participation in BTSA optional?
Year 1 Year 2 Yes, BTSA was optional in Year 1. No, my participation was required by the district
or my site administrator.
Yes, BTSA was optional in Year 2. No, my participation was required by the district or my site administrator.
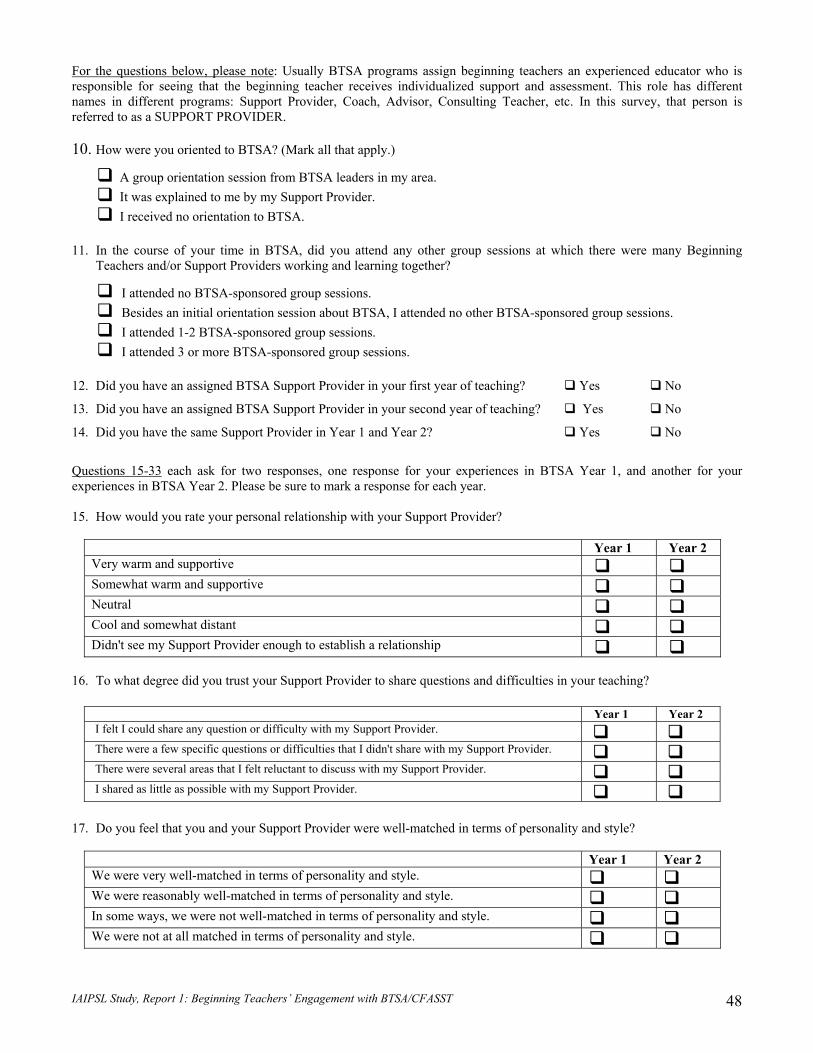
IAIPSL Study, Report 1: Beginning Teachers’ Engagement with BTSA/CFASST 48
For the questions below, please note: Usually BTSA programs assign beginning teachers an experienced educator who is responsible for seeing that the beginning teacher receives individualized support and assessment. This role has different names in different programs: Support Provider, Coach, Advisor, Consulting Teacher, etc. In this survey, that person is referred to as a SUPPORT PROVIDER. 10. How were you oriented to BTSA? (Mark all that apply.)
A group orientation session from BTSA leaders in my area. It was explained to me by my Support Provider. I received no orientation to BTSA.
11. In the course of your time in BTSA, did you attend any other group sessions at which there were many Beginning Teachers and/or Support Providers working and learning together?
I attended no BTSA-sponsored group sessions. Besides an initial orientation session about BTSA, I attended no other BTSA-sponsored group sessions. I attended 1-2 BTSA-sponsored group sessions. I attended 3 or more BTSA-sponsored group sessions.
12. Did you have an assigned BTSA Support Provider in your first year of teaching? Yes No
13. Did you have an assigned BTSA Support Provider in your second year of teaching? Yes No
14. Did you have the same Support Provider in Year 1 and Year 2? Yes No
Questions 15-33 each ask for two responses, one response for your experiences in BTSA Year 1, and another for your experiences in BTSA Year 2. Please be sure to mark a response for each year. 15. How would you rate your personal relationship with your Support Provider?
Year 1 Year 2
Very warm and supportive Somewhat warm and supportive Neutral Cool and somewhat distant Didn't see my Support Provider enough to establish a relationship
16. To what degree did you trust your Support Provider to share questions and difficulties in your teaching?
Year 1 Year 2 I felt I could share any question or difficulty with my Support Provider. There were a few specific questions or difficulties that I didn't share with my Support Provider. There were several areas that I felt reluctant to discuss with my Support Provider. I shared as little as possible with my Support Provider.
17. Do you feel that you and your Support Provider were well-matched in terms of personality and style?
Year 1 Year 2 We were very well-matched in terms of personality and style. We were reasonably well-matched in terms of personality and style. In some ways, we were not well-matched in terms of personality and style. We were not at all matched in terms of personality and style.
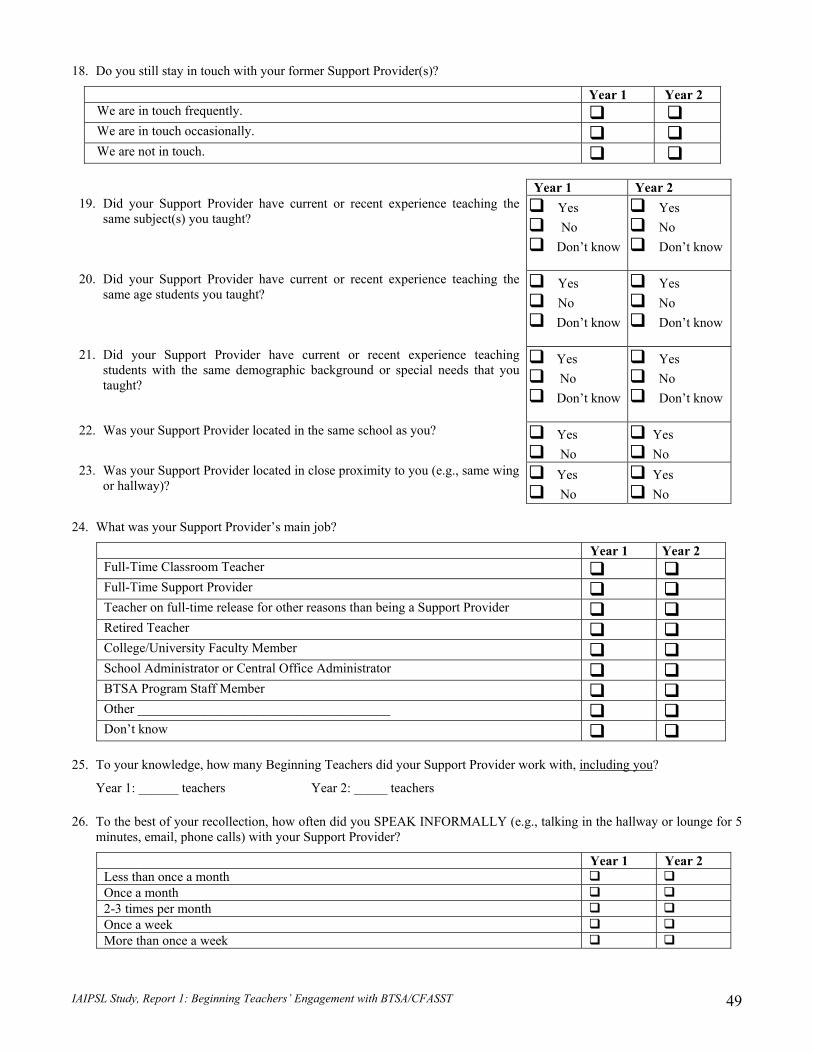
IAIPSL Study, Report 1: Beginning Teachers’ Engagement with BTSA/CFASST 49
18. Do you still stay in touch with your former Support Provider(s)?
Year 1 Year 2 We are in touch frequently. We are in touch occasionally. We are not in touch.
Year 1 Year 2 19. Did your Support Provider have current or recent experience teaching the
same subject(s) you taught? Yes No Don’t know
Yes No Don’t know
20. Did your Support Provider have current or recent experience teaching the same age students you taught?
Yes No Don’t know
Yes No Don’t know
21. Did your Support Provider have current or recent experience teaching students with the same demographic background or special needs that you taught?
Yes No Don’t know
Yes No Don’t know
22. Was your Support Provider located in the same school as you? Yes No
Yes No
23. Was your Support Provider located in close proximity to you (e.g., same wing or hallway)?
Yes No
Yes No
24. What was your Support Provider’s main job?
Year 1 Year 2 Full-Time Classroom Teacher Full-Time Support Provider Teacher on full-time release for other reasons than being a Support Provider Retired Teacher College/University Faculty Member School Administrator or Central Office Administrator BTSA Program Staff Member Other ______________________________________ Don’t know
25. To your knowledge, how many Beginning Teachers did your Support Provider work with, including you?
Year 1: ______ teachers Year 2: _____ teachers
26. To the best of your recollection, how often did you SPEAK INFORMALLY (e.g., talking in the hallway or lounge for 5 minutes, email, phone calls) with your Support Provider?
Year 1 Year 2 Less than once a month Once a month 2-3 times per month Once a week More than once a week
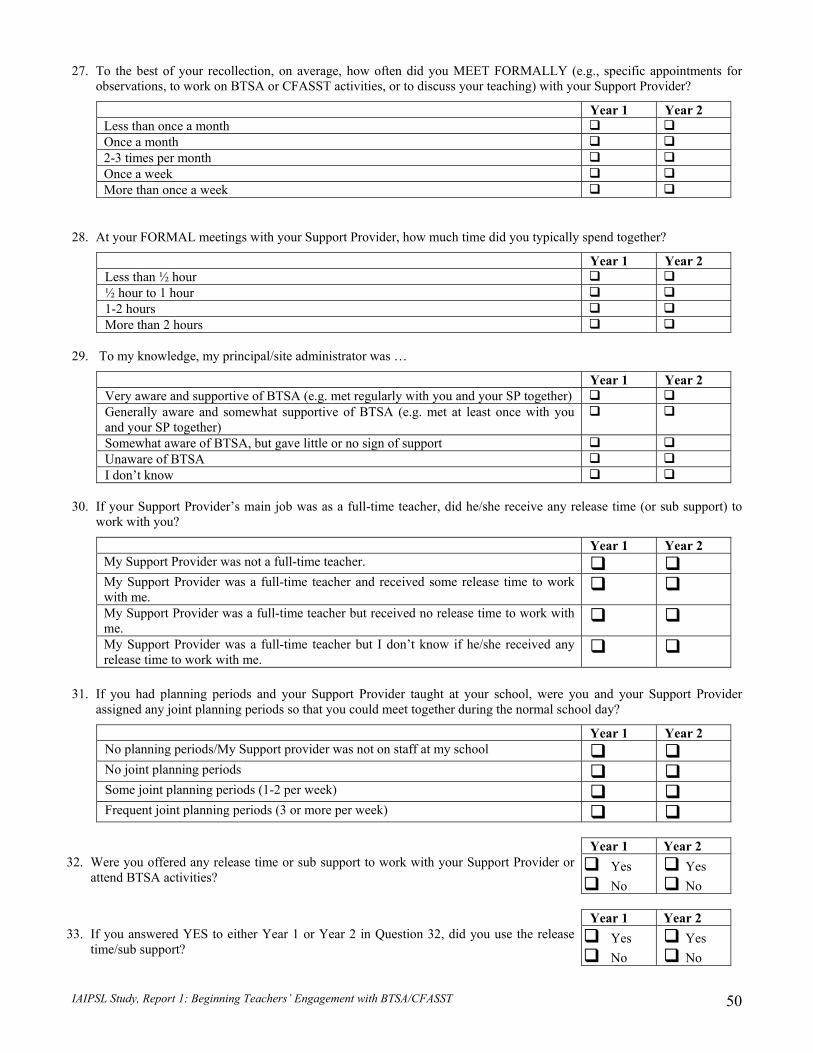
IAIPSL Study, Report 1: Beginning Teachers’ Engagement with BTSA/CFASST 50
27. To the best of your recollection, on average, how often did you MEET FORMALLY (e.g., specific appointments for observations, to work on BTSA or CFASST activities, or to discuss your teaching) with your Support Provider?
Year 1 Year 2 Less than once a month Once a month 2-3 times per month Once a week More than once a week
28. At your FORMAL meetings with your Support Provider, how much time did you typically spend together?
Year 1 Year 2 Less than ½ hour ½ hour to 1 hour 1-2 hours More than 2 hours
29. To my knowledge, my principal/site administrator was …
Year 1 Year 2 Very aware and supportive of BTSA (e.g. met regularly with you and your SP together) Generally aware and somewhat supportive of BTSA (e.g. met at least once with you and your SP together)
Somewhat aware of BTSA, but gave little or no sign of support Unaware of BTSA I don’t know
30. If your Support Provider’s main job was as a full-time teacher, did he/she receive any release time (or sub support) to
work with you?
Year 1 Year 2 My Support Provider was not a full-time teacher. My Support Provider was a full-time teacher and received some release time to work with me.
My Support Provider was a full-time teacher but received no release time to work with me.
My Support Provider was a full-time teacher but I don’t know if he/she received any release time to work with me.
31. If you had planning periods and your Support Provider taught at your school, were you and your Support Provider
assigned any joint planning periods so that you could meet together during the normal school day?
Year 1 Year 2 No planning periods/My Support provider was not on staff at my school No joint planning periods Some joint planning periods (1-2 per week) Frequent joint planning periods (3 or more per week)
Year 1 Year 2 32. Were you offered any release time or sub support to work with your Support Provider or
attend BTSA activities? Yes No
Yes No
Year 1 Year 2 33. If you answered YES to either Year 1 or Year 2 in Question 32, did you use the release
time/sub support? Yes No
Yes No
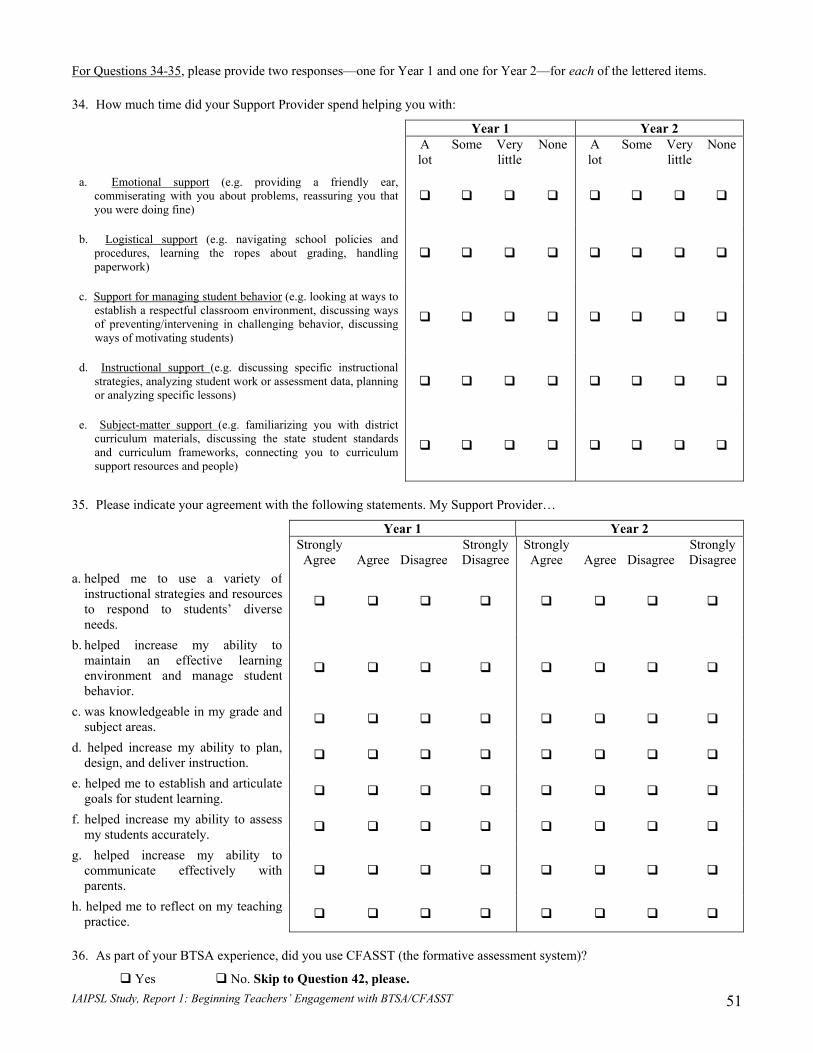
IAIPSL Study, Report 1: Beginning Teachers’ Engagement with BTSA/CFASST 51
For Questions 34-35, please provide two responses—one for Year 1 and one for Year 2—for each of the lettered items. 34. How much time did your Support Provider spend helping you with:
Year 1 Year 2 A
lot Some Very
little None A
lot Some Very
little None
a. Emotional support (e.g. providing a friendly ear, commiserating with you about problems, reassuring you that you were doing fine)
b. Logistical support (e.g. navigating school policies and procedures, learning the ropes about grading, handling paperwork)
c. Support for managing student behavior (e.g. looking at ways to establish a respectful classroom environment, discussing ways of preventing/intervening in challenging behavior, discussing ways of motivating students)
d. Instructional support (e.g. discussing specific instructional strategies, analyzing student work or assessment data, planning or analyzing specific lessons)
e. Subject-matter support (e.g. familiarizing you with district curriculum materials, discussing the state student standards and curriculum frameworks, connecting you to curriculum support resources and people)
35. Please indicate your agreement with the following statements. My Support Provider…
Year 1 Year 2 Strongly
Agree
Agree
Disagree Strongly Disagree
Strongly Agree
Agree
Disagree
Strongly Disagree
a. helped me to use a variety of instructional strategies and resources to respond to students’ diverse needs.
b. helped increase my ability to maintain an effective learning environment and manage student behavior.
c. was knowledgeable in my grade and subject areas.
d. helped increase my ability to plan, design, and deliver instruction.
e. helped me to establish and articulate goals for student learning.
f. helped increase my ability to assess my students accurately.
g. helped increase my ability to communicate effectively with parents.
h. helped me to reflect on my teaching practice.
36. As part of your BTSA experience, did you use CFASST (the formative assessment system)?
Yes No. Skip to Question 42, please.
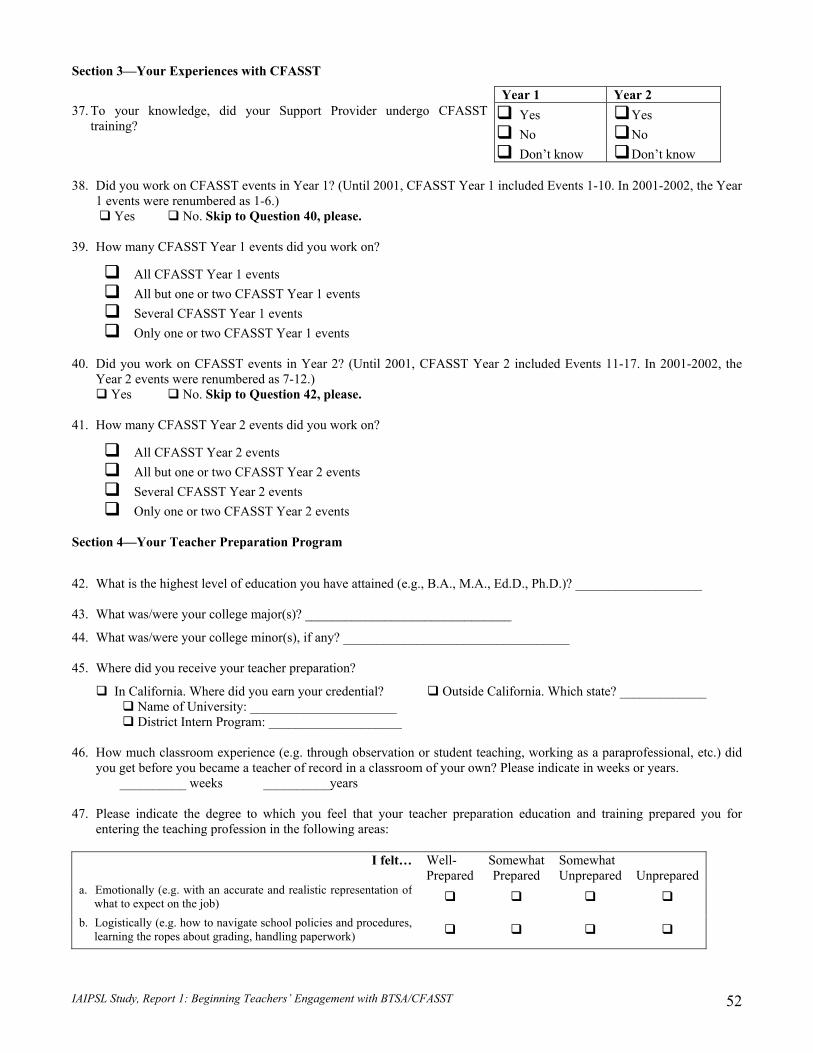
IAIPSL Study, Report 1: Beginning Teachers’ Engagement with BTSA/CFASST 52
Section 3—Your Experiences with CFASST
Year 1 Year 2 37. To your knowledge, did your Support Provider undergo CFASST
training? Yes No Don’t know
Yes No Don’t know
38. Did you work on CFASST events in Year 1? (Until 2001, CFASST Year 1 included Events 1-10. In 2001-2002, the Year
1 events were renumbered as 1-6.) Yes No. Skip to Question 40, please.
39. How many CFASST Year 1 events did you work on?
All CFASST Year 1 events All but one or two CFASST Year 1 events Several CFASST Year 1 events Only one or two CFASST Year 1 events
40. Did you work on CFASST events in Year 2? (Until 2001, CFASST Year 2 included Events 11-17. In 2001-2002, the
Year 2 events were renumbered as 7-12.) Yes No. Skip to Question 42, please.
41. How many CFASST Year 2 events did you work on?
All CFASST Year 2 events All but one or two CFASST Year 2 events Several CFASST Year 2 events Only one or two CFASST Year 2 events
Section 4—Your Teacher Preparation Program
42. What is the highest level of education you have attained (e.g., B.A., M.A., Ed.D., Ph.D.)? ___________________ 43. What was/were your college major(s)? _______________________________
44. What was/were your college minor(s), if any? __________________________________ 45. Where did you receive your teacher preparation?
In California. Where did you earn your credential? Name of University: ______________________ District Intern Program: ____________________
Outside California. Which state? _____________
46. How much classroom experience (e.g. through observation or student teaching, working as a paraprofessional, etc.) did
you get before you became a teacher of record in a classroom of your own? Please indicate in weeks or years. __________ weeks __________years
47. Please indicate the degree to which you feel that your teacher preparation education and training prepared you for entering the teaching profession in the following areas:
I felt… Well-Prepared
Somewhat Prepared
Somewhat Unprepared
Unprepared
a. Emotionally (e.g. with an accurate and realistic representation of what to expect on the job)
b. Logistically (e.g. how to navigate school policies and procedures, learning the ropes about grading, handling paperwork)
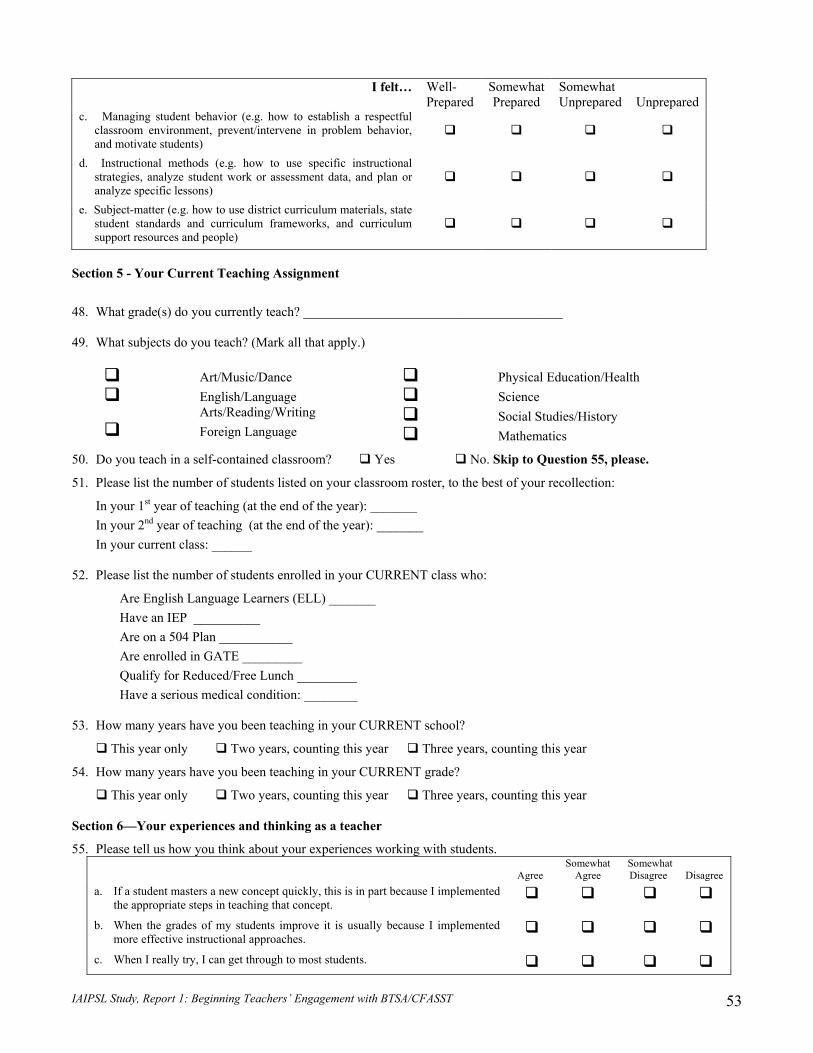
IAIPSL Study, Report 1: Beginning Teachers’ Engagement with BTSA/CFASST 53
I felt… Well-
Prepared Somewhat Prepared
Somewhat Unprepared
Unprepared
c. Managing student behavior (e.g. how to establish a respectful classroom environment, prevent/intervene in problem behavior, and motivate students)
d. Instructional methods (e.g. how to use specific instructional strategies, analyze student work or assessment data, and plan or analyze specific lessons)
e. Subject-matter (e.g. how to use district curriculum materials, state student standards and curriculum frameworks, and curriculum support resources and people)
Section 5 - Your Current Teaching Assignment
48. What grade(s) do you currently teach? _______________________________________ 49. What subjects do you teach? (Mark all that apply.)
Art/Music/Dance English/Language
Arts/Reading/Writing Foreign Language
Physical Education/Health Science Social Studies/History Mathematics
50. Do you teach in a self-contained classroom? Yes No. Skip to Question 55, please.
51. Please list the number of students listed on your classroom roster, to the best of your recollection:
In your 1st year of teaching (at the end of the year): _______ In your 2nd year of teaching (at the end of the year): _______ In your current class: ______
52. Please list the number of students enrolled in your CURRENT class who:
Are English Language Learners (ELL) _______ Have an IEP __________ Are on a 504 Plan ___________ Are enrolled in GATE _________ Qualify for Reduced/Free Lunch _________ Have a serious medical condition: ________
53. How many years have you been teaching in your CURRENT school?
This year only Two years, counting this year Three years, counting this year
54. How many years have you been teaching in your CURRENT grade?
This year only Two years, counting this year Three years, counting this year
Section 6—Your experiences and thinking as a teacher
55. Please tell us how you think about your experiences working with students.
Agree Somewhat
Agree Somewhat Disagree
Disagree
a. If a student masters a new concept quickly, this is in part because I implemented the appropriate steps in teaching that concept.
b. When the grades of my students improve it is usually because I implemented more effective instructional approaches.
c. When I really try, I can get through to most students.
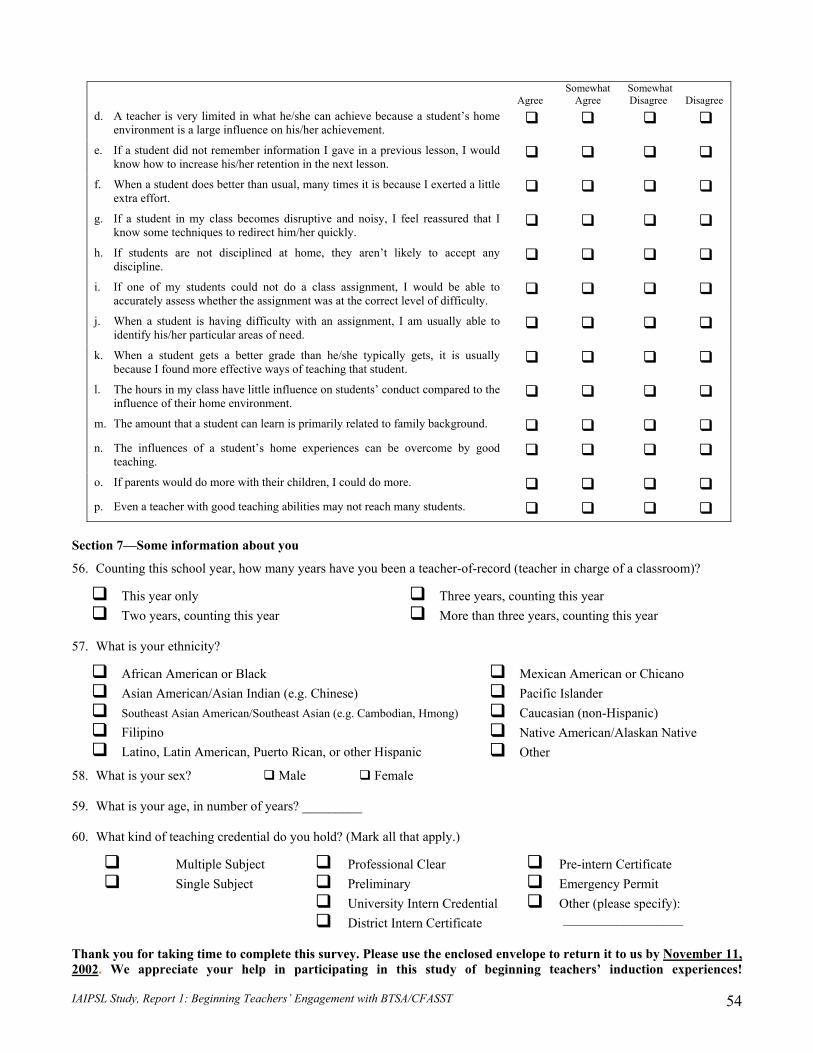
IAIPSL Study, Report 1: Beginning Teachers’ Engagement with BTSA/CFASST 54
Agree Somewhat
Agree Somewhat Disagree
Disagree
d. A teacher is very limited in what he/she can achieve because a student’s home environment is a large influence on his/her achievement.
e. If a student did not remember information I gave in a previous lesson, I would know how to increase his/her retention in the next lesson.
f. When a student does better than usual, many times it is because I exerted a little extra effort.
g. If a student in my class becomes disruptive and noisy, I feel reassured that I know some techniques to redirect him/her quickly.
h. If students are not disciplined at home, they aren’t likely to accept any discipline.
i. If one of my students could not do a class assignment, I would be able to accurately assess whether the assignment was at the correct level of difficulty.
j. When a student is having difficulty with an assignment, I am usually able to identify his/her particular areas of need.
k. When a student gets a better grade than he/she typically gets, it is usually because I found more effective ways of teaching that student.
l. The hours in my class have little influence on students’ conduct compared to the influence of their home environment.
m. The amount that a student can learn is primarily related to family background.
n. The influences of a student’s home experiences can be overcome by good teaching.
o. If parents would do more with their children, I could do more.
p. Even a teacher with good teaching abilities may not reach many students.
Section 7—Some information about you
56. Counting this school year, how many years have you been a teacher-of-record (teacher in charge of a classroom)?
This year only Two years, counting this year
Three years, counting this year More than three years, counting this year
57. What is your ethnicity?
African American or Black Asian American/Asian Indian (e.g. Chinese) Southeast Asian American/Southeast Asian (e.g. Cambodian, Hmong) Filipino Latino, Latin American, Puerto Rican, or other Hispanic
Mexican American or Chicano Pacific Islander Caucasian (non-Hispanic) Native American/Alaskan Native Other
58. What is your sex? Male Female 59. What is your age, in number of years? _________ 60. What kind of teaching credential do you hold? (Mark all that apply.)
Multiple Subject Single Subject
Professional Clear Preliminary University Intern Credential District Intern Certificate
Pre-intern Certificate Emergency Permit Other (please specify):
__________________ Thank you for taking time to complete this survey. Please use the enclosed envelope to return it to us by November 11, 2002. We appreciate your help in participating in this study of beginning teachers’ induction experiences!
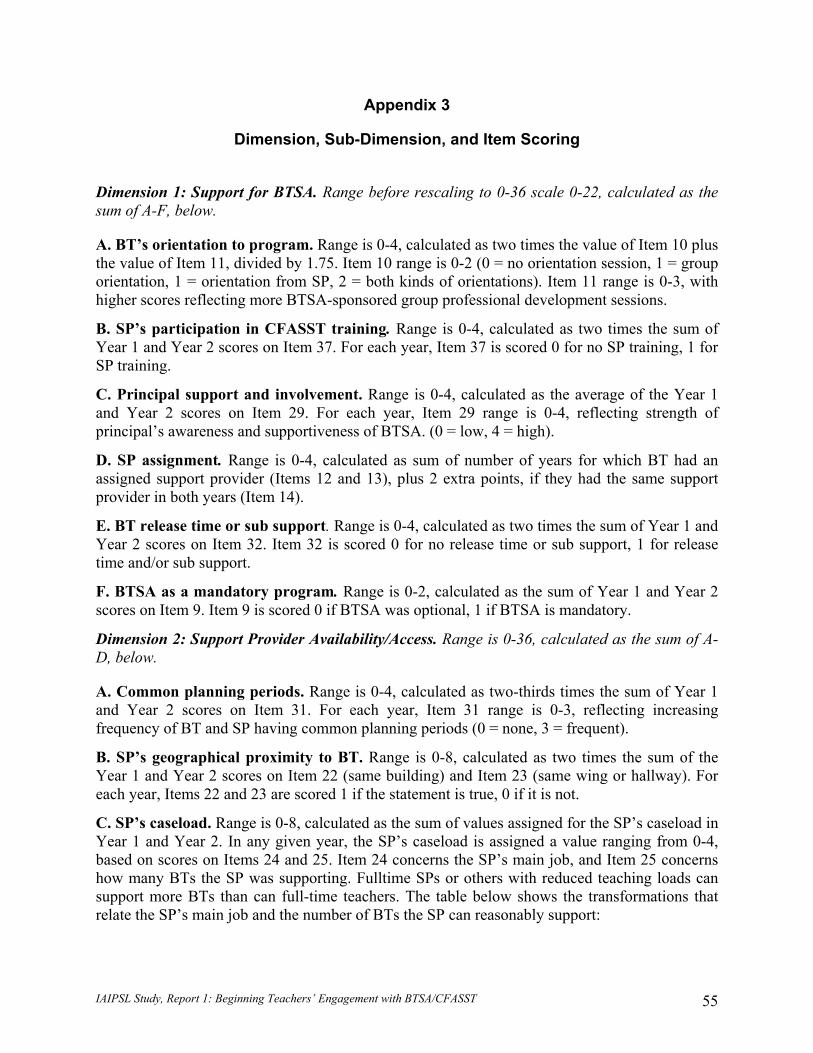
Appendix 3
Dimension, Sub-Dimension, and Item Scoring
Dimension 1: Support for BTSA. Range before rescaling to 0-36 scale 0-22, calculated as the sum of A-F, below.
A. BT’s orientation to program. Range is 0-4, calculated as two times the value of Item 10 plus the value of Item 11, divided by 1.75. Item 10 range is 0-2 (0 = no orientation session, 1 = group orientation, 1 = orientation from SP, 2 = both kinds of orientations). Item 11 range is 0-3, with higher scores reflecting more BTSA-sponsored group professional development sessions.
B. SP’s participation in CFASST training. Range is 0-4, calculated as two times the sum of Year 1 and Year 2 scores on Item 37. For each year, Item 37 is scored 0 for no SP training, 1 for SP training.
C. Principal support and involvement. Range is 0-4, calculated as the average of the Year 1 and Year 2 scores on Item 29. For each year, Item 29 range is 0-4, reflecting strength of principal’s awareness and supportiveness of BTSA. (0 = low, 4 = high).
D. SP assignment. Range is 0-4, calculated as sum of number of years for which BT had an assigned support provider (Items 12 and 13), plus 2 extra points, if they had the same support provider in both years (Item 14).
E. BT release time or sub support. Range is 0-4, calculated as two times the sum of Year 1 and Year 2 scores on Item 32. Item 32 is scored 0 for no release time or sub support, 1 for release time and/or sub support.
F. BTSA as a mandatory program. Range is 0-2, calculated as the sum of Year 1 and Year 2 scores on Item 9. Item 9 is scored 0 if BTSA was optional, 1 if BTSA is mandatory.
Dimension 2: Support Provider Availability/Access. Range is 0-36, calculated as the sum of A-D, below.
A. Common planning periods. Range is 0-4, calculated as two-thirds times the sum of Year 1 and Year 2 scores on Item 31. For each year, Item 31 range is 0-3, reflecting increasing frequency of BT and SP having common planning periods (0 = none, 3 = frequent).
B. SP’s geographical proximity to BT. Range is 0-8, calculated as two times the sum of the Year 1 and Year 2 scores on Item 22 (same building) and Item 23 (same wing or hallway). For each year, Items 22 and 23 are scored 1 if the statement is true, 0 if it is not.
C. SP’s caseload. Range is 0-8, calculated as the sum of values assigned for the SP’s caseload in Year 1 and Year 2. In any given year, the SP’s caseload is assigned a value ranging from 0-4, based on scores on Items 24 and 25. Item 24 concerns the SP’s main job, and Item 25 concerns how many BTs the SP was supporting. Fulltime SPs or others with reduced teaching loads can support more BTs than can full-time teachers. The table below shows the transformations that relate the SP’s main job and the number of BTs the SP can reasonably support:
IAIPSL Study, Report 1: Beginning Teachers’ Engagement with BTSA/CFASST 55

SP’s Main Job Number of BTs supported by the SP
Value of Caseload
1 4 2 3 3 1 Full-time classroom teacher
More than 3 0 8 or fewer 4
9-12 2 Full-time support provider or retired teacher More than 12 0
3 or fewer 4 4-6 2
Teacher on full-time release for reasons other than being an SP, university faculty member, school or central office administrator, or BTSA program staff 7 or more 0
D. SP/BT meetings. Range is 0-16, calculated as one-eighth the product of two calculated variables: frequency of meetings and duration of meetings. The frequency of meeting score is the sum of Year 1 and Year 2 scores on Item 26 (frequency of informal meetings) and Item 27 (frequency of formal meetings). Items 26 and 27 range 0-4, reflecting increasing frequency of each type of meeting. The duration of meeting score is the sum of the Year 1 and Year 2 scores on Item 28, which ranges 1-4, reflecting increasing duration of formal meetings.
Dimension 3: Rapport Between Support Provider and Beginning Teacher. Range before rescaling to 0-36 scale is 0-21, calculated as the sum of A-B, below.
A. Quality of BT/SP relationship. Range is 0–5, calculated as one-sixth the sum of Year 1 and Year 2 scores on Items 15 (rating of personal relationship), 16 (trust), 17 (well-matched in personality/style), and 18 (still stay in touch). The individual items have the following ranges: Item 15, 0-4; Item 16, 0-4; Item 17, 0-4; Item 18, 0-3. High scores reflect a positive relationship.
B. Time the SP spent supporting the BT with regard to emotional and logistical issues. Range is 0–16, calculated as the sum of Year 1 and Year 2 scores on Items 34a (time spent on emotional support) and 34b (time spent on logistical support). Both 34a and 34b range 0-4, with higher scores reflecting greater time spent in that kind of support.
Dimension 4: Substantive Focus on Teaching and Learning. Range is 0-36, calculated as the sum of A-H, below.
A. BT’s release time. Range is 0-2, calculated as the sum of Year 1 and Year 2 values for Item 33, regarding whether the BT made use of release time to work with the SP.
B. CFASST event completion. Range is 0-8, calculated as four-fifths the sum of Items 38, 39, 40, and 41, which pertain to the number of CFASST events completed in Years 1 and 2. Item 38 and Item 40 range 0-1 (whether the BT used CFASST in Year 1/Year 2). Item 39 and Item 41 range 0-4, with higher scores reflecting more CFASST events being completed.
C. Use of IIPs. Range is 0-2, calculated as one-half of Item 4, which ranges 0-4, with higher scores reflecting a greater number of IIPs being completed.
IAIPSL Study, Report 1: Beginning Teachers’ Engagement with BTSA/CFASST 56
D. CSTP. Range is 0-2, calculated as two times the value of Item 5, which is scored 0 if the CSTP was not used and 1 if it was used.
E. BT/SP match. Range is 0-4, calculated as two-thirds the sum of Year 1 and Year 2 scores on Item 19 (same subject matter), Item 20 (same age students), and Item 21 (students with same demographics/background). For each year, each item was coded 1 if the SP had same experience as BT, 0 if the SP did not.
F. SP knowledge of grade and subject matter. Range is 0-4, calculated as one-half the sum of Year 1 and Year 2 scores on Item 35c, concerning the SP’s knowledge of the grade and subjects the BT teaches. For each year, Item 35c ranges 0-4, with higher scores reflecting greater knowledge on the SP’s part.
G. Time the SP spent supporting the BT with regard to teaching and learning issues. Range is 0-6, calculated as one-fourth the sum of Year 1 and Year 2 values on Items 34c (support for managing student behavior), 34d (instructional support), and 34e (subject-matter support). For each year, Items 34c, 34d, and 34e range 0-4, with higher scores reflecting greater support.
H. Perceived quality of SP support. Range is 0-8, calculated as one-seventh of the sum of items pertaining to SP’s helpfulness with specific aspects of teaching: Item 35a (responding to students’ diverse needs), 35b (managing student behavior and learning environment), 35d (instructional planning and delivery), 35e (establishing and articulating learning goals), 35f (assessment), 35g (communication with parents), and 35h (reflection). For each year, these seven items were each scored 0-4, with higher scores reflecting greater perceived helpfulness.
Note: There were some survey items that, albeit related to our model, were not included in any of the because of reliability issues, such as Item 30. Other items were not included because they were created to differentiate among teachers participating or not in BTSA/CFASST programs (Items 1-3 & 6-8), information about the teacher’s preparation program (Items 42-47), teaching assignment (Item 54), and background information (Items 56-60). Item 55 measured teacher self-efficacy, which we included as a dependent variable for possible later analysis.
IAIPSL Study, Report 1: Beginning Teachers’ Engagement with BTSA/CFASST 57
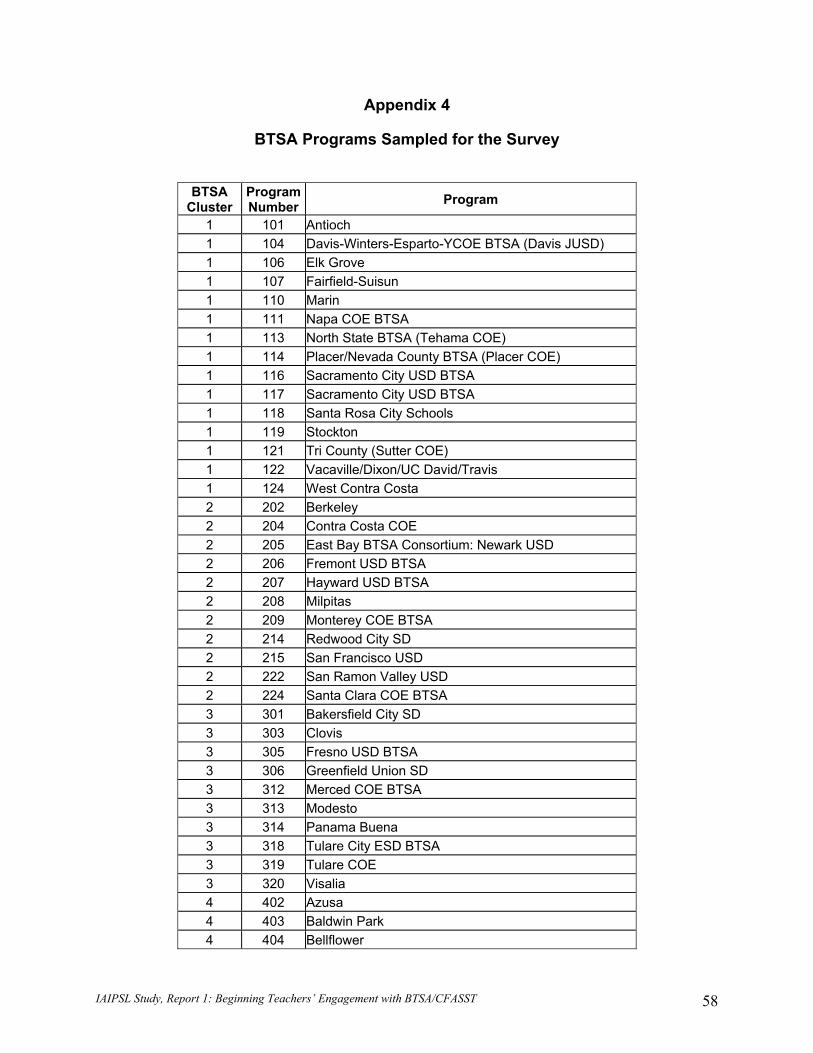
Appendix 4
BTSA Programs Sampled for the Survey
BTSA
Cluster Program Number Program
1 101 Antioch 1 104 Davis-Winters-Esparto-YCOE BTSA (Davis JUSD) 1 106 Elk Grove 1 107 Fairfield-Suisun 1 110 Marin 1 111 Napa COE BTSA 1 113 North State BTSA (Tehama COE) 1 114 Placer/Nevada County BTSA (Placer COE) 1 116 Sacramento City USD BTSA 1 117 Sacramento City USD BTSA 1 118 Santa Rosa City Schools 1 119 Stockton 1 121 Tri County (Sutter COE) 1 122 Vacaville/Dixon/UC David/Travis 1 124 West Contra Costa 2 202 Berkeley 2 204 Contra Costa COE 2 205 East Bay BTSA Consortium: Newark USD 2 206 Fremont USD BTSA 2 207 Hayward USD BTSA 2 208 Milpitas 2 209 Monterey COE BTSA 2 214 Redwood City SD 2 215 San Francisco USD 2 222 San Ramon Valley USD 2 224 Santa Clara COE BTSA 3 301 Bakersfield City SD 3 303 Clovis 3 305 Fresno USD BTSA 3 306 Greenfield Union SD 3 312 Merced COE BTSA 3 313 Modesto 3 314 Panama Buena 3 318 Tulare City ESD BTSA 3 319 Tulare COE 3 320 Visalia 4 402 Azusa 4 403 Baldwin Park 4 404 Bellflower
IAIPSL Study, Report 1: Beginning Teachers’ Engagement with BTSA/CFASST 58
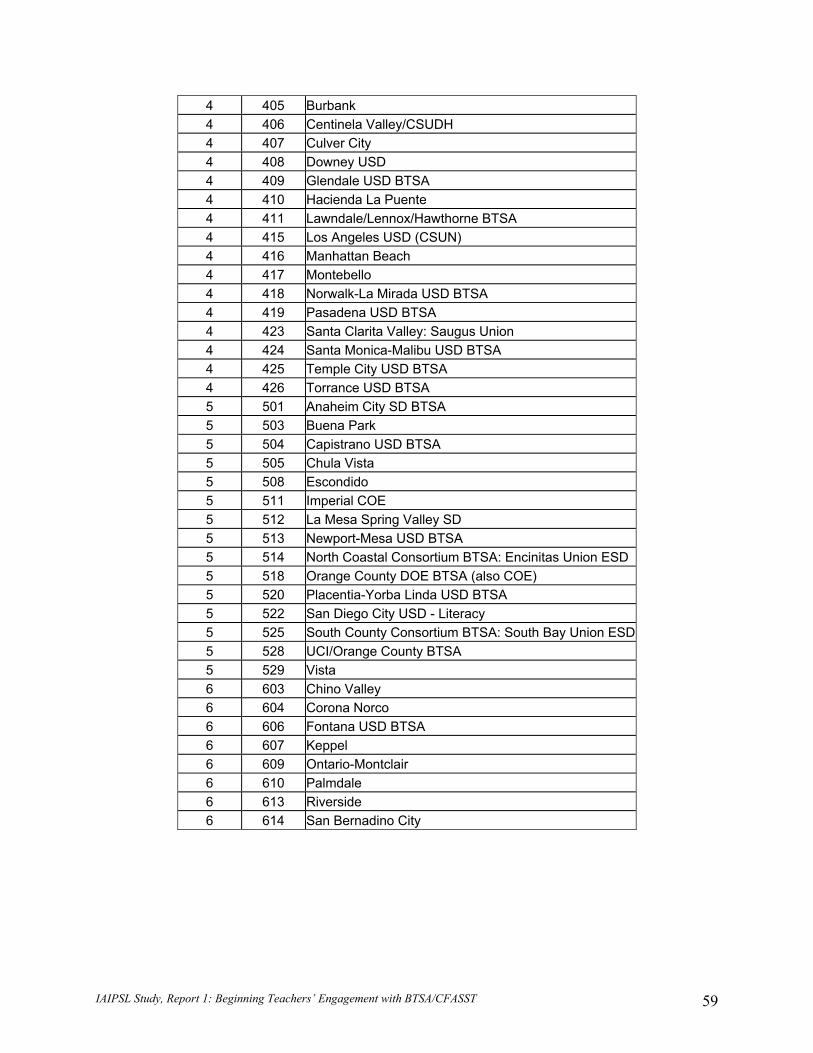
4 405 Burbank 4 406 Centinela Valley/CSUDH 4 407 Culver City 4 408 Downey USD 4 409 Glendale USD BTSA 4 410 Hacienda La Puente 4 411 Lawndale/Lennox/Hawthorne BTSA 4 415 Los Angeles USD (CSUN) 4 416 Manhattan Beach 4 417 Montebello 4 418 Norwalk-La Mirada USD BTSA 4 419 Pasadena USD BTSA 4 423 Santa Clarita Valley: Saugus Union 4 424 Santa Monica-Malibu USD BTSA 4 425 Temple City USD BTSA 4 426 Torrance USD BTSA 5 501 Anaheim City SD BTSA 5 503 Buena Park 5 504 Capistrano USD BTSA 5 505 Chula Vista 5 508 Escondido 5 511 Imperial COE 5 512 La Mesa Spring Valley SD 5 513 Newport-Mesa USD BTSA 5 514 North Coastal Consortium BTSA: Encinitas Union ESD 5 518 Orange County DOE BTSA (also COE) 5 520 Placentia-Yorba Linda USD BTSA 5 522 San Diego City USD - Literacy 5 525 South County Consortium BTSA: South Bay Union ESD 5 528 UCI/Orange County BTSA 5 529 Vista 6 603 Chino Valley 6 604 Corona Norco 6 606 Fontana USD BTSA 6 607 Keppel 6 609 Ontario-Montclair 6 610 Palmdale 6 613 Riverside 6 614 San Bernadino City
IAIPSL Study, Report 1: Beginning Teachers’ Engagement with BTSA/CFASST 59

Appendix 5
Telephone Interview Protocol
IAIPSL Study, Report 1: Beginning Teachers’ Engagement with BTSA/CFASST 60
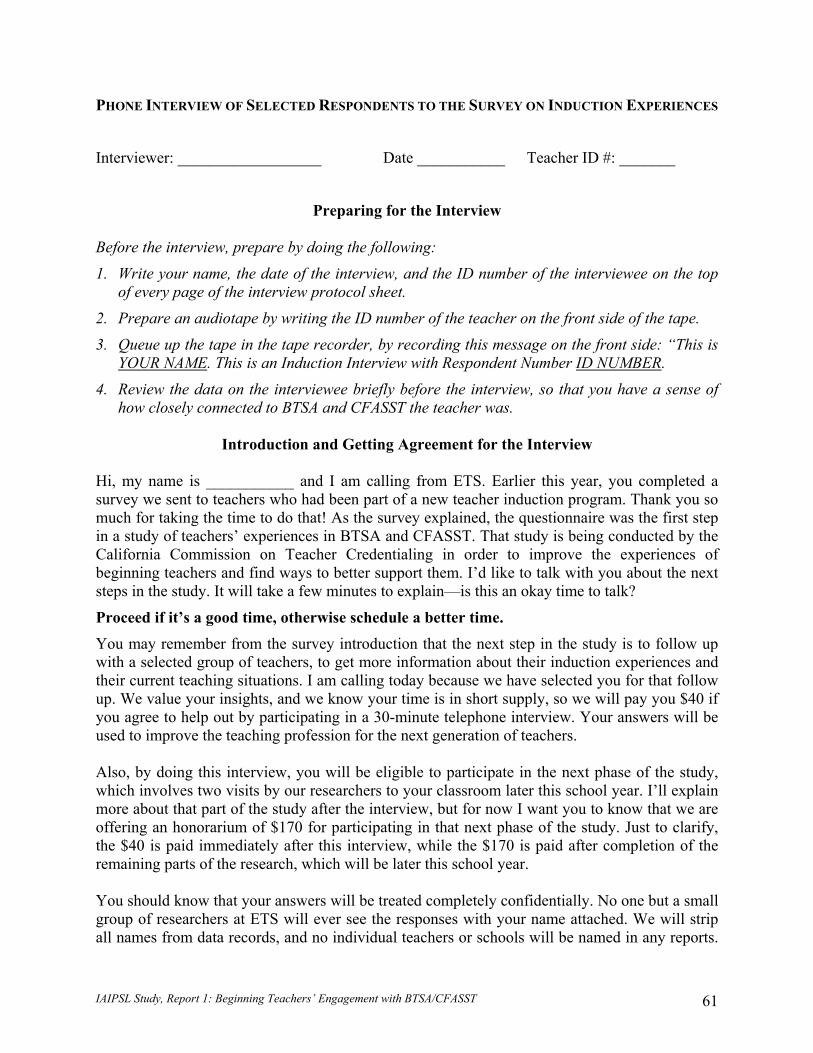
PHONE INTERVIEW OF SELECTED RESPONDENTS TO THE SURVEY ON INDUCTION EXPERIENCES
Interviewer: __________________ Date ___________ Teacher ID #: _______
Preparing for the Interview
Before the interview, prepare by doing the following:
1. Write your name, the date of the interview, and the ID number of the interviewee on the top of every page of the interview protocol sheet.
2. Prepare an audiotape by writing the ID number of the teacher on the front side of the tape.
3. Queue up the tape in the tape recorder, by recording this message on the front side: “This is YOUR NAME. This is an Induction Interview with Respondent Number ID NUMBER.
4. Review the data on the interviewee briefly before the interview, so that you have a sense of how closely connected to BTSA and CFASST the teacher was.
Introduction and Getting Agreement for the Interview
Hi, my name is ___________ and I am calling from ETS. Earlier this year, you completed a survey we sent to teachers who had been part of a new teacher induction program. Thank you so much for taking the time to do that! As the survey explained, the questionnaire was the first step in a study of teachers’ experiences in BTSA and CFASST. That study is being conducted by the California Commission on Teacher Credentialing in order to improve the experiences of beginning teachers and find ways to better support them. I’d like to talk with you about the next steps in the study. It will take a few minutes to explain—is this an okay time to talk?
Proceed if it’s a good time, otherwise schedule a better time. You may remember from the survey introduction that the next step in the study is to follow up with a selected group of teachers, to get more information about their induction experiences and their current teaching situations. I am calling today because we have selected you for that follow up. We value your insights, and we know your time is in short supply, so we will pay you $40 if you agree to help out by participating in a 30-minute telephone interview. Your answers will be used to improve the teaching profession for the next generation of teachers. Also, by doing this interview, you will be eligible to participate in the next phase of the study, which involves two visits by our researchers to your classroom later this school year. I’ll explain more about that part of the study after the interview, but for now I want you to know that we are offering an honorarium of $170 for participating in that next phase of the study. Just to clarify, the $40 is paid immediately after this interview, while the $170 is paid after completion of the remaining parts of the research, which will be later this school year. You should know that your answers will be treated completely confidentially. No one but a small group of researchers at ETS will ever see the responses with your name attached. We will strip all names from data records, and no individual teachers or schools will be named in any reports.
IAIPSL Study, Report 1: Beginning Teachers’ Engagement with BTSA/CFASST 61

All data analysis will be based on the total group of teachers who participate, not individuals. With these safeguards, there is no way for you or any teacher to suffer negative consequences from participating. You should also know that this research is not at all about your individual capabilities as a teacher. It is to look at how BTSA and CFASST are working to support all teachers. Are you willing to be interviewed? I’d like to do this while I have you on the phone now, but if this isn’t a good time, we can schedule another time to do it. Agree to Interview?
Yes ____ No ____
Scheduled time of interview ____________________________ Phone number for interview____________________________ Other contact info:
Home phone: _____________________ Best Work phone: ____________________ Cell phone: ________________________ Email: _________________________________________________________________ NOTE: If you are scheduling the interview for sometime in the future, it will help enormously if the teacher can have their CFASST box with them for the call. Say, Is there any chance you still have your CFASST box? If you do, the interview will go a little easier if you can have that next to you when we do the call.
Notes (best time to call, attempts to connect, etc.) The Interview I really appreciate you taking the time to answer our questions. For our research to be useful, it is important to us that you are completely honest and candid in your responses. As I mentioned earlier, your answers will be treated confidentially, so you don’t have to worry about any negative consequences coming from anything you say. Also, I am going to be tape-recording the interview so I can get everything you say accurately, and so I don’t have to take up so much of your time writing down your answers. The tapes will be destroyed after we use them to make sure we have all the data accurately recorded. Are you all right with me taping the interview? Agree to Taping?
IAIPSL Study, Report 1: Beginning Teachers’ Engagement with BTSA/CFASST 62
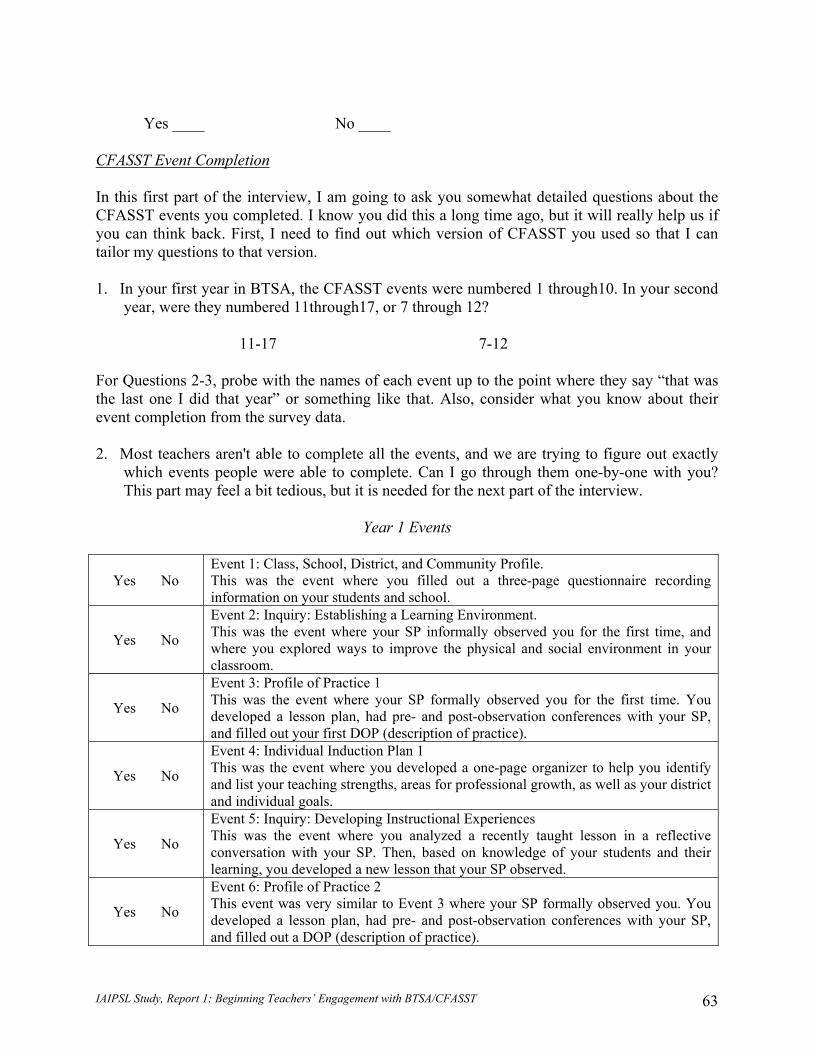
Yes ____ No ____ CFASST Event Completion In this first part of the interview, I am going to ask you somewhat detailed questions about the CFASST events you completed. I know you did this a long time ago, but it will really help us if you can think back. First, I need to find out which version of CFASST you used so that I can tailor my questions to that version. 1. In your first year in BTSA, the CFASST events were numbered 1 through10. In your second
year, were they numbered 11through17, or 7 through 12? 11-17 7-12 For Questions 2-3, probe with the names of each event up to the point where they say “that was the last one I did that year” or something like that. Also, consider what you know about their event completion from the survey data. 2. Most teachers aren't able to complete all the events, and we are trying to figure out exactly
which events people were able to complete. Can I go through them one-by-one with you? This part may feel a bit tedious, but it is needed for the next part of the interview.
Year 1 Events
Yes No Event 1: Class, School, District, and Community Profile. This was the event where you filled out a three-page questionnaire recording information on your students and school.
Yes No
Event 2: Inquiry: Establishing a Learning Environment. This was the event where your SP informally observed you for the first time, and where you explored ways to improve the physical and social environment in your classroom.
Yes No
Event 3: Profile of Practice 1 This was the event where your SP formally observed you for the first time. You developed a lesson plan, had pre- and post-observation conferences with your SP, and filled out your first DOP (description of practice).
Yes No
Event 4: Individual Induction Plan 1 This was the event where you developed a one-page organizer to help you identify and list your teaching strengths, areas for professional growth, as well as your district and individual goals.
Yes No
Event 5: Inquiry: Developing Instructional Experiences This was the event where you analyzed a recently taught lesson in a reflective conversation with your SP. Then, based on knowledge of your students and their learning, you developed a new lesson that your SP observed.
Yes No
Event 6: Profile of Practice 2 This event was very similar to Event 3 where your SP formally observed you. You developed a lesson plan, had pre- and post-observation conferences with your SP, and filled out a DOP (description of practice).
IAIPSL Study, Report 1: Beginning Teachers’ Engagement with BTSA/CFASST 63
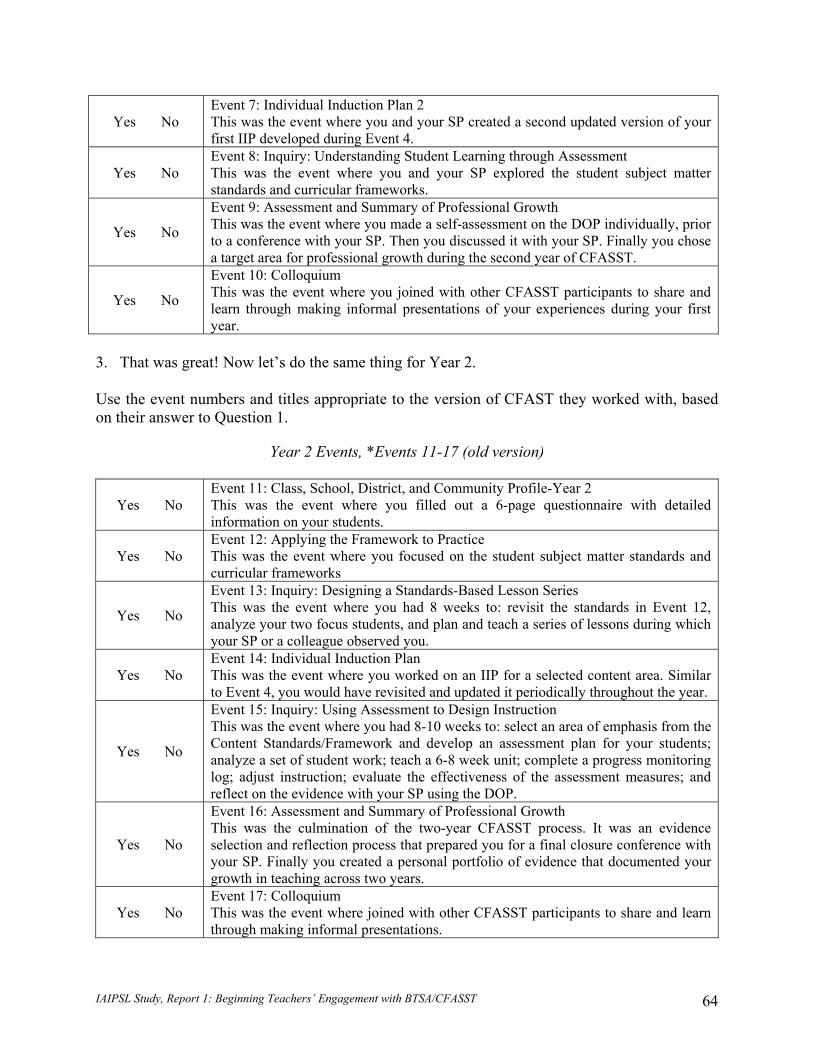
Yes No Event 7: Individual Induction Plan 2 This was the event where you and your SP created a second updated version of your first IIP developed during Event 4.
Yes No Event 8: Inquiry: Understanding Student Learning through Assessment This was the event where you and your SP explored the student subject matter standards and curricular frameworks.
Yes No
Event 9: Assessment and Summary of Professional Growth This was the event where you made a self-assessment on the DOP individually, prior to a conference with your SP. Then you discussed it with your SP. Finally you chose a target area for professional growth during the second year of CFASST.
Yes No
Event 10: Colloquium This was the event where you joined with other CFASST participants to share and learn through making informal presentations of your experiences during your first year.
3. That was great! Now let’s do the same thing for Year 2. Use the event numbers and titles appropriate to the version of CFAST they worked with, based on their answer to Question 1.
Year 2 Events, *Events 11-17 (old version)
Yes No Event 11: Class, School, District, and Community Profile-Year 2 This was the event where you filled out a 6-page questionnaire with detailed information on your students.
Yes No Event 12: Applying the Framework to Practice This was the event where you focused on the student subject matter standards and curricular frameworks
Yes No
Event 13: Inquiry: Designing a Standards-Based Lesson Series This was the event where you had 8 weeks to: revisit the standards in Event 12, analyze your two focus students, and plan and teach a series of lessons during which your SP or a colleague observed you.
Yes No Event 14: Individual Induction Plan This was the event where you worked on an IIP for a selected content area. Similar to Event 4, you would have revisited and updated it periodically throughout the year.
Yes No
Event 15: Inquiry: Using Assessment to Design Instruction This was the event where you had 8-10 weeks to: select an area of emphasis from the Content Standards/Framework and develop an assessment plan for your students; analyze a set of student work; teach a 6-8 week unit; complete a progress monitoring log; adjust instruction; evaluate the effectiveness of the assessment measures; and reflect on the evidence with your SP using the DOP.
Yes No
Event 16: Assessment and Summary of Professional Growth This was the culmination of the two-year CFASST process. It was an evidence selection and reflection process that prepared you for a final closure conference with your SP. Finally you created a personal portfolio of evidence that documented your growth in teaching across two years.
Yes No Event 17: Colloquium This was the event where joined with other CFASST participants to share and learn through making informal presentations.
IAIPSL Study, Report 1: Beginning Teachers’ Engagement with BTSA/CFASST 64
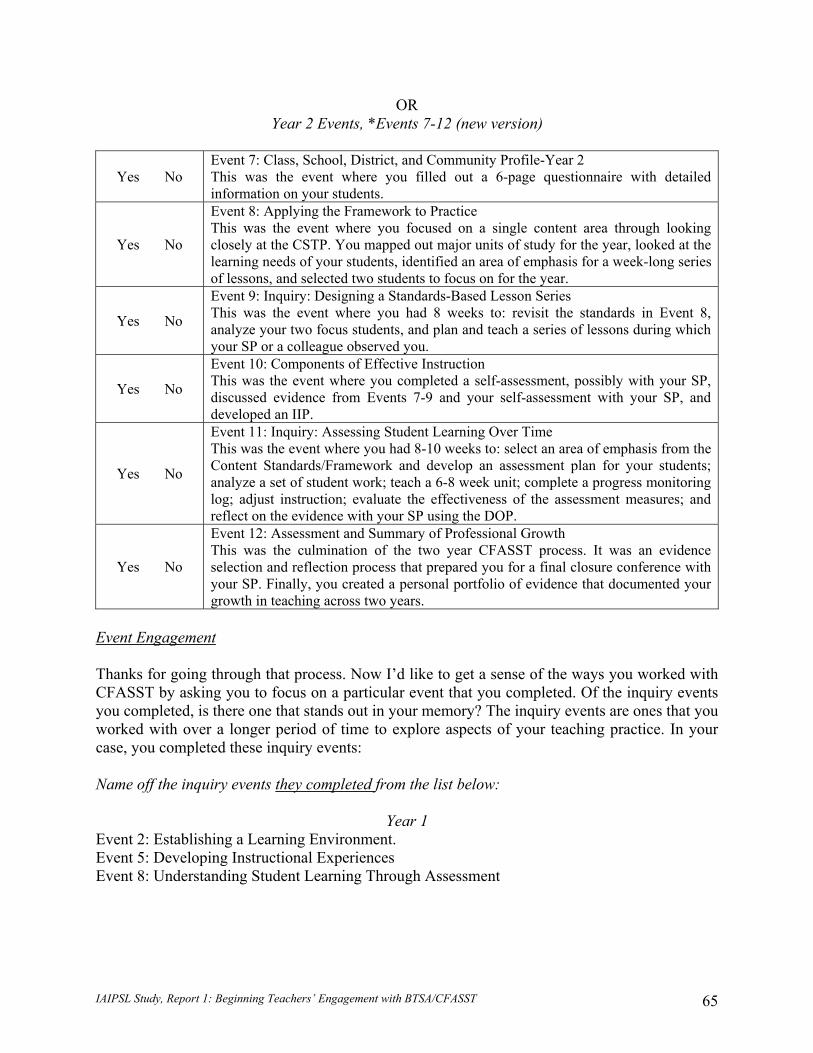
OR Year 2 Events, *Events 7-12 (new version)
Yes No Event 7: Class, School, District, and Community Profile-Year 2 This was the event where you filled out a 6-page questionnaire with detailed information on your students.
Yes No
Event 8: Applying the Framework to Practice This was the event where you focused on a single content area through looking closely at the CSTP. You mapped out major units of study for the year, looked at the learning needs of your students, identified an area of emphasis for a week-long series of lessons, and selected two students to focus on for the year.
Yes No
Event 9: Inquiry: Designing a Standards-Based Lesson Series This was the event where you had 8 weeks to: revisit the standards in Event 8, analyze your two focus students, and plan and teach a series of lessons during which your SP or a colleague observed you.
Yes No
Event 10: Components of Effective Instruction This was the event where you completed a self-assessment, possibly with your SP, discussed evidence from Events 7-9 and your self-assessment with your SP, and developed an IIP.
Yes No
Event 11: Inquiry: Assessing Student Learning Over Time This was the event where you had 8-10 weeks to: select an area of emphasis from the Content Standards/Framework and develop an assessment plan for your students; analyze a set of student work; teach a 6-8 week unit; complete a progress monitoring log; adjust instruction; evaluate the effectiveness of the assessment measures; and reflect on the evidence with your SP using the DOP.
Yes No
Event 12: Assessment and Summary of Professional Growth This was the culmination of the two year CFASST process. It was an evidence selection and reflection process that prepared you for a final closure conference with your SP. Finally, you created a personal portfolio of evidence that documented your growth in teaching across two years.
Event Engagement Thanks for going through that process. Now I’d like to get a sense of the ways you worked with CFASST by asking you to focus on a particular event that you completed. Of the inquiry events you completed, is there one that stands out in your memory? The inquiry events are ones that you worked with over a longer period of time to explore aspects of your teaching practice. In your case, you completed these inquiry events: Name off the inquiry events they completed from the list below:
Year 1 Event 2: Establishing a Learning Environment. Event 5: Developing Instructional Experiences Event 8: Understanding Student Learning Through Assessment
IAIPSL Study, Report 1: Beginning Teachers’ Engagement with BTSA/CFASST 65

Year 2, *Events 11-17 (old version) Event 13: Designing a Standards-Based Lesson Series Event 15: Using Assessment to Design Instruction
OR
Year 2 Events, *Events 7-12 (new version) CFASST 9: Inquiry: Designing a Standards-Based Lesson Series CFASST 11: Inquiry: Assessing Student Learning over Time
Does one of these seem particularly memorable to you? If they answer Yes, continue with Question 4. If no, SKIP to Question 11.
Event they are focusing on: _______________________________________ 4. Tell me about that event—why does it stand out for you?
PROBE: What did you focus on in the event?
(Among other things, you’re trying to get to some memory of the lesson that they featured or the kind of content they were covering or the kind of teaching techniques or assessment techniques they focused on in the inquiry.)
5. Did you do the whole event, or pick certain parts to complete?
PROBE if they DID PARTS: Which parts did you do, and which parts did you not do? Prompt if you need to, with a reminder of the main activities in the Event (see the Overview).
6. In this event, do you recall whether you wrote down most of your responses to the questions
on the CFASST forms, discussed them with your Support Provider, or did both?
PROBE if “BOTH”: Did you tend to discuss and write together, or did you alternate between working with your support provider and working independently?
7. Now I want to ask you some more questions about the way you worked with your Support Provider on this event, and in general.
a. About how often, and for how long, do you think you met with your support provider to
work on this event?
PROBE for length of meetings if not provided: You said that you met ___ times during this event. Can you give me an idea of how long those meetings were?
b. Did you and your support provider talk about the [standards/ lessons/ assessments/ student
work] in this event?
PROBE if they say Yes, but don’t give any details of what they discussed: What exactly did you discuss about the [standards/ lessons/ assessments/ student work]?
PROBE until no more forthcoming: Anything else you discussed or did?
IAIPSL Study, Report 1: Beginning Teachers’ Engagement with BTSA/CFASST 66
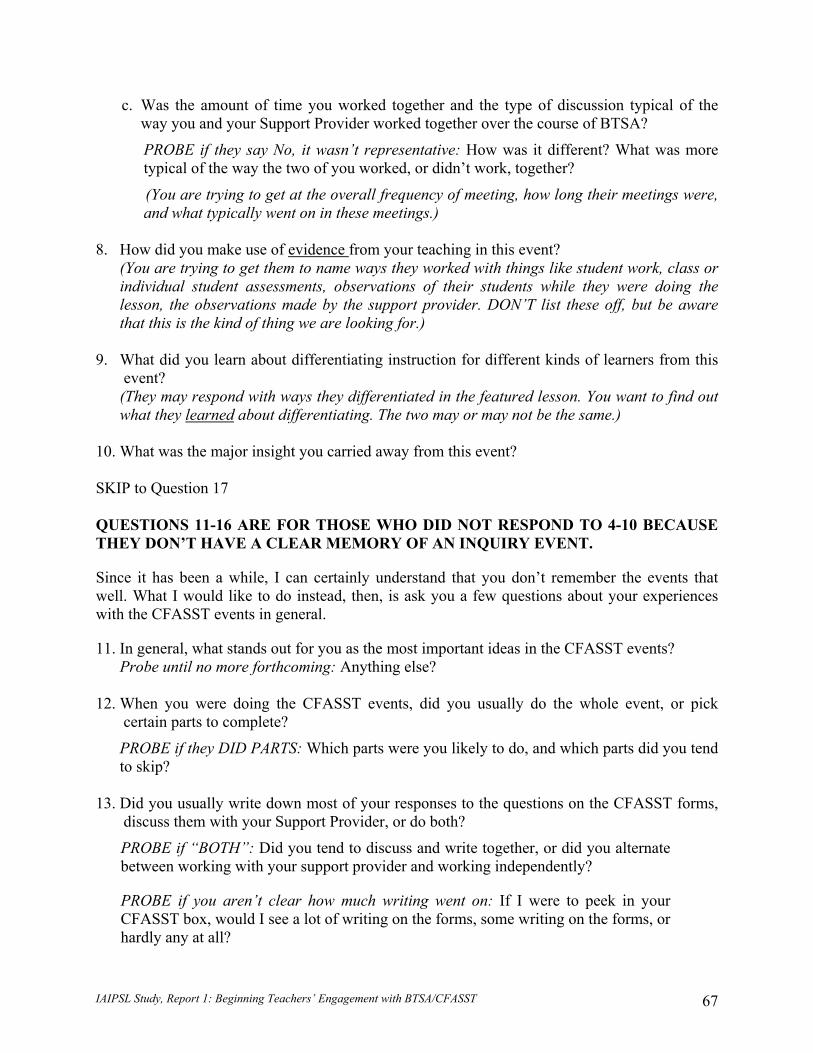
c. Was the amount of time you worked together and the type of discussion typical of the way you and your Support Provider worked together over the course of BTSA?
PROBE if they say No, it wasn’t representative: How was it different? What was more typical of the way the two of you worked, or didn’t work, together?
(You are trying to get at the overall frequency of meeting, how long their meetings were, and what typically went on in these meetings.)
8. How did you make use of evidence from your teaching in this event?
(You are trying to get them to name ways they worked with things like student work, class or individual student assessments, observations of their students while they were doing the lesson, the observations made by the support provider. DON’T list these off, but be aware that this is the kind of thing we are looking for.)
9. What did you learn about differentiating instruction for different kinds of learners from this
event? (They may respond with ways they differentiated in the featured lesson. You want to find out what they learned about differentiating. The two may or may not be the same.)
10. What was the major insight you carried away from this event? SKIP to Question 17 QUESTIONS 11-16 ARE FOR THOSE WHO DID NOT RESPOND TO 4-10 BECAUSE THEY DON’T HAVE A CLEAR MEMORY OF AN INQUIRY EVENT.
Since it has been a while, I can certainly understand that you don’t remember the events that well. What I would like to do instead, then, is ask you a few questions about your experiences with the CFASST events in general.
11. In general, what stands out for you as the most important ideas in the CFASST events? Probe until no more forthcoming: Anything else?
12. When you were doing the CFASST events, did you usually do the whole event, or pick
certain parts to complete?
PROBE if they DID PARTS: Which parts were you likely to do, and which parts did you tend to skip?
13. Did you usually write down most of your responses to the questions on the CFASST forms,
discuss them with your Support Provider, or do both?
PROBE if “BOTH”: Did you tend to discuss and write together, or did you alternate between working with your support provider and working independently?
PROBE if you aren’t clear how much writing went on: If I were to peek in your CFASST box, would I see a lot of writing on the forms, some writing on the forms, or hardly any at all?
IAIPSL Study, Report 1: Beginning Teachers’ Engagement with BTSA/CFASST 67
14. Now I want to ask you some more questions about the way you worked with your Support Provider. a. About how often, and for how long, do you think you met with your Support provider? (You are trying to get at the overall frequency of meeting and how long their meetings
were.) b. What exactly would you discuss and do with your Support Provider? (You are trying to get at what typically went on in these meetings.)
15. As you were doing the CFASST events, did you make use of evidence from your teaching?
(You are trying to get them to name ways they worked with things like student work, class or individual student assessments, observations of their students while they were doing the lesson, the observations made by the support provider. DON’T list these off, but be aware that this is the kind of thing we are looking for.)
PROBE: Can you give me a specific example of the way you used evidence from your teaching? Probe until no more forthcoming: Anything else?
16. Did you learn anything about differentiating instruction for different kinds of learners from
CFASST?
PROBE: Can you give me a specific example of this? Probe until no more forthcoming: Anything else?
Pre-Service Preparation That’s great. Now I would like to learn a little bit more about your pre-service preparation—what you did to get ready to teach. 17. Can you describe the experiences you had in classrooms BEFORE you became a teacher
with your own classroom? I am interested to know about everything you did that put you in classrooms, including:
Any work you did as a paraprofessional or teacher’s assistant before you became a teacher
Any observations and student teaching you did, and
Any intern, pre-intern, or other school-based programs you attended
The idea here is to get enough information to be able to characterize the teacher’s pre-service experiences in classrooms as 1) low (little or none); 2) medium (some, but not extensive); 3) high (a great deal of classroom experience). We haven’t figured out the exact coding scheme for this, but that’s what we are shooting for. Getting AMOUNTS of time will be important. For example, if they say “I had to do observations for my program,” ask “How many hours of observations did you have to complete?”
For student teaching, ask, “How many weeks of student teaching did you do?”
IAIPSL Study, Report 1: Beginning Teachers’ Engagement with BTSA/CFASST 68
And for student teaching, get the sense of level responsibility they had in the classroom they were in.
If they worked as a paraprofessional, ask, “How many years did you do that?” Conclusion of Interview We’re almost done with the formal interview; I have one more question. 18. Now that you've gained experience as a teacher and you're no longer involved with BTSA,
how useful or relevant was your experience in the program? In other words, did BTSA, or the CFASST events, or working with your Support Provider have an influence on the way you teach now?
PROBE if no specifics: Can you give me a specific example of the way your induction experiences influence the way you teach now?
PROBE until no more forthcoming: Can you offer me another example of the way your induction experiences influence the way you teach now?
End of Interview. Shut off Tape Recorder and Proceed to Recruitment for Case Study.
Recruitment for Case Study
Thank you so much for answering all my questions. The information you provided will be enormously helpful to our study. Now I am hoping that you had enough fun with the interview that you will agree to continue to help us out, by participating in the next phase of the research. As I mentioned earlier, this next phase involves us visiting your classroom two times. We are offering $170 to teachers who participate in this part of the study, which we call the case studies. This next phase won’t rely on your memory of your BTSA experiences. In the case studies, we are interested in seeing you in action in your own classroom. We want to understand your current teaching situation, the way you teach, and how you think about your teaching and students. A researcher would come to your classroom with a video camera on two distinct occasions, at a time when you would be teaching an English Language Arts lesson, on a topic you would have worked on with your students even if we were not present. Before each observation, we would like to speak with you briefly to get some background on your students and the lesson you are about to teach. Then we would observe the lesson, which takes as long as you it normally takes in your classroom. Immediately following the lesson, we would like to speak to four students, for no more than 5-10 minutes each, to ask them about the lesson in which they just participated. We can interview the students in a nearby conference room or in the hall—whatever makes sense in your school. Finally, we would like to speak with you after the observation to get your perceptions of how the lesson went. To summarize the thrust of the classroom visits, then, we would like to come to your school twice to see you and your class. During each visit, we would:
Do a brief pre-observation interview with you, about 10-15 minutes in length Observe an English Language Arts lesson
IAIPSL Study, Report 1: Beginning Teachers’ Engagement with BTSA/CFASST 69
Briefly interview four randomly chosen students about the lesson, and Do a post-lesson interview with you.
At the end of the second observation, the post-observation interview may be a little bit longer, because we may have some additional questions to ask you so that we have a solid idea of your approach to teaching. Now, all the precautions I gave earlier about the confidentiality of the interviews would apply to the case studies. No one but a small group of researchers at ETS will ever see the data from the observations and interviews with names attached. We will strip all names from data records, and no individual students, teachers, or schools will be named in any reports. All data analysis will be based on the total group of teachers who participate, not individuals. Again, with these safeguards; there is no way for you or any teacher to suffer negative consequences from participating. You should also know that this research is not at all about your abilities as a teacher. It is to see the ways that the BTSA and CFASST are affecting the way you teach today. Are you interested in participating in the case studies? Agree to Case Studies? Yes ____ No ____ Maybe ____
IAIPSL Study, Report 1: Beginning Teachers’ Engagement with BTSA/CFASST 70

I.N. 725886