beginning college survey of student engagement...
TRANSCRIPT

Beginning College Survey of Student Engagement
(BCSSE) 2009 OSU Results
(Student Affairs Research Report, 01-10)
Rebecca A. Sanderson, PhD
Director, Student Affairs Research and Evaluation
February, 2010

i
Table of Contents
Executive Summary ..................................................................... Executive Summary 1 Introduction ................................................................................................................... 1 Methodology .................................................................................................................. 2 Sample ................................................................................................................. 2 Survey and Administration .................................................................................... 2 Data Analysis ........................................................................................................ 2 Results ........................................................................................................................... 2 BCSSE Mean Scaled Scored ............................................................................... 3 Description of Respondents.................................................................................. 3 High School Academic Engagement .................................................................... 9 Perceived Academic Preparation ....................................................................... 13 Expected Academic Engagement ....................................................................... 17 Expected Academic Perseverance ..................................................................... 21 Expected Academic Difficulty ............................................................................. 25 Importance of Camus Environment .................................................................... 28 Co-Curricular Engagement ................................................................................. 31 Other Engagement Activity ................................................................................. 37 Use of Time in Last Year of High School and Expected Use of Time during First College Year ............................................................................................... 40 Expectations of Integrative Activity during First Year of College ......................... 42 Paying for College .............................................................................................. 45 Discussion and Recommendations ........................................................................... 47 References ................................................................................................................... 51 Appendix A .................................................................................................................. 52

ii
List of Tables Table 1 Respondent Self-Reported Characteristics .................................................. 4 Table 2 Respondent Academic Intentions ................................................................. 5 Table 3 High School Math Classes ........................................................................... 7 Table 4 Number of Years of Courses Taken in Subject Area in High School ............ 8 Table 5 Advanced Placement, Honors, and College Credit Classes Completed in High School .............................................................................................. 8 Table 6 Items Composing High School Academic Engagement Scale(HSE) ............ 9 Table 7 BCSSE Mean Scale Scores and Selected Comparisons (HSE) ................. 10 Table 8 Items Composing Perceived Academic Preparation Scale (PAP ............... 14 Table 9 BCSSE Mean Scale Scores and Selected Comparisons (PAP) ................. 14 Table 10 Items Composing Expected Academic Engagement Scale (EAE) ............. 17 Table 11 BCSSE Mean Scale Scores and Selected Comparisons (EAE) ................. 18 Table 12 Items Composing Expected Academic Perseverance Scale (EAP)............ 22 Table 13 BCSSE Mean Scale Scores and Selected Comparisons (EAP) ................. 22 Table 14 Percent of Students Who Intend to Graduate and Level of Certainty About Finishing Something When Challenges Are Encountered ................ 24 Table 15 Items Composing Expected Academic Difficulty (EAD) .............................. 25 Table 16 BCSSE Mean Scale Scores and Selected Comparisons (EAD) ................. 25 Table 17 Items Composing Importance of Campus Environment Scale (ICE) .......... 28 Table 18 BCSSE Mean Scale Scores and Selected Comparisons (ICE) .................. 29 Table 19 Items Categorized as Co-Curricular Engagement during the Last Year of High School ............................................................................ 32
List of Figures Figure 1 High School Grades Compared to Expected First College Year Grades ...... 6 Figure 2 Numbers of Close Friends Attending OSU during Your First Year ............... 6 Figure 3 Mathematics Classes Passed or Not Taken ................................................. 7 Figure 4 Level of Academic Challenge of High School Reported by Students ........... 9 Figure 5 Amount of Reading/Writing Done in Last Year of High School ................... 11 Figure 6 Hours per Week Preparing for Class in Last Year of High School .............. 11 Figure 7 Frequency of Asking Questions or Making a Class Presentation During Last Year of High School ................................................................ 12 Figure 8 Discussions with Teachers ......................................................................... 12 Figure 9 Active Engagement with Academic Material ............................................... 13 Figure 10 Degree of Writing and Speaking Preparation ............................................. 15 Figure 11 Degree of Preparation for Analytic Thinking, Analyzing Math Problems, and Using Information Technology ............................................................. 16 Figure 12 Preparation for Working with Others and Learning Effectively on One’s Own .................................................................................................. 16 Figure 13 Time Spent Preparing for Class.................................................................. 19 Figure 14 Expected Frequency of Asking Questions or Making Class Presentations during the First College Year ............................................... 19

iii
Figure 15 Expected Active Engagement with Academic Material during the First Year of College ........................................................................................... 20 Figure 16 Expected Discussions with Faculty during the First Year of College .......... 21 Figure 17 Expected Academic Help-Seeking ............................................................. 23 Figure 18 Expected Persistence in the Face of Obstacles ......................................... 24 Figure 19 Expected Academic Difficulties................................................................... 26 Figure 20 Level of Expected Difficulty Paying College Expenses ............................... 27 Figure 21 Level of Expected Difficulty Making New Friends ....................................... 27 Figure 22 Importance of Campus Environment .......................................................... 30 Figure 23 Importance of Campus Environment (2) ..................................................... 30 Figure 24 Mean Levels of Importance of Academic Challenge and Support .............. 31 Figure 25 Level of Involvement in Performing or Visual Arts Programs during Last Year of High School ............................................................................ 32 Figure 26 Level of Involvement in Athletic Teams (varsity, jr varsity, club sports, etc.) during Last Year of High School ................................................................. 33 Figure 27 Degree of Involvement in Student Government during Last Year of High School ................................................................................................ 33 Figure 28 Degree of Involvement in Publications (student newspaper, yearbook, etc.) during Last Year of High School ................................................................. 34 Figure 29 Degree of Involvement in Academic Honor Societies during the Last Year in High School .................................................................................... 34 Figure 30 Degree of Involvement in Academic Clubs (science, math, debate, etc.) during the Last Year in High School ........................................................... 35 Figure 31 Degree of Involvement in Vocational Clubs (business, health, technology, etc.) during the Last Year of High School ................................ 35 Figure 32 Degree of Involvement in Religious Youth Group during the Last Year of High School .................................................................................... 36 Figure 33 Degree of Involvement in Community Service or Volunteer Work during the Last Year of High School ...................................................................... 36 Figure 34 Books Read for Personal Enjoyment or Academic Enrichment .................. 37 Figure 35 Had Serious Conversations with Students Different From You in Terms of Race/Ethnicity ............................................................................. 38 Figure 36 Had Serious Conversations with Students Different from You Regarding Religious Beliefs, Political Opinions, or Personal Values .......... 38 Figure 37 Talked with a Counselor, Teacher, or Other Staff Member about College or Career Plans .......................................................................................... 39 Figure 38 Missed a Day of School .............................................................................. 39 Figure 39 Came to Class Without Completing Readings or Assignments in Last Year of High School .................................................................................... 40 Figure 40 Time Working for Pay ................................................................................. 41 Figure 41 Participating in Co-curricular Activities ....................................................... 41 Figure 42 Relaxing and Socializing ............................................................................ 42 Figure 43 Work on a Paper or Project that Requires Integrating Ideas or Information
from Various Sources ................................................................................. 42 Figure 44 Receive Prompt Feedback from Faculty on Your Academic Performance
(written or oral) ........................................................................................... 43

iv
Figure 45 Work with Faculty Members on Activities Other Than Coursework (committees, orientation, student life activities, etc.) .................................. 43
Figure 46 Put Together Ideas or Concepts from Different Courses When Completing Assignments or During Class Discussion ................................ 44 Figure 47 Try to Understand Better Someone Else’s Views by Imagining How an Issue Looks from His or Her Perspective ...................................... 44 Figure 48 Learn Something that Changes the Way You Understand an Issue or Idea ............................................................................................... 45 Figure 49 Amount of College Expenses during First year Paid by .............................. 46 Figure 50 First Generation Students: Amount of College Expenses Paid during First Year By ............................................................................................... 46 Figure 51 Received a Federal Pell Grant ................................................................... 47
Executive Summary 1
BEGINNING COLLEGE SURVEY OF STUDENT ENGAGEMENT (BCSSE) 2009 OSU Results
Executive Summary
Rebecca A. Sanderson, PhD
Director, Student Affairs Research and Evaluation
OSU entering first year students who attended a summer START session and were 18 years old or older were asked to participate in the Beginning College Survey of Student Engagement (BCSSE) survey. The BCSSE was designed to measure the high school experiences and college expectations of entering first year students. Further the BCSSE parallels the National Survey of Student Engagement (NSSE) which is administered to senior students and first year students during the winter and spring terms. Thus, by using both instruments, the experiences of first year students can be examined in terms of high school experiences, expected experiences in college, and actual college experiences. This report examined the responses of first year students on the BCSSE. Additional reports will be issued after the NSSE data is available in Fall, 2010. A total of 2,924 students were asked to participate in the survey with 2,781 completions which is a return rate of 95%. Approximately 32% of these were first generation college students (defined as no parent or guardian had graduated with a 4-year college degree). Overall respondents reported that they would be full-time students and that they had a high school grade point average of B or better. Most (77%) reported their race as white (non-Hispanic) with about 23% reporting a race other than white. Most (85%) intended to graduate from Oregon State though about 13% were uncertain whether or not they would graduate. Six scales were developed to assess high school academic engagement, expected college academic engagement, perseverance, expected academic difficulty, perception of academic preparation, and the importance of the campus environment in providing both challenge and support. Three scales, showed a mean of over 7.00 on a scale that ranged from 0 (minimum) to 10 (maximum). These scales included: Expected Academic Perseverance, Perceived Academic Preparation, and Importance of the Campus Environment. The remaining three scales showed a mean range of 5.15 to 5.79 with 0 (minimum) to 10 (maximum). Overall, entering students reported a moderate level of high school academic engagement as measured by the High School Academic Engagement Scale with a mean of 5.36 on a scale of 0 (minimum) to 10 (maximum). While some students reported a lot of engagement others reported very minimal or no engagement on the questions that made up this scale. The most frequent response to questions was “some” or “sometimes.” For example when asked how frequently they had worked with classmates outside of class to prepare class assignments, over 50% reported sometimes. Likewise when asked about the frequency of making a class presentation,

Executive Summary 2
over 50% of students reported sometimes. Less than 10% reported very often making a class presentation or working with classmates outside of class to prepare class assignments with another 10% reporting they never engaged in these behaviors. Likewise students reported a moderate expectation for academic involvement during their first year with a mean of 5.79 on a scale of 0 (minimum) to 10 (maximum). While their expectations of academic engagement were somewhat higher than their reported high school engagement experience, it was nevertheless still a modest level of expected academic engagement as measured by the Expected Academic Engagement Scale. Students did overall report that they believed that they were fairly well-prepared academically for their first college year. The mean score on the Perceived Academic Preparation scale was a 7.16 with a range of 0 (minimum) to 10 (maximum). This scale had the highest mean rating of the six scales. Overall students reported that they were prepared fairly well for writing and speaking. Likewise they reported that they were fairly well prepared for thinking critically and analytically. As expected, students reported that they were not as well prepared to analyze math or quantitative problems as they were for other areas in this scale. Students expected to spend more time preparing for class in their first year of college than they had done during their last year of high school. During the last year of high school 64% reported studying 10 hours or less per week. In contrast, only 8% expected to study 10 hours or less per week in college. While only 18% of students reported studying 16 hours or more during their last year of high school, 73% expected to study 16 or more hours per week in their first college year. Further, when asked the frequency with which they expected to work with classmates outside of class to prepare class assignments, over 46% reported that they expected to do this often. Another 30% expected to do this very often during their first college year. Students were fairly certain that they would persist in college in the face of academic adversity. The mean rating on the Expected Academic Perseverance scale was 7.06 with 0 (minimum) and 10 (maximum). Most students reported that they were quite certain that they would ask instructors for help, find additional information for course assignments they did not understand, and finish something they started even when confronted with challenges (frequencies above 50% for these items). Not surprisingly, those students who reported that they did not intend to graduate from OSU showed the least amount of certainty about whether or not they would finish something in the face of challenges. Generally, students reported that they expected a modest amount of academic difficulty in their first college year. The mean rating on the Expected Academic Difficulty scale was 5.15 with a range of 0 (minimum) and 10 (maximum). Approximately 29% rated learning course material as potentially quite difficult for them while only 6% rated learning course material as not very difficult at all. Managing time was the area in which

Executive Summary 3
students expected to have the most difficulty. Students overall reported that they expected little difficulty with getting help with school work or interacting with faculty. Students were fairly clear about the importance of the campus environment in providing both challenge and support. Importance of the Campus Environment scale mean was 7.04 with 0 (minimum) and 10 (maximum) on this scale. About 53% reported that it was quite important to them that the campus provide a challenging academic experience. Only about 2% reported that this was not important to them. Two areas were overall rated as very important to students. These included: support to help them succeed academically and opportunities to attend campus events and activities. The area that was endorsed least often as being important was assistance coping with non-academic responsibilities. Only 10% reported this area as being very important to them. Student involvement in co-curricular activities in high school was somewhat limited in most categories with high involvement including only about 10% of respondents in areas such as performing or visual arts, student government, publications, honor societies, academic or vocational clubs, and religious youth groups. Further, fewer than 25% of students reported that they had very often had serious conversations with students who differed from them in terms of race/ethnicity or religious beliefs, political opinions or personal values. Involvement in athletic teams (varsity, jr varsity, club sports, etc.) had high involvement from about 40% of students. Engagement in community service or volunteer work had high involvement from about 20% of students. In terms of use of time, students expected to work for pay more, study more, participate in co-curricular activities about the same, and relax and socialize a little more than they did in high school. Students also expected to engage in integrative academic activities to a substantial degree during their first college year. Approximately 90% expected to often or very often work on a paper or project that required integrating ideas or information from various sources. Nearly 75% expected to often or very often put together ideas or concepts from different courses when completing assignments or during class discussions. Further, about 80% expected to try to understand better someone else’s views by imagining how an issue looked from his/her perspective. And lastly a little over 80% expected to learn something that changed the way they understood an issue or idea. These results suggested that most incoming students expected to be engaged in reasonably high level intellectual activity during their first college year. As with other surveys (e.g., Sanderson, 2003a, 2003b, 2004, 2005, 2006) of incoming first year students, they have a fairly high opinion of their academic preparation and ability to succeed academically at their chosen college/university. Overall, OSU’s entering students were optimistic about their ability to succeed at OSU. They generally reported feeling well-prepared in most areas with the possible exception of mathematics. Most expected to graduate from OSU with their degree and they expected to engage in the intellectual/academic environment at OSU. They did report that they wanted to have access to campus events and activities and that they wanted access to services that would help them succeed academically. They expected to work more hours for pay, study somewhat more, and have time to relax and socialize a little

Executive Summary 4
than they had in their last year of high school. They were concerned overall about their ability to pay for college and this was especially true for first generation students. This current report provides only a snapshot of the high school experiences and expectations for entering students’ first college year. This is the first of several reports based upon the BCSSE data. Future reports will contain information from BCSSE, Banner, and the NSSE. Recommendations
1. Continue to administer the BCSSE on those years that NSSE is administered. 2. Return to the CIRP freshman survey on years the BCSSE is not administered. 3. Continue to use the BCSSE data with available BANNER data and the NSSE
data to develop key indicators of attrition/retention for first year students. 4. Assess to what degree entering student expectations about the academic
experience are met during their first year.

1
BEGINNING COLLEGE SURVEY OF STUDENT ENGAGEMENT 2009 OSU Results
INTRODUCTION AND OVERVIEW In summer 2009 OSU participated in the Beginning College Survey of Student Engagement (BCSSE). Entering first year students who attended OSU’s START program were invited to participate. This is the first year in which OSU has participated in the BCSSE which has been available publically for three years. The BCSSE was developed to measure the experiences of pre-college students concerning their expectations for and attitudes about participating in educationally purposeful activities during their first year of college. Additionally, the BCSSE also asks participants to provide information on their pre-college academic and co-curricular experiences. In addition the BCSSE parallels the National Survey of Student Engagement (NSSE) in which OSU has participated since 2002. The BCSSE scores of pre-college participants can be matched with first year student scores on the NSSE. The ability to look at student scores before and near the end of their first year of college can provide information about how expectations were met, whether pre-college engagement relates to actual college engagement and where there are areas in further need of development. The NSSE was developed in order to assess the degree to which students were engaged in educationally purposeful activity. These activities were empirically derived from good educational practices. Students who were actively engaged in academic and out-of-class activities benefited more from the collegiate experience than did those students who were not so actively engaged in the educationally related activities available to them (Pascarella and Terenzini, 1991). Chickering and Gamson (1987), after reviewing 50 years of research on teaching and learning, proposed seven principles of good educational practices. These principles served as the organizing principles for the development of the NSSE. Further after their publication, these principles became pivotal influences in education and strongly influenced efforts to assess the quality of the undergraduate student experience. This report is the first of two reports based on the BCSSE and later the combined NSSE and BCSSE data. Since the BCSSE was designed to work with the NSSE, a report combining the BCSSE and the NSSE will be developed that will compare responses on the NSSE to entering student responses on the BCSSE.

2
METHODOLOGY Sample Students who were 18 or over and who attended a summer START program (orientation program) for new first year students were asked to participate in the study by completing the BCSSE survey. A total of 2,924 students were asked to participate with 2,781 students completing the survey for a return rate of 95%. Survey and Administration Students who were attending a summer START session (including Alaska, Hawaii, and California sessions) and who were 18 or over were asked to participate. The paper and pencil survey was administered in a proctored classroom setting after the first welcome activity of the START session. The survey was developed by a team of experts in survey development and student engagement and parallels the National Survey of Student Engagement so that these two surveys can be used in tandem to examine the first year experience. The BCSSE survey contains three sections: high school experiences, expectations and beliefs about their first college year, and background characteristics. Participants were read a standard script prior to beginning the survey. They were also provided with a written explanation of the purpose of the survey, how information would be used and who to contact should they have questions. Completed surveys were electronically scored at the Center for Survey Research at Indiana University. Following scoring of surveys, data tables were available to the researchers via a secure web environment. Data Analysis OSU was provided with frequency distribution tables for each item as well as a summary report of the various engagement scales on the BCSSE. Information on each participant that provided a valid OSU identification number was also obtained using the OSU data warehouse system. This allowed the researchers to examine survey responses for various populations of students (e.g., all HHS students, students enrolled in the Honors College, etc.). Further examination of this information will be conducted throughout the year.
RESULTS
A total of 2,924 students were asked to participate with 2,781 students actually completing the survey for a return rate of 95%. The Results section of this report was divided into sections for ease and clarity of reporting. The first section includes the

3
description of respondents. The next six sections correspond to the BCSSE Mean Scales described below. The final sections include:
• Co-curricular engagement during high school • Use of time in the last year of high school and expected use of time during the
first college year, • Expectations of engagement during the first year of college, and • Paying for college.
BCSSE Mean Scaled Scores Six scales were developed by researchers at the National Survey of Student Engagement (NSSE) at Indiana University. The BCSSE is a project of the NSSE organization. These six standardized scales allow examination of high school experiences as well as student expectations for key aspects important to student engagement and success in college. The six scales include:
• High school academic engagement, • Perceived academic preparation, • Expected academic engagement, • Expected academic perseverance, • Expected academic difficulty, and • Importance of campus environment.
Description of Respondents All respondents completed the BCSSE using a paper/pencil version of the survey while attending OSU START. As expected 99% reported that they anticipated being full-time students. More men than women responded to the survey which mirrors the enrollment of OSU. This finding however is somewhat different as typically more women will respond to surveys than men. It is likely that the classroom setting and monitored survey administration may have influenced this return. Most respondents listed white (non-Hispanic) as their race with approximately 23% reporting a race other than white. Approximately 32% of the respondents were first generation college student, defined as no parent or guardian completed a 4-year degree. Further, most students had attended a public high school (87%) and the majority (53%) reported a high school grade point average of A (i.e., A+, A, A-). Another 46% reported a grade point average of B (i.e., B+, B, B-). Only about 1% reported less than a B average. Table 1 below provides further self-reported information about students who participated in the study.

4
Table 1 Respondent Self-Report Characteristics
Characteristics Count Percent
Enrollment Status Full-time 2735 99 Gender Female 1327 48 Male 1435 52 Race/Ethnicity American Indian or other Native American 38 1 Asian, Asian American, or Pacific Islander 263 10 Black or African American 26 1 White (non-Hispanic) 2120 77 Mexican or Mexican American 73 3 Puerto Rican 2 0 Other Hispanic or Latino 46 2 Multiracial 92 3 Other 29 1 Prefer not to respond 68 2 High School Graduation Year 2006 or earlier 31 1 2007 30 1 2008 88 3 2009 2624 95 First Generation Status (defined as no parent or guardian has graduated with a 4-year college degree)
Yes 817 32 International or Foreign National Student Yes 62 2 Type of High School Public 2423 87 Private, religiously affiliated 305 11 Private, independent 27 1 Home school 11 0 Other (e.g., GED) 10 0 High School Grades A 896 33 A- 561 20 B+ 522 19 B 631 23 B- 104 4 C+ 26 1 C 6 0 C- or lower 1 0 Grades not Used 3 0 Table 2 contains responses from first year students concerning intentions for grades, graduation, degree level, and major area. Most students expected to have a slightly

5
lower grade point average their first year in college than they did for their last year in high school. However, approximately 91% do expect to make at least a B average. Additionally, about one third intend to get a Master’s degree. Table 2
Respondent Academic Intentions
Category Responses Count Percent Expected first year grades A 346 13 A- 710 26 B+ 648 24 B 768 28 B- 178 7 C+ 56 2 C 23 1 C- or below 0 0 Grades not used 2 0 Intend to graduate from OSU No 57 2 Yes 2,354 85 Uncertain 351 13 Highest academic degree intended from any college
Associate’s
20
1
Bachelor’s 745 27 Master’s 899 33 Doctoral 512 19 Uncertain 565 21 Major area Arts and Humanities 104 5 (See Appendix 1 for listing and frequency for OSU majors)
Biological Sciences 274 14 Business 279 14
Education 40 2 Engineering 476 25 Physical Science 54 3 Professional 208 11 Social Science 115 6 Other 376 19 Undecided 5 0 Approximately 20% fewer students expected to get A’s than reported getting A’s in high school. Further for grades A-, B+, and B approximately 55 more of these grades were expected in the first college year. Students in high school anticipate getting lower grades in their first college year. However, they do not appear to expect to get substantially lower grades except in the “A” category of grades. Figure 1 below illustrates the range of high school grades to expected college grades in the first year.

Figure 1
ApproximGeneraltheir firsmale stu
Figure 2
0
5
10
15
20
25
30
35
Perc
ent
1
1
2
2
3
3
4
Perc
ent
mately 25%ly howevert year. Fig
udents and
2
A
0
5
10
15
20
25
30
35
40
None
% of studentr, most studure 2 belowfirst genera
A- B+
HigExpe
e 1
N
Numbe
ts reported dents had aw contains iation stude
B
Grad
gh School Gected First
2
Number of f
er of CloseDuring Y
that they hat least one informationnts and clo
B- C+
des
Grades Cot College Y
3
friends
e Friends AYour First
had no closeclose frien
n on all studse friends a
+ C
ompared toYear Grade
4 or m
Attending OYear
e friends atd attending
dents, femaattending O
C- or below
o es
more
OSU
All
Fe
Ma
Firstu
ttending OSg OSU durinale studentsOSU.
Expected year grade
High schogrades
students
male student
ale students
st generationudents
6
SU. ng s,
first es
ol
ts
n

7
Mathematics is often a stumbling block for students during their first year of college. Most respondents took and passed Algebra II and Pre-calculus/Trigonometry in high school. Approximately 40% reported that they passed calculus and only 26% reported passing probability or statistics. Most students did not take calculus, probability or statistics in high school. Table 3 below contains information about both the mathematics classes taken in high school and whether or not students passed, did not pass, or did not take the classes. Table 3
High School Math Classes
Algebra II Pre-cal/Trig Calculus Probability or Stat Did not pass 0 1% 1% 1% Passed 98% 78% 40% 26% Did not take 1% 21% 59% 73% Most students who took specific math classes reported passing them. However, as the level of mathematics classes increased the percentage of students taking the class decreased. Figure 3
Most (98%) students reported that they took four or more years of high school English. However, fewer students took four years or more of mathematics (74%), science (59%), history/social science (50%) or foreign language (19%). Nationally, for students entering doctoral institutions, the level of preparation in terms of the number of year’s courses were taken differed somewhat from OSU’s results. Nationally, students reported that 98% had taken English for four or more years, the same as those entering OSU. However, 87% reported four or more years of
0%20%40%60%80%
100%120%
Algebra II Pre-cal/Trig Calculus Probability or Stat
Perc
ent
Math Courses
Mathematics Classes Passed or Not Taken
Passed
Did not take

8
mathematics, 71% science, 67% history/social sciences, and 26% foreign languages. Table 4 below contains the percent of OSU entering first year students and the number of years of each subject area studied in high school. Table 4
Number of Years of CoursesTaken in Subject Area in High School
English/ Literature
Math Science History/Social Science
Foreign Language
0 years 0% 0% 0% 0% 1% 1 year 0% 0% 0% 0% 2%
2 years 0% 2% 7% 7% 49% 3 years 1% 24% 34% 42% 29% 4 years 96% 67% 50% 48% 17%
5 + years 2% 7% 9% 2% 2%
Generally, more students had reported taking Advanced Placement (AP) courses, Honors courses and college courses for credit during high school than had not done so. Approximately 67% of high school students had taken at least one AP course, 62% at least one Honors course, and 55% at least one college course for credit during high school. Table 5 below contains the percentage of students who reported taking AP, Honors, or college credit classes in high school and the number of classes taken in each category. Table 5
Advanced Placement, Honors, and College Credit Classes Completed in High School
Advanced
Placement (AP) classes
Honors Classes at your high school (not AP)
College Courses for Credit
0 classes 33% 38% 45% 1 classes 19% 14% 17% 2 classes 15% 13% 12% 3 classes 12% 8% 9% 4 classes 8% 8% 5%
5 + classes 13% 20% 11% Students were asked to evaluate how academically challenging they believed their high school was. Very few students rated their high schools as extremely challenging. Most students (approximately 60%) rated their school at a 4 or better out of 6 with 6 being extremely challenging.

9
Figure 4
High School Academic Engagement High school academic engagement was measured using a scale developed by the NSSE organization and composed of 12 items on the BCSSE survey. These items aligned with similar items on the NSSE. High school academic engagement was defined as “engagement in educationally relevant behaviors during the last year of high school.” Table 6 below contains the items that composed this scale. Table 6
Items Composing High School Academic Engagement Scale High School Academic Engagement (HSE) Engagement in educationally relevant behaviors during the last year of high school
During your last year of high school, about how much reading and writing did you to?
• Assigned reading (textbooks or other course materials) • Writing short papers or reports (5 or fewer pages) • Writing longer papers or reports (more than 5 pages)
During your last year of high school, about how many hours did you spend in a typical 7-day week doing each of the following?
• Preparing for class (studying, doing homework, rehearsing, etc.) During your last year of high school about how often did you do the following?
• Asked questions in class or contributed to class discussions • Made a class presentation • Discussed grades or assignments with a teacher • Worked with other students on projects during class • Worked with classmates outside of class to prepare class assignments • Prepared two or more drafts of a paper or assignment before turning it in • Discussed readings or classes with teachers outside of class • Discussed ideas from your readings or classes with others outside of class
(students, family members, etc.)
05
1015202530354045
1 Not at all challenging
2 3 4 5 6 Extremely
challenging
Perc
ent
Level of Challenge
Level of Academic Challenge of High School Reported by Students
All students
Females
Males
First generation

10
Table 7 below contains the mean scale core for High School Academic Engagement as well as comparisons to scores based on gender and first generation status. Each scale score had a range of 0 to 10. OSU’s mean score for High School Academic Engagement was 5.36. Women reported significantly more high school academic engagement than did men with a moderately low effect size of .31. There were no significant differences between first generation students and those who were not. Table 7
BCSSE Mean Scale Scores and Selected Comparisons
BCSSE Scales a OSU OSU Gender Comparisons OSU First-Generationd Comparisons
High School Academic Engagement HSE)
All Students Means
Tests of mean
differences Means
Tests of mean
differences
Mean SD N Female Male Sigb Effect sizec FG
Non-FG
Sigb
Effect sizec
Engagement in educationally relevant behaviors during the last year of high school.
5.36 1.34 2,781 5.57 5.16 *** .31 5.36 5.37 -.01
a Scale scores are expressed in 0 (minimum) to 10 (maximum) point scales. A mean scale score was then calculated for each student using the items composing the scale. b T-test results (2-tailed): * p<.05, ** p<.01, *** p<.001. The smaller the significance level, the less likely that the difference is due to chance. c Effect size is the mean difference divided by pooled standard deviation. It indicates the practical significance of the mean difference (effect size .2 is often considered small, .5 is moderate, and .8 is large). d First generation is defined as no parent or guardian having graduated with a 4-year college degree.
High School Academic Engagement —Item Level Report Most students reported that they had written short papers (5 or fewer pages) in their last year of high school quite a bit or very much. Less than 5% reported that they had written short papers very little in their last year of high school. Approximately 40% reported that they had written longer papers or reports (more than 5 pages) very little or not at all during their last year of high school. Only 27% indicated that they had written papers of more than 5 pages quite a bit or very much during their last year of high school. Figure 5 below graphically represents the amount of reading/writing students reported doing in their last year of high school.

11
Figure 5
Over 60% of first year students reported that they spent 10 hours or less preparing for class during their last year of high school. Further approximately 95% also reported a high school grade point average of B or better. Thus, for most students studying 10 hours or less was sufficient to receive at least a B average their last year of high school. See Figures 1 and 6. Figure 6
0
5
10
15
20
25
30
35
40
45
None Very little Some Quite a bit Very much
Perc
ent
Amount of Reading/Writing Done in Last Year of High School
Assigned reading (textbooks or other course material)
Writing short papers or reports (5 or fewer pages)
Writing longer papers or reports (more than 5 pages)
0
5
10
15
20
25
30
35
0 1-5 6-10 11-15 16-20 21-25 26-30 > 30
Perc
ent
Hours per Week
Hours per Week Preparing for Class in Last Year of High School

12
Students were more likely to ask questions in class or participate in class discussions than they were to make a class presentation. While most students reported at least sometimes making a class presentation, nearly all students indicated that they had asked questions or contributed in some way to class discussion. Figure 7 below contains information on the frequency with which students made class presentations or asked questions/contributed to class discussion. Figure 7
Not unexpectedly students were more likely to talk with teachers about grades or assignments than they were to talk with teachers outside of class about ideas from readings or assignments. Figure 8 contains information about the frequency with which students talked with high school teachers about these two areas. Figure 8
0
10
20
30
40
50
60
Never Sometimes Often Very often
Perc
ent
Frequency of Asking Questions or Making a Class Presentation During Last Year of High School
Asked questions in class or contributed to class discussion
Made a class presentation
0
10
20
30
40
50
60
Never Sometimes Often Very often
Perc
ent
Discussions with TeachersDiscussed grades or assignments with a teacher
Discussed ideas from your readings or classes with teachers outside of class

Most studuring cpractice assignmclass on Generalclasses (87%) inassignm Figure 9
Perceiv This secacademfocus on StudentsdimensioAcadem
0
10
20
30
40
50
60
Perc
ent
udents (60%class often o
did not carments. In thn projects.
ly studentswith others
ndicated thament before
9
ved Academ
ction of the ic preparat
n skills that
s were askeons. Table
mic Preparat
0
0
0
0
0
0
0
Workedother stud
projects clas
%) were accor very ofterry over to what case on
s (93%) indis outside ofat they at leturning it in
mic Prepar
report contion for colleare essent
ed how pree 8 below cotion Scale o
d with dents on during
ss
Wc
outto p
as
Active E
customed ten during thworking witly 34% repo
cated that tf class at leeast sometin. See Figu
ration
tains informege-level wtial for acad
epared theyontains the of the BCSS
Worked with classmates side of class
prepare classssignments
Engagemen
to working weir last yeah classmatorted that th
they talkedast some omes preparure 9 below
mation on thwork. The sdemic succe
y were to bespecific ite
SE.
s
Discussed from yo
readingsclasses w
others outsclass
nt with Aca
with other sar of high sctes outside hey worked
about ideaof the time. red two or m
w.
he studentscale is madess in colle
e successfuems that co
ideas our s or with side of s
Prepamore
pass
befor
ademic Ma
students onchool. Thouof class to
d with other
as from readLikewise m
more drafts
’ perceptionde up of sev
ege.
ul in collegempose the
ared two or e drafts of a paper or signment re turning it
in
aterial
projects ugh this prepare cla
rs outside o
dings or most studens of a paper
ns of their ven items t
e along thesPerceived
Never
Sometim
Often
Very ofte
13
ass of
nts r or
that
se 7
mes
en

14
Table 8
Items Composing Perceived Academic Preparation (PAP) Scale Perceived Academic Preparation (PAP) Student perception of their academic preparation
How prepared are you to do the following in your academic work at this college? • Write clearly and effectively • Speak clearly and effectively • Think critically and analytically • Analyze math or quantitative problems • Use computing and information technology • Work effectively with others • Learn effectively on your own
All of the students who took the BCSSE expressed confidence in their level of academic preparation as measured by the PAP scale. With a mean of 7.16 with a range of 0 (minimum) and 10 (maximum) students indicated confidence in their preparation for college. Overall males expressed more perceived confidence in their level of preparation than did females. Likewise, non-first generation students reported more confidence in their preparation than did first generation students. Table 9 below contains the means, significance levels and effect sizes for the comparisons. Table 9
BCSSE Mean Scale Scores and Selected Comparisons
BCSSE Scales a
OSU
All Students
Gender Comparisons First-Generationd Comparisons
Means Tests of mean differences
Means Tests of mean
differences Mean SD N Female Male Sigb Effect
sizec FG Non-
FG Sig
b Effect sizec
Perceived Academic Preparation (PAP) Student perception of their academic preparation.
7.16 1.39 2,781 7.10 7.22 * -.09 7.02 7.25 *** -.17
a Scale scores are expressed in 0 (minimum) to 10 (maximum) point scales. See the following page for complete scale descriptions and component items. b T-test results (2-tailed): * p<.05, ** p<.01, *** p<.001. The smaller the significance level, the less likely that the difference is due to chance. c Effect size is the mean difference divided by pooled standard deviation. It indicates the practical significance of the mean difference (effect size .2 is often considered small, .5 is moderate, and .8 is large). d First generation is defined as no parent or guardian having graduated with a 4-year college degree.

15
Perceived Academic Preparation—Item Level Report Generally, students reported that they were better prepared in writing than in speaking during high school. However, overall most students rated their preparation in these areas a 4 or above on a 6-point scale. See Figure 10 below. Figure 10
Figure 11 below contains information on the relative rating of preparedness for critical thinking, analyzing math/quantitative problems and using technology. Overall students rated their preparation fairly highly in all three areas. As expected however, the area rated less in terms of preparation was in analyzing math or quantitative problems. Approximately 89% of students rated their preparation in critical thinking as 4 or above on a 6 point scale (1 = not very prepared, 6 = very prepared). Likewise 78% rated their preparation for using computer or information technology at a 4 or above using the same scale. While student ratings for preparation in analyzing math or quantitative problems were less than the other two areas, 70% rated their preparation at 4 or above.
05
101520253035
1 Not at all prepared
2 3 4 5 6 Very prepared
Perc
ent
Degree of Preparation
Degree of Writing and Speaking Preparation
Write clearly and effectively Speak clearly and effectively

16
Figure 11
Approximately 95% of students indicated that they felt prepared to work effectively with others. Further 90% reported that they were prepared to learn effectively on their own. Figure 12 below contains the student ratings on their preparedness to work effectively with others and to learn effectively on their own. Figure 12
05
10152025303540
1 Not at all
prepared
2 3 4 5 6 Very prepared
Perc
ent
Degree of Preparation
Degree of Preparation for Analytic Thinking, Analyzing Math Problems, and Using Information Technology
Think critically and analytically
Analyze math or quantitative problems
Use computing and information technology
05
1015202530354045
1 Not at all prepared
2 3 4 5 6 Very prepared
Perc
ent
Degree of Preparation
Preparation for Working with Others and Learning Effectively on One's Own
Work effectively with others
Learn effectively on your own

17
Expected Academic Engagement Students were asked to estimate the frequency with which they would pursue specific academic engagement activities during their first year of college. Table 10 below contains the definition of Expected Academic Engagement as well as the specific survey items that composed this scale. Table 10
Items Composing Expected Academic Engagement Scale Expected Academic Engagement (EAE) Expected engagement in educationally relevant behaviors during the first year of college
During the coming school year, about how many hours do you think you will spend in a typical 7-day week doing?
• Preparing for class (studying, reading, writing, doing homework or lab work, analyzing data, rehearsing, and other academic activities
During the coming school year, about how often do you expect to do each of the following?
• Ask questions in class or contribute to class discussions • Make a class presentation • Work with other students on projects during class • Work with classmates outside of class to prepare class assignments • Discussed grades or assignments with an instructor • Discuss ideas from your readings or classes with faculty members outside
of class • Discuss ideas from your readings or classes with others outside of class
(students, family members, co-workers, etc.)
Students expected to engage in educationally relevant behaviors during their first year to a medium degree. The mean rating was 5.79 with a scale range of 0 (minimum)-10 (maximum). Men and women showed a significant difference between their expected academic engagement with women expecting more engagement than did men. This has been the typical pattern for differences between men and women regarding expected engagement. Further first generation students showed significantly more expectation of academic engagement than did non-first generation students. Table 11 below contains the means, standard deviations, significance, and effect sizes for comparisons. While there were significant differences reported, the effect sizes were small.

18
Table 11
BCSSE Mean Scale Scores and Selected Comparisons
BCSSE Scales a
OSU OSU Gender Comparisons OSU First-Generationd Comparisons
All Students Means Tests of mean
differences
Means Tests of mean
differences Mean SD N Female Male Sigb Effect
sizec FG Non-
FG Sigb Effect
sizec Expected Academic Engagement (EAE) Expected engagement in educationally relevant behaviors during the first year of college.
5.79 1.45 2,781 5.88 5.70 ** .12 5.94 5.72 *** .15
a Scale scores are expressed in 0 (minimum) to 10 (maximum) point scales. A mean scale score was then calculated for each student using the items composing the scale. b T-test results (2-tailed): * p<.05, ** p<.01, *** p<.001. The smaller the significance level, the less likely that the difference is due to chance. c Effect size is the mean difference divided by pooled standard deviation. It indicates the practical significance of the mean difference (effect size .2 is often considered small, .5 is moderate, and .8 is large). d First generation is defined as no parent or guardian having graduated with a 4-year college degree.
Expected Academic Engagement—Individual Item Report Each of the items that made up the Expected Academic Engagement scale is reported on below. Students generally expected to spend more time preparing for class in their first year of college than they had done during their last year of high school. During the last year of high school 64% reported studying 10 hours or less per week. In contrast, only 8% expected to study 10 hours or less per week in college. While only 18% of students reported studying 16 hours or more during their last year of high school, 73% expected to study 16 or more hours per week in their first college year. Figure 13 below contains the graphic comparison of frequencies for time spent studying in the last year of high school and expected first year of college.

Figure 1
Studentswere soschool. school thdiscussiduring th Studentsconcernapproximpresentapresenta Figure 1
Student first colle
05
101520253035
Perc
ent
0102030405060
Perc
ent
3
s’ expectatmewhat difApproxima
hey had oftons. Howeheir first co
s reported ing making
mately 46%ations in theations often
4
expectatioege year w
05050505
0
0000000
Nev
Ma
ions for askfferent thanately 66% oten or very ever, 70% ellege year.
little differeg a class pre% of student
eir last yean or very oft
ns for workere high wi
1-5 6-10
Ti
ver So
Expecaking a Cla
king questio their repor
of students often asked
expected to
nce betweeesentationts reported r of high scten during t
king with othth 95% exp
0 11-15
Hours pe
me Spent
ometimes
cted Frequeass Presen
ons in classrted behavireported thd questions
o often or ve
en past beh(see Figurethat they h
chool, only 4their first co
her studentpecting to d
16-20 21-2
r Week
Preparing
Often
ency of Asntation dur
s or contribuor during that during th
s in class orery often en
havior and fe 7 and Figad often or44% expecollege year.
ts on projecdo this at lea
25 26-30
for Class
Very
sking Quesring the Fir
uting to claheir last yeaheir last year contributengage in the
future expeure 14). Wr very often cted to make.
cts during cast some o
> 30
often
stions or rst College
Actod
Mp
ss discussiar of high ar of high ed to class ese behavi
ectations While
made clase a class
class in theiof the time.
Expected in fcollege year
Last year of hschool
eYear
Asked questiolass or contro class iscussions
Make a class presentation
19
ions
ors
s
r
first
high
ons in ribute

Likewiseprepare behavioworked wthey hadto prepa ApproximreadingsInterestibehavioover pretalked toFigures and exp Figure 1
ApproximassignmNearly twHaving dclasses of studeduring th
05
101520253035404550
Perc
ent
e 96% expeassignmenr during thewith other sd worked ware assignm
mately 96%s and classngly 58% er during the
evious behao others out9 and 15 cected futur
5
mately 99%ments with fa
wo-thirds adiscussionswas also ents. Aboutheir first yea
05050505050
Neve
Exp
ected to wonts. In termeir last yearstudents du
with high schments.
% of studentses with othexpected toeir last yearavior. Durintside of clasontain the f
re behavior.
% of studentaculty memlso expecte
s with facultxpected to t 39% also ear. When c
er Som
pected Actdu
ork with clasms of how thr of high schuring class ohool classm
ts reported ers outside
o do this ofter of high schng their lastss about idfrequency d.
ts reported mbers at leaed to have tty outside ohappen at expected tocomparing t
metimes
tive Engaguring the F
ssmates ouhese expechool, abouton projects
mates at lea
that they ee of class aten or very ohool, this ist year of higeas from redistributions
that they east sometimthis discussof class timleast some
o have thestheir previo
Often
gement witFirst Year o
utside of clactations comt 99% of stus. Additionaast some of
expected to t least somoften. Coms an increasgh school oeadings or cs for past b
expected to me during thsion often oe about ide
etimes durinse conversaous behavio
Very o
th Academof College
ass at least mpared to thudents repoally 91% ref the time ou
discuss idee of the tim
mpared to thse in their eonly 48% reclass exper
behavior in t
discuss grheir first yeaor very ofteeas from reang that first ations oftenor in terms o
often
ic Material
Wstdu
Wclaofcla
Diyoclaou(smwo
sometimesheir reporteorted havingported that utside of cla
eas from me. heir reporteexpectationseported havriences. these areas
rades or ar in collegen. adings or year by 94
n or very oftof talking w
l
Work with otheudents on prouring class
Work with assmates outf class to prepass assignme
iscuss ideas four readings oasses with otutside of classtudents, famiembers, co-orkers, etc.)
20
s to ed g
ass
ed s
ving
s
e.
4% ten
with
er ojects
tside pare ents
from or hers s ly

faculty aduring ththese kin Studentsexpect mand 8. Figure 1
Expecte This scathey facwork to unable o Table 12Expecte
0
10
20
30
40
50
60
Perc
ent
about ideasheir last yeands of conv
s overall exmore in term
6
ed Academ
ale represene obstaclesovercome tor do not kn
2 below coned Academi
Neve
Expec
s, only abouar with highversations w
xpected to hms of discu
mic Perseve
nts the degs or difficultthem have now how to
ntains the dc Persever
er So
cted Discu
ut 76% indich school facwith high sc
have more ssing ideas
erance
ree to whict choices. Sa better ch manage ad
definition anrance scale
metimes
ussions wit
cated that tculty. Only chool facult
conversatios with facult
ch students Students wance of condversity/ch
nd the spece.
Often
th Faculty College
hey had ha26% repor
ty often or v
ons with facty outside o
believe theho are ablentinuing in sallenge.
cific questio
Very
during the
ad these corted that thevery often.
culty and thof class. Se
ey will perse to face obschool than
ons that ma
y often
e First Year
nversationsey had had
hey tendedee Figures 1
ist even whbstacles andn those who
de up the
r of
Discuss graor assignmewith an instr
Discuss ideafrom your readings or classes withfaculty memoutside of cl
21
s
to 16
hen d o are
ades ents ructor
as
h mbers
lass

22
Table 12
Items Composing Expected Academic Perseverance Scale Expected Academic Perseverance (EAP) Student certainty that they will persist in the face of academic adversity
During the coming school year, how certain are you that you will do the following?
• Study when there are other interesting things to do • Find additional information for course assignments when you don’t understand
the material • Participate regularly in course discussions, even when you don’t feel like it • Ask instructors for help when you struggle with course assignments • Finish something you have started when you encounter challenges • Stay positive, even when you do poorly on a test or assignment
The mean score of student certainty that they will persist in the face of obstacles is relatively high at 7.06 on a scale of 0 (minimum) to 10 (maximum). Women showed a significantly higher mean than did men while first generation and non-first generation showed no difference in expected academic perseverance. See Table 13 below. Table 13
BCSSE Mean Scale Scores and Selected Comparisons
BCSSE Scales a
OSU
All Students
OSU Gender Comparisons OSU First-Generationd Comparisons
Means Tests of mean differences
Means Tests of mean
differences Mean SD N Female Male Sigb Effect
sizec FG Non-
FG Sigb Effect
sizec Expected Academic Perseverance (EAP) Student certainty that they will persist in the face of academic adversity.
7.06 1.45 2,781 7.19 6.93 *** .18 7.09 7.04 .04
a Scale scores are expressed in 0 (minimum) to 10 (maximum) point scales. See the following page for complete scale descriptions and component items. b T-test results (2-tailed): * p<.05, ** p<.01, *** p<.001. The smaller the significance level, the less likely that the difference is due to chance. c Effect size is the mean difference divided by pooled standard deviation. It indicates the practical significance of the mean difference (effect size .2 is often considered small, .5 is moderate, and .8 is large). d First generation is defined as no parent or guardian having graduated with a 4-year college degree.

23
Expected Academic Perseverance—Individual Item Report Approximately 60% of students reported that they were certain (rating 5 or 6) on a 6 point scale that they would ask instructors for help when they encountered difficulties with course assignments. Another 37% were somewhat certain (rating of 3 or 4) that they would seek help from faculty. Likewise only 61% indicated that they were certain that they would find additional information for course assignments when they were not understood. Another 38% were somewhat certain that they would seek out additional information for course assignments that were not understood. See Figure 17 below. Figure 17
About 30% of students indicated a high degree of certainty (5 or 6 on a 6 point scale) that they would participate regularly in course discussions, even when they did not feel like it. Likewise only 37% indicated that they were pretty certain that they would study even when there were other interesting things to do (5 or 6 on a 6 point scale). With the myriad of distractions available on a campus, it seems likely that a large proportion of students will have difficulty choosing to study when there are other interesting things to do. Students reported more certainty that they would finish something they started even when they encountered challenges. Nearly 72% reported a high degree of certainty (rating of 5 or 6 on a 6 point scale) that they would persist in the face of challenges. However, only 57% reported a high degree of certainty (rating of 5 or 6 on a 6 point scale) that they would stay positive even when they had done poorly on a test or assignment. See Figure 18 below.
05
10152025303540
1 Not at all certain
2 3 4 5 6 Very certain
Perc
ent
Level of Certainty
Expected Academic Help-Seeking
Ask instructors for help when you struggle with course assignments
Find additional information for course assignments when you don’t understand the material

24
Figure 18
Of those students who reported that they intended to graduate from OSU only 35.7% were very certain that they would finish something when they encountered challenges. Likewise, 30.4% who were less certain about graduating from OSU were very certain that they would finish something when they encountered challenges. As might be expected, those students who did not intend to graduate from OSU showed the least amount of certainty about whether or not they would finish something in the face of challenges. Table 14 below contains the percentage of students who intended to graduate and their level of certainty about finishing something when they encountered challenges. Table 14
Percent of Students Who Intend to Graduate and Level of Certainty about Finishing Something When Challenges Are Encountered
Intend to graduate from OSU Finish something you started when you encounter challenges
No
Yes
Uncertain
Not at all certain 1 1.8% 0.1% 0.3% 2 0.0% 0.5% 2.0% 3 8.8% 5.1% 6.9% 4 38.6% 21.0% 23.5% 5 29.8% 37.7% 37.0%
Very certain 6 21.1% 35.7% 30.4%
05
1015202530354045
1 Not at all certain
2 3 4 5 6 Very certain
Perc
ent
Level of Certainty
Expected Persistence in the Face of ObstaclesParticipate regularly in course discussions, even when you don’t feel like itStudy when there are other interesting things to do
Finish something you have started when you encounter challengesStay positive, even when you do poorly on a test or assignment

25
Expected Academic Difficulty The academic experience at the college or university level is much different than the high school academic experience. Thus, students were asked to assess the level of expected difficulty they would have managing the collegiate academic environment. Table 15 below contains the definition and the survey items that composed this scale. Table 15
Items Composing Expected Academic Difficulty (EAD) Expected Academic Difficulty (EAD) Expected academic difficulty during the first year of college
During the coming school year, how difficult do you expect the following to be?
• Learning course material • Managing your time • Getting help with school work • Interacting with faculty
Students’ mean rating of expected difficulty was 5.15 with a scale range of 0 (minimum) and 10 (maximum). This suggests that students are not necessarily expecting a great deal of difficulty managing the academic environment during their first college year. There were no significant differences between male and female ratings and first generation and non-first generation students in their mean ratings. See Table 16 below. Table 16
BCSSE Mean Scale Scores and Selected Comparisons
BCSSE Scales a
OSU
All Students
OSU Gender Comparisons OSU First-Generationd Comparisons
Means Tests of mean differences
Means Tests of mean
differences Mean SD N Female Male Sigb Effect
sizec FG Non-
FG Sig
b Effect sizec
Expected Academic Difficulty (EAD)
5.15 1.48 2,781 5.20 5.11 .06 5.14 5.14 -.01 Expected academic difficulty during the first year of college.
a Scale scores are expressed in 0 (minimum) to 10 (maximum) point scales. See the following page for complete scale descriptions and component items. b T-test results (2-tailed): * p<.05, ** p<.01, *** p<.001. The smaller the significance level, the less likely that the difference is due to chance. c Effect size is the mean difference divided by pooled standard deviation. It indicates the practical significance of the mean difference (effect size .2 is often considered small, .5 is moderate, and .8 is large). d First generation is defined as no parent or guardian having graduated with a 4-year college degree.

26
Expected Academic Difficulties—Individual Item Report Four survey items made up the Expected Academic Difficulties scale. Figure 19 below contains the levels of difficulty and the frequency for each item. Approximately 29% of students rated learning course material as potentially quite difficult for them (rating of 5 or 6, on a 6-point scale), while only 6 % rated learning course material as not very difficult for them (rating of 1 or 2, on a 6-point scale). Approximately 30% students rated getting help with coursework as not very difficult for them (rating of 1 or 2). Likewise about 30% rated interacting with faculty as not very difficult for them (rating of 1 or 2). About 10% rated getting help with coursework as potentially quite difficult for them (rating of 5 or 6). Again likewise, only 9% reported that interacting with faculty might be quite difficult for them (rating of 5 or 6). Managing time was the area in which students expected to have the most difficulty. Approximately 49% expected that managing time might be quite difficult for them (rating of 5 or 6). Only about 10% expected that managing time would not be very difficult (rating 1 or 2). See Figure 19. Figure 19
Additional Areas of Potential Difficulty While only four survey items were used to develop the Expected Academic Difficulties scale, two other areas were also assessed in terms of the students’ expectations of experiencing difficulties. These included: (1) Expected difficulty paying for college expenses, and (2) Expected difficulty making new friends.
05
101520253035404550
1 Not at all difficult
2 3 4 5 6 Very difficult
Perc
ent
Degree of Difficulty
Expected Academic Difficulties
Learning course material
Managing your time
Getting help with school work
Interacting with faculty

27
First generation students (~56%) and female students (~45%) expressed the greatest level of expected difficulty paying for their college expenses. Only 7% of first generation students and 9% of female students reported that they expected no difficulty paying for college expenses. The following two figures (20 and 21) contain the frequency distribution of student ratings on level of difficulty expected for these two areas. Figure 20
Most students expressed very little concern about making new friends. Only about 7% of any of the listed groups in Figure 21 expressed any substantial expectation of difficulty in this area. Figure 21
05
101520253035
1 Not at all difficult
2 3 4 5 6 Very Difficult
Perc
ent
Level of Difficulty
Level of Expected Difficulty Paying College Expenses
All studentsFemales
Males
First generation
05
10152025303540
1 Not at all difficult
2 3 4 5 6 Very Difficult
Perc
ent
Level of Difficulty
Level of Expected Difficulty Making New Friends
All students
Females
Males
First generation

28
Importance of Campus Environment The Importance of the Campus Environment scale asked students to rate how important it is that the institution provides both a challenging and supportive environment. The specific questions that composed this scale are related to elements on a campus that demonstrate both challenge and support. These are contained in Table 17 below. Table 17
Items Composing Importance of Campus Environment (ICE) Scale Importance of Campus Environment (ICE) Student-related importance that the institution provides a challenging and supportive environment
How important is it to you that your college or university provides each of the following?
• A challenging academic experience • Support to help you succeed academically • Opportunities to interact with students from different economic, social, and
racial or ethnic backgrounds • Assistance coping with your non-academic responsibilities (work, family,
etc.) • Support to help you thrive socially • Opportunities to attend campus events and activities
The mean rating of 7.04 on a scale of 0 (minimum) to 10 (maximum) strongly suggests that students find these characteristics important to them on a campus. Further female students reported significantly more importance than did male students on this scale. Likewise first generation students showed a significantly higher mean than did non-first generation students. Additionally most of the items on the survey in this scale are items suggesting support. Only one item relates to a challenging academic experience. It seems likely that students may be responding to the supportive environment to a greater degree than to the challenging element. Table 18 below contains the means, significance levels, and comparisons of each of the student groupings for this scale.

29
Table 18
BCSSE Mean Scale Scores and Selected Comparisons
BCSSE Scales a
OSU
All Students
OSU Gender Comparisons
OSU First-Generationd Comparisons
Means Tests of mean
differences
Means Tests of mean
differences Mean SD N Female Male Sigb Effect
sizec FG Non-
FG Sigb Effect
sizec Importance of Campus Environment (ICE)
7.04 1.60 2,781 7.43 6.69 *** .47 7.13 7.00 * .08 Student-rated importance that the institution provides a challenging and supportive environment.
a Scale scores are expressed in 0 (minimum) to 10 (maximum) point scales. See the following page for complete scale descriptions and component items. b T-test results (2-tailed): * p<.05, ** p<.01, *** p<.001. The smaller the significance level, the less likely that the difference is due to chance. c Effect size is the mean difference divided by pooled standard deviation. It indicates the practical significance of the mean difference (effect size .2 is often considered small, .5 is moderate, and .8 is large). d First generation is defined as no parent or guardian having graduated with a 4-year college degree.
Importance of the Campus Environment—Individual Item Report On a scale of 1 (not important at all) to 6 (very important), about 53% of students reported that it was quite important (rating of 5 or 6) to them that the campus provide a challenging academic experience. Only 2% noted that this was not really very important to them (rating of 1 or 2). Likewise only 51% reported that it was very important (rating 5 or 6) to them to have opportunities to interact with students from different economic, social and racial or ethnic backgrounds. However, 82% indicated that it was very important (rating 5 or 6) for the campus to support them in order for them to succeed academically. See Figure 22 below. Based upon students’ rating of importance for campus to provide assistance coping with non-academic responsibilities, about 31% rated that as quite important (rating of 5 or 6). While students clearly want academic support, they rated support to help them thrive socially much less important to them. Overall, only 41% rated that as quite important to them (rating 5 or 6). Students did however rate it as quite important that they have opportunities to attend campus events and activities. Approximately 64% rated this as very important to them (rating 5 or 6). See Figure 23 below.

30
Figure 22
Figure 23
Even when mean ratings for the items in this scale are examined, the two areas that have the highest mean ratings for importance to students are: (1) Support to succeed academically and (2) Opportunities to attend campus events and activities. Only one item rated below the middle of the scale and that was assistance coping with non-
0
10
20
30
40
50
60
1 Not important
2 3 4 5 6 Very important
Perc
ent
Degree of Importance
Importance of Campus Environment A challenging academic experience
Support to help you succeed academically
Opportunities to interact with students from different economic, social and racial or ethnic backgrounds
0
10
20
30
40
50
60
1 Not important
2 3 4 5 6 Very important
Perc
ent
Degree of Importance
Importance of Campus Environment (2)
Assistance coping with your non-academic responsibilities
Support to help you thrive socially
Opportunities to attend campus events and activities

31
academic responsibilities (work, family, etc.). Figure 24 below contains the graphic representation of the mean level of importance students assigned to various aspects of challenge and support (1 = not important, 6 = very important). Figure 24
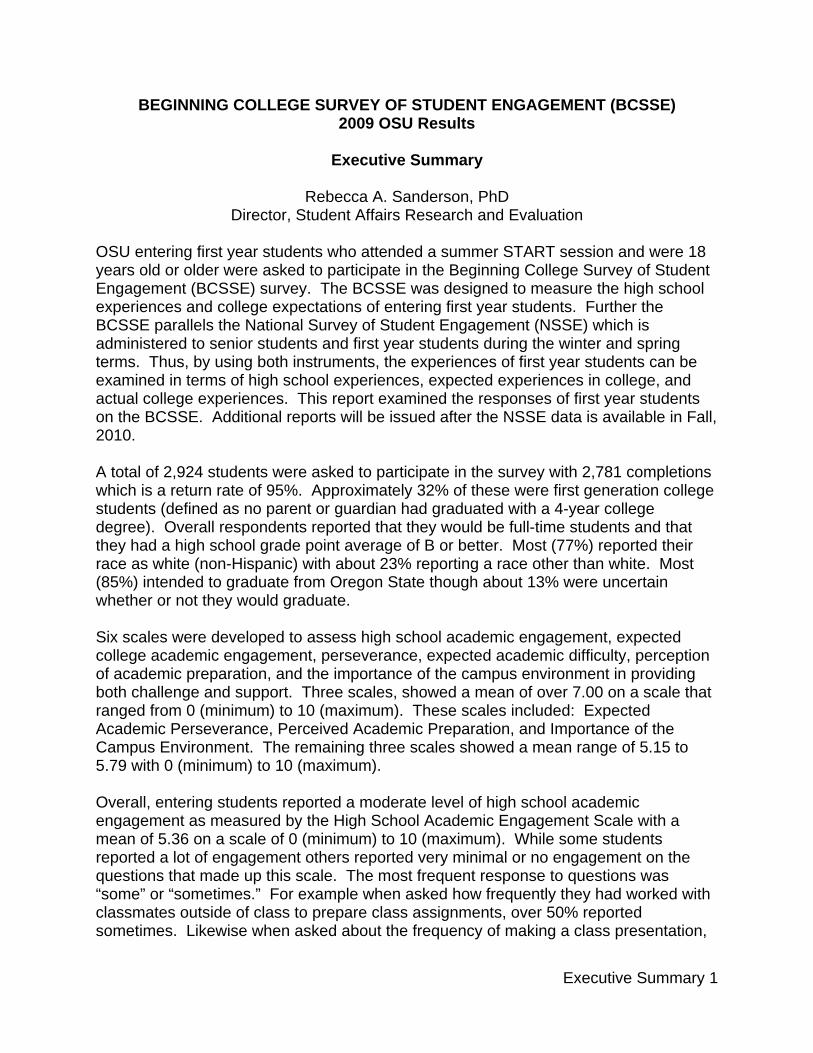
Co-Curricular Engagement during Last Year of High School This section describes the degree of co-curricular involvement that students reported on the BCSSE survey. Table 19 below contains the specific items that are discussed in this section of the report. Generally no more than 10% of students reported being highly involved in any of the activities listed with the exception of athletic teams, performing and visual arts, and community service or volunteer work. Figures 25-33 below contain the graph of frequency distributions of these items.
4.57
5.27
4.453.84
4.13
4.88
0
1
2
3
4
5
6
Challenging Academic
Experience
Support to Succeed
Academically
Opportunities to Interact with
Students of Difference Economic, Social, and
RacialEthnic Backgrounds
Assistance Coping with
Non-Academic Responsibility
Support to Help You
Thrive Socially
Opportunities to Attend Campus
Events and Activities
Mea
n
Mean Levels of Importance of Academic Challenge and Support

32
Table 19
Items Categorized as Co-curricular Engagement during the Last Year of High School
Co-curricular Engagement during Last Year of High School
Visual or performing arts Athletic teams (varsity, junior varsity, club sports, etc.) Student government Publications (student newspaper, yearbook, etc.) Academic honor societies Academic clubs (science, math, debate, etc.) Vocational clubs (business, health, technology) Religious youth group Community service or volunteer work
Level of involvement in:
Most students (over 50%) were not involved in performing or visual arts programs. Students most likely to have greater involvement were female students. Overall, approximately 28% of female students were substantially involved in performing or visual arts. Males were the least likely to be involved in these activities. See Figure 25. Figure 25
More students were highly involved in athletic teams than any other activity, listed in this section. Additionally of the subsections of students examined, the involvement of males, females, first generation, and non-first generation were very close to equal in their involvement in athletic teams. See Figure 26 below.
0102030405060708090
1 Not involved
2 3 4 5 6 Highly involved
Perc
ent
Level of Involvement
Level of Involvement in Performing or Visual Arts Programs during Last Year of High School
All students
Females
Males
First generation

33
Figure 26
Again, most students reported that they were not at all involved in student government during their last year. Less than 10% were highly involved with females being the most likely to be involved in this activity. See Figure 27 below. Figure 27
Most students (80% or greater) reported little or no involvement in student publications (student newspaper, yearbook, etc.) during their last year of high school.
0102030405060708090
1 Not involved
2 3 4 5 6 Highly involved
Perc
ent
Level of Involvement
Level of Involvement in Athletic Teams (varsity, jr varsity, club sports, etc.) During Last Year of High School
All students
Females
Males
First generation
0102030405060708090
1 Not involved
2 3 4 5 6 Highly involved
Perc
ent
Degree of Involvement
Degree of Involvement in Student Government during Last Year of High School
All students
Females
Males
First generation
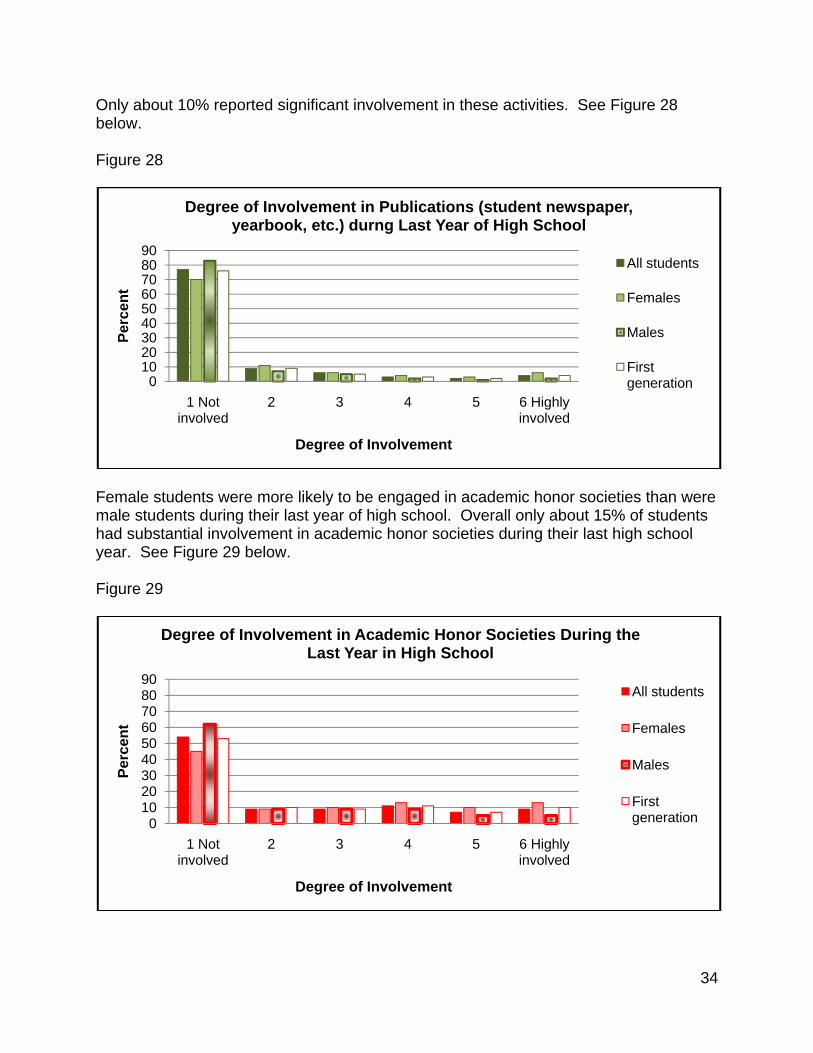
34
Only about 10% reported significant involvement in these activities. See Figure 28 below. Figure 28
Female students were more likely to be engaged in academic honor societies than were male students during their last year of high school. Overall only about 15% of students had substantial involvement in academic honor societies during their last high school year. See Figure 29 below. Figure 29
0102030405060708090
1 Not involved
2 3 4 5 6 Highly involved
Perc
ent
Degree of Involvement
Degree of Involvement in Publications (student newspaper, yearbook, etc.) durng Last Year of High School
All students
Females
Males
First generation
0102030405060708090
1 Not involved
2 3 4 5 6 Highly involved
Perc
ent
Degree of Involvement
Degree of Involvement in Academic Honor Societies During the Last Year in High School
All students
Females
Males
First generation

Most stumath, desubstant Figure 3
Over 80technolothis sect Figure 3
0102030405060708090
Perc
ent
0102030405060708090
Perc
ent
udents (80%ebate, etc.)tial involvem
30
% of studeogy, etc.) dution, the de
31
0000000000
1 Not involved
Degred
0000000000
1 Not involved
Degree otech
%) reported) during thement. See
nts reporteuring their l
egree of sub
2
ee of Involdebate, etc
2
of Involvemhnology, et
d very little oir last year Figure 30
d no involvast year in
bstantial inv
3
Deg
lvement in c.) during t
3
Degree of
ment in Voc.) during
or no involvin high schbelow.
ement in vohigh schoo
volvement w
4
gree of Invo
Academicthe Last Ye
4
f Involvment
cational Cthe Last Y
vement in ahool. Only a
ocational clol. Like othwas about 1
5 6 Hinv
olvement
c Clubs (scear of High
5
t
lubs (busiYear of High
academic clabout 6% s
lubs (busineer activities10%. See
Highly volved
cience, mah School
6 Highly involved
ness, healh School
ubs (sciencshowed
ess, healths mentionedFigure 31.
th,
All students
Females
Males
First genera
th,
All stude
Females
Males
First generatio
35
ce,
, d in
s
ation
ents
s
on

Most studuring ththese kin Figure 3
Commuthe activStudentswith the Figure 3
0102030405060708090
Perc
ent
0102030405060708090
Perc
ent
udents (72%he last yearnds of grou
32
nity servicevity that shos reported aexception
33
0000000000
1 Not involved
Degree o
0000000000
1 Not involved
Degree o
%) reportedr of high scups. See F
e or volunteowed the grat least somof athletic t
2
of Involvem
2
D
of Involvemduri
d no or veryhool. Abouigure 32.
eer work wareatest degme involvemteams. See
3
Degre
ment in ReYear o
3
Degree of Inv
ment in Cong the Las
y little involvut 12% repo
as second tgree of overment in thise Figure 33
4
ee of Involv
ligious Youof High Sch
4
volvement
ommunity Sst Year of H
vement in reorted subst
o involvemrall co-currics activity at 3.
5 6 Hinv
vement
uth Grouphool
5 6 Hinv
Service or High Schoo
eligious youantial involv
ent in athlecular engaga higher ra
Highly volved
during the
Highly volved
Volunteer ol
uth groups vement in
etic teams agement.
ate than oth
e Last
All stude
Females
Males
First generatio
Work
All students
Females
Males
First genera
36
as
ers
ents
s
on
s
ation

37
Student involvement in athletic teams and community service/volunteer work were the two co-curricular activities that students endorsed most often in terms of co-curricular engagement. Overall, other activities were secondary to those two in terms of the lists of activities from which students could select. Other Engagement Activity Items included in this category or those which did not neatly fit into another category but that involved engagement in academically enriching activities. Additionally two of the items in this category pertain to missing class and completing homework assignments. Figure 34 below contains the degree to which students read books for personal enjoyment or academic enrichment. Most students (~90%) read at least some for personal enjoyment or academic enrichment. Very few students reported no involvement or very little involvement in extracurricular reading. Figure 34
(First generation is defined as no parent or guardian having graduated with a 4-year college degree) Most students reported that they at least sometimes had serious conversations with students who differed from them in terms of race or ethnicity. Because other research suggests that serious interactions with people who are racially or ethnically different from oneself is beneficial to academic gains, this involvement in high school must have support to continue during the college years. Unfortunately, about 15% of entering OSU students reported that they had never had serious conversations with students different from themselves. For these students the collegiate experience could be very different than their high school experience with diversity. Figure 35 below contains the graphic representation of the frequency with which students engaged with students who differed from them racially or ethnically.
0
10
20
30
40
50
60
70
80
None Very little Some Quite a bit Very much
Perc
ent
Degree of Involvement
Books Read for Personal Enjoyment or Academic Enrichment
All students
Females
Males
First generation

Figure 3
(First gene Likewiseconversopinionssuch con Figure 3
(First gene
01020304050607080
Perc
ent
01020304050607080
Perc
ent
35
eration is define
e, most studations with
s, or personnversations
36
eration is define
000000000
Neve
Had Ser
000000000
Nev
Had SRegar
ed as no parent
dents (~90%students w
nal values. s during the
ed as no parent
er So
ious Conv
ver S
erious Conrding Relig
t or guardian h
%) reportedwho differedNevertheleeir last year
t or guardian h
metimes
Freque
versations wTerms of
ometimesFrequ
nversationsgious Belie
having graduate
d that they d from themss about 10r of high sch
having graduate
Often
ency
with Studef Race/Eth
Oftenuency
s with Studefs, Politica
Values
ed with a 4-yea
had at leasm in terms o0% reportehool.
ed with a 4-yea
Very o
ents Differehnicity
Ver
dents Diffeal Opinions
ar college degre
st sometimeof religious bd that they
ar college degre
often
ent From Y
ry often
rent from Ys, or Person
ee)
es had seriobeliefs, polihad never
ee)
You in
All students
Females
Males
First genera
You nal
All stude
Females
Males
First generati
38
ous itical had
ation
ents
s
ion

Most stucounseloof studeteacher Figure 3
(First gene Approximduring thmissed a Figure 3
(First gene
01020304050607080
Perc
ent
01020304050607080
Perc
ent
udents (~93or, teacher nts reporteor other sta
37
eration is define
mately 74%heir final yea school da
38
eration is define
000000000
Neve
Talked w
000000000
Neve
3%) reporteor other sta
ed that they aff member
ed as no parent
% of studentear in high say. See Fig
ed as no parent
er So
with a Cou
er So
ed that theyaff memberhad never
r during the
t or guardian h
ts reported school. Ongure 38 belo
t or guardian h
metimes
Freque
unselor, TeaCollege
ometimes
Frequ
Missed a
y had at leasr about colltalked abo
eir last year
having graduate
that they snly about 14ow.
having graduate
Often
ency
acher, or Oor Career
Often
uency
a Day of Sc
st talked soege or careut these issin high sch
ed with a 4-yea
sometimes 4% indicate
ed with a 4-yea
Very o
Other StaffPlans
Very
chool
ometimes weer plans. Osues with ahool. See f
ar college degre
missed a ded that they
ar college degre
often
f Member a
y often
with a Only about
a counselor,igure 37 be
ee)
ay of schoohad never
ee)
about
All stude
Females
Males
First generat
All studen
Females
Males
First generation
39
t 7% ,
elow.
ol
ents
s
tion
ts
n

40
Generally, most students (~69%) reported that they at least sometimes came to class without completing readings or assignments during their last year of high school. Interestingly, about 31% said that they never came to class without completing their assignments. Females were more likely to complete assignments than were male students. See Figure 39 below. Figure 39
(First generation is defined as no parent or guardian having graduated with a 4-year college degree) Use of Time in the Last Year of High School and Expected Use of Time during the First College Year Students were asked to account for the amount of time in a week that they engaged in specific activities. They were then asked the amount of time that they expected to engage in these activities during their first college year. Oftentimes patterns of behavior that were set in high school continue into college. Figure 40 below contains information on the amount of time per week that students worked for pay during their last year of high school and the amount of time they expected to work per week for their first year in college. Most students expected to work for pay some during their first college year. Only about 28% did not expect to work during the first year. Interestingly about 42% reported that they did not work for pay during their last year of high school. Most worked at least a few hours per week during high school with students averaging between 6 and 15 hours per week of paid work.
01020304050607080
Never Sometimes Often Very often
Perc
ent
Frequency
Came to Class Without Completing Readings or Assignments in Last High School Year
All students
Females
Males
First generation

41
Figure 40
On average students reported that they expected to spend less time participating in co-curricular activities during their first year in college than they did in their last year of high school. Approximately 60% of students indicated that they spend 11 hours or more per week during their last high school year participating in co-curricular activities, while about 51% reported that same expectation for their first college year. See Figure 41. Figure 41
Students reported on average that they expected to spend less time relaxing and socializing in their first college year than they did during their last year in high school. Most students (58%) thought that they would spend between 6 and 15 hours per week socializing during their first college year. See Figure 42 below.
05
1015202530354045
0 1-5 6-10 11-15 16-20 21-25 26-30 >30
Perc
ent
Hours per Week
Time Working for PayWorking for pay during last year in hs
Working for pay on or off campus (1st college year)
05
1015202530354045
0 1-5 6-10 11-15 16-20 21-25 26-30 >30
Perc
ent
Hours per Week
Participating in Co-Curricular Activities
Participating in co-curricular activities during last year in hs
Participating in co-curricular activities (1st college year)

42
Figure 42
Of the four questions that related to how students expected to spend time during their first college year, the only item that showed appreciable difference pertained to time spent studying (see Figure 13). Students reported that they expected to study more hours per week in their first college year than they did during their last high school year. Expectations of Integrative Activity during the First Year of College Students were asked a series of questions about the expected frequency of engaging in specific academic experiences that have been shown to enhance learning. In Figure 43 below, over 91% of students expect to often or very often work on a paper or project that requires integrating ideas or information from various sources. Approximately 9% expected to do this at least sometime during their first year. Figure 43
05
1015202530354045
0 1-5 6-10 11-15 16-20 21-25 26-30 >30
Perc
ent
Hours per Week
Relaxing and Socializing
Relaxing and socializing during last year in hs
Relaxing and socializing (1st college year)
0102030405060
Never Sometimes Often Very often
Perc
ent
Expected Frequency
Work on a paper or project that requires integrating ideas or information from various sources

43
Interestingly in Figure 44 only about 53% of students expected to receive prompt feedback from faculty on their academic performance. Only 3% never expected to receive prompt feedback from faculty. Other research has shown that receiving prompt and early feedback is essential to helping first year students make corrections in study habits, etc. before the end of the term. Figure 44
Interactions with faculty members both inside and outside the classroom have had positive results in terms of student motivation and persistence. Most students (91%) expected at least sometimes to work with faculty members on activities other than coursework during their first year. See Figure 45 below. Figure 45
0
10
20
30
40
50
60
Never Sometimes Often Very often
Perc
ent
Expected Frequency
Receive prompt feedback from faculty on your academic performance (written or oral)
0102030405060
Never Sometimes Often Very often
Perc
ent
Expected Frequency
Work with faculty members on activities other than coursework (committees, orientation, student life activities,
etc.)

44
Approximately 76% of students reported that they expected to put together ideas or concepts from different courses when completing assignments or during class discussions often or very often. About one quarter reported that they sometimes expected to do this. See Figure 46 below. Figure 46
Overall, students (~99%) reported that they expected to try to try to understand someone else’s views by imagining how an issue looks from his/her perspective at least some of the time. Very few (<1%) expected never to do this during their first year. Figure 47
0
10
20
30
40
50
60
Never Sometimes Often Very often
Perc
ent
Expected Frequency
Put together ideas or concepts from different courses when completing assignments or during class discussions
0
10
20
30
40
50
60
Never Sometimes Often Very often
Perc
ent
Expected Frequency
Try to understand better someone else's views by imagining how an issue looks from his or her perspective

45
Again, students (~100%) overwhelmingly reported that they expected at least some of the time to learn something that would change the way they understood an issue or idea. See Figure 48 below. Figure 48
Paying for College Having sufficient funds to pay for educational expenses is often problematic for many students. This section of the report provides information about how students expect to fund their first year at OSU. About 8% of students expected to fund all or nearly all of their educational expenses through scholarships and grants. Another 12% expected to pay all or nearly all through student loans. Parents and families comprised the largest funding source for students with 32% expecting all or nearly all of their educational expenses would be paid by parents/family. Only about 4% expected to pay for all or nearly all of their educational expenses by themselves. Only about 13% expected to get no help from their parents in terms of paying their college expenses. Further, 30% expected no help from scholarships/grants and 35% expected not to use student loans for funding. Figure 49 below contains student reported information on the amount of college expenses during the first year paid by various funding sources.
0
10
20
30
40
50
60
Never Sometimes Often Very often
Perc
ent
Expected Frequency
Learn something that changes the way you understand an issue or idea
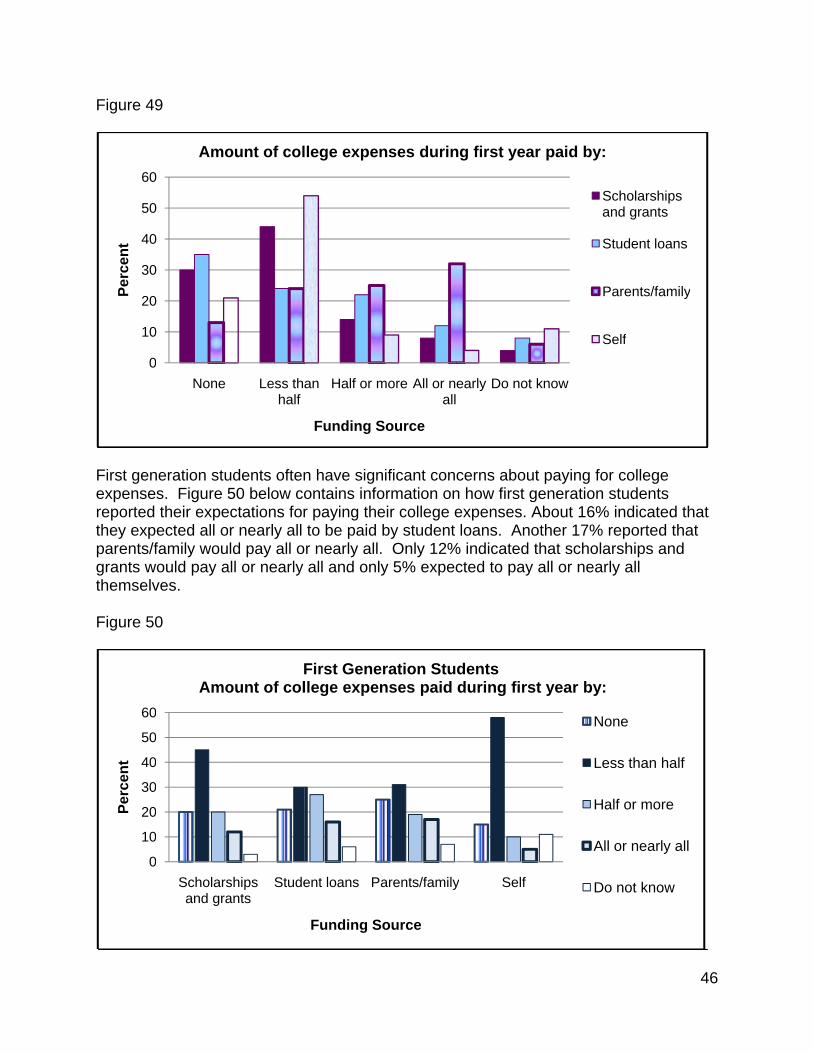
Figure 4
First genexpensereportedthey expparents/grants wthemselv Figure 5
0
10
20
30
40
50
60
Perc
ent
0
10
20
30
40
50
60
Perc
ent
49
neration stues. Figure 5d their expepected all o/family wouwould pay aves.
50
0
0
0
0
0
0
0
None
Amo
0
0
0
0
0
0
0
Scholarsand gra
Amo
udents often50 below co
ectations foror nearly all ld pay all o
all or nearly
Less thhalf
ount of col
ships ants
Stude
Fount of col
n have signontains infor paying theto be paid
or nearly all.all and onl
an Half or m
Funding S
llege expen
ent loans P
Funding S
First Genellege expen
nificant conormation oneir college eby student . Only 12%y 5% expec
more All or nall
Source
nses durin
arents/family
Source
eration Stunses paid
cerns aboun how first gexpenses. Aloans. Ano
% indicated cted to pay
early Do not
ng first yea
y Self
dentsduring firs
ut paying fogeneration About 16%other 17% that schola
y all or near
know
ar paid by:
Sa
S
P
S
st year by:
No
Le
Ha
All
Do
r college students
% indicated treported th
arships andrly all
Scholarships and grants
Student loans
Parents/family
Self
one
ess than half
alf or more
l or nearly al
o not know
46
that at
s
y
f
ll

Approximpercenta38% rec Figure 5
OSU enyears olEngagemexperienBCSSE administterms. Texamineactual coon the B2010. A total owhich isstudentsdegree)they hadrace as (85%) inwhether
05
10152025303540
Perc
ent
mately 20%age of Pell ceived a Pe
51
tering first yd or older wment (BCSnces and coparallels thtered to senThus, by used in terms ollege expe
BCSSE. Ad
of 2,924 stu a return ras (defined a. Overall red a high schwhite (non-
ntended to gr or not they
050505050
All st
% of all first Grants goin
ell Grant. S
DISCUS
year studenwere askedSE) surveyollege expehe National nior studensing both inof high sch
eriences. Tdditional rep
dents wereate of 95%. as no parenespondentshool grade -Hispanic) wgraduate froy would gra
udents
Re
year studeng to femal
See Figure 5
SSION AND
nts who atte to participa
y. The BCSectations of
Survey of ts and first struments,
hool experieThis report eports will be
e asked to p Approxima
nt or guardias reported tpoint averawith about 2om Oregon
aduate.
Female
S
eceived a F
nts receivele students51 below.
D RECOMM
ended a suate in the B
SSE was deentering firStudent Enyear studethe experie
ences, expeexamined te issued aft
participate iately 32% oan had gradhat they woage of B or 23% report
n State thou
es
Student Gro
Federal Pel
ed a Pell Gr. For first g
MENDATIO
ummer STABeginning Cesigned to mrst year stungagement ents during ences of firected expehe responster the NSS
in the surveof these weduated withould be full-better. Mo
ting a race ugh about 1
Males
oup
ll Grant
rant with a lgeneration s
ONS
ART sessionCollege Survmeasure thdents. Fur(NSSE) whthe winter a
rst year studriences in c
ses of first ySE data is a
ey with 2,78ere first genh a 4-year c-time studeost (77%) reother than
13% were u
First g
arger students ab
n and were vey of Stud
he high schorther the hich is and spring dents can bcollege, andyear studenavailable in
81 completineration colcollege nts and tha
eported thewhite. Mos
uncertain
generation
47
bout
18 dent ool
be d nts Fall,
ions lege
at ir st

48
Six scales were developed to assess high school academic engagement, expected college academic engagement, perseverance, expected academic difficulty, perception of academic preparation, and the importance of the campus environment in providing both challenge and support. Three scales, showed a mean of over 7.00 on a scale that ranged from 0 (minimum) to 10 (maximum). These scales included: Expected Academic Perseverance, Perceived Academic Preparation, and Importance of the Campus Environment. The remaining three scales showed a mean range of 5.15 to 5.79 with 0 (minimum) to 10 (maximum). Overall, entering students reported a moderate level of high school academic engagement as measured by the High School Academic Engagement Scale with a mean of 5.36 on a scale of 0 (minimum) to 10 (maximum). While some students reported a lot of engagement others reported very minimal or no engagement on the questions that made up this scale. The most frequent response to questions was “some” or “sometimes.” For example when asked how frequently they had worked with classmates outside of class to prepare class assignments, over 50% reported sometimes. Likewise when asked about the frequency of making a class presentation, over 50% of students reported sometimes. Less than 10% reported very often making a class presentation or working with classmates outside of class to prepare class assignments with another 10% reporting they never engaged in these behaviors. Likewise students reported a moderate expectation for academic involvement during their first year with a mean of 5.79 on a scale of 0 (minimum) to 10 (maximum). While their expectations of academic engagement were somewhat higher than their reported high school engagement experience, it was nevertheless still a modest level of expected academic engagement as measured by the Expected Academic Engagement Scale. Students did overall report that they believed that they were fairly well-prepared academically for their first college year. The mean score on the Perceived Academic Preparation scale was a 7.16 with a range of 0 (minimum) to 10 (maximum). This scale had the highest mean rating of the six scales. Overall students reported that they were prepared fairly well for writing and speaking. Likewise they reported that they were fairly well prepared for thinking critically and analytically. As expected, students reported that they were not as well prepared to analyze math or quantitative problems as they were for other areas in this scale. Students expected to spend more time preparing for class in their first year of college than they had done during their last year of high school. During the last year of high school 64% reported studying 10 hours or less per week. In contrast, only 8% expected to study 10 hours or less per week in college. While only 18% of students reported studying 16 hours or more during their last year of high school, 73% expected to study 16 or more hours per week in their first college year. Further, when asked the frequency with which they expected to work with classmates outside of class to prepare

49
class assignments, over 46% reported that they expected to do this often. Another 30% expected to do this very often during their first college year. Students were fairly certain that they would persist in college in the face of academic adversity. The mean rating on the Expected Academic Perseverance scale was 7.06 with 0 (minimum) and 10 (maximum). Most students reported that they were quite certain that they would ask instructors for help, find additional information for course assignments they did not understand, and finish something they started even when confronted with challenges (frequencies above 50% for these items). Not surprisingly, those students who reported that they did not intend to graduate from OSU showed the least amount of certainty about whether or not they would finish something in the face of challenges. Generally, students reported that they expected a modest amount of academic difficulty in their first college year. The mean rating on the Expected Academic Difficulty scale was 5.15 with a range of 0 (minimum) and 10 (maximum). Approximately 29% rated learning course material as potentially quite difficult for them while only 6% rated learning course material as not very difficult at all. Managing time was the area in which students expected to have the most difficulty. Students overall reported that they expected little difficulty with getting help with school work or interacting with faculty. Students were fairly clear about the importance of the campus environment in providing both challenge and support. Importance of the Campus Environment scale mean was 7.04 with 0 (minimum) and 10 (maximum) on this scale. About 53% reported that it was quite important to them that the campus provide a challenging academic experience. Only about 2% reported that this was not important to them. Two areas were overall rated as very important to students. These included: support to help them succeed academically and opportunities to attend campus events and activities. The area that was endorsed least often as being important was assistance coping with non-academic responsibilities. Only 10% reported this area as being very important to them. Student involvement in co-curricular activities in high school was somewhat limited in most categories with high involvement including only about 10% of respondents in areas such as performing or visual arts, student government, publications, honor societies, academic or vocational clubs, and religious youth groups. Further, fewer than 25% of students reported that they had very often had serious conversations with students who differed from them in terms of race/ethnicity or religious beliefs, political opinions or personal values. Involvement in athletic teams (varsity, jr varsity, club sports, etc.) had high involvement from about 40% of students. Engagement in community service or volunteer work had high involvement from about 20% of students. In terms of use of time, students expected to work for pay more, study more, participate in co-curricular activities about the same, and relax and socialize a little more than they did in high school. Students also expected to engage in integrative academic activities to a substantial degree during their first college year. Approximately 90% expected to often or very often work on a paper or project that required integrating ideas or information from

50
various sources. Nearly 75% expected to often or very often put together ideas or concepts from different courses when completing assignments or during class discussions. Further, about 80% expected to try to understand better someone else’s views by imagining how an issue looked from his/her perspective. And lastly a little over 80% expected to learn something that changed the way they understood an issue or idea. These results suggested that most incoming students expected to be engaged in reasonably high level intellectual activity during their first college year. As with other surveys (e.g., Sanderson, 2003a, 2003b, 2004, 2005, 2006) of incoming first year students, they have a fairly high opinion of their academic preparation and ability to succeed academically at their chosen college/university. Overall, OSU’s entering students were optimistic about their ability to succeed at OSU. They generally reported feeling well-prepared in most areas with the possible exception of mathematics. Most expected to graduate from OSU with their degree and they expected to engage in the intellectual/academic environment at OSU. They did report that they wanted to have access to campus events and activities and that they wanted access to services that would help them succeed academically. They expected to work more hours for pay, study somewhat more, and have time to relax and socialize a little than they had in their last year of high school. They were concerned overall about their ability to pay for college and this was especially true for first generation students. This current report provides only a snapshot of the high school experiences and expectations for entering students’ first college year. This is the first of several reports based upon the BCSSE data. Future reports will contain information from BCSSE, Banner, and the NSSE. Recommendations
1. Continue to administer the BCSSE on those years that NSSE is administered. 2. Return to the CIRP freshman survey on years the BCSSE is not administered. 3. Continue to use the BCSSE data with available BANNER data and the NSSE
data to develop key indicators of attrition/retention for first year students. 4. Assess to what degree entering student expectations about the academic
experience are met during their first year.

51
REFERENCES
Chickering, A. W., & Gamson, Z. F. (1987). Seven principles for good practice in
undergraduate education. AAHE Bulletin (March), 3-7. Pascarella, E. T., & Terenzini, P. T. (1991). How college affects students: Findings
and insights from twenty years of research. San Francisco: Jossey-Bass. Sanderson, R. A. (2003a). Oregon State University 2002 Freshman Survey Results—Cooperative Institutional Research Program. Student Affairs Research Report 01-03. Corvallis, OR: Oregon State University. Sanderson, R. A. (2003b). Oregon State University 2003 Freshman Survey Results—Cooperative Institutional Research Program. Student Affairs Research Report 01-04. Corvallis, OR: Oregon State University. Sanderson, R. A. (2005). Oregon State University 2004 Freshman Survey Results—Cooperative Institutional Research Program. Student Affairs Research Report 02-05. Corvallis, OR: Oregon State University. Sanderson, R. A. (2006). Oregon State University Cooperative Institutional Research Survey 2005 Freshman Survey Results. Student Affairs Research Report 03-06. Corvallis, OR: OSU Division of Student Affairs. Sanderson, R. A. (2007). Oregon State University Cooperative Institutional Research
Program 2006 Freshman Survey Results. Student Affairs Research Report 02-07. Corvallis, OR: OSU Division of Student Affairs.

52
APPENDIX A
College for Students Who Provided a Valid OSU Student ID Number
OSU College Frequency Percent
College of Agricultural Sciences 124 5 College of Education 213 8 Pre-Engineering 594 21 College of Forestry 32 1 College of Science 544 19 College of Liberal Arts 288 10 University Exploratory Studies Program 301 11 University Honors College 71 3 College of Health and Human Sciences 310 11 Pre-Business 314 11 Total 2791 100 Total will equal over the number of respondents since some were college1 plus college2 for example College of Education or the Honors College thus some students were counted twice because of double/triple majors which for some meant two colleges or more.