before katrina, you had a 1% chance every year of flooding this deep from hurricanes notes: the...
TRANSCRIPT
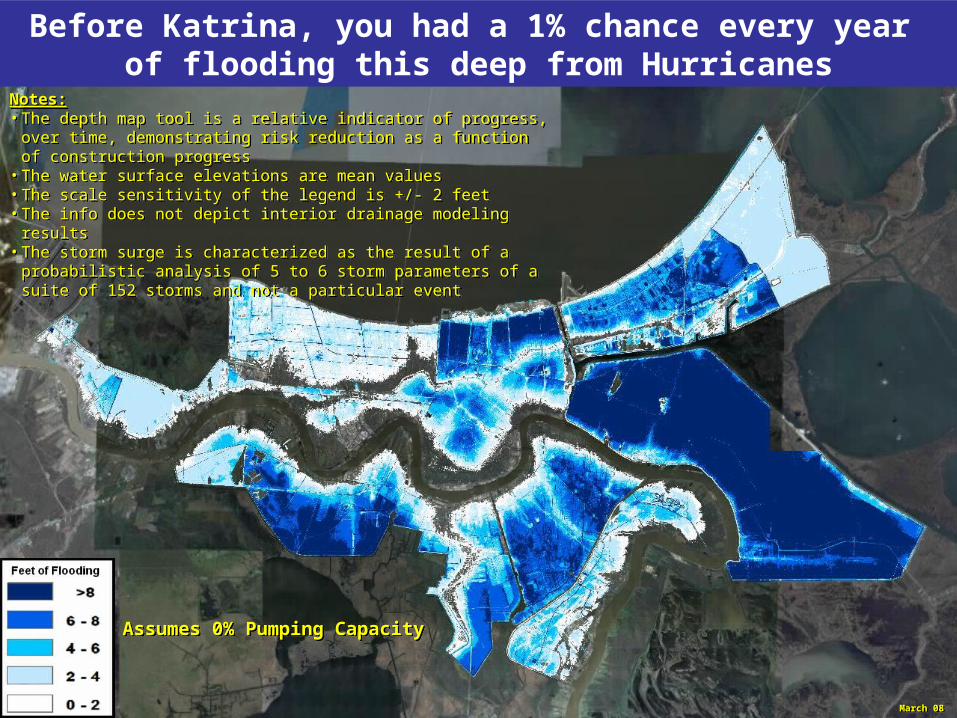
Before Katrina, you had a 1% chance every year of flooding this deep from Hurricanes
Notes:• The depth map tool is a relative indicator of progress, over time,
demonstrating risk reduction as a function of construction progress • The water surface elevations are mean values• The scale sensitivity of the legend is +/- 2 feet• The info does not depict interior drainage modeling results• The storm surge is characterized as the result of a probabilistic analysis of
5 to 6 storm parameters of a suite of 152 storms and not a particular event
Assumes 0% Pumping Capacity Assumes 0% Pumping Capacity
March 08March 08

On June 1, 2007, you had a 1% chance every year of flooding this deep from Hurricanes
Notes:• The depth map tool is a relative indicator of progress, over time,
demonstrating risk reduction as a function of construction progress • The water surface elevations are mean values• The scale sensitivity of the legend is +/- 2 feet• The info does not depict interior drainage modeling results• The storm surge is characterized as the result of a probabilistic analysis of
5 to 6 storm parameters of a suite of 152 storms and not a particular event
Assumes 0% Pumping Capacity Assumes 0% Pumping Capacity
March 08March 08

With the 100-year level of protection, you have a 1% chance every year of flooding this deep from Hurricanes
Notes:• The depth map tool is a relative indicator of progress, over time,
demonstrating risk reduction as a function of construction progress • The water surface elevations are mean values• The scale sensitivity of the legend is +/- 2 feet• The info does not depict interior drainage modeling results• The storm surge is characterized as the result of a probabilistic analysis of
5 to 6 storm parameters of a suite of 152 storms and not a particular event
Assumes 0% Pumping Capacity Assumes 0% Pumping Capacity
March 08March 08

Before Katrina, you had a 1% chance every year of flooding this deep from Hurricanes
Notes:• The depth map tool is a relative indicator of progress, over time,
demonstrating risk reduction as a function of construction progress • The water surface elevations are mean values• The scale sensitivity of the legend is +/- 2 feet• The info does not depict interior drainage modeling results• The storm surge is characterized as the result of a probabilistic analysis of
5 to 6 storm parameters of a suite of 152 storms and not a particular event
Notes:• The depth map tool is a relative indicator of progress, over time,
demonstrating risk reduction as a function of construction progress • The water surface elevations are mean values• The scale sensitivity of the legend is +/- 2 feet• The info does not depict interior drainage modeling results• The storm surge is characterized as the result of a probabilistic analysis of
5 to 6 storm parameters of a suite of 152 storms and not a particular event
Assumes 50% Pumping Capacity Assumes 50% Pumping Capacity
March 08March 08

On June 1, 2007, you had a 1% chance every year of flooding this deep from Hurricanes
Notes:• The depth map tool is a relative indicator of progress, over time,
demonstrating risk reduction as a function of construction progress • The water surface elevations are mean values• The scale sensitivity of the legend is +/- 2 feet• The info does not depict interior drainage modeling results• The storm surge is characterized as the result of a probabilistic analysis of
5 to 6 storm parameters of a suite of 152 storms and not a particular event
Notes:• The depth map tool is a relative indicator of progress, over time,
demonstrating risk reduction as a function of construction progress • The water surface elevations are mean values• The scale sensitivity of the legend is +/- 2 feet• The info does not depict interior drainage modeling results• The storm surge is characterized as the result of a probabilistic analysis of
5 to 6 storm parameters of a suite of 152 storms and not a particular event
Assumes 50% Pumping Capacity Assumes 50% Pumping Capacity
March 08March 08

With the 100-year level of protection, you have a 1% chance every year of flooding this deep from Hurricanes
Notes:• The depth map tool is a relative indicator of progress, over time,
demonstrating risk reduction as a function of construction progress • The water surface elevations are mean values• The scale sensitivity of the legend is +/- 2 feet• The info does not depict interior drainage modeling results• The storm surge is characterized as the result of a probabilistic analysis of
5 to 6 storm parameters of a suite of 152 storms and not a particular event
Notes:• The depth map tool is a relative indicator of progress, over time,
demonstrating risk reduction as a function of construction progress • The water surface elevations are mean values• The scale sensitivity of the legend is +/- 2 feet• The info does not depict interior drainage modeling results• The storm surge is characterized as the result of a probabilistic analysis of
5 to 6 storm parameters of a suite of 152 storms and not a particular event
Assumes 50% Pumping Capacity Assumes 50% Pumping Capacity
March 08March 08

Before Katrina, you had a 1% chance every year of flooding this deep from Hurricanes
Notes:• The depth map tool is a relative indicator of progress, over time,
demonstrating risk reduction as a function of construction progress • The water surface elevations are mean values• The scale sensitivity of the legend is +/- 2 feet• The info does not depict interior drainage modeling results• The storm surge is characterized as the result of a probabilistic analysis of
5 to 6 storm parameters of a suite of 152 storms and not a particular event
Notes:• The depth map tool is a relative indicator of progress, over time,
demonstrating risk reduction as a function of construction progress • The water surface elevations are mean values• The scale sensitivity of the legend is +/- 2 feet• The info does not depict interior drainage modeling results• The storm surge is characterized as the result of a probabilistic analysis of
5 to 6 storm parameters of a suite of 152 storms and not a particular event
Assumes 100% Pumping Capacity Assumes 100% Pumping Capacity
March 08March 08

On June 1, 2007, you had a 1% chance every year of flooding this deep from Hurricanes
Notes:• The depth map tool is a relative indicator of progress, over time,
demonstrating risk reduction as a function of construction progress • The water surface elevations are mean values• The scale sensitivity of the legend is +/- 2 feet• The info does not depict interior drainage modeling results• The storm surge is characterized as the result of a probabilistic analysis of
5 to 6 storm parameters of a suite of 152 storms and not a particular event
Notes:• The depth map tool is a relative indicator of progress, over time,
demonstrating risk reduction as a function of construction progress • The water surface elevations are mean values• The scale sensitivity of the legend is +/- 2 feet• The info does not depict interior drainage modeling results• The storm surge is characterized as the result of a probabilistic analysis of
5 to 6 storm parameters of a suite of 152 storms and not a particular event
Assumes 100% Pumping Capacity Assumes 100% Pumping Capacity
March 08March 08

With the 100-year level of protection, you have a 1% chance every year of flooding this deep from Hurricanes
March 08March 08
Notes:• The depth map tool is a relative indicator of progress, over time,
demonstrating risk reduction as a function of construction progress • The water surface elevations are mean values• The scale sensitivity of the legend is +/- 2 feet• The info does not depict interior drainage modeling results• The storm surge is characterized as the result of a probabilistic analysis of
5 to 6 storm parameters of a suite of 152 storms and not a particular event
Assumes 100% Pumping Capacity Assumes 100% Pumping Capacity