beauty fitting rooms: the impact of virtual try-on
TRANSCRIPT

https://lib.uliege.be https://matheo.uliege.be
BEAUTY FITTING ROOMS: THE IMPACT OF VIRTUAL TRY-ON
CONSUMERS'ATTITUDES AND BEHAVIOURAL INTENTIONS
Auteur : Al Morabet, Mouna
Promoteur(s) : Dessart, Laurence
Faculté : HEC-Ecole de gestion de l'Université de Liège
Diplôme : Master en sciences de gestion, à finalité spécialisée en international strategic marketing
Année académique : 2020-2021
URI/URL : http://hdl.handle.net/2268.2/13600
Avertissement à l'attention des usagers :
Tous les documents placés en accès ouvert sur le site le site MatheO sont protégés par le droit d'auteur. Conformément
aux principes énoncés par la "Budapest Open Access Initiative"(BOAI, 2002), l'utilisateur du site peut lire, télécharger,
copier, transmettre, imprimer, chercher ou faire un lien vers le texte intégral de ces documents, les disséquer pour les
indexer, s'en servir de données pour un logiciel, ou s'en servir à toute autre fin légale (ou prévue par la réglementation
relative au droit d'auteur). Toute utilisation du document à des fins commerciales est strictement interdite.
Par ailleurs, l'utilisateur s'engage à respecter les droits moraux de l'auteur, principalement le droit à l'intégrité de l'oeuvre
et le droit de paternité et ce dans toute utilisation que l'utilisateur entreprend. Ainsi, à titre d'exemple, lorsqu'il reproduira
un document par extrait ou dans son intégralité, l'utilisateur citera de manière complète les sources telles que
mentionnées ci-dessus. Toute utilisation non explicitement autorisée ci-avant (telle que par exemple, la modification du
document ou son résumé) nécessite l'autorisation préalable et expresse des auteurs ou de leurs ayants droit.
BEAUTY FITTING ROOMS: THE IMPACT OF
VIRTUAL TRY-ON ON CONSUMERS’
ATTITUDES AND BEHAVIOURAL INTETIONS
Jury : Dissertation by
Promoter : Mouna AL MORABET
Laurence DESSART For a Master’s degree in management
Reader(s) : specializing in International Strategic
Marketing
Michael SCHYNS,
Lisa BAIWIR Academic year 2020/2021

Acknowledgments
This thesis is the testimony of an enriching and constructive academic learning experience I
had as a master student at HEC Liège.
First of all, I would like to warmly thank my promoter, Dr. Laurence Dessart, for supervising
this project and guiding me with her valuable recommendations and advice. Her availability
and time were significantly appreciated.
I would like to extend my deepest gratitude to my readers, Dr. Michael Schyns and Lisa Baiwir
for supporting this work with their knowledge on the topic, and their precious feedback.
Finally, I would like to thank all my friends and family for constantly encouraging my efforts.

Table of Contents
List of Tables and Figures: ......................................................................................................... i
List of Tables: .......................................................................................................................... i
List of Figures : ....................................................................................................................... i
Introduction ................................................................................................................................ 1
Context ................................................................................................................................... 1
Problem statement .................................................................................................................. 4
Contributions .......................................................................................................................... 5
Approach ................................................................................................................................ 5
Literature review ........................................................................................................................ 7
1. Introduction to Augmented Reality and Virtual-Try-On ................................................ 7
1.1. Augmented Reality in Marketing ............................................................................ 8
1.2. Virtual try-on ........................................................................................................... 9
2. Theoretical framework .................................................................................................... 9
2.1. Technology acceptance .......................................................................................... 10
2.2. Perceived usefulness .............................................................................................. 10
2.3. Perceived enjoyment .............................................................................................. 11
2.4. Attitudes towards the technology .......................................................................... 12
2.5. Behavioural intentions ........................................................................................... 13
2.6. Intention to use the technology .............................................................................. 13
2.7. Word-of-mouth intention ....................................................................................... 13
2.8. Socialization .......................................................................................................... 14
3. Hypotheses development .............................................................................................. 15
Research design ....................................................................................................................... 20
1. Methodology ................................................................................................................. 20
1.1. The experiment ...................................................................................................... 20
1.2. The treatments ....................................................................................................... 21
1.3. The questionnaire ...................................................................................................... 22
1.4. Survey distribution .................................................................................................... 24
2. Scales and measures ...................................................................................................... 24
2.1. Independent variables ................................................................................................ 24
2.2. Mediating variables ................................................................................................... 24
2.3. Dependent variables .................................................................................................. 25
2.4. Control variables.................................................................................................... 25
Results ...................................................................................................................................... 27
1. Preliminary tests............................................................................................................ 28
2. Manipulation checks ..................................................................................................... 29
3. Hypotheses testing ........................................................................................................ 29
3.1. Direct links ............................................................................................................ 30
3.2. Indirect links .......................................................................................................... 30
4. Attitudes towards the VTO and behavioural intentions ................................................ 31
4.1. The links between the variables............................................................................. 32
Discussion ................................................................................................................................ 35
1. Socialization and technology acceptance...................................................................... 35
2. The mediating effect of perceived usefulness and perceived enjoyment ..................... 37
3. Attitudes towards the VTO and behavioural intentions ................................................ 38
Conclusion ............................................................................................................................... 41
1. Short summary .............................................................................................................. 41
2. Theoretical implications................................................................................................ 42
3. Managerial implications................................................................................................ 42
4. Limitations and suggestions for further research .......................................................... 44
Bibliography ............................................................................................................................ 46
Appendices ............................................................................................................................... 56
Appendix A: Survey of the research .................................................................................... 56

Appendix B: Links to the VTO ............................................................................................ 65
Access to the Website VTO: ............................................................................................ 65
Access to the Instagram VTO: .......................................................................................... 65
Appendix C: Results of the Shapiro-Wilk test for scales normality .................................... 66
Appendix D: Skewness and Kurtosis results........................................................................ 67
Appendix E: Confirmatory Factor Analysis results ............................................................. 68
Executive Summary ................................................................................................................. 69

i
List of Tables and Figures:
List of Tables:
Table 1- Scales and measures
Table 2- Population description
Table 3- Preliminary checks results
Table 4- Summary of results
List of Figures :
Figure 1- Graphical model
Figure 2- Mediation results of perceived enjoyment
Figure 3- Mediation results of perceived usefulness

1
Introduction
Context
Thanks to the advance of immersive technologies, the virtual and real worlds were brought
closer together (Rauschnabel, 2019). Accordingly, the main immersive disruptors are
Augmented Reality (AR) and Virtual Reality (VR), and Mixed Reality (MR). In 2018, all three
were ranked as the top 10 strategic trends for 2018 (Gartner, 2017). As a more recent
technology, AR gained particular interest in the last few years and by 2023, there will be an
estimated 2.4 billion mobile AR users worldwide. Also, more than half surveyed customers
revealed in a study by Digital Bridge on AR in retailing (2017), that they will be more willing
to purchase from companies who include an AR application.
AR seamlessly merges between the virtual and real worlds where virtual content is integrated
with displays of the real-world. In fact, instead of suppressing the reality, AR enhances it and
makes its users even more connected with it. Therefore, management expert Michael Porter
urges companies to adopt AR, stating that “every company needs an AR strategy” (Porter and
Heppelmann, 2017). Today, the AR Market is growing by 46% and is forecasted to carry this
trend by 48.6% for the period of 2021-2028 (Statista, 2021). Accordingly, AR is anticipated to
grow by an annual rate up to 135% in market retail spend between 2018 and 2023 (IDC, 2019).
AR is gaining momentum in the consumer Market, and is becoming one of the most in demand
digital Marketing Technologies (Azuma et al., 2001; Porter and Heppelman, 2017).
Consequently, AR is adding value to Marketing from different aspects. First, AR leverages
Marketing through enhancing customer experience (Chylinski et al., 2020). In this context,
customer experience refers to the “multidimensional construct focusing on a customer’s
cognitive, emotional, behavioral, sensorial and social responses to a firm’s offerings during the
customer’s purchase journey” (Lemon and Verhoef, 2016, p. 71). In 2019, 58% of companies
saw customer experience as a primary competitive differentiator (Statista, 2019). AR leverages
this competitive advantage through the addition and subtraction of information in the
2
customer’s perception of the physical environment. For example, the supermarket’s ‘Dent
Reality’ allows customers to navigate through the supermarket, where they could easily find a
product they’re looking for. As a result, they are actively oriented in their decision making
(Hilken et al., 2017).
Additionally, AR is considered to strengthen consumer engagement with the support of its
sensory marketing elements such as audio, graphics, and human-computer touchpoints, (Sung,
2021). In this vein, customer engagement is key to nurture the relationship that companies
entertain with customers and maintain competitive advantage (Brodie and al., 2013). AR is
particularly effective in this matter since it allows entangling branded content within consumer
social and physical environments, which offers companies the opportunity to be a part of
consumer’s conversations (Scholz et al., 2018). As a result, AR creates an opportunity for
brands to bond with consumers. For example, the AR shopping application of the beauty
retailer Sephora allows consumers to create their own beauty space with looks suggestions and
tutorials that support the provided looks. Consequently, some users of the applications stated
that it became “part of their personal space” (Scholz et al., 2018).
Due to its widespread use of smartphones and tablets, AR gradually penetrated numerous
industries such as tourism, entertainment, education, retail and real estate (Hackl and Wolfe,
2017). Indeed, AR is particularly changing the online shopping landscape, making it one of the
main applications of the technology. In 2021, e-retailing is considered as one of the most
popular online activities in 2021 and is expected to grow to 5.4 trillion US dollars in 2022
(Statista, 2021). However, the Market Research report by Temkin Group (2017) showed that
54% UK customers were unsatisfied with their recent experiences. One of the main concerns
raised by customers in e-retail is their inability to try-on the products online (Pachoulakis and
Kapetanakis, 2012). In fact, this issue could lead to cart abandonment and product returns
(Hilken et al., 2017). As a result, they have to constantly switch between online and offline
channels (Wolny and Charoensukai, 2014). For instance, customers would find it laborious to
research a product then go to the store to try it. This inability to try-on products carries the
name of the “fit, suit and match” dilemma (Pachoulakis and Kapetanakis, 2012). After several
years of addressing the issue, AR could solve this major obstacle to online retail thanks to its

3
Virtual-Try-On tool (VTO) (Lin and Wang, 2015) making it today one of the most prominent
AR applications in e-retail.
VTO permits the simulation of the fitting process through manipulating the product in a virtual
environment (Fiore and al., 2005). It is deemed that VTO will become the future of online
retailing (Greene, 2011). VTO enables customers to imagine what products would look like
before purchasing them via virtual display (Pantano and Servidio, 2012). Thus, it plays a major
role in their purchase decision making (Merle et al., 2012).
Additionally, the e-retail landscape offers elements that are absent in the physical store such as
the large product choice, abundance of digital information, customizability and social media
connectivity (Hilken et al., 2017). In this vein, VTO is gaining popularity among social media
platforms, and companies are taking advantage of this opportunity to connect with customers.
Accordingly, linking the immersive experiences to social media would allow consumers to
share it with their social circle which builds a bond between consumers and companies (Tom
Dieck ad Han, 2021). As a result, consumers who exchange recommendations would feel
empowered. In return they would adopt more positive purchase intentions (Heller et al., 2020).
Notable Tech companies are now aware of this business opportunity and are shifting towards
VTO as a purchasing technology. For instance, the social media applications Instagram,
Facebook and Snapchat facilitated the introduction of VTO to companies, by enabling
consumers to try-on products such as Make up and shoes and then directly process to
purchasing it in its commerce platform.
Indeed, beauty brands benefit considerably from social media platforms (Statista, 2019). Also,
they are one of the most common users of VTO solutions in retail next to clothing (Zhang et
al., 2020). For example, 200 beauty brands partnered with the social instant messaging
application Snapchat to provide shoppable VTO through a solution developed by the AR expert
Perfect Corp (Retail Dive, 2020). Accordingly, campaigns that have shoppable VTO had 2.4
higher purchase intentions (Retail Dive, 2020).
4
Although beauty VTO seems to benefit widely from social media, many brands still choose to
build their own VTO solution or directly partner with a Tech Company to create it on platforms
other than social media. For instance, the French beauty products retailer Sephora chose to
collaborate with the Augmented Reality specialist Modiface in 2017 to integrate a VTO
solution. Subsequently, the actual beauty worldwide leader L’Oréal (Statista, 2021) acquired
Modiface in 2018 to include VTO to its Marketing strategy. The following year, the group saw
an increase of 52% in its ecommerce sales (L’Oréal Finance, 2019). However, L’Oréal also
partnered with Facebook for a social VTO in 2021 (L’Oréal, 2021). Indeed, the question arises
about the influence of social VTO in a Marketing context.
Considering the importance of VTO in today’s e-retail landscape, there is still little academic
research on it. However extant literature has investigated AR impact on online decision making
from various viewpoints (Zhang et al., 2019). Thus, the main focus of AR research was the
hedonic and utilitarian components of the technology (Hilken et al., 2017; Yim et al., 2017).
Indeed, this latter stated that the hedonic and components of AR would positively impact the
attitudes towards it and the behavioural intentions (Rauschnabel and al., 2018; (Hilken et al.,
2017). Additionally, AR seemed to be aligned with previous suppositions of technology
acceptance as attitudes favorably impacted behavioural intentions (Rese and al., 2017. Hilken
et al, 2017). However, no further insights were provided in regard to the impact of socialization
in AR as well as the applicability of previous findings to the beauty industry. Hence, social AR
was suspected to provide engaging experiences by empowering consumers through the social
factor (Beck and Crié, 2018). Scholz and Smith (2016) state that brands could benefit from
social media for instance by leveraging their virtual social circle. Since consumers are greatly
influenced by peers when interacting with products and services (Churchill and Moschis,
1979), then the adoption of the VTO tool could be facilitated through the process of
socialization.
Problem statement
First, this research will investigate the impact of socialization on consumers' perceptions and
attitudes. Precisely, it will explore whether perceived usefulness and perceived enjoyment
mediate the relationship between the VTO condition solution and the consumer attitudes. The
VTO condition will be represented by two types of VTO, where a group of participants will be

5
invited to virtually try-on a beauty product on a social media platform, while the other group
will try it on a website.
Second, the study will look into the extent to which previous findings in retail VTO could be
extended to the beauty industry context.
Contributions
In line with these two purposes, the study will fill the academic research related to the VTO in
the beauty context.
First, the research will assess the eventual benefits of social VTO. In this vein, it will attempt
to understand the role of socialization in VTO by exploring the supposed middling role that
both hedonic and utilitarian constructs play. Currently, socialization was solely investigated in
the context of AR as an antecedent of attitudes by Zhang et al. (2019) in the online clothing
context, which did not reveal a significant impact on attitudes. Still, companies are
collaborating with social media platforms to integrate a VTO solution and research states that
companies could benefit from linking immersive experiences to social media (Tom Dieck and
Han, 2021). As a result, the study will determine whether the results of the previously
mentioned study (Zhang et al., 2019) fit the beauty context. Also, the results will be explained
by the hedonic and utilitarian constructs as main predictors of attitudes in this context since
Kang et al. (2020) stated that when the hedonic value of “playfulness” is salient, then it is less
likely to be perceived as a purchasing tool. Thus intentions towards adopting the social VTO
are weaker. Additionally, the research will try to understand the effect that VTO implies on
consumers' attitudes towards the technology and behavioural intentions in the beauty context.
Accordingly, the paper will verify the extent to which the findings of previous research in
different contexts (Lee et al., 2006; Kim and Forsythe, 2008) apply to beauty VTO.
Approach
In order to answer the research purpose, a literature review on AR and VTO will be presented.
Then, the main concepts and theories explained as well as the resulting hypotheses. Further,
the applied research design will be detailed and the data collection process will be defined.

6
After, the data collection techniques will be determined and the results communicated.
Following the findings, a discussion will be exhibited. Lastly, the theoretical and managerial
implications will be displayed along with the recommendations and insights about future
research.
7
Literature review
This section will present a summary of the current research about Augmented Reality and
Virtual-Try-On in the Marketing context. First, both concepts will be introduced, then the
theories on which the study is based will be explained. Lastly, the hypotheses will be
characterized and commented.
1. Introduction to Augmented Reality and Virtual-Try-On
The last decade has been prosperous in AR research regarding numerous industries and
application domains. However, AR found its roots earlier in 1977, particularly in the field of
computer science interface research (Sutherland and Mead, 1977). In his valuable work on
AR, Azuma (1997, p.375) defined AR as “3-D virtual objects integrated into a 3-D real
environment in real time”. Due to its limited context, this definition was updated (Azuma et
al., 2001, p.43) by emphasizing the three main properties of AR as: “the combination of real
and virtual objects in a real environment, a system that registers virtual and real objects with
each other and that runs interactively in real time”.
According to Azuma (1997), AR is considered as a Virtual Reality (VR) variation, and that
appeared after several VR projects from 1960 to 1990 (olmedo, 2013). In the same fashion,
Milgram defined AR within the context of his Reality Virtuality Continuum, which spans the
real environment and the virtual environment (1995). Milgram situates AR and Virtual Reality
(VR) as in between the two worlds, where AR is closer to the real world and VR as closer to
the virtual world. In fact, VR enables users to be completely immersed in a virtual
environment, where they cannot see the real world around them. However, AR users could still
see the virtual world being overlaid on the real world (Milgram, 1995). Wherefore, AR can be
seen as technology that elevates user experience by superimposing digital content onto users'
real environment.

8
1.1. Augmented Reality in Marketing
AR emerged in Marketing practice in the late 2000s (Javornik, 2016), creating new
opportunities to draw consumer behaviour via integrating digital information into individual
perceptions of the physical world (Hilken et al., 2017). As a result, branding, sales and customer
service saw a positive impact (Sung, 2021).
Chylinski et al. (2020, p.12) characterized Augmented Reality in Marketing as “the process
that enhances customer experience and decision making through creating, communicating and
distributing digital affordances in the physical environment”. In this vein, digital affordances
refer to the characteristics of the environment that ease interactions including interactive,
adaptive and shareable content such as images and videos (Greeno, 1994). The aim of these
affordances is to facilitate the customer experience along with decision making (Hilken et al.,
2018).
Also, AR offers customers customized and interactive information in the offline retail context
(Yim et al., 2017). For example, the fashion brand Nike allows customers in a Paris store to
visually design sneakers using AR and then visualize it in real time. In this context, AR
integrated applications proved to enhance the fitting process via in-store digital screens, smart
mirrors or holograms. As a result, AR provided consumers with more persuasive offline
experiences compared to non-AR ones (Baek et al., 2018).
Additionally, AR could leverage consumer engagement (Scholz and Smith, 2016) in various
industries including advertisement (Yaoyuneyong et al., 2016), mobile Marketing (Javornik,
2016b) and retailing. Indeed, retail embraced AR vigorously and was considered to be an early
adopter of the technology (Centric Digital, 2017). For instance, numerous retail brands created
AR apps for customers to use; in the furniture (e.g., Rese et al., 2014), eyewear (e.g., Hilken et
al., 2017; Poushineh and Vasquez-Parraga, 201; Rese et al., 2017), and beauty industries (e.g.,
Centric Digital, 2017). As a result, they saw their revenues significantly increase (Caboni and
Hagberg, 2019).
9
Hence, AR adds value to retailing and selling in digital channels, with the help of interactive
showrooms and applications that offer a consumer interface like smart dressing rooms,
enabling product trials (Wedel et al., 2020). Consequently, high returns along with card
abandonment rates are decreased (Dacko, 2016). In this regard, a multitude of virtual try-on
tools (VTO) appeared, providing customers with vivid contextual information (Yim et al.,
2017).
1.2. Virtual try-on
VTO technologies are defined as “website features that enable the creation and manipulation
of product or environment images to simulate (or surpass) actual experience with the product
or environment” (Fiore, Kim and Lee, 2005, p. 39). Thanks to VTO, customers are able to
imagine what products would look like before purchasing them via virtual display (Pantano
and Servidio, 2012). Also, many consumers expressed a need to touch the product prior to
purchasing it (Liu et al., 2017). In order to fulfill this need, consumers would go to the store
after researching a product, making the purchasing experience divided in an online and offline
setting (Verhoef et al., 2007).
Thanks to VTO, this gap is addressed, resulting in research time efficiency and less channel
switching (Willems et al., 2007).
2. Theoretical framework
Recently, AR research in Marketing is gaining attention from scholars. However, it is strongly
oriented towards extracting knowledge about user experience. This latter refers to “how people
use an interactive product: the way it feels in their hands, how well they understand how it
works, how they feel about it while they are using it, how well it serves their purposes, and
how well it fits into the entire context in which they are using it” (Alben, 1996, p. 5). Indeed,
user experience is evaluated through combining three elements. First the self, in regard to the
individual characteristics of the person interacting with the product. Then the place where the
interaction occurs with the product as AR permits multiple locations of use. Lastly, the product
itself in terms of the provided information by the AR (Poushneh and Vasquez-Parraga, 2017).
10
In this vein, user experience was studied from different perspectives. Most importantly, the
inner drivers of consumers were investigated through a utilitarian and hedonic value (Hilken
et al., 2017; Yim et al., 2017).
2.1. Technology acceptance
The predominant theory that investigated utilitarian and hedonic benefits of technologies is the
technology acceptance model (TAM) (Huang and Liao, 2015; Spreer and Kallweit, 2014;
Pantano et al., 2017). This latter (TAM) was a first attempt to apply psychological factors to
information systems adoption (Rese et al., 2017). This theory supposes that two constructs
were at the origin of an individual's attitude towards using a technology, mainly referring to
the utilitarian benefits of the technology. Indeed, an individual will maintain a positive attitude
towards a technology when he or she perceives it as easy and useful (Davis et al.,1992). In this
regard, “perceived usefulness” and “perceived ease of use” were deemed to be the utilitarian
constructs. In regard to the study’s context, the utilitarian construct “ease of use” won’t be
considered. One one hand, (Yuen and al., 2017) found that it did not play a significant role in
predicting consumer’s intention to use the virtual fitting technology they developed in an online
retail context. Additionally, “ease of use” did not demonstrate a significant overall impact on
attitudes in the context of social commerce (Bounkhong and Cho, 2017).
Lastly, the technology acceptance model continued including new constructs to the equation
such as the hedonic component, named as “perceived enjoyment”. As a result, both utilitarian
and hedonic constructs are considered as impactful factors on attitudes and behaviours towards
the technology (Teo et al., 1999).
2.2. Perceived usefulness
According to Davis (1992), perceived usefulness refers to the extent to which an individual
believes that a system will support them in their work. In other words, perceived usefulness
embodies the extrinsic motivation for using a technology (Ariely, 2000). In the context of
online shopping, usefulness refers to how effective the media is at information search to ease
product evaluation (Yim et al., 2017). In this case, the increased interactivity and vividness of

11
AR allow an effective assembly of information about products (Ariely, 2000). Thanks to the
visual display of products, the mental effort is minimized.
As a tool that facilitates information search, AR enhances consumer knowledge significantly
in comparison to direct product experiences (Lombard and Ditton, 1997).
In the work of Romano et al., (2020) on AR customer journey, they advanced that the intention
to use AR is driven by perceived usefulness. In this regard, a study on AR glasses revealed that
consumers are more likely to use the glasses for functional benefits such as efficiency
(Rauschnabel and al., 2018) and social benefits (Uniqueness, display of personality traits).
2.3. Perceived enjoyment
Venkatesh et al. (20008, p:16) characterize perceived enjoyment as the ‘the activity of using a
specific system that is enjoyable in its own right, aside from any performance consequences
resulting from system use’. In this vein, Ariely (2000) presents perceived enjoyment as an
internal source of motivation.
Past research revealed that two factors could enhance enjoyment in the context of AR,
including interactivity and vividness of the experience (Yim et al., 2017). To illustrate, when
consumers are totally immersed they experience more pleasure provided by the experience
(Kim and Forsythe, 2008).
Similarly, to perceived usefulness, perceived enjoyment was associated with elevated levels of
intention to use the technology in previous research (Hilken et al., 2017). For instance, the
gaming application Pokémon Go showed that the attitudes towards the AR were mainly
influenced by a combination of emotional benefits such as nostalgia and enjoyment, along with
social factors (Rauschnabel et al., 2017. Lastly, perceived enjoyment was found to have a
stronger impact than other constructs such as perceived usefulness on brand engagement in the
context of branded AR (McLean and Wilson, 2019).

12
2.4. Attitudes towards the technology
Attitude is defined as a psychological tendency expressed by evaluating a particular entity,
with some degree of favour or disfavour (Lee et al., 2003). Regarding technology, attitude
refers to the extent to which a consumer likes or dislikes the technology. It also indicates the
effort that the individual would invest in the behaviour (Ajzen and Fishbein, 1991). In
technology acceptance, general customer attitude was defined by three elements: the attitude
towards the technical infrastructure, the attitude towards the technology and the attitude
towards the risk. In their research about AR in retail, Yim and Sauer (2017) clarify that the
attitude towards the AR was mainly defined by the media enjoyment and the media usefulness.
Indeed, attitudes could be predicted by hedonic and utilitarian constructs of the technology
(Lee et al., 2003).
Indeed, numerous researchers found that in the context of AR the dominant effect on attitudes
was perceived usefulness (Dacko, 2017).
However, the difference between the impact of the hedonic and utilitarian constructs could also
be traced via the primary motivation of adoption (Yim and Sauer, 2017) and the type of AR
application (Rese and al., 2017). Indeed, the context in which AR is applied would determine
the attitudes formation. For instance, the extent to which utilitarian and hedonic constructs are
impactful differs from a marker-based AR application and a marker-less application (Rese and
al., 2017). Also, previous research shed light on the utilitarian features of AR that impact on
attitudes. For instance, self-augmentation applications, the augmentation quality, interactivity
and utility were the primary satisfaction criteria (Poushneh and Vasquez-Parraga, 2017).
In this vein, augmentation quality is enhanced thanks to: an elevated quality of provided
information, a relevant mapping of the virtual content in the real-world, and the support
provided to the customer. The features that offer hedonic benefits were also studied including
aesthetic quality and entertainment, which showed that they also had an impact on AR user
experience (Poushneh and Vasquez-Parraga, 2017). Additionally, other factors were
responsible for enhanced attitudes in previous research, including vividness and realism of the
content (Yim et al., 2017).

13
Lastly, attitudes towards an online shopping medium proved to be responsible for predicting
the degree to which users will accept that medium (Shih et al., 2004). In the same vein, attitude
towards the online shopping medium favourably impacted future purchase intention (Crespo
et al., 2008).
2.5. Behavioural intentions
According to the theory of reasoned action (TRA) by Fishebin and Ajzen (1975), behavioural
intentions refers to the factors that motivate behaviour, when the strength of the intention would
determine the willingness to perform the behaviour. Intention is considered to be the subjective
individual probability that will lead the individual to perform a particular behaviour (Fishbein
and Ajzen, 1975). Both the theory of reasoned action (TRA) of Fishbein and Ajzen (1975) and
the technology acceptance by Davis (19898) stipulate that beliefs and attitudes predict future
behaviours. Behavioural intention is said then to be influenced by attitudes towards the
behaviour, subjective norms and perceived behavioural control (Ajzen, 1991). These
behavioural intentions could be related to different behaviours such as the intention to use the
technology or the intention to promote it via word-of-mouth.
2.6. Intention to use the technology
The intention to use the technology refers to the individual’s desire to use the technology in the
future. This latter was found to be a reliable determining factor of actual technology usage
(Ajzen, 1991).
2.7. Word-of-mouth intention
Word-of-mouth (WOM) is defined as an interpersonal communication between consumers
who share their impressions about their experiences of consumption (Brooks, 1957).

14
2.8. Socialization
The theory of reasoned action suggests that the intention to perform a behavior is determined
by both attitudes towards the behavior and subjective norms. In fact, subjective norms are the
social pressure exerted upon an individual to perform or not perform a behaviour (Ajzen, 1975).
Despite being inspired from this theory (Ajzen, 1991), the technology acceptance model was
not sufficiently adapted to integrate a social perspective (Hilken et al., 2017). Indeed, social
psychologists recognize that the social context of an individual is prompt to changing his
perceptions (Seidman, 2013) Also, he explains that a social setting could push consumers to
adopt a certain behaviour that fits their context.
In the work of Sung (2021) on AR Viral Marketing, using AR on social media might carry
remarkable benefits for companies. Accordingly, AR suffered from lack of social features in
its early stages which limited the technology’s proliferation (Javornik, 2016). First, this
limitation was addressed through “extended” AR experiences in recent applications. This
model of AR consists of co-creating a “shared” customer experience where peers are invited
to modify and share AR images and videos through integrating recommendations from other
users and enhancing active contribution of peers in the AR experience (Hilken et al., 2018).
For instance, consumers could invite their social circle to co-create an experience by
collaboratively providing a visible recommendation such as color or item change. This form of
iterative feedback enables customers to go from a state of passiveness to becoming an active
part of the shared experience (Scholz and Smith, 2016). Also, Extended AR created valuable
experience by enabling customers to develop social relationships with other users, while
exchanging the used artifacts (images, videos). As a result, consumers build their identities
through social interactions (Scholz and Smith, 2016). For example, greek chocolate brand
Lacta enables specific groups of users to collaboratively augment the chocolate bar packaging
with private messages shared with the user’s social circle to gather feedback. This initiative
strengthens links between users and adds value to the AR initiative since it creates
conversations that could be extended to deeper personal relationships.
In the context of VTO, smart mirrors and social try-on rooms permit consumers to engage in
virtual try-ons and browse different colours and sizes, then share pictures of the items via social
media (Beck and Crié, 2018). Indeed, social media are increasingly adopting VTO while

15
creating a context for “consumer socialization”. This latter refers to the process by which
individuals learn skills, knowledge, and attitudes from others through communication, which
supports their functioning as consumers in the Marketplace (Ward, 1974). Traditional
socialization happens among consumers with their social environment such as family and
friends (Wang, 2012). Today, social media offer a new way of socialization via “virtual
communities” that exchange stylized photos or videos. As a result, social media socialization
is emerging as a new ecommerce opportunity where brands benefit from the formed “virtual
communities” (Scholz and Smith, 2016). These latter are characterized as “social aggregations
that emerge from the Internet when enough people carry on those public discussions long
enough, with sufficient human feeling, to form webs of personal relationships in cyberspace”
(Rheingold, 1993, p.5). In social media, the virtual communities’ gatherings practice influence
on the consumers purchase decisions through peer communication. Indeed, these interactions
about products/services among consumers predicts that it affects cognitive, affective and
behavioral attitudes (Ward, 1974).
3. Hypotheses development
Building on the previous research, the hypotheses of the study will be presented below.
First, perceived enjoyment and perceived usefulness revealed strong association with the usage
and website revisit in the context of retail shopping behavior (Forsythe and al., 2008).
According to the work of Pachoulakis and Kapetanakis (2012), the shopping experience
provides enjoyment for customers when the hedonic value is demonstrated.
Past research demonstrated that one of the main concerns in offline retail is the physical effort
provided for trying products, which is not usually enjoyable (Barnes et al., 2016 ). In their
work, Hao Suan Samuel et al., 2015 proposed that online shopping has the ability to overcome
this issue. via VTO, providing a more enjoyable and playful experience (Kang et al., 2020). In
the context of VTO, the hedonic element lies in the choice it offers to consumers in terms of
products which reinforces the reassurance in decision making (Hilken et al., 2017).
Additionally, online shopping behaviour research revealed that consumers are not purely
utilitarian, but that they also seek hedonic and social relationships and enjoyment (Kim, 2002).
16
Nevertheless, there is paucity of knowledge about the socio-emotional support that is present
in the VTO retail context, and particularly in the beauty industry.
In this context, VTO would enable feedback exchange between consumers, and reduce the
dilemma that consumers could face when faced with a variety of choices. In the social media
context, individuals generally have the same centers of interest which would facilitate
exchanging feedback (Lee and Robbins, 1995). Consequently, enjoyable interactions arise
between individuals who in return experience higher connection when they share opinions and
similarities (Cho & Son, 2019). In the beauty context, external feedback could enhance the
customer experience. Since beauty products answer by nature a social motivation (Tajeddini
and al., 2014), a condition where beauty VTO is used on social media would enhance how
enjoyable consumers perceived the technology to be, supporting the first hypothesis:
H1a: The VTO condition positively impacts perceived enjoyment
Along with perceived enjoyment, perceived usefulness enhances customer perceptions in the
holistic shopping experience (Poncin and Mimoun, 2014). The utilitarian construct in VTO lies
in its ability to offer an enhanced version of product information (Poushneh and Vasquez-
Parraga, 2017). Thanks to the visualization of products, the mental burden of imagination is
replaced by reality. Consequently, consumers go through an effective experience that targets
their informativeness needs (Javornik, 2016).
In order to maximize the provided usefulness, Mueller (2019) stated that in the context of AR
uncertainty should be tackled to fill the information gaps. In other words, the tool should
optimize the amount of information it offers in order to reduce uncertainty among users. For
example, uncertainty could be reduced through providing consumers with various information
sources (Mueller, 2019). Indeed, Ahuja and Galvin (2003) in their work on virtual
communities, found that thanks to socialization, new members can quickly learn task-related
knowledge and obtain skills while they interact with others. In this case, the main source of
information is the interaction between the virtual community members. In beauty VTO without
a social setting, information is usually provided by the VTO context where consumers would
visualize the product and build a mental image. Since social media are perceived as a source
of information that consumers would consult for various consumption related decisions (Lueg
17
et al., 2006) then the social VTO would enable extracting additional insights from peers about
their personal use and experience with the product. In this case, these exchanges lessen the
information uncertainty. As a result, the virtual community members might perceive the
technology as more useful.
H1b: The VTO condition positively impacts perceived usefulness
In their work on situated cognition, Semin and Smith (2013) stated that customers' judgments
and actions are impacted by elements present in their physical and social environment. When
applied in the Marketing context, this theory would imply that customers' attitudes and
behaviours are elevated in a context where they can share product experiences with other
customers (Chylinsky et al., 2020). In this vein, when VTO is integrated into a social media
platform, it offers the opportunity for shared experiences. For example, consumers are offered
the opportunity to test beauty products in different colors and shades, all while being able to
share the results with their community members. In the online retailing context, consumers are
greatly influenced by peers when interacting with products and services (Churchill and
Moschis, 1978). As a result, their perception of the medium is also impacted by their peers
(Hilken et al., 2017). Additionally, Coker et al. (2014) investigated social rewards in social
commerce and found that interactions between consumers positively attitudes towards the
social shopping medium. In regard to these findings, the VTO condition would impact
consumers' attitudes towards the VTO. (1)
According to Yim et al., (2017), positive consumer responses to technology would influence
the formation of their attitudes towards a particular technology. To illustrate, if a consumer
sees that the VTO technology will make their shopping experience more enjoyable and useful,
they are likely to form positive attitudes towards it. For example, Ducoffe (1996) research on
web advertising found that when users perceive the web as entertaining and informative, they
are prompt to adopt a positive attitude towards it. Additionally, Zhang et al., (2019) study about
clothing online retailing stated that both perceived usefulness and perceived enjoyment directly
affect the attitudes towards the VTO. Hence, no evidence was provided that the perceived
usefulness and perceived enjoyment of a VTO provide enhanced attitudes towards the
18
technology in the beauty context. (2)Along with the previous findings about perceived
usefulness and perceived usefulness forming attitudes towards technologies (Lee et al., 2003).
Also, in their study on e-commerce retail, Pantano et al., (2017) confirm that perceived
usefulness and perceived enjoyment directly impact consumer’s attitudes towards an
augmented reality system. (3)
Based on the following suppositions:
VTO condition impact attitudes towards the VTO
VTO condition directly impacts perceived usefulness and perceived enjoyment.
Perceived usefulness and perceived enjoyment are direct antecedents of attitudes towards VTO.
We could support that:
H2: Perceived enjoyment mediates the relationship between VTO condition and
attitudes towards the VTO
H3: Perceived usefulness mediates the relationship between VTO condition and
attitudes towards the VTO
According to the theory of reasoned action, an individual is more likely to perform a behavior
when they have a positive attitude towards it (Ajzen and Fishbein, 1980).
In the context of online shopping, Cho and Son (2019) found that consumers who perceive an
online shopping medium positively are more likely to proceed with their intended transactions.
Also, according to the work of Kim and Forsythe (2008), positive attitudes towards VTO in
online apparel shopping enhance consumer’s behavioural intentions towards it.
Regarding the intention to use, Kim and Forsythe (2009) along with Lee et al., (2006) state that
intentions to use an online retailing website are related to online consumers attitudes towards
it. Furthermore, Rogers (1995) along with Moore and Benbasat (1991) support that an
individual's attitude towards an innovation is considered to be at the root of his or her intended
use of it. According to the work of Kim and Forsythe (2008), positive attitudes towards VTO

19
in online apparel shopping enhance consumer’s intention to use it. Despite the sufficient
evidence between the direct positive impact of attitudes towards a technology and the intention
to use it, research is lacking in beauty VTO. In this context, studying the impact of attitudes on
the intention use is crucial since the VTO would enable solving the Makeup fitting issue while
using it. As a result, the VTO could easily become their medium of purchase in the future.
Concerning word-of-mouth, it is also motivated by favorable attitudes in technology
acceptance, since it is a behavioural intention (Ajzen, 1991; Fishbein & Ajzen, 1975).
According to Dacko (2016), AR offers the means to reach positive behavioural outcomes
including purchase behavior and word of mouth. Pantano et al., (2017) found that the few
eyewear retailers who introduced AR to support shopping saw positive effects on consumer’s
purchase decisions on short term and loyalty, as well as word-of-mouth on the long term.
In the beauty context, assessing word-of-mouth would be important since the use of VTO on
social media is becoming more common. In this vein,
As a result of the previous findings on the link between attitudes and behavioral intention:
H4: Attitudes towards the VTO positively impact intentions to use the VTO
H5: Attitudes towards the VTO positively impact WOM intentions
Figure 1- Graphical model

20
Research design
This section will present the research design of the study, including the methodology, the data
collection instrument and the measurements of the survey.
1. Methodology
As a reminder, the main objectives of the study are: (1) Understanding the impact of VTO
condition (social vs non-social) on the perceptions and attitudes towards the VTO; (2)
Exploring the impact of attitudes towards VTO on behavioural intentions in the beauty context.
In order to test the formulated hypotheses, a causal research design was developed. According
to (Malhotra, 2017), causal research has the merit to demonstrate evidence of cause-and-effect
relationships when wanting to understand the cause variables and the effect ones of a
phenomenon. In the context of this study, the chosen research design aims to demonstrate the
relationship between VTO condition, perceived enjoyment and usefulness, attitude towards
VTO, intention to use the VTO, and word of mouth intention. Consequently, the causal
relationships will be evaluated via an experimental design.
1.1. The experiment
The experiment comprised a between-subjects’ laboratory design where each participant was
assigned to one of the two experiment conditions. The laboratory design offers the advantage
of control and time efficiency for respondents. Hence, they were asked to only answer
questions related to their assigned condition which enhanced their attention. Additionally, the
internal validity of this design is elevated thanks to the randomization of the two conditions
and the inclusion of other causal variables (Malhotra, 2017). In this case, taking into
consideration brand attitude helped understand its impact on the assumptions and other
variables during the after-fact examination.
21
1.2. The treatments
Therefore, two VTO conditions were attributed to participants, depending on VTO perceived
socialization, as the control variable. Supposedly, a social VTO condition (High condition),
and a non-social VTO condition (Low condition).
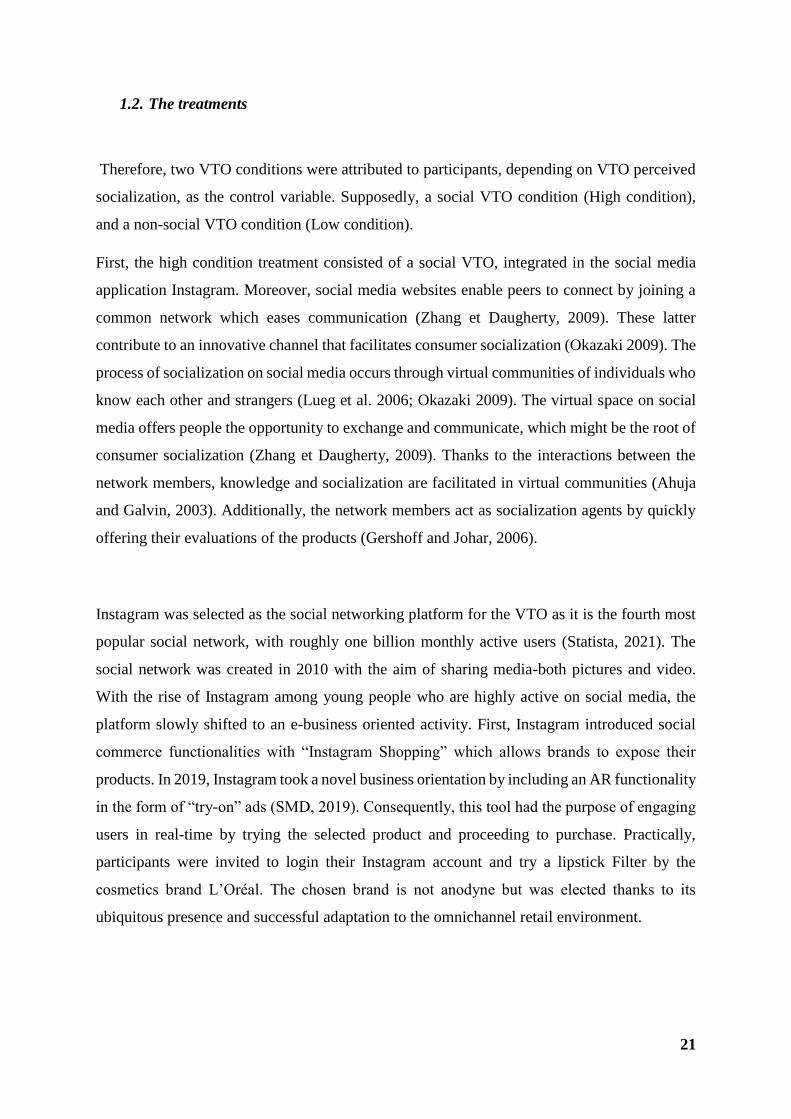
First, the high condition treatment consisted of a social VTO, integrated in the social media
application Instagram. Moreover, social media websites enable peers to connect by joining a
common network which eases communication (Zhang et Daugherty, 2009). These latter
contribute to an innovative channel that facilitates consumer socialization (Okazaki 2009). The
process of socialization on social media occurs through virtual communities of individuals who
know each other and strangers (Lueg et al. 2006; Okazaki 2009). The virtual space on social
media offers people the opportunity to exchange and communicate, which might be the root of
consumer socialization (Zhang et Daugherty, 2009). Thanks to the interactions between the
network members, knowledge and socialization are facilitated in virtual communities (Ahuja
and Galvin, 2003). Additionally, the network members act as socialization agents by quickly
offering their evaluations of the products (Gershoff and Johar, 2006).
Instagram was selected as the social networking platform for the VTO as it is the fourth most
popular social network, with roughly one billion monthly active users (Statista, 2021). The
social network was created in 2010 with the aim of sharing media-both pictures and video.
With the rise of Instagram among young people who are highly active on social media, the
platform slowly shifted to an e-business oriented activity. First, Instagram introduced social
commerce functionalities with “Instagram Shopping” which allows brands to expose their
products. In 2019, Instagram took a novel business orientation by including an AR functionality
in the form of “try-on” ads (SMD, 2019). Consequently, this tool had the purpose of engaging
users in real-time by trying the selected product and proceeding to purchase. Practically,
participants were invited to login their Instagram account and try a lipstick Filter by the
cosmetics brand L’Oréal. The chosen brand is not anodyne but was elected thanks to its
ubiquitous presence and successful adaptation to the omnichannel retail environment.
22
On one hand, L’Oréal is the worldwide leader in the cosmetics industry with an annual turnover
of 28 million dollars, and 5.4 million dollars of sales in e-commerce (L’Oréal, 2021). With a
large portfolio of brands covering different market segments, participants were more likely to
be acquainted with the brand, which offered the opportunity to test the impact of brand attitude
on the research. On the other hand, l’Oréal is one of the first beauty brands to acquire an
Augmented Reality entity called “Modiface” in 2018 in the context of the group’s digital
acceleration. Modiface developed sharp technologies for cosmetic products virtual try on,
supported by tracking (L’Oréal, 2021).
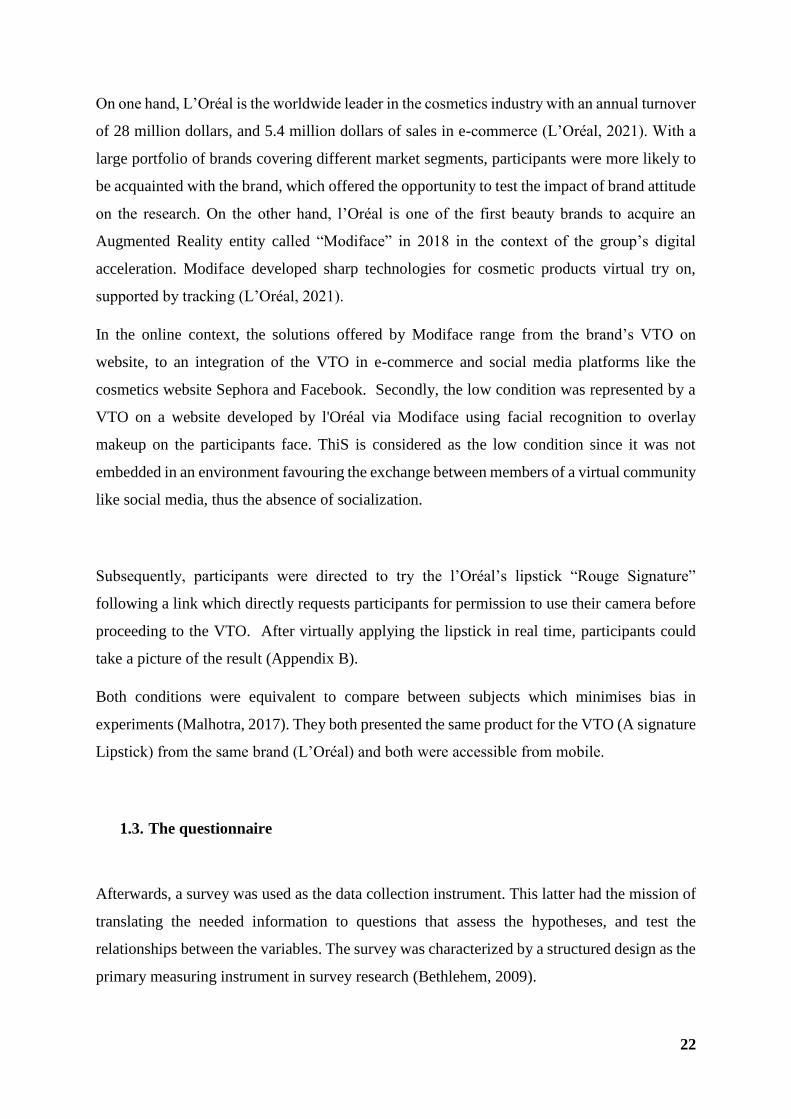
In the online context, the solutions offered by Modiface range from the brand’s VTO on
website, to an integration of the VTO in e-commerce and social media platforms like the
cosmetics website Sephora and Facebook. Secondly, the low condition was represented by a
VTO on a website developed by l'Oréal via Modiface using facial recognition to overlay
makeup on the participants face. ThiS is considered as the low condition since it was not
embedded in an environment favouring the exchange between members of a virtual community
like social media, thus the absence of socialization.
Subsequently, participants were directed to try the l’Oréal’s lipstick “Rouge Signature”
following a link which directly requests participants for permission to use their camera before
proceeding to the VTO. After virtually applying the lipstick in real time, participants could
take a picture of the result (Appendix B).
Both conditions were equivalent to compare between subjects which minimises bias in
experiments (Malhotra, 2017). They both presented the same product for the VTO (A signature
Lipstick) from the same brand (L’Oréal) and both were accessible from mobile.
1.3. The questionnaire
Afterwards, a survey was used as the data collection instrument. This latter had the mission of
translating the needed information to questions that assess the hypotheses, and test the
relationships between the variables. The survey was characterized by a structured design as the
primary measuring instrument in survey research (Bethlehem, 2009).

23
The questionnaire was built online on the Qualtrics Software program, which offered many
benefits. First, online questionnaires can easily eliminate bias thanks to skip patterns and
randomization of questions (Malhotra, 2007). Additionally, it was appropriate given the
respondents profiles since the research studied AR as an emergent technology, commonly
present on social media in the form of filters. In this vein, the two conditions required access
to both the VTO website and Instagram application which was more convenient online.
Expectedly, it was challenging to reach the required number of participants for the experiment
all while obtaining a high completion rate. Thus, online survey administration supported the
visibility of the survey thanks to sharing it on social media.
The survey was structured in three sections, arranged according to a fixed order. All questions
were closed to ensure fluidity in participants' answers. Furthermore, closed questions are less
time consuming and encourage the participants to complete the questionnaire. The participants
were forced to answer all questions, as a way to prevent non-response errors (Malhotra, 2017).
After briefly introducing the research topic, participants were asked a filter question about
gender. Given that the online experiment concerned beauty products, only women were
allowed to participate. In case this criterion was not answered, the participants were
automatically conducted to the end of the questionnaire. Afterwards, three questions were
asked to evaluate participants' familiarity with technologies, familiarity with the brand (l’Oréal)
and their attitude towards it.
Moreover, the participants were randomly assigned to one of the two conditions (social vs non-
social). In order to control both conditions, participants were asked about the product they just
tried, where only participants who chose lipstick were kept.
Afterwards, the post-experiment section evaluated the independent variable “VTO condition”,
along with the dependent variables : (1) perceived enjoyment (2) perceived usefulness, (3)
attitudes towards the VTO (4) Intentional behaviours and (5) word of mouth. The last section
of the questionnaire extracted the socio-demographic data in terms of age, level of education
and current occupation.

24
1.4. Survey distribution
Before officially sharing the survey, an initial test was done by distributing it to 8 respondents.
This phase was considered a fine-tuning step with the help of Marketing Research related
participants (4 Marketing students and 4 academic/professional supervisors). As a result, three
shortcomings were revealed: the formulation of a question that seemed ambiguous, the
environmental control and a reported issue with the social condition instructions. Thanks to
this step, the survey was optimized and officially launched. Lastly, the survey was distributed
via Qualtrics through an invitation with an URL using convenience sampling on social media.
The survey publication was posted by a third party account on social media, since anonymity
ensures that the answers won’t be biased (Andrews et al., 2008). After three weeks, 184
answers were collected.
2. Scales and measures
2.1. Independent variables
Thanks to the randomization of the two conditions (Social vs non-social VTO), the independent
variable “VTO condition” was controlled. The two conditions were expected to differ in terms
of “socialization” levels, which needed further confirmation from the subjects. Regarding the
evaluation of both VTO conditions (Instagram vs Website), a socialization scale developed by
Kim (2011), and adapted to the VTO context from the work of Zhang et al. (2019). This latter
was especially constructed for the AR context where little literature researched social scales.
2.2. Mediating variables
The first mediating variable “perceived usefulness” was assessed with the help of the scales
proposed by Pantano et al. (2017) and adapted from Rese et al. (2014). Additionally, the
evaluation scale of the second mediating variable “perceived enjoyment” was extracted from
the work of Kim and Forsythe (2009), and adapted by Zhang et al. (2019). Both adaptations
took into consideration the AR context as it was the focus of both researches.

25
2.3. Dependent variables
In order to assess the dependent variable of “attitudes towards the VTO”, the survey relied on
a scale constructed by both Ahn et al. (2004). This scale was accustomed to the AR context by
Rese and Donthu (2006). Moreover, the “behaviour intention” variables were divided in two
variables. First, the dependent variable “intention to use” was appraised thanks to the work of
Ahn et al. (2004) and its adaptation by Rese et al. (2017). The last dependent variable ``word
of mouth intention” (WOM) was constructed by Zeithaml et al. (1996) and adapted from the
work of Hilken et al., 2018).
2.4. Control variables
As stated previously, Malhotra (2017) reveals in his work the importance of evaluating other
causal factors, as a process of understanding the remaining variables that could potentially
influence the model. In the study context, the first control variable was the familiarity of the
participants with the use of new technologies. The reason behind assessing this variable was
that participants who heavily use new technologies could be more acquainted with them. Thus,
subjects who were less familiar with new technologies, could have higher levels of attention
and curiosity towards the VTO (Yang et al., 2020). The level of familiarity towards new
technologies was evaluated through an ascending 5-point continuous rating scale ranging from
“not familiar at all” to “extremely familiar”.
Additionally, brand familiarity and brand attitude were assessed in order to (1) validate the
supposed high familiarity of the brand among the sample, and (2) establish the link between
the brand familiarity and attitude, (3) as well as their impact on the model. Regarding (2), the
link between both variables was crucial since the familiarity of the participants does not
necessarily impact their brand attitudes. For example, subjects might well be acquainted with
L’Oréal products, but their attitudes could still be negative or neutral (Rauschnabel and al.,
2019). Brand familiarity was assessed with an ascending 5-point continuous rating scale
ranging from “not familiar at all” to “extremely familiar”. On the other hand, brand attitude
relied on the work of Li et al. (2002) and adapted in AR
context by Smink et al. (2020). The variable was measured via a 5 point-likert scale.
Lastly, socio demographic data was collected for profiling including: age, education level and
occupation.

26
Except for the control variables, all the questionnaire’s variables were assessed using five-point
Likert scales. This type of non-comparative scale relates the degree of agreement from 1
(strongly agree) to 5 (strongly disagree). It also offers the advantage of a simple construction
and is considered as easy to understand and administer (Malhotra, 2017). The following table
summarizes the various items and scales used to evaluate the independent, dependent and
mediating variables.
Construct
Scale Item Statement
Socialization (Kim, 2011; Zhang et al.,
2019)
5-point Likert scale
from "Strongly
disagree" to
"Strongly agree"
soc1 This VTO allows me to share my look with others
soc2 This VTO allows me to socialize with others
soc3 This VTO allows me to exchange information with others
Perceived enjoyment (Kim and Forsythe,
2009; Zhang et al., 2019)
5-point Likert scale
from "Strongly
disagree" to
"Strongly agree"
enj1 Using the VTO was entertaining
enj2 Using the VTO was enjoyable
enj3 Using the VTO was fun
enj4 Using the VTO was exciting
Perceived usefulness (Pantano et al.,
2017; Rese et al., 2014)
5-point Likert scale
from "Strongly
disagree" to
"Strongly agree"
use1 I think that the VTO has great value
use2 I think that the VTO provides beautiful ideas for lipstick
use3 I think that the VTO is inspiring in terms of lipstick ideas
use4 I think that the VTO could help me come to a decision in choice of lipstick
Attitudes towards VTO (Ahn et al., 2004;
Rese et al., 2014)
5-point Likert scale
from "Strongly
disagree" to
"Strongly agree"
att1 I am positive about the VTO
att2 I want to learn about the VTO
att3 It makes sense to use the VTO
att4 The VTO is a good idea
att5 Other people should use the VTO
Use intentions (Munar & Jacobsen, 2014;
Chu and Kim, 2011)
5-point Likert scale
from "Strongly
disagree" to
"Strongly agree"
ui1 Using the VTO if I want to purchase a lipstick
ui2 Giving the VTO a priority over the offline shop
ui3 Giving the VTO and the online shop a priority over the offline shop
ui4 Regularly using the VTO before purchasing in the future
word of mouth (Zeithaml et al., 1996;
Hilken et al., 2018)
5-point Likert scale
from "Strongly
disagree" to
"Strongly agree"
wom1 Talking about the VTO with friends or family
wom2 Sharing the content of the VTO with friends or family
wom3 Recommending the VTO to my friends or family
Table 1- Scales and measures
27
Results
In this section, data analyses will be explained in a three step process. The first step consists of
a preliminary analysis where normality, validity and reliability were tested to ensure that the
data is fit. Afterwards, the manipulation checks were verified.
Lastly, the hypotheses were tested and the relationships between variables assessed.
Respondents
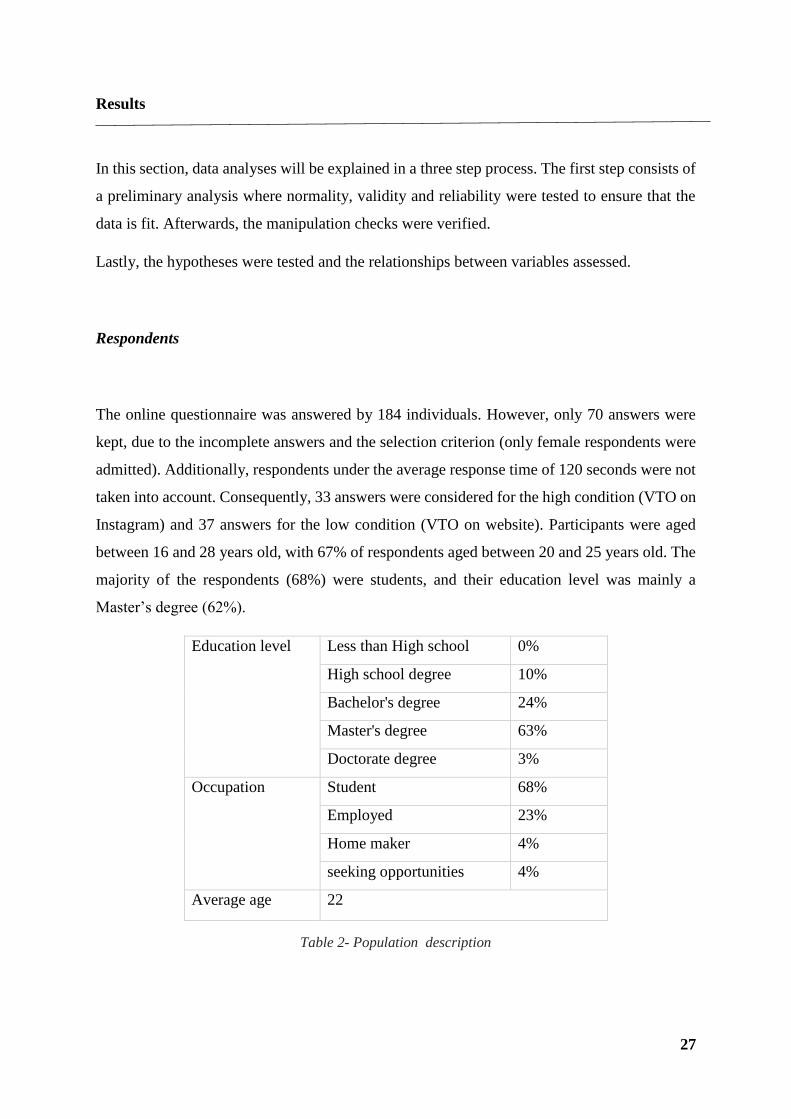
The online questionnaire was answered by 184 individuals. However, only 70 answers were
kept, due to the incomplete answers and the selection criterion (only female respondents were
admitted). Additionally, respondents under the average response time of 120 seconds were not
taken into account. Consequently, 33 answers were considered for the high condition (VTO on
Instagram) and 37 answers for the low condition (VTO on website). Participants were aged
between 16 and 28 years old, with 67% of respondents aged between 20 and 25 years old. The
majority of the respondents (68%) were students, and their education level was mainly a
Master’s degree (62%).
Education level Less than High school 0%
High school degree 10%
Bachelor's degree 24%
Master's degree 63%
Doctorate degree 3%
Occupation Student 68%
Employed 23%
Home maker 4%
seeking opportunities 4%
Average age 22
Table 2- Population description

28
1. Preliminary tests
Prior to the data analysis, tests were conducted to assess the normality, the reliability and the
validity of the scales that were already validated in the literature.
First, the Shapiro-Wilk test did not validate the null hypothesis (p>0.05), stating that the data
diverges from a normal distribution (Appendix C).
Additionally, normality was assessed via calculating the kurtosis and skewness (Appendix D).
Both metrics were situated between -2 and 2, with a slightly left skewed distribution. According
to Georges and Mallery (2010), this is an acceptable range to support that the data is normally
distributed.
Given that the used scales were validated by previous literature; the consistency of the
constructs measures was assessed via a confirmatory factor analysis. This latter revealed that
the pattern matrix shows a cross loading of the second attitude towards VTO item (att2). In
other words, this item was loading on another component than attitudes towards VTO, where
the other items loaded. Despite a high factor loading (0.7), the item removal increased the
reliability of the variable (The alpha’s Cronbach went from 0.9 to 0.92). This increase led to
the removal of att2 to enhance the scale’s reliability. Second, the constructs of VTO use
intentions loaded on different components (bi1 and bi4 as a group, bi2 and bi3 in a distinct
component). The items bi1 and bi4 were removed since they both had the lowest factor
loadings. Hence, this removal significantly increased the reliability of the scale (The alpha’s
Cronbach went from 0.86 to 0.9) (Appendix E)
Lastly, the validity of the scales was measured item-wise, where all item coefficients (Pearson’s
product moment) were compared to a critical value from the critical table searched on the table
product (Freedman et al.,2007), where DF:68 (N-2) and a 5% significance level. All items were
significantly higher than the critical value (c:0.232).

29
2. Manipulation checks
In order to assess that the manipulation of the two treatments is correct (The VTO on social
media vs the non-social condition; on the brand’s website), a social construct named
socialization was used as part of the questionnaire. Since the social media condition is supposed
to be the high one, the socialization level should be more elevated than the socialization level
in the Website condition (Low condition). For this matter, a T-test for independent samples
was conducted to compare between the means of the two groups (social vs non social). In the
social VTO condition (Instagram), the subjects perceived that the VTO enables more: looks
sharing (soc1 means: 4.2 vs 2.4), socializing (soc2 means: 3.9 vs 2), and information exchange
(soc3 means: 4 vs 2.9). Additionally, a compounded mean of combining the three items was
calculated to test socialization between groups. Consequently, the supposed high condition
scored higher than the low condition (4 vs 2.46). These differences between conditions were
statistically significant (p<0.001), resulting in a successful manipulation. The differences
between the means are summarized in the table below:
3. Hypotheses testing
First, the direct links (H1a, H1b) were tested using the T-test for independent variables to check
the mean differences between the two conditions (High condition: VTO on social media; low
condition: VTO on website). Afterwards, the mediating links (H2, H3) of the conceptual model
were calculated using PROCESS macro for SPSS. This method consists of calculating
mediation models for each dependent variable (attitude towards the VTO), with the VTO
condition as the independent variable, and perceived enjoyment and usefulness as mediators.
Soc1 Soc2 Soc3 Perceived
socialization
High condition- VTO on
4.2 3.9 4 4
Low condition-VTO on Websites 2.4 2 2.9 2.46
Significance p<0.001 p<0.001 p<0.001 p<0.001
Table 3- Preliminary checks results
30
Subsequently, the impact of attitudes towards behavioural intentions was assessed using
correlation and regression analysis. Lastly, the other potential causal links were tested using
correlation and regression analyses.
3.1. Direct links
First, the VTO condition was expected to positively impact perceived enjoyment and perceived
usefulness of the VTO. The results of the T-test analysis between the two conditions (social vs
non-social) revealed that the participants perceived more enjoyment in the VTO on the website
(mean: 4.1), in comparison to the social condition (mean : 4). Hence, this link between the two
conditions was not significant (p>0.05). As a result, the impact of VTO condition on perceived
enjoyment hypothesis (H1a) was not supported by the data.
Additionally, the VTO condition was expected to positively impact perceived usefulness. The
analysis revealed that the low condition (mean: 4.2), scored higher than the social condition
(mean: 3.6). However, no further deductions could be extracted from this finding due to the
non-significance of the result (p>0.05). Consequently, H1b was rejected.
3.2. Indirect links
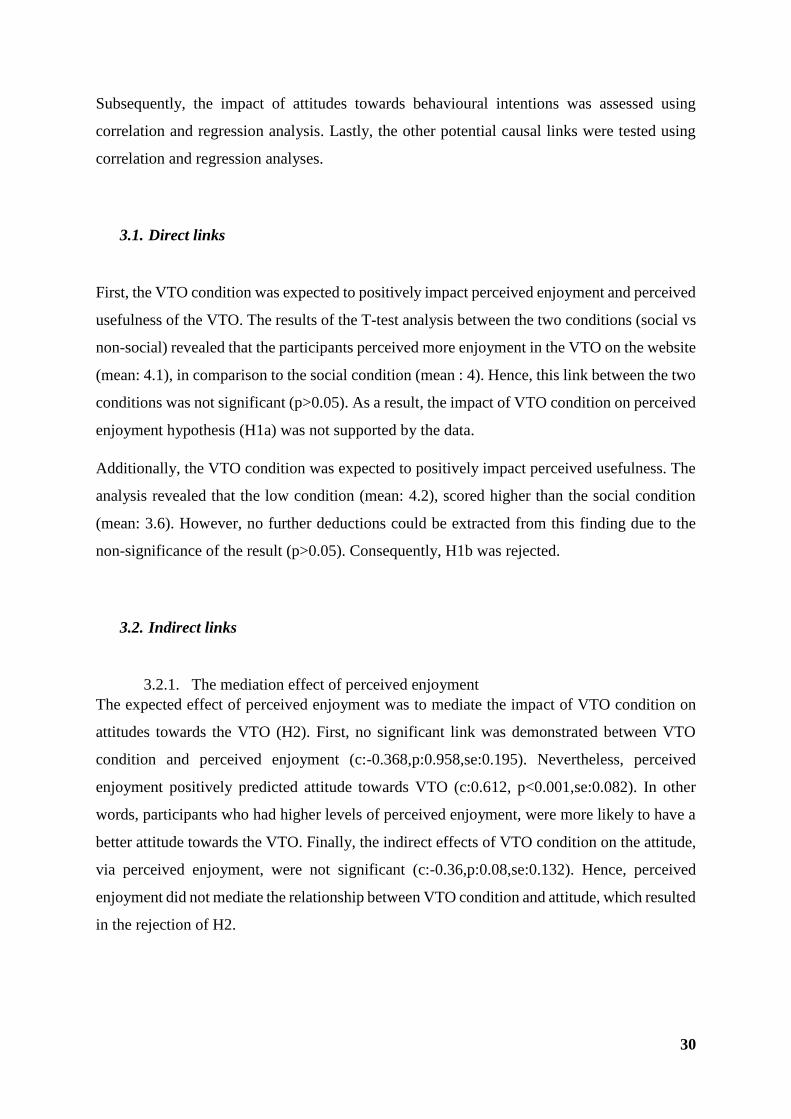
3.2.1. The mediation effect of perceived enjoyment
The expected effect of perceived enjoyment was to mediate the impact of VTO condition on
attitudes towards the VTO (H2). First, no significant link was demonstrated between VTO
condition and perceived enjoyment (c:-0.368,p:0.958,se:0.195). Nevertheless, perceived
enjoyment positively predicted attitude towards VTO (c:0.612, p<0.001,se:0.082). In other
words, participants who had higher levels of perceived enjoyment, were more likely to have a
better attitude towards the VTO. Finally, the indirect effects of VTO condition on the attitude,
via perceived enjoyment, were not significant (c:-0.36,p:0.08,se:0.132). Hence, perceived
enjoyment did not mediate the relationship between VTO condition and attitude, which resulted
in the rejection of H2.

31
3.2.2. The mediation effect of perceived usefulness
Perceived usefulness was expected to mediate the relationship between product VTO condition
and attitude towards the VTO. After examining the direct effects between VTO condition and
perceived usefulness, the data showed no significance in the link, c(c: -0.61,p<0.001,se:0.015).
Additionally, perceived usefulness could positively and directly impact behavioural intention
using VTO (c:0.74, p<0.05, se:0.138). Finally, the indirect effects analysis showed that
perceived usefulness does not mediate the relationship between VTO condition and attitude
towards VTO (c: -0.03, p:0.813, se:0.128), resulting in invalidating H3.
4. Attitudes towards the VTO and behavioural intentions
Later, the impact of attitudes towards the VTO on behavioural intentions (use intention and
word-of-mouth intention) was tested using both correlation and regression analyses.
Figure 2- Mediation results of perceived
enjoyment
Figure 3- Mediation results of perceived
usefulness
32
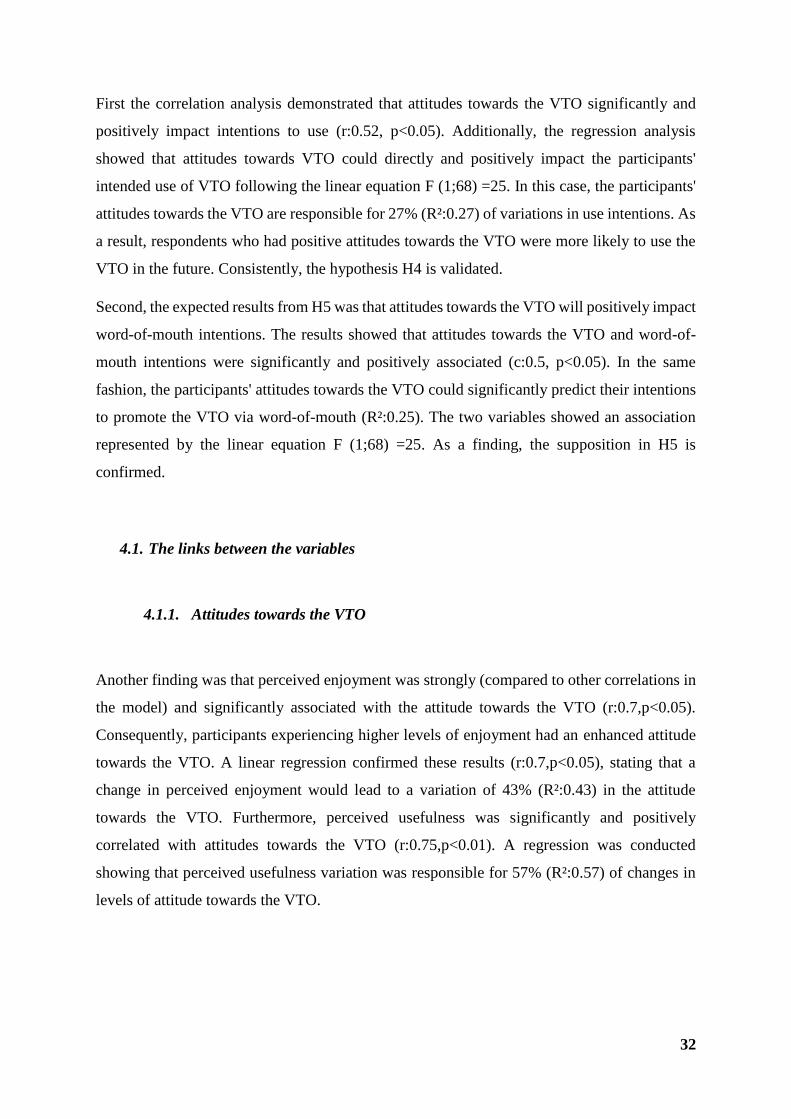
First the correlation analysis demonstrated that attitudes towards the VTO significantly and
positively impact intentions to use (r:0.52, p<0.05). Additionally, the regression analysis
showed that attitudes towards VTO could directly and positively impact the participants'
intended use of VTO following the linear equation F (1;68) =25. In this case, the participants'
attitudes towards the VTO are responsible for 27% (R²:0.27) of variations in use intentions. As
a result, respondents who had positive attitudes towards the VTO were more likely to use the
VTO in the future. Consistently, the hypothesis H4 is validated.
Second, the expected results from H5 was that attitudes towards the VTO will positively impact
word-of-mouth intentions. The results showed that attitudes towards the VTO and word-of-
mouth intentions were significantly and positively associated (c:0.5, p<0.05). In the same
fashion, the participants' attitudes towards the VTO could significantly predict their intentions
to promote the VTO via word-of-mouth (R²:0.25). The two variables showed an association
represented by the linear equation F (1;68) =25. As a finding, the supposition in H5 is
confirmed.
4.1. The links between the variables
4.1.1. Attitudes towards the VTO
Another finding was that perceived enjoyment was strongly (compared to other correlations in
the model) and significantly associated with the attitude towards the VTO (r:0.7,p<0.05).
Consequently, participants experiencing higher levels of enjoyment had an enhanced attitude
towards the VTO. A linear regression confirmed these results (r:0.7,p<0.05), stating that a
change in perceived enjoyment would lead to a variation of 43% (R²:0.43) in the attitude
towards the VTO. Furthermore, perceived usefulness was significantly and positively
correlated with attitudes towards the VTO (r:0.75,p<0.01). A regression was conducted
showing that perceived usefulness variation was responsible for 57% (R²:0.57) of changes in
levels of attitude towards the VTO.

33
4.1.2. Behavioural intentions
On average, participants were more predisposed to use the VTO when they perceived it as
useful (r:0.4,p<0.05), than when they perceived the tool as enjoyable (r:0.4,p<0.05). However,
participants experiencing higher levels of enjoyment showed more willingness to communicate
about the VTO through word of mouth (r:0.68,p<0.05). Consequently, a significant regression
link supported that perceived enjoyment was responsible for 48% (R²:0.48) variation in word-
of-mouth intention. Second, word of mouth intention was also positively correlated with
perceived usefulness (r:0.46,p<0.05). In other words, subjects perceiving the product VTO as
more useful were more willing to promote it through word of mouth. The regression supported
this significant link, where a change in the perceived usefulness levels could predict 21%
variations in word-of-mouth.
4.1.3. Combined effects of perceived enjoyment and perceived usefulness
Interestingly, the analysis covered a significant association between perceived enjoyment and
perceived usefulness where they were both positively correlated (r:0.6,p<0.005). As a
consequence, when participants viewed the product VTO as useful, they were more likely to
perceive it as enjoyable, and vice-versa. In order to explore this relevant finding, a multiple
regression was conducted to understand how combining both perceived enjoyment and
usefulness will impact attitude towards the VTO.
First, a model including perceived usefulness and perceived enjoyment as predictors, and
attitude as the dependent variable was evaluated. As a result two model simulations arised: the
first one where the only predictor was perceived usefulness, and a second one where both
independent variables predict the dependent variables. The model of combined independent
variables could contribute to a variation of 63% (R²:0.64) in attitudes towards the VTO. In
other words, there are external factors other than perceived enjoyment and perceived usefulness
that are not part of the model responsible for 27%(R²:0.27) changes in attitudes.
Nevertheless, The better prediction model of attitudes was the one where the only predictor is
perceived usefulness (F:87, p<0.001). This latter displayed a significantly better representation
34
than the model including both perceived usefulness and perceived enjoyment as predictors
(F:57, p<0.001). Consequently, we could affirm that perceived usefulness is a stronger
predictor of attitudes towards VTO.
4.1.4. Brand familiarity and brand attitude
Half of the participants reported that they were familiar with new Technologies (50%). Also,
high levels of familiarity with the brand L’Oréal were revealed (60%) and the largest part of
the participants expressed a positive attitude towards the brand (65%).
Further, there was no significant brand familiarity difference between participants in the social
condition (r:3.9, p>0.05) and the website one (r:4.1, p>0.05) . Brand familiarity was solely
significantly and positively related to brand attitude (r:0.23, p<0.05). Concretely, participants
had an enhanced brand attitude when they already were familiar with it. After evaluating the
difference between both conditions (social vs non-social) in terms of brand attitudes, their
means both scored high (in comparison to other variables), yet, no significant differences
showed between the groups.
Furthermore, no significant correlation was demonstrated between on one hand: brand
familiarity, brand attitude, and the other variables. Expectedly, these findings reveal a
homogeneous brand familiarity, and a dominating positive brand attitude as supposed
previously. Lastly, no significant link was exposed between age, occupation, education level
and other variables.
Hypothesis Variables Results
H1a VTO condition->PU Rejected
H1b VTO condition->PE Rejected
H2 VTO condition->PU->ATT Rejected
H3 VTO condition->PE->ATT Rejected
H4 ATT->IU Validated
H5 ATT->WOM Validated
Table 4- Summary of results
35
Discussion
1. Socialization and technology acceptance
The AR literature covered a need for further inclusion of the social dimension (Baron &
Kenny, 1986). Indeed, previous studies in technology acceptance revealed that platforms like
social media represent a potential opportunity for ecommerce, since consumers interact with
each other and share information through the process of socialization. As a result, enjoyable
interactions arise (Baron & Kenny, 1986) and the informativeness needs of consumers are
answered through information exchange (Javornik, 2016). In the context of AR, the hedonic
and utilitarian constructs were expected to be enhanced with the introduction of socialization.
In order to test this supposition, the VTO was presented in two conditions: a social media
condition and a website one.
However, the results (H1, H2) did not acknowledge the link between VTO condition on one
hand, and both perceived enjoyment and perceived usefulness on the other hand. In order to
understand this disparity with the hypotheses, close attention was paid to the study
methodology.
After scrutinizing the results of the first hypothesis (H1), the main reason behind the rejection
of the hypothesis was the non-significant link between the VTO condition and both perceived
enjoyment and perceived usefulness. In this case, the source of the inconsequence could lie in
the sample size that was calculated using the Hair et al. (2010) method. This latter consists of
attributing five respondents to each variable. As a result, the study slightly exceeded the
required minimum (30 per condition). Thus, there is a probability that the effects of the
investigated phenomenon were too underpowered to be detected. Additionally, the social
dimension representation via socialization was chosen based on one previous study that
investigated social dimensions in VTO (Zhang et al., 2019). Indeed, scarce literature showed
interest for social scales development in the AR context, which reflected on the limited three-
items scale of socialization (Zeithaml et al., 1996; Hilken et al., 2018). Despite the favourable
results of the confirmatory analysis, the robustness of the control is questioned. Nevertheless,
the suspicions towards the methodological aspects were lightened after researching about the
sources of the inconsistency.

36
In this vein, previous research in the context of AR showed that using the tool on social media
could carry negative effects. Accordingly, Kang et al., (2020) state that when AR has a
“playfulness” component, consumers seek to interact more with the technology for fun.
Consequently, they are less likely to purchase the product. In fact, this component does not
play in favour of AR’s credibility since the tool is perceived as a game. This finding exposes
one of the main concerns of VTO, which is the difficulty to draw the line between its use as a
retailing tool and as an entertainment tool.
Also, even if the between-conditions results are not significant, the difference between the two
groups in their usefulness perception was close to significance (0.06). In fact, the group that
was exposed to the non-social condition of VTO on the website, showed (insignificant) higher
average mean in the independent T-test. Despite their non-concluding effects, these findings
raised doubts about the impact of social VTO on perceived usefulness and whether they truly
elevated the experience. The previous suppositions presented in the literature review supposed
that the social VTO was supposed to be allowing more informativeness and usefulness (Lueg
et al., 2006). Against expectations, the utilitarian value was also questioned in a few researches.
In their work on hedonic and utilitarian values of a technology, Adams et al. (1992) exposed
that the strength of each factor depends on the nature of the technology. In other words, if the
main task that a technology is trying to achieve is utilitarian, then the utilitarian construct would
have a stronger influence than the hedonic construct. Accordingly, VTO finds its roots in a
purely utilitarian context where it aims to provide retailers with a solution to the “fit suit and
match” dilemma (Pachoulakis and Kapetanakis, 2012). In the context of the experiment, the
nature of the VTO was not clearly expressed since participants were just asked to try a product,
without a purchasing request afterwards, or an indication about the context.
In this regard, the social media VTO seemed to pursue more hedonic benefits since it included
other functionalities on the platform, such as the video and photo sharing options, in
comparison to the website which clearly emphasized the VTO functionality.
However, even the hedonic construct did not show a significant difference between groups,
which also raises doubts about if the VTO assuredly enhances consumer perceived enjoyment
as precised by previous studies (Cho & Son, 2019).
37
In the same fashion, a study conducted by Yaoyuneyong et al. (2014) acknowledged that even
if research mainly focuses on the positive constructs of a technology medium such as
enjoyment, there is little investigation on the negative ones. For instance, they concluded that
“irritation” could negatively influence attitudes. This latter characterizes the control,
offensiveness and distraction that consumers express while interacting with the technology
medium. In their work, Yaoyuneyon et al. (2014) investigate web irritation as the extent to
which a website would use techniques that are manipulative and annoying, which would lead
to negative responses to the website.
Consequently, a new factor could be at stake in the context of the study, which is the
participants' attitude towards Instagram as a brand since it is also a platform that promotes
different types of content that could be perceived differently by consumers.
A question covering Instagram brand attitude could have been insightful in order to explore if
there were any negative brand associations impacting the model.
2. The mediating effect of perceived usefulness and perceived enjoyment
As supported by the second and third hypotheses, perceived enjoyment and perceived
usefulness were anticipated to mediate the relationship between VTO condition and attitudes
towards the VTO. This supposition was refuted because VTO condition did not significantly
impact both perceived enjoyment and perceived usefulness. The divergence with the expected
results could be affiliated to two main elements. Above all, no research previously investigated
the impact of socialization on the underlying mechanisms of technology acceptance,
particularly in the beauty VTO context. This said, the mediation supposition was approximated
via combining research from various theories, based on previous antecedents and outcomes
(Fishbein and Ajzen, 1975; Davis et al., 1996, Semin and Smith 2013) and adapted to the
context of socialization (Hilken et al., 2017, Wang et al., 2012). In this matter, studies mainly
assessed the social dimensions as a direct precedent of attitudes towards the technology. For
instance, Zhang et al. (2019) investigated the effects of four constructs including: perceived
usefulness, perceived enjoyment, perceived socialization and perceived product risk as
38
antecedents of attitude towards VTO. As a result, all three constructs showed significant impact
on attitudes towards VTO except for perceived socialization.
Further, the literature review revealed that the impact of “ease of use” in the social context was
refuted since its overall impact was deemed insignificant (Bounkhong and Cho, 2017).
However, its assessment could have explained better the shortcomings of H2 and H3. As the
results of the VTO online garment study showed (Zhang et al., 2019), ease of use affected
directly and significantly perceived enjoyment and perceived ease of use. Consequently,
including ease of use in the research would have given insights about the mediation
insignificant results.
3. Attitudes towards the VTO and behavioural intentions
Although the mediation hypotheses were rejected, they did not prevent the positive link
between both perceived usefulness and perceived enjoyment on one hand, and attitudes on the
other, from being validated. Consequently, the study proved that in the beauty context, both
perceived usefulness and perceived enjoyment affect positively the attitudes towards the VTO.
Not only they confirmed this link, but they also revealed to what extent both values are
distributed in the beauty VTO. Perceived usefulness (57%) proved to have more positive
influence over attitudes towards VTO in comparison to perceived enjoyment (43%). This
finding aligns with the previous study investigated by Adams et al. (1992). Accordingly, this
work confirms the utilitarian nature of beauty VTO as consumers would seek more task related
benefits, such as experiencing with the colors and new products to make a purchase decision.
In fact, the utilitarian value in the beauty context was not deeply investigated. In this regard,
understanding the researched utilitarian value from the VTO would enable an approximate
answer about the tool’s nature. Also, it would allow the exploration of consumer's researched
utilitarian values, such as seeking a particular product-related information. Additionally, the
context of the VTO should be taken into consideration. In other words, the utilitarian features
could vary across industries and applications. In fact, the choice of a particular shopping
channel is defined by consumers' shopping motivation (Hilken et al., 2017).
39
Consequently, the consumers' motivations should be reliably understood and integrated to the
VTO solution so it fits their needs and requirements. Thus, the strong link between perceived
usefulness and perceived enjoyment shows that both could be balanced in order to provide an
enhanced VTO experience. Accordingly, the context is key in determining whether an aspect
or another should be emphasized.
In line with previous research related to behavioural intentions (Kim and Forsythe, 2009; Lee
et al., 2006; Cho & Son, 2019), the study also confirmed that consumers' favourable attitudes
would enhance their behavioural intention in the beauty VTO context.
First, participants who expressed a positive attitude towards the VTO showed more willingness
to use the tool in the future. This conclusion joins previous research that supports this positive
link between attitudes and intentions to use a website in online retailing (Lee et al., 2006) and
Kim and Forsythe (2009). As a result, these effects could be replicated to the beauty VTO
context.
Additionally, the attitude towards VTO revealed a positive influence on word-of-mouth
intentions. In contrast with the predominant utilitarian effect on both attitudes and intention to
use, word-of-mouth intention was revealed to be more determined by the hedonic construct. In
this regard, research supports this finding as consumers who enjoy an experience will be more
willing to communicate about their expressed pleasure during the activity (Cho & Son, 2019).
Consequently, they would be drawn to share their knowledge and experiences with their social
environment as proof of the elevated experience ( Barnes et al., 2016 ).
Also, the analysis showed that there are other constructs than perceived usefulness and
enjoyment that explain attitudes. A suspected factor is the “novelty” of the technology. Novelty
in AR differs from its conventional definition that is related to the newness and uniqueness of
a thing. Admittedly, AR novelty refers to the way AR displays content by presenting unique,
personalized and novel stimuli that consumers would experience (Javornik, 2016). According
40
to Ferraro et al. (2017), consumers might want to try VTO for its novelty, but its effects would
fade in the long term.
41
Conclusion
1. Short summary
The work at hand explores VTO in the beauty industry in two phases. First, the VTO condition
(Instagram vs Website) impact on attitudes and perceptions. Then, the research assesses
whether using a VTO in the beauty industry reflects a positive effect on attitudes and
behavioural intentions. Both relationships are explored via a hedonic construct “perceived
enjoyment” and a utilitarian construct “perceived usefulness”.
To fully understand the relationships between these stated variables, a between-subjects design
was used. Participants were randomly assigned to separate groups where the first one virtually
tried on a lipstick of the beauty brand L’Oréal on the social media platform Instagram, and the
second one was directed to L’Oréal’s VTO website. The online survey was created and
distributed online for data collection.
Afterwards, the collected data was scrutinized which shed light on various findings.
First, the VTO condition (social vs non-social) showed no significance on the participants'
perceptions of the tool including enjoyment and usefulness. Additionally, perceived usefulness
and perceived enjoyment did not mediate the relationship between the VTO condition and the
attitudes towards it. However, the participants' attitudes towards the VTO seemed to
significantly and positively impact their intentions to use it and promote it via word-of-mouth.
Consequently, the inconsistency with the social hypotheses could be attributed to the scarce
research on social VTO along with the sample size. However, the hedonic construct
“playfulness” seemed to negatively impact VTO in a social setting (Kang et al., 2020).
Moreover, previous findings about the positive association between attitudes and behavioural
intentions (Kim and Forsythe, 2009; Lee et al., 2006; Cho & Son, 2019) are confirmed in the
beauty VTO context. Lastly, the utilitarian construct strongly influenced attitudes and
intentions to use, while the hedonic construct had greater impact on word-of-mouth intentions.

42
2. Theoretical implications
The results did not show both the positive and significant impact of socialization in VTO on
perceived enjoyment and perceived usefulness, along with their mediating role between the
VTO condition and attitudes towards it. However, past research confirmed the potential
positive effects of social contexts such as social media, on immersive technologies (Tom Dieck
ad Han, 2021). Meanwhile, the study conducted by (Zhang et al., 2019) showed that
socialization did not impact attitudes nor the tested model. In this case, the suspected disparity
should be tested with a larger sample and further research about the VTO social constructs.
On the other hand, the generalizability of previous research on VTO regarding attitudes and
behavioural intentions could be extended to the beauty context (Kim and Forsythe, 2008; Lee
et al., 2006). Indeed, attitudes towards the VTO positively and significantly impact the
participants’ intention to use the VTO and promote it through word-of-mouth. Moreover, the
utilitarian construct seemed to be a better predictor of the attitudes towards the VTO than both
constructs combined. Further, perceived usefulness impacted more intention to use the VTO
than the perceived enjoyment. Hence, this indicates that VTO in the beauty context leans
towards being a utilitarian tool.
On the other hand, the hedonic construct was strongly associated with the intention to promote
the tool via word-of-mouth. Accordingly, word-of-mouth could be an insight to investigate
further social VTO.
3. Managerial implications
The present research provides valuable insights about beauty VTO. Indeed, the VTO on social
media did not prove to be an efficient tool to leverage perceptions and attitudes towards the
tool. The supposedly fruitless effect of socialization in the context of beauty VTO could be
linked to the concern that the it might be mistaken for an entertainment tool. Additionally, the
abundance of information on social media could achieve less usefulness, and make the user
experience “irritating”.

43
Later on, beauty VTO was proved to positively impact attitudes and behavioural intentions.
Indeed, the utilitarian nature of VTO in beauty retail manifested since the utilitarian factor was
deemed to be a better predictor of the attitudes towards the VTO, as well as the intentions to
use it. In this vein, Marketers should be aware of the predominant utilitarian aspect of the
beauty VTO while building a solution. For instance, they could emphasize utilitarian features
to make it clear that it is a purchasing tool, such as the provided information quality and the
mapping of the virtual content in the real-world.
However, this does not prevent beauty marketers from leveraging its hedonic features in case
they aim to promote the VTO via word-of-mouth. In this regard, managers should be aware of
what they are trying to achieve through the VTO before implementing it, instead of “building
it until they come”.
In other words, they should be able to identify the right features for the right context. For
instance, while the hedonic construct items of the study (entertaining, fun, enjoyable, exciting)
seemed to strongly impact the VTO intended word-of mouth promotion, other hedonic
constructs such as “playfulness” were proved to make the tool seem like its main purpose is
entertainment.
Consequently, building the right solution requires further research on VTO features that
embody more the hedonic or utilitarian constructs and their impact. For instance, understanding
to which extent using different augmentation qualities on the same product would predict the
use intention. Indeed, managers do not need to conduct rigorous research to identify these
features since they have access to different metrics on VTO platforms, which will enable
insights extraction regarding which features would lead to more purchasing, intended use, or
in the context of social VTO, positive word-of-mouth. As a result, they could create a taxonomy
of features. Thanks to this latter, Marketers could draw the line between the entertainment and
purchasing context.
For example, if a beauty brand is launching a new collection and the aim of providing a virtual
fitting is to obtain insights about the most tried products or colour shades, then they should be
aware that the primary objective here is not to enhance purchase behaviour. In this case, they
could choose engaging hedonic constructs to make data collection more pleasing.
44
In fact, managers should constantly keep in mind the primary goal of the VTO before building
it. Accordingly, they will be able to efficiently leverage AR and adapt it to different settings in
the beauty industry and then clearly communicate their technical feature requirements to
developers.
4. Limitations and suggestions for further research
While these research findings provide future research with insightful managerial and academic
findings about VTO, they should be perceived with respect to certain limitations.
First, the context of the research did not provide significant results in regard to socialization
impact. Indeed, the paucity of knowledge in social VTO constituted a first obstacle towards
building the right theoretical framework as well as choosing the right variable to represent the
social dimension. In this vein, further research is called for concerning the social VTO topic
and its adapted social framework.
Regarding the experimental design, limited control was possible since both VTO solutions
were built externally and the only way to know if the participants eventually used the tool was
to ask about the product type. An optimal way to have more robust control is to test the
suppositions in an environment that offers more control.
Additionally, there was a slight difference between both conditions since the website VTO was
more easy to access than the VTO on social media, which required to follow the instructions.
In this vein, the participants were not assisted throughout the process, which explains the
difference between complete answers in both conditions. Accordingly, including ease of use in
future research could explain better the level of difficulty experienced with the tool in each
condition.
Also, the sampling method used was a convenience sampling, which is not recommended for
causal research because of its weak generalizability (Malhotra, 2017). Accordingly, the survey
45
was distributed on social media and primarily to female Instagram users who were students.
Future research could rely on a more diversified sample.
In this regard, they could have been already aware of the VTO’s existence, while the website
could have been a novel tool that participants were exploring for the first time. In this case, a
new factor could be at hand including past experience with the VTO. A question that could
have grasped this aspect. Also, the analysis revealed that there were external factors explaining
attitudes other than perceived enjoyment and perceived usefulness and a number of variables
could be studied to explore this matter. First, the negative constructs such as “irritation” to
understand to which extent the variable impacts attitudes, and especially in a social setting.
Second, other hedonic variables like “playfulness” could also be assessed for future research.
Finally, the attitude towards social media as a brand was not evaluated. Thus, it could have
been interesting to include it in the research to test if the social media choice would impact
perceptions.

46
Bibliography
Ahn, T., Seewon, R., Han, I., (2004). The impact of the online and offline features on the user
acceptance of Internet shopping malls. Electron. Commer. Res. Appl. 3 (4), 405–420
Ahuja, M., & Galvin, J. (2003). Socialization in Virtual Groups. Journal Of Management,
29(2), 161-185.
Ajzen, I. (1991). The theory of planned behavior. Organizational Behavior and Human
Decision Processes
Alben, L. (1996). Defining the criteria for effective interaction design. Interactions, 3(3)
Andrews, D., Nonnecke, B. and Preece, J. (2008), “Conducting research on the internet: online
survey design, development and implementation guidelines”, International Journal of Human-
Computer Interaction, Vol. 16 No. 2, pp. 185-210.
Ariely, D. (2000). Controlling the Information Flow: Effects on Consumers' Decision Making
and Preferences. Journal Of Consumer Research, 27(2), 233-248.
Azuma, R. T. (1997). A survey of augmented reality. Presence: Teleoperators and Virtual
Environments, 6(4), 355–385.
Azuma, R., Baillot, Y., Behringer, R., Feiner, S., Julier, S., & MacIntyre, B. (2001). Recent
advances in augmented reality. IEEE Computer Graphics and Applications.
Azuma, R., Baillot, Y., Behringer, R., Feiner, S., Julier, S., & MacIntyre, B. (2001). Recent
advances in augmented reality. IEEE Computer Graphics and Applications.
Baek, T.H., Yoo, C.Y., Yoon, S., (2018). Augment yourself through virtual mirror: the impact
of self-viewing and narcissism on consumer responses. Int. J. Advert. 37, 421–439.
Barnes, D., Collier, J., Howe, V., & Douglas Hoffman, K. (2016). Multiple paths to customer
delight: the impact of effort, expertise and tangibles on joy and surprise. Journal Of Services
Marketing, 30(3), 277-289.
Beck, M., & Crié, D. (2018). I virtually try it … I want it ! Virtual Fitting Room: A tool to
increase on-line and off-line exploratory behavior, patronage and purchase intentions. Journal
of Retailing and Consumer Services, 40(October 2016), 279–286.
47
Bethlehem, J. (2009). Applied survey methods: A statistical perspective.
Bounkhong, T., & Smith, K. R. (2017). Are Millennials Willing to Use Social Commerce in
Apparel Shopping ? International Textile and Apparel Association, June, 1–3.
Brodie, R. J., Ilic, A., Julic, B., & Hollebeek, L. (2013). Consumer engagement in a virtual
brand community: An exploratory analysis. Journal of Business Research, 66(1), 105—114.
Brooks, C., (1957). ‘Word-of-Mouth’ Advertising in Selling New Products’. The Journal of
Marketing, 22, 2, pp. 154-161.
Caboni, F., &Hagberg, J. (2019). Augmented reality in retailing: A review of features,
applications and value. International Journal of Retail & Distribution Management.
Centric Digital (2016). How Sephora is Revealing the Future of Augmented Reality in Fashion,
retrieved from: https://centricdigital.com/blog/augmented-reality/how-sephora-is-revealing-
the-future-of- augmented-reality-in-fashion
Cho, E., & Son, J. (2019). The effect of social connectedness on consumer adoption of social
commerce in apparel shopping. Fashion and Textiles, 6(1).
Cho, E., & Son, J. (2019). The effect of social connectedness on consumer adoption of social
commerce in apparel shopping. Fashion and Textiles, 6(1).
Chun, W., & Lee, J. (2016). Increasing individuals’ involvement and WOM intention on Social
Networking Sites: Content matters! Computers in Human Behavior.
Chylinski, M., Heller, J., Hilken, T., Keeling, D. I., Mahr, D., & de Ruyter, K. (2020).
Augmented reality marketing: A technology-enabled approach to situated customer
experience. Australasian Marketing Journal, 28(4), 374–384.
Chylinski, M., Heller, J., Hilken, T., Keeling, D. I., Mahr, D., & de Ruyter, K. (2020).
Augmented reality marketing: A technology-enabled approach to situated customer
experience. Australasian Marketing Journal, 28(4), 374–384.
Chylinski, M., Heller, J., Hilken, T., Keeling, D. I., Mahr, D., & de Ruyter, K. (2020).
Augmented reality marketing: A technology-enabled approach to situated customer
experience. Australasian Marketing Journal, 28(4), 374–384.
Coker, K., Boostrom Jr, R., & Altobello, S. (2014). What makes social shoppers click? The
role of social rewards in social shopping. Marketing Management Journal, 24(1).

48
Crespo, A.; Bosque, I. (2008) The Effect of Innovativeness on the Adoption of B2C E-
commerce: A Model Based on the Theory of Planned Behaviour. Computers in Human
Behavior, Vol. 24
Dacko, G. (2016), “Enabling smart retail settings via mobile augmented reality shopping apps”,
Technological Forecasting and SocialChange, Vol. 124, pp. 243-256.
Davis, F. D., Bagozzi, R. P. and Warshaw, P. R. (1992) Extrinsic and Intrinsic Motivation to
Use Computers in the Workplace. Journal of Applied Social Psychology.
DigitalBridge (2017). Augmented Reality: Changing the Face of Retail. Retrieved from:
http://digiralbridge.eu/download-our-newreport-augmented reality-changing-the-face-of-retail
(accessed
Feng, Y., & Mueller, B. (2019). The State of Augmented Reality Advertising Around The
Globe: A Multi-Cultural Content Analysis. Journal of Promotion Management, 25(4), 453–
475.
Fiore, M., Jin, J. and Kim, J. (2005), “For fun and profit: hedonic value from image interactivity
and responses toward an online store”, Psychology & Marketing, Vol. 22 No. 8, pp. 669-694.
Fishbein, M., & Ajzen, I. (1975). Belief, attitude, intention, and behavior: An introduction to
theory and research. Reading, MA: Addison-Wesley
Fishbein, M., & Ajzen, I. (1975). Belief, attitude, intention, and behavior: An introduction to
theory and research. Reading, MA: Addison-Wesley
Gartner (2017). Top 10 strategic technology trends for 2018. Retrieved from https://goo.
gl/Emkt37
George, D., & Mallery, M. (2010). SPSS for Windows Step by Step: A Simple Guide and
Reference, 17.0 update (10a ed.) Boston: Pearson.
Gershoff, A., & Johar, G. (2006). Do You Know Me? Consumer Calibration of Friends’
Knowledge. Journal of Consumer Research, 32(4), 496–503.
Global mobile augmented reality (AR) users 2024 | Statista. (2021). Retrieved from
https://www.statista.com/statistics/1098630/global-mobile-augmented-reality-ar-users
Greene, L. (2011). Next big trend: virtual fitting rooms”. Retrieved from:
www.ft.com/cms/s/2/57b1fea6-

49
Greeno, G. , 1994. Gibson’s affordances. Psychol. Rev. 101 (2), 336–342
Hackl, C., & Wolfe, S. (2017). Marketing new realities: An introduction to virtual reality and
augmented reality marketing, branding, and communications. Toronto: Meraki
Hair, F., Black, C., Babin, J. and Anderson, E. (2010) Multivariate Data Analysis. 7th Edition,
Pearson, New York
Hao Suan Samuel, L., Balaji, M., & Kok Wei, K. (2015). An Investigation of Online Shopping
Experience on Trust and Behavioral Intentions. Journal Of Internet Commerce, 14(2), 233-254.
Hilken, T., de Ruyter, K., Chylinski, M., Mahr, D., & Keeling, D. (2017). Augmenting the eye
of the beholder: exploring the strategic potential of augmented reality to enhance online service
experiences. Journal of The Academy Of Marketing Science, 45(6), 884-905. Statista (2019).
Competitive differentiator. https://www.statista.com/statistics/1076074/organizations-
customer-experience-competitive-differentiator-worldwide/
Hilken, T., de Ruyter, K., Chylinski, M., Mahr, D., & Keeling, D. (2017). Augmenting the eye
of the beholder: exploring the strategic potential of augmented reality to enhance online service
experiences. Journal Of The Academy Of Marketing Science.
Hilken, T., Heller, J., Chylinski, M., Keeling, D. I., Mahr, D., & de Ruyter, K. (2018). Making
omnichannel an augmented reality: The current and future state of the art. Journal of Research
in Interactive Marketing, 12(4), 509–523
Huang, L., Liao, S., (2015). A model of acceptance of augmented-reality interactive
technology: the moderating role of cognitive innovativeness. Electron. Commer. Res.
IDC (2021). Pandemic Temper Growth in AR/VR. Retrieved from
https://www.idc.com/getdoc.jsp?containerId=prEUR146720420
Javornik, A. (2016). It’s an illusion, but it looks real! Consumer affective, cognitive and
behavioural responses to augmented reality applications. Journal of Marketing Management,
Vol. 32 Nos 9/10, pp. 987-1011.
Kang, J., Shin, J., Ponto, K., (2020). How 3D virtual reality stores can shape con- sumer
purchase decisions: the roles of informativeness and playfulness. J. Inter- act. Mark. 49, 70–
85.

50
Kim, J. (2005). A SWOT analysis of the field of virtual reality rehabilitation and therapy.
Presence 14, 119–146. doi: 10.1162/1054746053967094
Kim, J., & Forsythe, S. (2008). Adoption of Virtual Try-on technology for online apparel
shopping. Journal of Interactive Marketing, 22(2), 45–59.
Kim, S. (2011). Web-interactivity dimensions and shopping experiential value. Journal of
Internet Business, No. 9, pp. 1-25.
L’Oréal Finance, (2021) “Annual Report 2019”, Retrieved from: https://www.loreal-
finance.com/fr
L’Oréal, (2021). Avec ModiFace, l’Oréal et Facebook intègrent l’essayage virtuel à l’achat sur
Instagram. Retrieved from: https://www.loreal.com/fr/press-release/research-and-
innovation/avec-modiface-loreal-et-facebook-integrent-lessayage-virtuel-a-lachat-sur-
instagram/
Lee, R., & Robbins, S. (1995). Measuring belongingness: The Social Connectedness and the
Social Assurance scales. Journal Of Counseling Psychology, 42(2), 232-241.
Lee, S.; Tan, J. (2003).E-retailing versus physical retailing: A theoretical model and empirical
test of consumer choice. Journal of Business Research, Vol. 56, No. 1.
Lemon, K. N., & Verhoef, P. C. (2016). Understanding customer experience throughout the
customer journey. Journal of Marketing, 80(6), 69–96.
Li, H., Daugherty, T., & Biocca, F. A. (2002). Impact of 3-D advertising on product knowledge,
brand attitude, and purchase intention: The mediating role of presence. Journal of Advertising,
31(3), 43–57.
Lin, Y. and Wang, M. (2015). The development of a clothing fit evaluation system under virtual
environment. Multimedia Tools & Applications, Vol. 75 No. 13, pp. 1-13.
Liu, W., Batra, R., Wang, H., (2017). Product touch and consumers’ online and offline buying:
the role of mental representation. J. Retail. 93 (3), 369–381.
Lombard, M., & Ditton, T. (2006). At the Heart of It All: The Concept of Presence. Journal Of
Computer-Mediated Communication, 3(2), 0-0.

51
LUEG, J., PONDER, N., BEATTY, S., & CAPELLA, M. (2006). Teenagers’ use of alternative
shopping channels: A consumer socialization perspective. Journal of Retailing, 82(2), 137–
153.
Malhotra, N. (2017). Marketing research an applied approach [Ebook] (6th ed.).
Milgram, P., Takemura, H., Utsumi, A., & Kishino, F. (1995). Augmented reality:A class of
displays on the reality-virtuality continuum. In Telemanipulator and telepresence technologies
(Vol. 2351, pp. 282-292). International Society for Optics and Photonics.
Moore, G.C. and Benbasat, I. (1991). Development of an instrument to measure the perceptions
of adopting an information technology innovation. Information Systems Research, Vol. 2 No.
3, pp. 192-222
Moschis; George, P.; Gilbert, A. Churchill Jr. (1978). Consumer Socialization: A Theoretical
and Empirical Analysis. Journal of Marketing Research, 15, 4, 599–609
Okazaki, S. (2009). The Tactical Use of Mobile Marketing: How Adolescents' Social
Networking Can Best Shape Brand Extensions. Journal Of Advertising Research, 49(1).
Olmedo, H. (2013). Virtuality continuuḿs state of the art. Procedia Computer Science.
Pachoulakis, I. and Kapetanakis, K. (2012). Augmented reality platforms for virtual fitting
rooms. International Journal of Multimedia & Its Applications, Vol. 4 No. 4, pp. 35-4
Pantano, E., Rese, A., & Baier, D. (2017). Enhancing the online decision-making process by
using augmented reality: A two country comparison of youth markets. Journal of Retailing and
Consumer Services, 38(April), 81–95.
Pantano, Eleonora and Rocco Servidio (2012). Modeling Innovative Points of Sales Through
Virtual and Immersive Technologies. Journal of Retailing and Consumer Services, 19, 3, 279–
86.
Poncin, I., Mimoun, M.(2014). The impact of “e-atmospherics” on physical stores. J. Retail.
Consum. Serv. 21 (5), 851–859
Porter, E., and Heppelmann E. (2017). Why Every Organization Needs an Augmented Reality
Strategy. Harvard Business Review, 95 (6), 46–57.

52
Poushneh, A. and Vasquez-Parraga, A.Z. (2017). Discernible impact of augmented reality on
retail customer’s experience, satisfaction and willingness to buy. Journal of Retailing and
Consumer Services, Vol. 34, pp. 229-234.
Rauschnabel, A., (2018). Virtually enhancing the real world with holograms: an ex- ploration
of expected gratifications of using augmented reality smart glasses. Psychol. Mark. 35 (8),
557–572
Rauschnabel, A., Felix, R.; Hinsch, C. (2019). Augmented reality marketing: How mobile AR-
apps can improve brands through inspiration. Journal of Retailing and Consumer Services,
49(March), 43–53.
Rauschnabel, P. A., Felix, R., & Hinsch, C. (2019). Augmented reality marketing: How mobile
AR-apps can improve brands through inspiration. Journal of Retailing and Consumer Services.
Rese, A., Schreiber, S. and Baier, D. (2014). Technology acceptance modeling of augmented
reality at the point of sale: can surveys be replaced by an analysis of online reviews?. Journal
ofRetailing and Consumer Services, Vol. 21 No. 5, pp. 869-876.
RetailDive, (2020) “Snapchat adds Perfect Corp.’s AR beauty testing”. Retrieved from:
https://www.retaildive.com/news/snapchat-adds-perfect-corps-ar-beauty-testing/592112/
Rheingold H. (1993). The virtual community: homesteading on the electronic frontier reading.
Massachusetts: Addison-Wesley.
Rogers, E. (1995). Diffusion of Innovations. 4th ed., New York: The Free Press
Romano, B., Sands, S., & Pallant, J. I. (2020). Augmented reality and the customer journey:
An exploratory study. Australasian Marketing Journal
Scholz, J., & Duffy, K. (2018). We ARe at home: How augmented reality reshapes mobile
marketing and consumer-brand relationships. Journal of Retailing and Consumer Services,
44,11–23.
Scholz, J., & Smith, A. N. (2016). Augmented reality: Designing immersive experiences that
maximize consumer engagement. Business Horizons, 59(2), 149–161.
Seidman, G. (2013). Self-presentation and belonging on Facebook: How personality in-
fluences social media use and motivations. Personality and Individual Differences, 54(3), 402–
407

53
Semin, R., & Smith, R. (2013). Socially situated cognition in per- spective. Social Cognition,
31(2), 125–146
SMD (2019), “Instagram AR ads”. Retrieved from
https://www.socialmediatoday.com/news/instagrams-now-testing-new-ar-try-on-ads-with-
selected-advertisers/564349/
Smink, R., van Reijmersdal, A., van Noort, G., & Neijens, C. (2020). Shopping in augmented
reality: The effects of spatial presence, personalization and intrusiveness on app and brand
responses. Journal of Business Research, 474–485.
Spreer, P., Kallweit, K., (2014). Augmented reality in retail: assessing the acceptance and
potential for multimedia product presentation at the PoS. Trans. Mark. Res. 1 (1).
Statista (2019), “Does your company view Customer Experience as a competitive
differentiator?”.Retrievedfrom: https://www.statista.com/statistics/1076074/organizations-
customer-experience-competitive-differentiator-worldwide/
Statista (2019). Statistics and facts on the cosmetics industry.
https://www.statista.com/topics/3137/cosmetics-industry/#topicHeader__wrapper
Statista (2021), “Instagram statistics and facts” Retrieved from:
https://www.statista.com/topics/1882/instagram/#topicHeader__wrapper
Statista (2021). Retail e-commerce sales worldwide from 2014 to 2024. Retrieved from:
https://www.statista.com/statistics/379046/worldwide-retail-e-commerce-sales/
Statista, (2021) “Statistics and facts on l’Oréal” Retrieved from:
https://www.statista.com/topics/1544/loreal/
Sung, E. (2021). The effects of augmented reality mobile app advertising: Viral marketing via
shared social experience. Journal of Business Research.
Sutherland, E., and Mead, A. (1997). Microelectronics and computer science. Scientific
American, vol. 237, pp. 210–228.
Tajeddini, K., & Nikdavoodi, J. (2014). Cosmetic buying behavior: examining the effective
factors. Journal of Global Scholars of Marketing Science, 24(4), 395–410.
Tajeddini, K.; Nikdavoodi, N. (2014). Cosmetic buying behavior: examining the effective
factors. Journal of Global Scholars of Marketing Science, 24(4), 395–410.

54
Temkin Group. (2017). “The ultimate CX Infographic”, available at:
https://experiencematters.blog/ 2017/10/03/the-ultimate-cx-infographic-2017/
Teo, T., Lim, V., & Lai, R. (1999). Intrinsic and extrinsic motivation in Internet usage. Omega,
27(1), 25-37.
Tom Dieck, C., Jung, T., 2018. A theoretical model of mobile augmented reality ac- ceptance
in urban heritage tourism. Curr. Issues Tour. 21 (2), 154–174
Venkatesh, V. and Bala, H. (2008). Technology Acceptance Model 3 and a Research Agenda
on Interventions. Decision Science, 39 (2), 273-312.
Verhoef, P., Neslin, A., & Vroomen, B. (2007). Multichannel customer management:
Understanding the research-shopper phenomenon. International Journal of Research in
Marketing, 24(2), 129– 148.
Wang, X., Yu, C., & Wei, Y. (2012). Social Media Peer Communication and Impacts on
Purchase Intentions: A Consumer Socialization Framework. Journal of Interactive Marketing,
26(4), 198–208.
Ward, S., (1974). Consumer Socialization. Journal of Consumer Research,1, 2, 1–14
Wedel, M., Bigné, E., & Zhang, J. (2020). Virtual and augmented reality: Advancing research
in consumer marketing. International Journal of Research in Marketing, 37(3).
Willems, K., Smolders, A., Brengman, M., Luyten, K., Schöning, J., (2017). The path-to-
purchase is paved with digital opportunities: an inventory of shopper-oriented retail
technologies. Technol. Forecast. Soc. Change 124, 228–242
Wolny, J.. Charoensuksai, N. (2014). Mapping customer journeys in multichannel decision-
making. Journal ofDirect, Data and Digital Marketing Practice, Vol. 15 No. 4, pp. 317-326
Yang, S., Carlson, J. R., & Chen, S. (2020). How augmented reality affects advertising
effectiveness: The mediating effects of curiosity and attention toward the ad. Journal of
Retailing and Consumer Services.
Yim, C., Chu, C., & Sauer, P. (2017). Is Augmented Reality Technology an Effective Tool for
E-commerce? An Interactivity and Vividness Perspective. Journal of Interactive Marketing,
39(January 2020), 89–103.

55
Yuen Y., Kogilah N., Cheng Y., Devinaga R., (2017). Consumer’s perception towards real-
time virtual fitting systems. Proceedings of the 6th International Conference of Computing &
Informatics (pp 311-316).
Zeithaml, A., Berry, L., & Parasuraman, A. (1996). The behavioral consequences of service
quality. Journal of Marketing, 60(2), 31–46.
Zhang, J., & Daugherty, T. (2009). Third‐Person Effect and Social Networking: Implications
for Online Marketing and Word‐of‐Mouth Communication. American Journal Of Business,
24(2), 53-64.
Zhang, T., Wang, W. Y. C., Cao, L., & Wang, Y. (2019). The role of virtual try-on technology
in online purchase decision from consumers’ aspect. Internet Research.
Zhang, T.; Wang, C., Cao, L.; Wang, Y. (2019). The role of virtual try-on technology in online
purchase decision from consumers’ aspect. Internet Research, 29(3), 529–551.
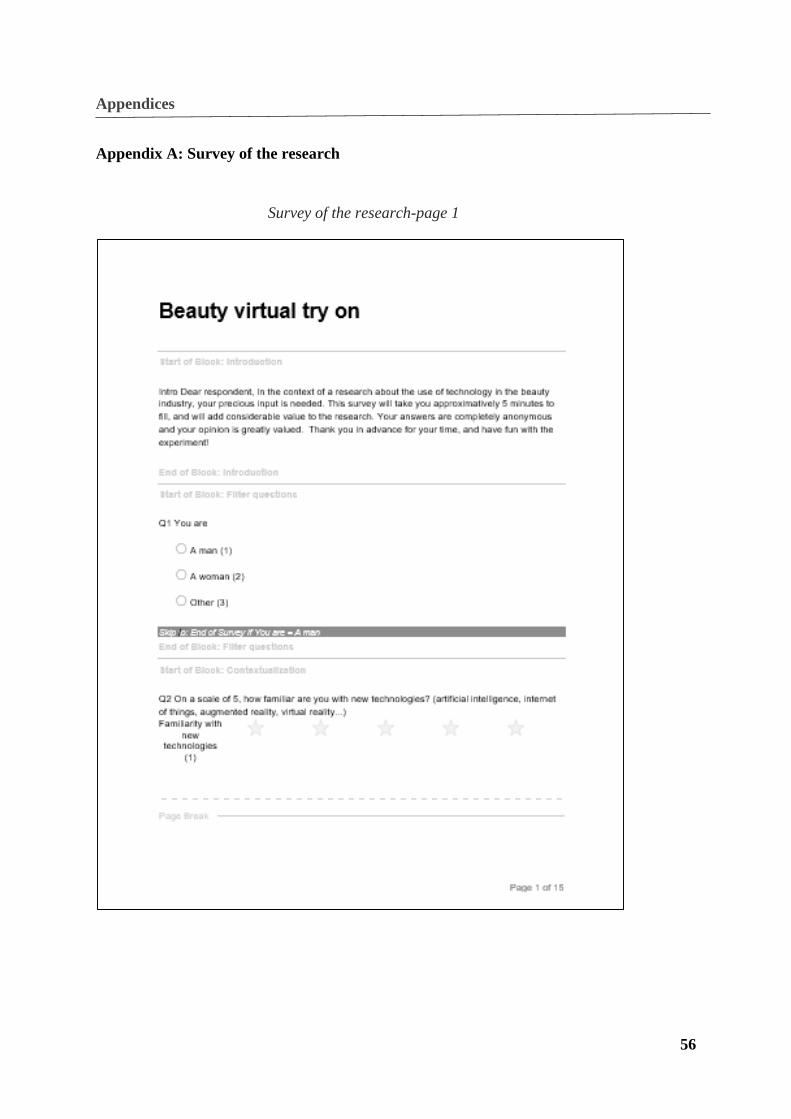
56
Appendices
Appendix A: Survey of the research
Survey of the research-page 1

57
Survey of the research-page 2

58
Survey of the research-page 3

59
Survey of the research-page 4

60
Survey of the research-page 5

61
Survey of the research-page 6

62
Survey of the research-page 7
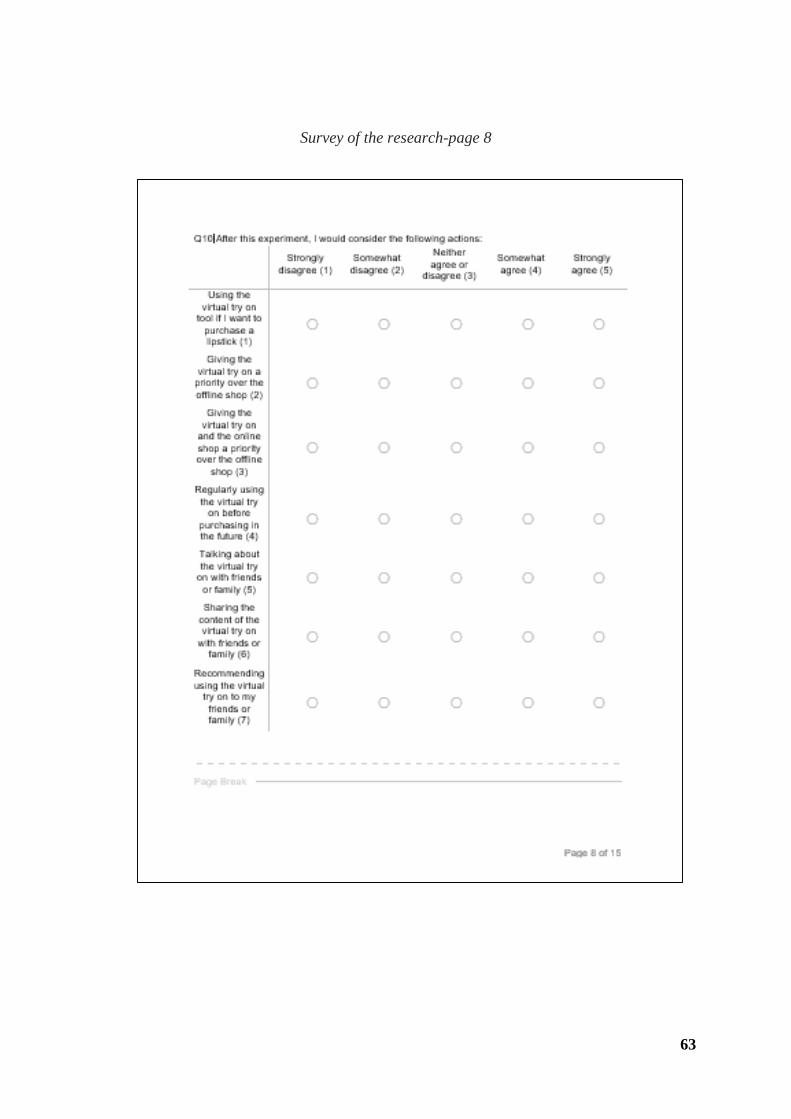
63
Survey of the research-page 8

64
Survey of the research-page 9
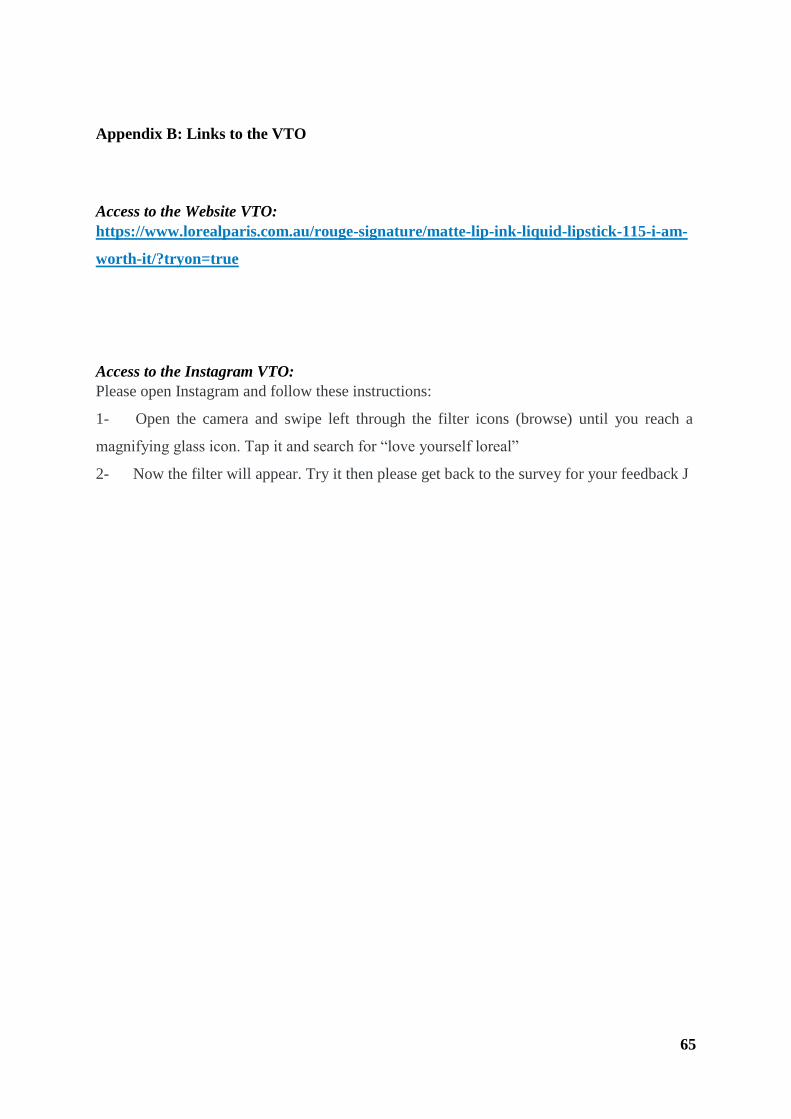
65
Appendix B: Links to the VTO
Access to the Website VTO:
https://www.lorealparis.com.au/rouge-signature/matte-lip-ink-liquid-lipstick-115-i-am-
worth-it/?tryon=true
Access to the Instagram VTO:
Please open Instagram and follow these instructions:
1- Open the camera and swipe left through the filter icons (browse) until you reach a
magnifying glass icon. Tap it and search for “love yourself loreal”
2- Now the filter will appear. Try it then please get back to the survey for your feedback J

66
Appendix C: Results of the Shapiro-Wilk test for scales normality
Scales Items Shapiro-Wilk
statistic
p-value
SOC soc1 0.87 <0.001
Soc2 0.88 <0.001
Soc3 0.86 <0.001
ENJ enj1 0.79 <0.001
enj2 0.81 <0.001
enj3 0.78 <0.001
enj4 0.83 <0.001
USE use1 0.85 <0.001
use2 0.82 <0.001
use3 0.76 <0.001
use4 0.84 <0.001
ATT att1 0.81 <0.001
att2 0.81 <0.001
att3 0.79 <0.001
att4 0.88 <0.001
att5 0.89 <0.001
UI ui1 0.89 <0.001
ui2 0.88 <0.001
ui3 0.87 <0.001
ui4 0.88 <0.001
WOM wom1 0.82 <0.001
wom2 0.82 <0.001
wom2 0.8 <0.001

67
Appendix D: Skewness and Kurtosis results
Scales Items Skewness Kurtosis
SOC soc1 -0.34 -1.15
Soc2 -0.79 -1.27
Soc3 -0.65 -0.6
ENJ enj1 -1.26 1.23
enj2 -0.78 -0.08
enj3 -1.15 1.53
enj4 -0.57 -0.51
USE use1 -0.851 0.01
use2 -0.96 0.42
use3 -0.87 -0.15
use4 -1.18 0.38
ATT att1 -0.85 0.32
att2 -0.66 0.40
att3 -0.51 -0.47
att4 -0.83 -0.25
att5 -0.73 -0.26
UI ui1 -0.58 -0.50
ui2 0.61 -1.24
ui3 -0.24 -1.35
ui4 -0.69 0.06
WOM wom1 -0.86 -0.29
wom2 -0.69 -0.83
wom2 -1.05 0.22

68
Appendix E: Confirmatory Factor Analysis results
Scales Items Factors loading
SOC soc1 0.802
soc2 0.82
soc3 0.78
ENJ enj1 0.6
enj2 0.55
enj3 0.55
enj4 0.64
US us1 0.74
us2 0.93
us3 0.93
us4 0.82
ATT att1 0.56
att2 0.73
att3 0.57
att4 0.63
att5 0.61
UI ui1 0.6
ui2 0.73
ui3 0.9
ui4 0.61
WOM wom1 0.62
wom2 0.81
wom2 0.65

69
Executive Summary
Thanks to the advance of new technologies, online retailing has continued to thrive in the last
decade. Hence, technologies like Augmented Reality (AR) revolutionized the customer
experience, particularly the Virtual-Try-On technology (VTO). This latter remarkably filled
the need for trying the product that the online context always failed to provide. As a result, the
online purchasing experience became seamless. Although VTO is still in its infancy in
consumer markets, it is becoming more common thanks to social media which enabled brands
to integrate VTO into their platforms. However, there is paucity of knowledge about social
VTO. Also, the beauty industry is one of the precursors of VTO adoption in retailing.
Nevertheless, a few studies investigated VTO impact on attitudes and behavioural intentions
in this context.
First, this research examines the influence of socialization in VTO, on both perceptions and
attitudes. Later, the study investigates the general impact of attitudes towards the VTO on
behavioural intentions. The study was based on an experimental design where no significant
link was demonstrated between VTO condition (social vs non-social) and the utilitarian and
hedonic constructs of technology (perceived usefulness and perceived enjoyment). Further, the
study confirmed previous positive links between attitudes towards the technology and
behavioural intentions in the beauty industry. Lastly, the paper provided insights for further
research and the resulting implications.
Keywords:
Virtual-Try-On, Socialization, Utilitarian, Hedonic, Attitude towards VTO, Behavioural
Intentions