beating the odds high-achieving schools serving …...outstanding educational performance awards...
TRANSCRIPT
ARKANSAS EDUCATION REPORT Volume 11, Issue 5
OUTSTANDING EDUCATIONAL PERFORMANCE AWARDS: HIGHLIGHTING HIGH-ACHIEVING ARKANSAS SCHOOLS, 2014
BEATING THE ODDS – HIGH-ACHIEVING SCHOOLS SERVING
LOW-INCOME COMMUNITIES
November 19, 2014
By:
Charlene A. Reid Gary W. Ritter
Office for Education Policy University of Arkansas
211 Graduate Education Building Fayetteville, AR 72701 Phone: (479) 575-3773
Fax: (479) 575-3196 E-mail: [email protected]

Outstanding Educational Performance Awards 2014 Page i
TABLE OF CONTENTS
INTRODUCTION .......................................................................................................................... ii
V. 2014 OEP AWARDS: BEATING THE ODDS – HIGH ACHIEVING SCHOOLS SERVING LOW–
INCOME COMMUNITIES ............................................................................................................ 84
V. Benchmark Math, 2014 .................................................................................................. 85
W. Benchmark Literacy, 2014 ............................................................................................ 93
X. Algebra End-of-Course Exam, 2014 ............................................................................ 100
Y. Geometry End-of-Course, 2014.................................................................................... 110
Z. Biology End-of-Course Exam, 2014 ............................................................................. 115
AA. Grade 11 Literacy End-of-Course Exam, 2014......................................................... 120
Appendix ............................................................................................................................... 124

Outstanding Educational Performance Awards 2014 Page ii
INTRODUCTION Since our founding in 2003, the mission of the Office for Education Policy has been looking at
pressing issues through the lens of academic research and disseminating our findings to
educators, policymakers, and other stakeholders around Arkansas. Every once in a while,
however, we think it is okay to stray from issue analysis and simply share some good news!
In this Arkansas Education Report (AER), we aim to highlight excellent performance and offer
our congratulations. To that end, we are happy to highlight many excellent schools around the
state in our now-annual AER, entitled the Outstanding Educational Performance Awards, or the
OEP awards.
Over a three month period this fall, a new set of OEP Awards will be released every couple of
weeks to highlight high-performing schools in Arkansas on the Benchmark exam in math and
literacy, and End-Of-Course (EOC) exams in Algebra, Geometry, Literacy (Grade 11), and
Biology.
Two years ago, we first introduced an academic performance indicator, the “GPA” rating
system, to rank the highest-performing schools. In the past, the rankings were created based on
the percentage of students scoring at the proficient or advanced level on each assessment.
Generally, when discussing academic achievement on the Benchmark exams, policymakers
focus on this figure. However, the proficiency indicator suffers from being an “all-or-nothing”
measure, in which a student is either proficient or not.
The proficiency measure disregards real information provided by student scores that are placed
into the four different performance categories: below basic, basic, proficient, and advanced.
Additionally, this mark does not differentiate between a school in which 100% of students score
proficient and a school in which 100% of students score advanced. Both of these schools would
show 100% of students performing at proficient and advanced levels; however, in the latter
school, students actually performed at a significantly higher level. Thus, a slightly more
informative indicator gives the most credit to students who score at the advanced level and the
least credit to students who score at the below basic level. For such purposes, we have created
the “GPA” rating system. In this GPA measure, parallel to the familiar grade point average for
individual students, we treat the Benchmark test scores in a similar way, whereby a 4.0 is a
perfect score.
Category GPA Points Awarded
Advanced 4.0
Proficient 3.0
Basic 2.0
Below Basic 1.0
The GPA measure, we believe, is a better representation of student achievement on statewide
standardized exams. In this report, we are presenting a list of the top 25 schools in each area. In
some cases, these "top 25 lists" will contain more than 25 schools as some schools' GPA scores
will be identical. This is not a new phenomenon, as we also exceeded 25 schools in previous

Outstanding Educational Performance Awards 2014 Page iii
reports when using the percent proficient and advanced metric as an indicator for student
achievement; however, there are fewer ties using the more precise GPA measure.
After we present our overall snapshot of high-performing schools, we will release subsequent
reports every few weeks focusing on different subsets of schools. In the following weeks, we
will focus on high-performing elementary schools, middle schools, and high schools in the
various regions across the state. Then, we will feature schools that are beating the odds (that is,
schools that have high levels of student achievement while serving a high percentage of low-
income students). Finally, we will conclude our report by focusing on the schools with the
greatest improvement in test scores. Our release schedule is:
High-Achieving “Overall” Schools in Arkansas
High-Achieving Elementary Schools
High-Achieving Middle Schools
High-Achieving High Schools
Beating the Odds: High-Achieving Schools Serving Low-Income Communities
Most Improved Schools
Stay tuned over the next ten weeks to see which schools in your area are recognized for our OEP
Awards!

Outstanding Educational Performance Awards 2014 Page 84
V. 2014 OEP AWARDS: BEATING THE ODDS – HIGH ACHIEVING
SCHOOLS SERVING LOW–INCOME COMMUNITIES This section highlights high-achieving schools across Arkansas based on Benchmark
examinations in Math and Literacy and the End-of-Course (EOC) examinations in Algebra,
Geometry, Biology and Grade 11 Literacy from the 2013-14 academic year1. For these awards,
we consider schools that serve free and reduced lunch to at least 66% of the student body.
This section is divided into subsections based the four exams. Schools are ranked using the GPA
performance measure (explained in the Introduction) in each subject. Because the exams are not
“grade-specific,” schools in each of the subsections are categorized differently to account for
school performance based on grade levels served; this is explained further in the introduction text
in each subsection. Furthermore, each subsection includes the top schools, the top “high-
poverty” schools, and the top five schools by region2. In the subsections, the tables present the
high-achieving schools for the noted category and subject using the GPA performance measure.
These tables include the region in which the school is located, the number of test takers, the
percentage of students scoring at the proficient and advanced levels, and the GPA of the school
in that particular subject.
1 The Algebra, Biology, and Geometry EOC exams are given twice annually: in January and again in April. The
Grade 11 Literacy Exam is administered in March. 2 Schools are divided into five regions in Arkansas: Northwest (NW), Northeast (NE), Central (CN), Southwest
(SW), and Southeast (SE).

Outstanding Educational Performance Awards 2014 Page 85
V. Benchmark Math, 2014
Table 100: Top 10 Arkansas “High-Poverty” Elementary Schools based on Benchmark Math
Achievement
School (District) %FRL Region Grades
Served
# of
Test
Takers
%
Proficient/
Advanced
GPA
1 Cowsert Elementary School
(Clinton)
74% NW K-3 107 94% 3.63
1 Eagle Heights Elementary School (Harrison)
74% NW K-4 69 93% 3.63
1 Green Forest Elementary
School (Green Forest)
86% NW K-3 82 92% 3.63
1 Richland Elementary School
(West Memphis)
100% NE K-6 306 96% 3.63
5 Salem Elementary School
(Salem)
67% NE K-6 225 94% 3.62
6 Dardanelle Primary School
(Dardanelle)
79% NW K-3 138 91% 3.57
7 Des Arc Elementary School (Des Arc)
76% SE P-6 152 92% 3.54
7 Eastside Elementary School
(Rogers)
71% NW K-5 284 94% 3.54
9 Centerpoint Primary School (Centerpoint)
69% SW P-3 70 93% 3.53
10 De Queen Elementary School
(DeQueen)
80% SW 3-5 521 92% 3.52

Outstanding Educational Performance Awards 2014 Page 86
Table 101: Top 10 Arkansas “High-Poverty” Middle Schools based on Benchmark Math
Achievement
School (District) %FRL Region Grades
Served
# of
Test
Takers
%
Proficient/
Advanced
GPA
1 De Queen Middle School
(DeQueen)
76% SW 6-7 374 82% 3.28
2 Marshall High School (Searcy County)
68% NW 7-12 138 85% 3.22
3 Helen Tyson Middle School
(Springdale)
72% NW 6-7 689 79% 3.19
4 J. O. Kelly Middle School
(Springdale)
87% NW 6-7 643 80% 3.16
5 Nettleton Middle School (Nettleton)
67% NE 6-6 228 78% 3.14
6 Nashville Elementary
School (Nashville)
69% SW 4-6 428 80% 3.12
7 Clinton Intermediate School (Clinton)
74% NW 4-6 318 77% 3.11
8 Dardanelle Middle School
(Dardanelle)
70% NW 7-8 279 79% 3.10
8 Mena Middle School
(Mena)
66% SW 6-8 380 76% 3.10
10 Bradley High School (Emerson-Taylor)
76% SW 7-12 62 76% 3.09

Outstanding Educational Performance Awards 2014 Page 87
Tables 102-106: Top 5 Improved “High Poverty” Elementary Schools in Arkansas by Region,
Benchmark Math Achievement
Table 102: Top 5”High Poverty” Elementary Schools in Northwest Arkansas Based
on Benchmark Math
School (District) % FRL Grades
Served
# of Test
Takers
%
Proficient/
Advanced
GPA
1 Cowsert Elementary School
(Clinton)
74% K-3 107 94% 3.63
1 Eagle Heights Elementary School
(Harrison)
74% K-4 69 93% 3.63
1 Green Forest Elementary School
(Green Forest)
86% K-3 82 92% 3.63
4 Dardanelle Primary School
(Dardanelle)
79% K-3 138 91% 3.57
5 Eastside Elementary School (Rogers)
71% K-5 284 94% 3.54
Table 103: Top 5”High Poverty” Elementary Schools in Northeast Arkansas Based
on Benchmark Math
School (District) % FRL Grades
Served
# of Test
Takers
%
Proficient/
Advanced
GPA
1 Richland Elementary School
(West Memphis)
100% K-6 306 96% 3.63
2 Salem Elementary School (Salem)
67% K-6 225 94% 3.62
3 Mammoth Spring Elementary School
(Mammoth Spring)
66% K-6 146 90% 3.48
4 Cave City Elementary School
(Cave City)
75% K-4 164 83% 3.40
5 Mountain View Elementary School (Mountain View)
73% P-4 185 88% 3.39
5 Weiner Elementary School
(Harrisburg)
68% K-6 49 89% 3.39

Outstanding Educational Performance Awards 2014 Page 88
Table 104: Top 5 “High Poverty” Elementary Schools in Central Arkansas Based on
Benchmark Math
School (District) % FRL Grades
Served
# of Test
Takers
%
Proficient/
Advanced
GPA
1 Fountain Lake Elementary School
(Fountain Lake)
68% K-4 183 87% 3.41
2 Oaklawn Magnet School (Hot Springs)
80% K-4 232 86% 3.40
3 Ida Burns Elementary School
(Conway)
74% K-4 175 85% 3.36
4 Florence Mattison Elementary School (Conway)
74% K-4 155 84% 3.34
5 Theodore Jones Elementary School
(Conway)
78% K-4 137 86% 3.30
Table 105: Top 5”High Poverty” Elementary Schools in Southwest Arkansas Based
on Benchmark Math
School (District) % FRL Grades
Served
# of Test
Takers
%
Proficient/
Advanced
GPA
1 Centerpoint Primary School
(Centerpoint)
69% P-3 70 93% 3.53
2 De Queen Elementary School
(DeQueen)
80% 3-5 521 92% 3.52
3 Ode Maddox Elementary School (Ouachita River)
83% K-6 37 92% 3.38
4 Van-Cove Elementary School
(Cossatot River)
77% P-6 132 87% 3.37
5 Nashville Primary School (Nashville)
73% K-3 136 81% 3.34

Outstanding Educational Performance Awards 2014 Page 89
Table 106: Top 5 “High Poverty” Elementary Schools in Southeast Arkansas Based
on Benchmark Math
School (District) % FRL Grades
Served
# of Test
Takers
%
Proficient/
Advanced
GPA
1 Des Arc Elementary School
(Des Arc)
76% P-6 152 92% 3.54
2 Marvell-Elaine Elementary School
(Marvell)
98% P-5 96 85% 3.34
3 Crossett Elementary School (Crossett)
69% P-4 268 80% 3.26
4 Drew Central Elementary School
(Drew Central)
79% K-4 119 79% 3.23
5 DeWitt Elementary School (DeWitt)
71% K-5 221 79% 3.18

Outstanding Educational Performance Awards 2014 Page 90
Tables 107-111: Top 5 Improved “High Poverty” Middle Schools in Arkansas by Region,
Benchmark Math Achievement
Table 107: Top 5”High Poverty” Middle Schools in Northwest Arkansas Based on
Benchmark Math
School (District) % FRL Grades
Served
# of Test
Takers
%
Proficient/
Advanced
GPA
1 Marshall High School
(Searcy County)
68% 7-12 138 85% 3.22
2 Helen Tyson Middle School (Springdale)
72% 6-7 689 79% 3.19
3 J. O. Kelly Middle School
(Springdale)
87% 6-7 643 80% 3.16
4 Clinton Intermediate School (Clinton)
74% 4-6 318 77% 3.11
5 Dardanelle Middle School
(Dardanelle)
70% 7-8 279 79% 3.10
Table 108: Top 5”High Poverty” Middle Schools in Northeast Arkansas Based on
Benchmark Math
School (District) % FRL Grades
Served
# of Test
Takers
%
Proficient/
Advanced
GPA
1 Nettleton Middle School
(Nettleton)
67% 6-6 228 78% 3.14
2 West Junior High School (West Memphis)
100% 7-9 285 78% 3.01
3 Newport Junior High School
(Newport)
82% 7-8 185 75% 2.93
4 Swifton Middle School (Jackson County)
69% 5-7 183 67% 2.89
5 Timbo High School
(Mountain View)
81% 7-12 42 64% 2.88

Outstanding Educational Performance Awards 2014 Page 91
Table 109: Top 5 “High Poverty” Middle Schools in Central Arkansas Based on
Benchmark Math
School (District) % FRL Grades
Served
# of Test
Takers
%
Proficient/
Advanced
GPA
1 Bismarck Middle School
(Bismarck)
67% 5-8 298 76% 2.99
2 Jessieville Middle School
(Jessieville)
71% 6-8 213 72% 2.94
3 Hot Springs Intermediate School
(Hot Springs)
82% 5-6 511 71% 2.91
4 Wilson Intermediate School
(Malvern)
72% 5-6 309 66% 2.75
5 Jacksonville Lighthouse Middle (Jacksonville Lighthouse Charter School)
66% 5-8 204 64% 2.69
Table 110: Top 5”High Poverty” Middle Schools in Southwest Arkansas Based on
Benchmark Math
School (District) % FRL Grades
Served
# of Test
Takers
%
Proficient/
Advanced
GPA
1 De Queen Middle School
(DeQueen)
76% 6-7 374 82% 3.28
2 Nashville Elementary School (Nashville)
69% 4-6 428 80% 3.12
3 Mena Middle School
(Mena)
66% 6-8 380 76% 3.10
4 Bradley High School (Emerson-Taylor)
76% 7-12 62 76% 3.09
5 McRae Middle School
(Prescott)
73% 5-6 143 75% 3.08

Outstanding Educational Performance Awards 2014 Page 92
Table 111: Top 5 “High Poverty” Middle Schools in Southeast Arkansas Based on
Benchmark Math
School (District) % FRL Grades
Served
# of Test
Takers
%
Proficient/
Advanced
GPA
1 Drew Central Middle School
(Drew Central)
74% 5-8 309 65% 2.81
2 Hermitage High School (Hermitage)
75% 7-12 72 67% 2.78
3 Warren Middle School
(Warren)
77% 6-8 378 64% 2.71
4 KIPP Delta College Preparatory
School (KIPP Delta Public Schools)
92% 5-8 301 63% 2.69
5 KIPP Blytheville College Preparatory
School (KIPP Delta Public Schools)
80% 5-8 278 54% 2.60

Outstanding Educational Performance Awards 2014 Page 93
W. Benchmark Literacy, 2014
Table 112: Top 10 Arkansas “High-Poverty” Elementary Schools based on Benchmark Literacy
Achievement
School (District) % FRL Region Grades
Served
# of Test
Takers
%
Proficient/
Advanced
GPA
1 Eastside Elementary School (Rogers)
71% NW K-5 284 97% 3.68
2 Richland Elementary School
(West Memphis)
100% NE K-6 306 95% 3.65
3 Eagle Heights Elementary
School (Harrison)
74% NW K-4 69 91% 3.63
3 Salem Elementary School
(Salem)
67% NE K-6 225 93% 3.63
5 Dover Elementary School
(Dover)
66% NW K-5 300 93% 3.55
6 Fountain Lake Elementary School (Fountain Lake)
68% CN K-4 183 89% 3.50
6 Frank Tillery Elementary
School (Rogers)
78% NW K-5 286 92% 3.50
6 John Tyson Elementary
School (Springdale)
71% NW K-5 263 91% 3.50
6 Mammoth Spring Elementary
School (Mammoth Spring)
66% NE K-6 146 90% 3.50
10 Marshall Elementary School
(Searcy County)
78% NW K-4 109 87% 3.46

Outstanding Educational Performance Awards 2014 Page 94
Table 113: Top 10 Arkansas “High-Poverty” Middle Schools based on Benchmark Literacy
Achievement
School (District) %FRL Region Grades
Served
# of Test
Takers
%
Proficient/
Advanced
GPA
1 Norfork High School (Norfork)
80% 1 7-12 83 93% 3.40
2 Marshall High School
(Searcy County)
68% 1 7-12 138 86% 3.34
3 Jasper High School
(Jasper)
69% 1 7-12 71 86% 3.31
4 Booneville Junior High School (Booneville)
66% 1 7-9 202 87% 3.28
4 Omaha High School
(Omaha)
71% 1 7-12 60 85% 3.28
6 Clinton Intermediate School (Clinton)
74% 1 4-6 318 84% 3.27
7 Bruno-Pyatt High School
(Ozark Mountain)
75% 1 7-12 27 92% 3.26
7 McRae Middle School
(Prescott)
73% 4 5-6 143 85% 3.26
9 Bradford High School (Bradford)
74% 2 7-12 72 85% 3.25
9 Foreman High School
(Foreman)
67% 4 7-12 81 85% 3.25

Outstanding Educational Performance Awards 2014 Page 95
Tables 114-118: Top 5 Improved “High Poverty” Elementary Schools in Arkansas by Region,
Benchmark Literacy Achievement
Table 114: Top 5”High Poverty” Elementary Schools in Northwest Arkansas Based
on Benchmark Literacy
School (District) % FRL Grades
Served
# of Test
Takers
%
Proficient/
Advanced
GPA
1 Eastside Elementary School (Rogers)
71% K-5 284 97% 3.68
2 Eagle Heights Elementary School
(Harrison)
74% K-4 69 91% 3.63
3 Dover Elementary School
(Dover)
66% K-5 300 93% 3.55
4 Frank Tillery Elementary School
(Rogers)
78% K-5 286 92% 3.50
4 John Tyson Elementary School
(Springdale)
71% K-5 263 91% 3.50
Table 115: Top 5”High Poverty” Elementary Schools in Northeast Arkansas Based
on Benchmark Literacy
School (District) % FRL Grades
Served
# of Test
Takers
%
Proficient/
Advanced
GPA
1 Richland Elementary School (West Memphis)
100% K-6 306 95% 3.65
2 Salem Elementary School
(Salem)
67% K-6 225 93% 3.63
3 Mammoth Spring Elementary
School (Mammoth Spring)
66% K-6 146 90% 3.50
4 Weiner Elementary School
(Harrisburg)
68% K-6 49 90% 3.46
5 Riverside West Elementary
School (Riverside)
66% K-6 135 88% 3.42

Outstanding Educational Performance Awards 2014 Page 96
Table 116: Top 5 “High Poverty” Elementary Schools in Central Arkansas Based on
Benchmark Literacy
School (District) % FRL Grades
Served
# of Test
Takers
%
Proficient/
Advanced
GPA
1 Fountain Lake Elementary School
(Fountain Lake)
68% K-4 183 89% 3.50
2 College Station Elementary School (Pulaski County Special)
76% P-5 137 85% 3.45
3 Theodore Jones Elementary School
(Conway)
78% K-4 137 90% 3.40
4 Florence Mattison Elementary School (Conway)
74% K-4 155 86% 3.38
4 Oaklawn Magnet School
(Hot Springs)
80% K-4 232 86% 3.38
Table 117: Top 5”High Poverty” Elementary Schools in Southwest Arkansas Based
on Benchmark Literacy
School (District) % FRL Grades
Served
# of Test
Takers
%
Proficient/
Advanced
GPA
1 De Queen Elementary School
(DeQueen)
80% 3-5 521 89% 3.45
2 Prescott Elementary School
(Prescott)
78% K-4 152 89% 3.42
3 Caddo Hills Elementary School
(Caddo Hills)
82% K-6 157 90% 3.39
4 Nashville Primary School
(Nashville)
73% K-3 136 84% 3.38
5 Van-Cove Elementary School (Cossatot River)
77% P-6 132 86% 3.36

Outstanding Educational Performance Awards 2014 Page 97
Table 118: Top 5 “High Poverty” Elementary Schools in Southeast Arkansas Based
on Benchmark Literacy
School (District) %
FRL
Grades
Served
# of Test
Takers
%
Proficient/
Advanced
GPA
1 Des Arc Elementary School
(Des Arc)
76% P-6 152 89% 3.40
2 DeWitt Elementary School
(DeWitt)
71% K-5 221 82% 3.27
3 Barton Elementary School
(Barton-Lexa)
80% K-6 232 84% 3.24
4 Brunson New Vision Charter School (Warren)
71% 4-5 232 81% 3.21
4 Drew Central Elementary School
(Drew Central)
79% K-4 119 83% 3.21
Tables 119-123: Top 5 Improved “High Poverty” Middle Schools in Arkansas by Region,
Benchmark Literacy Achievement
Table 119: Top 5”High Poverty” Middle Schools in Northwest Arkansas Based on
Benchmark Literacy
School (District) % FRL Grades
Served
# of Test
Takers
%
Proficient/
Advanced
GPA
1 Norfork High School
(Norfork)
80% 7-12 83 93% 3.40
2 Marshall High School
(Searcy County)
68% 7-12 138 86% 3.34
3 Jasper High School (Jasper)
69% 7-12 71 86% 3.31
4 Booneville Junior High School
(Booneville)
66% 7-9 202 87% 3.28
4 Omaha High School (Omaha)
71% 7-12 60 85% 3.28

Outstanding Educational Performance Awards 2014 Page 98
Table 120: Top 5”High Poverty” Middle Schools in Northeast Arkansas Based on
Benchmark Literacy
School (District) % FRL Grades
Served
# of Test
Takers
%
Proficient/
Advanced
GPA
1 Bradford High School (Bradford)
74% 7-12 72 85% 3.25
2 West Junior High School
(West Memphis)
100% 7-9 285 81% 3.20
3 Timbo High School
(Mountain View)
81% 7-12 42 74% 3.18
4 Cave City Middle School
(Cave City)
72% 7-8 174 83% 3.17
5 Black Rock High School
(Lawrence County)
72% 7-12 31 81% 3.16
Table 121: Top 5 “High Poverty” Middle Schools in Central Arkansas Based on
Benchmark Literacy
School (District) % FRL Grades
Served
# of Test
Takers
%
Proficient/
Advanced
GPA
1 Bismarck Middle School
(Bismarck)
67% 5-8 298 81% 3.22
2 Jessieville Middle School (Jessieville)
71% 6-8 213 75% 3.03
3 Wilson Intermediate School
(Malvern)
72% 5-6 309 73% 2.96
4 Hot Springs Intermediate School
(Hot Springs)
82% 5-6 511 69% 2.94
5 Jacksonville Lighthouse Middle (Jacksonville Lighthouse Charter
School)
66% 5-8 204 70% 2.86
5 Mountain Pine High School
(Mountain Pine)
73% 7-12 91 69% 2.86

Outstanding Educational Performance Awards 2014 Page 99
Table 122: Top 5”High Poverty” Middle Schools in Southwest Arkansas Based on
Benchmark Literacy
School (District) % FRL Grades
Served
# of Test
Takers
%
Proficient/
Advanced
GPA
1 McRae Middle School
(Prescott)
73% 5-6 143 85% 3.26
2 Foreman High School (Foreman)
67% 7-12 81 85% 3.25
3 Bradley High School
(Emerson-Taylor)
76% 7-12 62 77% 3.21
4 Nashville Elementary School (Nashville)
69% 4-6 428 79% 3.16
5 Horatio High School
(Horatio)
69% 7-12 115 83% 3.14
Table 123: Top 5 “High Poverty” Middle Schools in Southeast Arkansas Based on
Benchmark Literacy
School (District) %
FRL
Grades
Served
# of Test
Takers
%
Proficient/
Advanced
GPA
1 KIPP Delta College Preparatory
School (KIPP Delta Public Schools)
92% 5-8 301 81% 3.14
2 Drew Central Middle School (Drew Central)
74% 5-8 309 72% 2.98
3 KIPP Blytheville College Preparatory
School (KIPP Delta Public Schools)
80% 5-8 278 72% 2.96
3 Warren Middle School (Warren)
77% 6-8 378 69% 2.96
5 Barton High School
(Barton-Lexa)
71% 7-12 141 75% 2.92

Outstanding Educational Performance Awards 2014 Page 100
X. Algebra End-of-Course Exam, 2014
Algebra is generally taken during the ninth grade; however, some students may elect to take this
course earlier if they have taken prerequisite classes. Thus, most advanced students take the
course and the test in the 7th or 8th grade. Because of the likely academic differences between
students who take algebra in the 8th and 9th grades, middle and junior high schools tend to have
higher proficiency levels than do schools which serve 9th grade students. Due to these
differences, these awards are split into three categories:
High School (schools that serve 9th grade and above)
Junior High and Comprehensive High School (schools that serve 8th and 9th grade)
Middle School (schools that serve 8th grade and below)
For the purposes of this report, all school types (high schools, junior high and comprehensive
high schools, middle schools) were considered for the “High-Poverty”3 awards and the awards
by region.
3 “High-Poverty” schools have 66% or more students receiving a free or reduced lunch (FRL) in the grades they
serve.

Outstanding Educational Performance Awards 2014 Page 101
Table 124: Top 10 Arkansas “High-Poverty” High Schools4 Based on EOC Algebra
Achievement
School (District) %FRL Region Grades
Served
# of Test
Takers
%
Proficient/
Advanced
GP
A
1 Marked Tree High School
(Marked Tree)
85% NE 9-12 41 85% 3.36
2 Green Forest High School
(Green Forest)
84% NW 9-12 89 84% 3.15
3 Drew Central High School
(Drew Central)
81% SE 9-12 40 81% 3.11
4 Cedarville High School
(Cedarville)
83% NW 9-12 67 83% 3.06
5 Newport High School
(Newport)
71% NE 9-12 66 71% 2.92
6 Warren High School
(Warren)
70% SE 9-12 100 70% 2.91
7 Palestine-Wheatley Senior High
(Palestine/Wheatley)
74% NE 9-12 54 74% 2.87
8 Harrisburg High School
(Harrisburg)
68% NE 9-12 86 68% 2.79
8 KIPP Delta Collegiate High
School
(KIPP Delta Public Schools)
63% SE 9-12 33 63% 2.79
10 Lakeside High School (Lakeside Chicot County)
65% SE 9-12 58 65% 2.77
♦ Indicates school placed on same list in 2013-14.
4 A school was designated High School if it served students in the 9th grade and did not serve 8th grade students.

Outstanding Educational Performance Awards 2014 Page 102
Table 125: Top 10 “High Poverty” Arkansas Junior High Schools and Comprehensive High
Schools 5 Based on EOC Algebra Achievement
School (District) % FRL Region Grades
Served
# of Test
Takers
%
Proficient/
Advanced
GPA
1 Marshall High School
(Searcy County)
68% NW 7-12 40 100% 3.66
2 Mount Ida High School (Mount Ida)
69% SW 7-12 35 86% 3.43
3 Clarksville Junior High School
(Clarksville)
72% NW 7-9 133 91% 3.40
4 Westside High School
(Westside)
100% NW 7-12 40 88% 3.30
5 Caddo Hills High School
(Caddo Hills)
73% SW 7-12 45 89% 3.27
5 Horatio High School
(Horatio)
69% SW 7-12 61 85% 3.27
7 Centerpoint High School (Centerpoint)
66% SW 6-12 62 89% 3.25
7 Foreman High School
(Foreman)
67% SW 7-12 45 80% 3.25
9 DeQueen Junior High
(DeQueen)
71% SW 8-9 112 86% 3.24
10 Shirley High School
(Shirley)
72% NW 7-12 31 81% 3.20
5 A school was designated a Junior High School or Comprehensive High School if it serves students in 8th and 9th
grades.

Outstanding Educational Performance Awards 2014 Page 103
Table 126: Top 10 “High-Poverty” Middle Schools6 Based on EOC Algebra Achievement
School (District) %FRL Region Grades
Served
# of Test
Takers
%
Proficient/
Advanced
GPA
1 Bismarck Middle School (Bismarck)
67% CN 5-8 21 100% 3.95
2 Mena Middle School
(Mena)
66% SW 6-8 22 100% 3.91
2 Newport Junior High School
(Newport)
82% NE 7-8 11 100% 3.91
4 Malvern Middle School
(Malvern)
66% CN 7-8 20 100% 3.90
5 Blytheville Middle School
(Blytheville)
83% NE 6-8 19 100% 3.84
6 Dardanelle Middle School
(Dardanelle)
70% NW 7-8 17 100% 3.82
7 Oakdale Middle School
(Rogers)
71% NW 6-8 28 100% 3.75
8 Lincoln Middle School (Lincoln)
72% NW 5-7 12 100% 3.67
9 Forrest City Junior High
(Forrest City)
100% NE 7-8 38 100% 3.63
10 Greenland Middle School (Greenland)
66% NW 5-8 16 100% 3.56
6 A school was designated 8th Grade Middle School if it served students in grades 8 (and/or any grades below).

Outstanding Educational Performance Awards 2014 Page 104
Tables 127-131: Top 3 Improved “High Poverty” High Schools in Arkansas by Region, EOC
Algebra Achievement
Table 127: Top 3”High Poverty” High Schools in Northwest Arkansas Based on
EOC Algebra
School (District) % FRL Grades
Served
# of Test
Takers
%
Proficient/
Advanced
GPA
1 Green Forest High School (Green Forest)
72% 9-12 89 84% 3.15
2 Cedarville High School
(Cedarville)
100% 9-12 67 83% 3.06
3 Yellville-Summit High School
(Yellville-Summit)
67% 9-12 42 60% 2.70
Table 128: Top 3”High Poverty” High Schools in Northeast Arkansas Based on
Benchmark Literacy
School (District) % FRL Grades
Served
# of Test
Takers
%
Proficient/
Advanced
GPA
1 Marked Tree High School
(Marked Tree)
74% 9-12 41 85% 3.36
2 Newport High School (Newport) 67% 9-12 66 71% 2.92
3 Palestine-Wheatley Senior High
(Palestine/Wheatley)
100% 9-12 54 74% 2.87
Table: 129: Top 3 “High Poverty” High Schools in Central Arkansas Based on
EOC Algebra
School (District) % FRL Grades
Served
# of Test
Takers
%
Proficient/
Advanced
GPA
1 J. A. Fair High School
(Little Rock)
81% 9-12 191 47% 2.41
2 Hot Springs High School
(Hot Springs)
69% 9-12 155 43% 2.34
3 McClellan Magnet High School (Little Rock)
84% 9-12 168 45% 2.29

Outstanding Educational Performance Awards 2014 Page 105
Table 130: Top 2 “High Poverty” High Schools in Southwest Arkansas Based on
EOC Algebra
School (District) % FRL Grades
Served
# of Test
Takers
%
Proficient/
Advanced
GPA
1 Camden Fairview High School
(Camden-Fairview)
69% 9-12 86 44% 2.39
2 Washington Academy (Texarkana) 69% 9-12 17 35% 2.10
* These are the only two schools in this region that fall under this category
Table 131: Top 3 “High Poverty” High Schools in Southeast Arkansas Based on
EOC Algebra
School (District) % FRL Grades
Served
# of Test
Takers
%
Proficient/
Advanced
GPA
1 Drew Central High School
(Drew Central)
70% 9-12 40 81% 3.11
2 Warren High School (Warren) 74% 9-12 100 70% 2.91
3 KIPP Delta Collegiate High School
(KIPP Delta Public Schools)
85% 9-12 33 63% 2.79

Outstanding Educational Performance Awards 2014 Page 106
Tables 132-136: Top 3 “High Poverty” Junior High Schools and Comprehensive High Schools 7
in Arkansas by Region, EOC Algebra Achievement
Table 132: Top 3 “High Poverty” Junior High Schools and Comprehensive High
Schools in Northwest Arkansas Based on EOC Algebra
School (District) % FRL Grades
Served
# of Test
Takers
%
Proficient/
Advanced
GPA
1 Marshall High School (Searcy County) 68% 7-12 40 100% 3.66
2 Clarksville Junior High School (Clarksville)
72% 7-9 133 91% 3.40
3 Shirley High School (Shirley) 100% 7-12 40 88% 3.30
Table 133: Top 3 “High Poverty” Junior High Schools and Comprehensive High
Schools in Northeast Arkansas Based on EOC Algebra
School (District) % FRL Grades
Served
# of Test
Takers
%
Proficient/
Advanced
GPA
1 West Junior High (West Memphis) 68% 7-9 161 85% 3.17
2 Midland High School (Midland) 81% 7-12 26 88% 3.11
3 Timbo High School (Mountain View) 74% 7-12 11 82% 3.00
Table 134: Top 3 “High Poverty” Junior High Schools and Comprehensive High
Schools in Central Arkansas Based on EOC Algebra
7 A school was designated 8th and 9th Grade Junior High School if it served students in grades 8 and 9.
School (District) % FRL Grades
Served
# of Test
Takers
%
Proficient/
Advanced
GPA
1 Mountain Pine High School
(Mountain Pine)
73% 7-12 28 86% 3.08
2 Watson Chapel Junior High School (Watson Chapel)
70% 7-9 207 52% 2.46
3 England High School (England) 74% 7-12 31 48% 2.41

Outstanding Educational Performance Awards 2014 Page 107
Table 135: Top 3 “High Poverty” Junior High Schools and Comprehensive High
Schools in Southwest Arkansas Based on EOC Algebra
School (District) % FRL Grades
Served
# of Test
Takers
%
Proficient/
Advanced
GPA
1 Mount Ida High School (Mount Ida) 69% 7-12 35 86% 3.43
2 Caddo Hills High School (Caddo Hills) 73% 7-12 45 89% 3.27
2 Horatio High School (Horatio) 69% 7-12 61 85% 3.27
Table 136: Top 3 “High Poverty” Junior High Schools and Comprehensive High
Schools in Southeast Arkansas Based on EOC Algebra
School (District) % FRL Grades
Served
# of Test
Takers
%
Proficient/
Advanced
GPA
1 Hermitage High School (Hermitage) 75% 7-12 25 68% 2.88
2 Lee High School (Lee County) 100% 7-12 76 68% 2.78
3 Brinkley High School (Brinkley) 100% 7-12 39 74% 2.76

Outstanding Educational Performance Awards 2014 Page 108
Tables 137-141: Top 3 “High Poverty” Middle Schools8 in Arkansas by Region, EOC Algebra
Achievement
Table 137: Top 3 “High Poverty” Middle Schools in Northwest Arkansas Based on
EOC Algebra
School (District) % FRL Grades
Served
# of Test
Takers
%
Proficient/
Advanced
GPA
1 Dardanelle Middle School
(Dardanelle)
70% 7-8 17 100% 3.82
2 Oakdale Middle School (Rogers) 71% 6-8 28 100% 3.75
3 Lincoln Middle School (Lincoln) 72% 5-7 12 100% 3.67
Table 138: Top 3 “High Poverty” Middle Schools in Northeast Arkansas Based on
EOC Algebra
School (District) % FRL Grades
Served
# of Test
Takers
%
Proficient/
Advanced
GPA
1 Newport Junior High School
(Newport)
82% 7-8 11 100% 3.91
2 Blytheville Middle School
(Blytheville)
83% 6-8 19 100% 3.84
3 Forrest City Junior High
(Forrest City)
100% 7-8 38 100% 3.63
8 A school was designated 8th Grade Middle School if it served students in grades 8 (and/or any grades below).

Outstanding Educational Performance Awards 2014 Page 109
Table 139: Top 3 “High Poverty” Middle Schools in Central Arkansas Based on
EOC Algebra
School (District) % FRL Grades
Served
# of Test
Takers
%
Proficient/
Advanced
GPA
1 Bismarck Middle School (Bismarck) 67% 5-8 21 100% 3.95
2 Malvern Middle School (Malvern) 66% 7-8 20 100% 3.90
3 Dunbar Magnet Middle School (Little Rock)
85% 6-8 11 100% 3.55
Table 140: Top 3 “High Poverty” Middle Schools in Southwest Arkansas Based on
EOC Algebra
School (District) % FRL Grades
Served
# of Test
Takers
%
Proficient/
Advanced
GPA
1 Mena Middle School (Mena) 66% 6-8 22 100% 3.91
2 Camden Fairview Middle School (Camden-Fairview)
74% 6-8 63 90% 3.17
3 North Heights Junior High School
(Texarkana)
66% 7-8 57 90% 3.15
Table 141: Top 3 “High Poverty” Middle Schools in Southeast Arkansas Based on
EOC Algebra
*These are the only three schools in this region that fall in this category.
School (District) % FRL Grades
Served
# of Test
Takers
%
Proficient/
Advanced
GPA
1 KIPP Delta College Preparatory
School (KIPP Delta Public Schools)
92% 5-8 46 94% 3.44
2 KIPP Blytheville College Preparatory School (KIPP Delta Public Schools)
80% 5-8 33 97% 3.15
3 Lakeside Middle School
(Lakeside Chicot County)
100% 6-8 45 73% 2.87

Outstanding Educational Performance Awards 2014 Page 110
Y. Geometry End-of-Course, 2014
Geometry is generally taken during the tenth grade; however, some students may elect to take the
course earlier if they have taken prerequisite classes. This typically results in the most advanced
students taking the exam in 8th or 9th grade. Because of the likely academic differences between
students who take geometry in earlier grades, junior high schools tend to have higher proficiency
levels than do schools which serve only 10th grade students. For this reason, schools have been
split into two groups:
High School: primarily 9th -12th grades (includes Comprehensive High Schools serving
7th-12th grades)
Junior High School: primarily 8th-9th grades (and/or any grades below)
Table 142: Top 10 “High-Poverty” High Schools Based on EOC Geometry Achievement
School (District) %FRL Region Grades
Served
# of Test
Takers
%
Proficient/
Advanced
GPA
1 Oden High School
(Ouachita River)
71% SW 7-12 15 93% 3.33
2 Marshall High School
(Searcy County)
68% NW 7-12 92 92% 3.28
2 Yellville-Summit High School
(Yellville-Summit)
67% NW 9-12 65 88% 3.28
4 Centerpoint High School
(Centerpoint)
66% SW 6-12 60 91% 3.27
5 Mount Ida High School (Mount Ida)
69% SW 7-12 19 90% 3.24
6 KIPP Delta Collegiate High School
(KIPP Delta Public Schools)
85% SE 9-12 34 91% 3.20
7 Jasper High School (Jasper)
69% NW 7-12 28 86% 3.15
7 Norfork High School
(Norfork)
80% NW 7-12 27 89% 3.15
9 Caddo Hills High School
(Caddo Hills)
73% SW 7-12 41 92% 3.14
9 Omaha High School
(Omaha)
71% NW 7-12 27 81% 3.14

Outstanding Educational Performance Awards 2014 Page 111
Table 143: Top 10 “High-Poverty” Junior High Schools9 Based on EOC Geometry
Achievement
School (District) %
FRL Region
Grades
Served
# of Test
Takers
%
Proficient/
Advanced
GPA
1 Clinton Junior High School
(Clinton)
70% NW 7-9 15 100% 4.00
2 George Junior High School
(Springdale)
76% NW 8-9 53 100% 3.83
3 Booneville Junior High School
(Booneville)
66% NW 7-9 25 100% 3.68
4 Dunbar Magnet Middle School
(Little Rock)
85% CN 6-8 18 100% 3.61
5 Hot Springs Middle School
(Hot Springs)
80% CN 7-8 19 100% 3.58
6 Fuller Middle School
(Pulaski County Special)
70% CN 6-8 11 100% 3.55
7 Magnolia Junior High School
(Magnolia)
67% SW 7-9 73 94% 3.44
8 KIPP Blytheville College
Preparatory School
(KIPP Delta Public Schools)
80% SE 5-8 19 100% 3.42
9 Lakeside Jr. High
(Springdale)
76% NW 8-9 17 100% 3.41
10 DeQueen Junior High
(DeQueen)
71% SW 8-9 52 97% 3.34
9 A school was designated a Junior High School if it serves students in grades primarily 7-8 (maximum grade of 9)

Outstanding Educational Performance Awards 2014 Page 112
Tables 144-148: Top 5 “High Poverty” High Schools in Arkansas by Region, EOC Geometry
Achievement
Table 144: Top 5 “High Poverty” High Schools in Northwest Arkansas Based on
EOC Geometry
School (District) % FRL Grades
Served
# of Test
Takers
%
Proficient/
Advanced
GPA
1 Marshall High School
(Searcy County)
68% 7-12 92 92% 3.28
1 Yellville-Summit High School
(Yellville-Summit)
67% 9-12 65 88% 3.28
3 Jasper High School
(Jasper)
69% 7-12 28 86% 3.15
3 Norfork High School (Norfork)
80% 7-12 27 89% 3.15
5 Omaha High School
(Omaha)
71% 7-12 27 81% 3.14
Table 145: Top 5 “High Poverty” High Schools in Northeast Arkansas Based on
EOC Geometry
School (District) % FRL Grades
Served
# of Test
Takers
%
Proficient/
Advanced
GPA
1 Midland High School (Midland)
68% 7-12 43 79% 3.03
1 Palestine-Wheatley Senior High
(Palestine/Wheatley)
100% 9-12 44 89% 3.03
3 Hoxie High School (Hoxie)
67% 7-12 64 80% 2.99
4 West Memphis High School
(West Memphis)
100% 10-12 343 70% 2.97
5 Bradford High School
(Bradford)
74% 7-12 22 73% 2.96
5 Sloan-Hendrix High School (Sloan-Hendrix)
66% 8-12 43 79% 2.96

Outstanding Educational Performance Awards 2014 Page 113
Table 146: Top 5 “High Poverty” High Schools in Central Arkansas Based on EOC
Geometry
School (District) % FRL Grades
Served
# of Test
Takers
%
Proficient/
Advanced
GPA
1 England High School
(England)
74% 7-12 59 63% 2.70
2 Mountain Pine High School (Mountain Pine)
73% 7-12 32 68% 2.69
3 Hot Springs High School
(Hot Springs)
69% 9-12 181 61% 2.58
4 McClellan Magnet High School (Little Rock)
84% 9-12 151 42% 2.31
5 Pine Bluff High School
(Pine Bluff)
76% 10-12 219 34% 2.15
Table 147: Top 5 “High Poverty” High Schools in Southwest Arkansas Based on
EOC Geometry
School (District) % FRL Grades
Served
# of Test
Takers
%
Proficient/
Advanced
GPA
1 Oden High School
(Ouachita River)
71% 7-12 15 93% 3.33
2 Centerpoint High School
(Centerpoint)
66% 6-12 60 91% 3.27
3 Mount Ida High School
(Mount Ida)
69% 7-12 19 90% 3.24
4 Caddo Hills High School
(Caddo Hills)
73% 7-12 41 92% 3.14
5 Nevada High School (Nevada)
74% 7-12 23 74% 3.00

Outstanding Educational Performance Awards 2014 Page 114
Table 148: Top 5 “High Poverty” High Schools in Southeast Arkansas Based on
EOC Geometry
School (District) % FRL Grades
Served
# of Test
Takers
%
Proficient/
Advanced
GPA
1 KIPP Delta Collegiate High School
(KIPP Delta Public Schools)
85% 9-12 34 91% 3.20
2 Warren High School
(Warren)
74% 9-12 185 77% 2.94
3 Hermitage High School
(Hermitage)
75% 7-12 31 71% 2.84
4 Drew Central High School (Drew Central)
70% 9-12 60 68% 2.78
5 Clarendon High School
(Clarendon)
90% 7-12 39 72% 2.76

Outstanding Educational Performance Awards 2014 Page 115
Z. Biology End-of-Course Exam, 2014
Biology is generally taken during the tenth grade; however, some students may elect to take the
course earlier if they have taken prerequisite classes. This typically results in the most advanced
students taking the exam in 8th or 9th grade. Because of the likely academic differences between
students who take biology in earlier grades, junior high schools tend to have higher proficiency
levels than do schools which serve only 10th grade students. For this reason, schools have been
split into two groups:
High School: primarily 9th -12th grades (includes Comprehensive High Schools
serving 7th-12th grades)
Junior High School: primarily 8th-9th grades (and/or any grades below)
Compared to other EOC exams, proficiency rates in biology are significantly lower. The Biology
EOC is a much newer test than the others (it was first administered in 2008), and most likely
students and schools are still adapting to its requirements. Due to this, relatively lower rates for
the schools included in this section come as no surprise.
Table 149: Top 10 “High-Poverty” High Schools10 Based on EOC Biology Achievement
School (District) %FRL Region Grades
Served
# of Test
Takers
%
Proficient/
Advanced
GPA
1 Bradford High School
(Bradford)
74% NE 7-12 32 78% 3.13
2 Omaha High School
(Omaha)
71% NW 7-12 39 77% 3.10
3 Yellville-Summit High School
(Yellville-Summit)
67% NW 9-12 44 75% 3.05
4 Norfork High School
(Norfork)
80% NW 7-12 30 60% 2.83
5 Jasper High School
(Jasper)
69% NW 7-12 36 61% 2.69
5 Murfreesboro High School
(South Pike County)
67% SW 7-12 51 59% 2.69
7 Marshall High School (Searcy
County)
68% NW 7-12 54 61% 2.63
7 Centerpoint High School (Centerpoint)
66% SW 6-12 72 57% 2.63
9 Foreman High School
(Foreman)
67% SW 7-12 43 58% 2.62
10 Green Forest High School
(Green Forest)
72% NW 9-12 68 45% 2.49
10 A school was designated High School if it primarily serves students in grades 9 – 12.

Outstanding Educational Performance Awards 2014 Page 116
Table 150: Top 3 “High-Poverty” Junior High Schools Based on EOC Biology Achievement
School (District) %FRL Region Grades
Served
# of Test
Takers
%
Proficient/
Advanced
GPA
1 George Junior High School (Springdale)
76% NW 8-9 42 95% 3.59
2 Booneville Junior High
School
(Booneville)
66% NW 7-9 16 100% 3.44
3 Lakeside Jr. High
(Springdale)
76% NW 8-9 16 51% 2.47
*These are the only three schools that fall under this category

Outstanding Educational Performance Awards 2014 Page 117
Tables 151-155: Top 5 “High Poverty” High Schools in Arkansas by Region, EOC Biology
Achievement
Table 151: Top 5 “High Poverty” High Schools in Northwest Arkansas Based on
EOC Biology
School (District) % FRL Grades
Served
# of Test
Takers
%
Proficient/
Advanced
GPA
1 Omaha High School
(Omaha)
71% 7-12 39 77% 3.10
2 Yellville-Summit High School (Yellville-Summit)
67% 9-12 44 75% 3.05
3 Norfork High School
(Norfork)
80% 7-12 30 60% 2.83
4 Jasper High School (Jasper)
61% 7-12 36 69% 2.69
5 Marshall High School
(Searcy County)
61% 7-12 54 68% 2.63
Table 152: Top 5 “High Poverty” High Schools in Northeast Arkansas Based on
EOC Biology
School (District) % FRL Grades
Served
# of Test
Takers
%
Proficient/
Advanced
GPA
1 Bradford High School (Bradford)
74% 7-12 32 78% 3.13
2 Maynard High School
(Maynard)
100% 7-12 37 46% 2.39
3 Hoxie High School
(Hoxie)
67% 7-12 79 47% 2.37
3 Midland High School (Midland)
68% 7-12 43 42% 2.37
5 Palestine-Wheatley Senior High
(Palestine/Wheatley)
100% 9-12 47 40% 2.31
Outstanding Educational Performance Awards 2014 Page 118
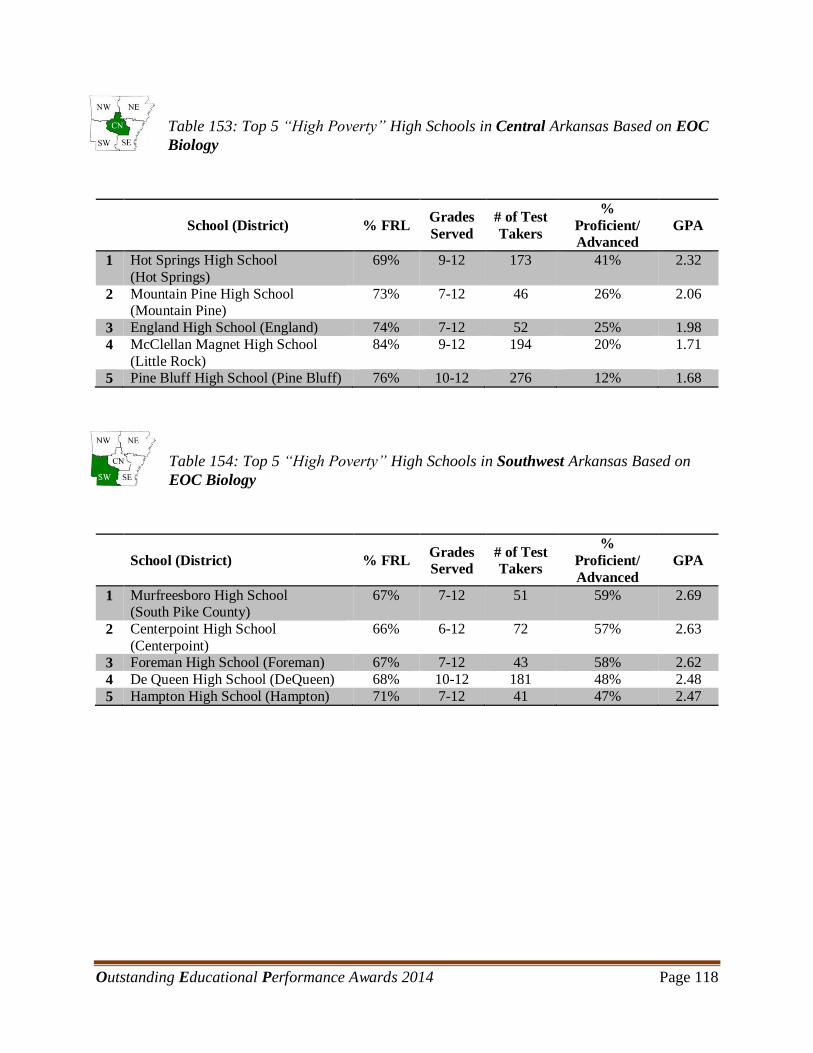
Table 153: Top 5 “High Poverty” High Schools in Central Arkansas Based on EOC
Biology
School (District) % FRL Grades
Served
# of Test
Takers
%
Proficient/
Advanced
GPA
1 Hot Springs High School
(Hot Springs)
69% 9-12 173 41% 2.32
2 Mountain Pine High School (Mountain Pine)
73% 7-12 46 26% 2.06
3 England High School (England) 74% 7-12 52 25% 1.98
4 McClellan Magnet High School
(Little Rock)
84% 9-12 194 20% 1.71
5 Pine Bluff High School (Pine Bluff) 76% 10-12 276 12% 1.68
Table 154: Top 5 “High Poverty” High Schools in Southwest Arkansas Based on
EOC Biology
School (District) % FRL Grades
Served
# of Test
Takers
%
Proficient/
Advanced
GPA
1 Murfreesboro High School (South Pike County)
67% 7-12 51 59% 2.69
2 Centerpoint High School
(Centerpoint)
66% 6-12 72 57% 2.63
3 Foreman High School (Foreman) 67% 7-12 43 58% 2.62
4 De Queen High School (DeQueen) 68% 10-12 181 48% 2.48
5 Hampton High School (Hampton) 71% 7-12 41 47% 2.47

Outstanding Educational Performance Awards 2014 Page 119
Table 155: Top 5 “High Poverty” High Schools in Southeast Arkansas Based on
EOC Biology
School (District) % FRL Grades
Served
# of Test
Takers
%
Proficient/
Advanced
GPA
1 Clarendon High School
(Clarendon)
90% 7-12 44 29% 2.24
2 Dumas High School (Dumas) 67% 10-12 106 34% 2.22
3 Drew Central High School (Drew Central)
70% 9-12 76 37% 2.21
4 Barton High School (Barton-Lexa) 71% 7-12 51 32% 2.15
5 KIPP Delta Collegiate High School (KIPP Delta Public Schools)
85% 9-12 67 22% 2.07

Outstanding Educational Performance Awards 2014 Page 120
AA. Grade 11 Literacy End-of-Course Exam, 2014
In this section, the top 20 high schools on Grade 11 Literacy are presented, followed by the top
10 “High-Poverty”11 schools, and the top 5 schools in each region.
Table 156: Top 10 “High-Poverty” High Schools in Arkansas Based on Grade 11 Literacy
Achievement
School (District) % FRL Region Grades
Served
# of Test
Takers
%
Proficient/
Advanced
GPA
1 St. Paul High School
(Huntsville)
73% NW 7-12 15 80% 3.33
2 Marshall High School
(Searcy County)
68% NW 7-12 66 94% 3.30
3 Marked Tree High School (Marked Tree)
74% NE 9-12 36 87% 3.20
4 Palestine-Wheatley Senior High
(Palestine/Wheatley)
100% NE 9-12 41 90% 3.19
5 Mountain Pine High School
(Mountain Pine)
73% CN 7-12 26 80% 3.16
6 Mount Ida High School
(Mount Ida)
69% SW 7-12 39 82% 3.13
7 Cossatot River High School
(Cossatot River)
72% SW 7-12 75 82% 3.09
7 KIPP Delta Collegiate High School
(KIPP Delta Public Schools)
85% SE 9-12 40 90% 3.09
9 Green Forest High School
(Green Forest)
72% NW 9-12 91 83% 3.08
10 Black Rock High School
(Lawrence County)
72% NE 7-12 16 81% 3.06
11 “High-Poverty” schools have 66% or more students receiving free or reduced lunch (FRL) in the grades they
serve.

Outstanding Educational Performance Awards 2014 Page 121
Tables 157-161: Top 5 High Schools12 in Arkansas by Region, EOC Grade 11 Literacy
Achievement
Table 157: Top 5 “High Poverty” High Schools in Northwest Arkansas Based on
EOC Grade 11 Literacy
School (District) %
FRL
Grade
s
Served
# of Test
Takers
%
Proficient/
Advanced
GPA
1 St. Paul High School
(Huntsville)
73% 7-12 15 80% 3.33
2 Marshall High School (Searcy County)
68% 7-12 66 94% 3.30
3 Green Forest High School
(Green Forest)
72% 9-12 91 83% 3.08
4 Bruno-Pyatt High School
(Ozark Mountain)
75% 7-12 12 92% 3.01
5 Springdale High School (Springdale)
66% 10-12 690 78% 2.99
Table 158: Top 5 “High Poverty” High Schools in Northeast Arkansas Based on
EOC Grade 11 Literacy
School (District) % FRL Grades
Served
# of Test
Takers
%
Proficient/
Advanced
GPA
1 Marked Tree High School
(Marked Tree)
74% 9-12 36 87% 3.20
2 Palestine-Wheatley Senior High (Palestine/Wheatley)
100% 9-12 41 90% 3.19
3 Black Rock High School
(Lawrence County)
72% 7-12 16 81% 3.06
4 Midland High School
(Midland)
68% 7-12 30 80% 3.03
5 Riverview High School (Riverview)
67% 9-12 102 75% 2.95
12 A school was designated High School if it primarily serves students in grades 9 – 12.

Outstanding Educational Performance Awards 2014 Page 122
Table 159: Top 5 “High Poverty” High Schools in Central Arkansas Based on EOC
Grade 11 Literacy
Table 160: Top 5 “High Poverty” High Schools in Southwest Arkansas Based on
EOC Grade 11 Literacy
School (District) %
FRL
Grades
Served
# of Test
Takers
%
Proficient/
Advanced
GPA
1 Mount Ida High School (Mount Ida)
69% 7-12 39 82% 3.13
2 Cossatot River High School
(Cossatot River)
72% 7-12 75 82% 3.09
3 Oden High School
(Ouachita River)
71% 7-12 14 85% 2.97
4 De Queen High School (DeQueen)
68% 10-12 129 81% 2.96
5 Bradley High School
(Emerson-Taylor)
76% 7-12 30 77% 2.84
School (District) % FRL Grades
Served
# of Test
Takers
%
Proficient/
Advanced
GPA
1 Mountain Pine High School
(Mountain Pine)
73% 7-12 26 80% 3.16
2 Hot Springs High School (Hot Springs)
69% 9-12 154 65% 2.75
3 England High School
(England)
74% 7-12 46 52% 2.52
4 Dollarway High School
(Dollarway)
100% 9-12 106 44% 2.45
5 Pine Bluff High School (Pine Bluff)
76% 10-12 290 43% 2.38

Outstanding Educational Performance Awards 2014 Page 123
Table 161: Top 5 “High Poverty” High Schools in Southeast Arkansas Based on
EOC Grade 11 Literacy
School (District) %
FRL
Grades
Served
# of Test
Takers
%
Proficient/
Advanced
GPA
1 KIPP Delta Collegiate High School (KIPP Delta Public Schools)
85% 9-12 40 90% 3.09
2 Lakeside High School
(Lakeside Chicot County)
100% 9-12 60 69% 2.88
3 Drew Central High School
(Drew Central)
70% 9-12 57 62% 2.82
4 Warren High School
(Warren)
74% 9-12 118 62% 2.75
5 Hermitage High School
(Hermitage)
75% 7-12 36 64% 2.70

Outstanding Educational Performance Awards 2014 Page 124
Appendix A. Methods
The Office for Education Policy strives to make all of our calculations and publications
transparent to our readers. Thus, in this appendix we describe our data source, calculations
performed on these data for the purposes of our reporting, and our method for determining a
school’s classification as an elementary, middle, or high school.
All data used in this report were obtained from the Arkansas Department of Education.
Benchmark and End-of-Course exam scores were obtained from the testing section
(http://www.arkansased.org/divisions/learning-services/student-assessment). Other data, such as
the percent of students eligible for free and reduced lunch, were obtained from the Arkansas
Department of Education Data Center (http://adedata.arkansas.gov).
All data were analyzed at the school level; however, the ADE provides the percentage of scores
at the proficient and advanced level by grade. Therefore, in order to present an accurate school
level percentage of students scoring proficient and advanced across all grades, a weighted
average for each school was calculated to account for different levels of enrollment at each grade
level. In an effort to highlight schools that were strong in both subject areas, we calculated a
simple average of the school level percent proficient and advanced in math and literacy at the
elementary and middle school levels.
As previously discussed in the introduction, in order to calculate the GPA measure we treat the
benchmark test scores similar to the existing grade point system.
We calculated the GPA measure for every schools math, literacy, and combined math and
literacy scores. The GPA measure is comprehensive in that it takes into account all of the test
score levels (advanced, proficient, basic, and below basic), instead of lumping together advanced
and proficient scores.
Category GPA Points
Awarded
Advanced 4.0
Proficient 3.0
Basic 2.0
Below Basic 1.0

Outstanding Educational Performance Awards 2014 Page 125
B. School Classification
For the OEP Awards, we classified schools based on the following rules:
Elementary School: primarily grades 3-5 (minimum grade P, K, 1, 2, 3, or 4)
Middle School: primarily grades 6-8 (minimum grade of 4, 5, or 6 and maximum grade
of 7, 8, or 9)
There were also a few “comprehensive schools,” such as K-8 or K-12 schools, that we included
as either middle schools or elementary schools based on their enrollment numbers. The following
table lists every grade configuration and their classifications.
Table A: School Classifications
Elementary
Schools
Middle Schools
1-4 4-6
1-5 4-8
1-6 5-6
1-8 5-7
2-3 5-8
2-4 5-9
2-5 5-12
2-6 6
3-4 6-12
3-5 6-7
3-6 6-8
4-5 7-12
5 7-8
K-3 7-9
K-4 8
K-5 8-9
K-6 K-12
K-7 8-12
K-8
P-2
P-3
P-4
P-5
P-6
P-7
P-8

Outstanding Educational Performance Awards 2014 Page 126
C. School Classification – High School Awards
For the OEP High School Awards, we primarily classified schools based on the following rules:
Junior High: primarily grades 7 – 9 (maximum grade of 9)
High School: primarily grades 9 – 12
For the Algebra EOC, schools are classified differently, as the test is taken at different levels.
These classifications are explained in the Algebra EOC section.
Table B: School Classifications
Junior High High School
5-7 8-12
5-8 9-12
6-7 10-12
6-8 11-12
7-8 9-10
7-9 7-12
8 6-12
8-9 5-12
4-8 K-12
1-8
K-8