bearing capacity of pile group and piled raft foundations ... · pdf filejournal of...
TRANSCRIPT

Journal of Engineering and Development, Vol. 17, No.2, 2013, ISSN 1813- 7822
Bearing Capacity of Pile Group and Piled Raft Foundations on Sandy Soil
Mohammed Y, Fattah Mustafa A. Yousif
Professor Lecturer
Building and Construction Engineering Civil Eng. Dept
Department Al-Mustansiriya University
University of Technology, Baghdad Baghdad
Sarmad M. Al-Tameemi
Formerly graduate student
Al-Mustansiriya University
Baghdad.
Abstract: This paper presents an experimental study to investigate the behavior of piled raft system
in different types of sandy soil. A small scale “prototype” model was tested in a sand box
with load applied to the foundation through a compression jack and measured by means of
a load cell. The settlement was measured at the raft by means of dial gauges, three strain
gauges were attached on piles to measure the strains and to calculate the load carried by
each pile in the group by the strain indicator. Nine configurations of pile groups (1x2, 1x3,
1x4, 2x2, 2x3, 2x4, 3x3, 3x4 and 4x4) were tested in the laboratory as a free standing pile
group (the raft is not in contact with the soil) and as a piled raft (the raft is in contact with
the soil), in addition to tests for a raft (unpiled) with different sizes. Three different
densities of sand were used for some tests.
It is found that the piles work as settlement reducers effectively when the number of
piles is greater than (6) than when the number of piles is less than (6). The settlement can
be increased by about 8 times in (1x2) free standing pile group compared to the piled raft
of the same size. The effect of piled raft in reducing the settlement vanishes when the
number of piles exceeds (6). For piled rafts (3x3) and (4x4) embedded in loose, medium
and dense sand; an increase in the ultimate capacity by about 93%, 96% and 98% is
obtained when the group is enlarged from (3x3) to (4x4). This is attributed to increase in
footing size (cap) and the increase of the number of piles in the group.
64

Journal of Engineering and Development, Vol. 17, No.2, 2013, ISSN 1813- 7822
Keywords: Piled raft, bearing capacity, group, sand density.
قابلية تحمل مجاميع الركائز و األسس الحصيرية المدعمة بركائز على ترب رملية
ف مصطفى احمد يوس. د. م محمد يوسف فتاح. د.أ
قسم الھندسة المدنية قسم ھندسة البناء واالنشاءات
الجامعة المستنصرية الجامعة التكنولوجية
سرمد محمد التميمي
طالب دراسات عليا
الجامعة المستنصرية
:الخالصة. يمثل ھذا البحث دراسة عملية للتحري عن تصرف منظومة األساس الحصيري المدعم بالركائز في ترب رملية مختلفة
تم فحص نموذج مختبري مصغر في صندوق من الرمل مع حمل مسلط على األساس من خالل مرفاع ضغط ھيدروليكي
س الھبوط في األساس بواسطة مقاييس ازاحة و ربطت مقاييس انفعال بالركائز و قد قي. و مقاسا بواسطة خلية حمل
و قد فحصت . الحمل الذي تحمله كل ركيزة في المجموعة بواسطة قاريء انفعاالتلقياس االنفعاالت و من ثم حساب
حرة الركائزباعتبار أن (1x2, 1x3, 1x4, 2x2, 2x3, 2x4, 3x3, 3x4, 4x4)تسعة أشكال من مجاميع الركائز
النھايات و أن قبعة الركائز ليست في تماس مع التربة، ثم فحصت المجاميع بجعل قبعة الركائز بتماس مع التربة
و قد أستعمل رمل بكثافات مختلفة في بعض . بأحجام مختلفة) بدون ركائز(باالضافة الى فحص أساس حصيري
عن حالة عدد الركائز ) ٦(أكبر من فاءة عندما يكون عدد الركائز و قد وجد أن الركائز تعمل كمقلالت ھبوط بك. الفحوص
مقارنة مع أساس حصيري مستند ) ١x٢(مرات في مجموعة الركائز ) ٨(ان الھبوط يمكن أن يزداد بحدود ). ٦(أقل من
اوز عدد ان دور األساس الحصيري المستند على ركائز في تقليل الھبوط يتالشى عندما يتج. على ركائز بنفس الحجم
المستند على تربة رملية مفككة و ) 4x4(و ) 3x3(و لألساس الحصيري المستند على ركائز بحجم ). ٦(الركائز
على التوالي عند زيادة حجم % ٩٨و % ٩٦و % ٩٣متوسطة و كثيفة، لوحظ حصول زيادة في قابلية التحمل بحدود
.و زيادة عدد الركائز في المجموعة) القبعة(س بسبب الزيادة في حجم األسا) 4x4(الى ) 3x3(المجموعة من
Introduction: The use of piled raft foundations has become more popular in the recent years, as the
combined action of the raft and the piles can increase the bearing capacity, reduce settlement,
and the piles can be arranged so as to reduce differential deflection in the raft.
65

Journal of Engineering and Development, Vol. 17, No.2, 2013, ISSN 1813- 7822 The piled raft foundation is a geotechnical composite construction consisting of three
elements: piles, raft and soil. In situations where a raft foundation alone doesn't satisfy the
design requirements, it may be possible to enhance the performance of the raft by the addition
of piles. The use of a limited number of piles may improve the ultimate load capacity, the
settlement and differential settlement performance of the raft and the required thickness of
the raft (Poulos 2001).
As with any foundation system, design of a piled raft foundation requires the
consideration of a number of issues, including:
1. Ultimate load capacity for vertical, lateral and moment loadings,
2. Maximum settlement,
3. Differential settlement,
4. Raft moments and shears for the structural design of the raft, and
5. Pile loads and moments for the structural design of the piles.
The Concept of Piled Raft Foundation
Piled raft foundations are composite structures unlike classical foundation where the building
load is either transferred by the raft or the piles alone. In a piled raft foundation, the
contribution of the piles as well as the raft is taken into account.
The piles transfer a part of the building loads into deeper and stiffer layers of soil and
thereby allow the reduction of settlement and differential settlement in a very economic way.
Piles are used up to a load level which can be of the same order of magnitude as the bearing
capacity of a comparable single pile or even greater (Hartmann and Jahn, 2001).
The conventional pile design philosophy is based on that piles carry all the load and
they are accepted as a group, no contribution is made by the raft to the ultimate load capacity.
The new trend in the foundation engineering is combining raft foundations and pile
foundations. The combined system can be based on different design philosophies which can
be classified as follows (Yilmaz, 2010):
1. Settlement reducing pile concept: In this philosophy, piles are only located to reduce the
total settlement and they are designed to work at limiting equilibrium, in other words, for
the piles, factor of safety values against bearing capacity is taken as unity.
2. Piled raft concept: This philosophy is one of the newly adopted concepts in which a
significant portion of total load is carried by the raft contrarily to the conventional design.
Piles are designed to work at 70-80% of the ultimate load capacity.
66

Journal of Engineering and Development, Vol. 17, No.2, 2013, ISSN 1813- 7822 3. Differential settlement control: Placing piles under the raft strategically and of course in
a limited number will enhance the ultimate load capacity of the foundation and decrease
both the settlement and the differential settlement.
Apparatus, Materials, and Testing Techniques
The main purpose of the experimental work implemented in this paper is to study the load
sharing mechanism between raft and piles, as well as the load settlement behavior of piled
raft with different configurations. The following sections describe the test setup used to
perform the model tests, the configuration of model piled rafts, material properties, the testing
program and procedures.
Test setup
All model tests were conducted using the setup shown in Figure (1), which consists of
frame, soil tank, model piled raft and loading machine. The vertical load was applied to the
model piles by means of 10 ton hydraulic compression handle jack. During all the
experimental tests, the loading rate is kept approximately constant at 3 mm/min. The
applied load is measured using a “Sewha, Korea” load cell 5 ton capacity. A digital weighing
indicator “Sewha, Korea” is used to read and display the load value. Two deformation dial
gauges with 0.01 mm sensitivity have been used for measuring displacements of the piled raft
model. Three strain gauges were adhered to the piles and connected to a strain indicator with
three channels so as to measure the strains in the piles, and the strain indicator is connected to
a computer through an interface device to read the strain value. Figure (2) shows the setup in
three-dimensional view.
Soil tank
The soil tank has 0.45 m length, 0.45 m width, and 0.5 m height. It is supported by the
frame. The dimensions of the tank were chosen so that the tank can be put inside the testing
frame and there will be no interference between the walls of the soil tank and the failure zone
around the piled raft system.
67

Journal of Engineering and Development, Vol. 17, No.2, 2013, ISSN 1813- 7822
Fig. (1) Setup of the laboratory Fig. (2) Three-dimensional view of the setup. apparatus.
Soil Properties
The soil used for the model tests is clean, oven-dried, uniform quartz (Kerbela) sand. The
maximum and minimum dry unit weights of the sand were determined according to the
ASTM (D4253-2000) and ASTM (D4254-2000) specifications, respectively, the specific
gravity test is performed according to ASTM (D854-2005), the grain size distribution is
analyzed according to ASTM (D422-2001) specifications and direct shear test according to
the ASTM (D 3080-1998). Figure (3) shows the grain size distribution of the sand and
Tables (1) and (2) summarize the physical properties of the tested sand. The angle of internal
friction is determined using the direct shear test which was carried out for the three types of
sand.
The sand deposit was prepared using the sand raining technique. A special raining
device similar to that recommended by Bieganousky and Marcuson (1976) was designed to
obtain a uniform deposit with the desired density.
68

Journal of Engineering and Development, Vol. 17, No.2, 2013, ISSN 1813- 7822
Fig. (3) Grain size distribution of the sand.
Table (1) Physical properties for the tested sand.
Property Value
Grain size analysis
Effective size, D10 0.26 mm
Coefficient of uniformity, Cu 2.38
Coefficient of curvature, Cc 0.99
Classification (USCS)* SP
Specific gravity, Gs 2.62
Dry unit weights
Maximum unit weight, γd (max) 17.8 kN/m3
Minimum unit weight, γd (min) 14.8 kN/ m3
Test unit weight, γd (test) 16.5 kN/ m3
Relative density, Dr 62%
Void ratio
Maximum void ratio, emax 0.73
Minimum void ratio, emin 0.44
Test void ratio, etest 0.56
* USCS refers to Unified Soil Classification System
The unit weight of the sand deposit in the raining method depends primarily on the
drop height and the discharge rate of the sand (Turner and Kulhawy, 1987). The height of the
69

Journal of Engineering and Development, Vol. 17, No.2, 2013, ISSN 1813- 7822 free fall of the sand can be controlled by adjusting the elevation of the raining device with
respect to the sand tank while the discharge rate of the sand was kept constant. Sand deposits
were prepared with the sand tank resting on the loading platen of the testing frame so that the
sand deposit was not disturbed and hence the desired unit weight of the sand is not altered.
The height of drop was chosen to be (8, 50, 90) cm which corresponds to a placing unit
weight of (15.2, 16.5, 17) kN/m3, void ratio of (0.68, 0.55, 0.51) and a relative density of (15,
60, 77) %, respectively.
Table (2) Properties of different types of sand used in the tests.
Type of
sand Dry unit weight (γd)
Angle of friction
()
Relative
density (Dr%)
Void ratio
(e)
Loose 15.2 kN/ m3 36o 15 0.68
Medium 16.5 kN/ m3 42o 60 0.55
Dense 17 kN/ m3 44o 77 0.51
Model Piled Rafts
The model piles used in this study are smooth aluminum pipes. The diameter of piles is 12
mm, while the length of piles is kept at 200 mm. The embedment (depth to diameter) ratio
dl = 17, where represents the pile length and is the outside diameter of the pipe pile.
The spacing between piles is kept constant (S = 36 mm) in all tests. The model raft used in
the test was also made of aluminum plate with smooth surface having a thickness of 4 mm.
Both piles and rafts were composed of ALUPCO alloy, which is supplied locally by
ALUPCO Alloys Company.
l d
Strain Measurement
Three-channel strain indicator was used to read the strain initiated in the piles, specifically
designed for use with strain gauges. The strain indicator, which was manufactured locally,
can be used to obtain extremely accurate, high resolution strain measurements in a variety of
circumstances. Accuracy of ±10 µε (micro strain) can be obtained, with a sampling range
max. ±19990 µε. It consists of quarter bridge (tension / compression) with 120 Ω resistance
of strain. The strain indicator is connected to a computer to display and record the results of
the strain that is measured through three channels by using interface device.
70
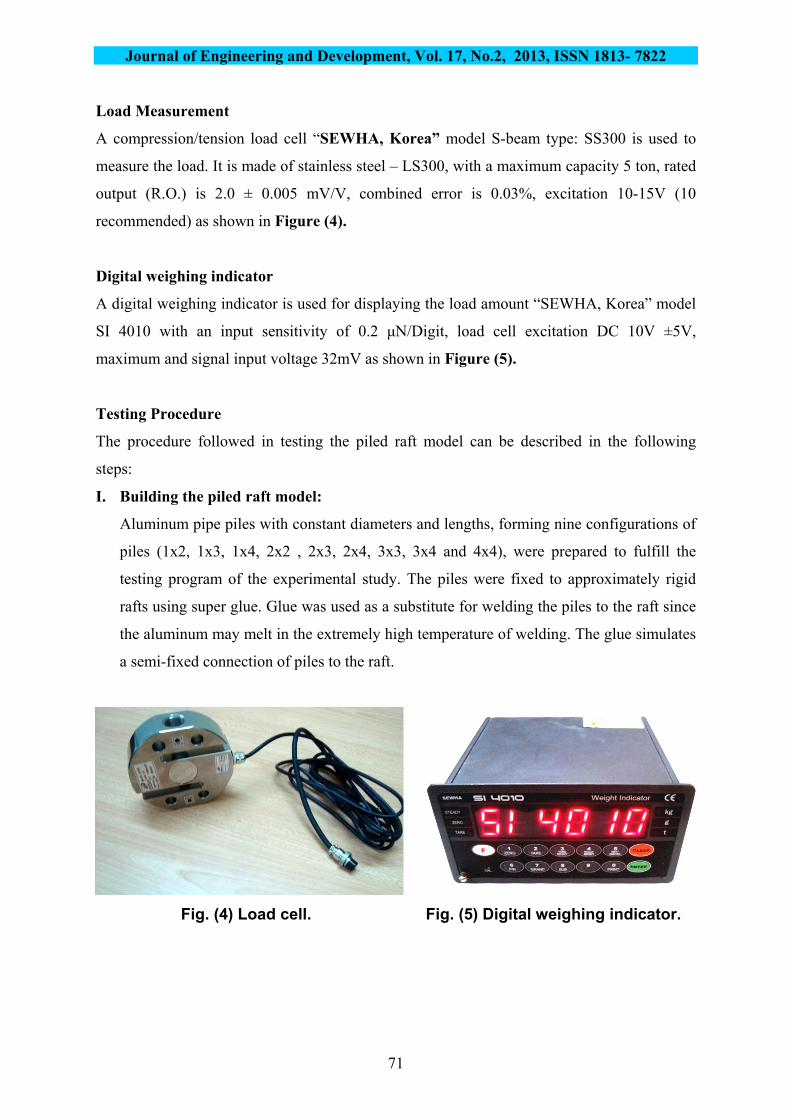
Journal of Engineering and Development, Vol. 17, No.2, 2013, ISSN 1813- 7822 Load Measurement
A compression/tension load cell “SEWHA, Korea” model S-beam type: SS300 is used to
measure the load. It is made of stainless steel – LS300, with a maximum capacity 5 ton, rated
output (R.O.) is 2.0 ± 0.005 mV/V, combined error is 0.03%, excitation 10-15V (10
recommended) as shown in Figure (4).
Digital weighing indicator
A digital weighing indicator is used for displaying the load amount “SEWHA, Korea” model
SI 4010 with an input sensitivity of 0.2 μN/Digit, load cell excitation DC 10V ±5V,
maximum and signal input voltage 32mV as shown in Figure (5).
Testing Procedure
The procedure followed in testing the piled raft model can be described in the following
steps:
I. Building the piled raft model:
Aluminum pipe piles with constant diameters and lengths, forming nine configurations of
piles (1x2, 1x3, 1x4, 2x2 , 2x3, 2x4, 3x3, 3x4 and 4x4), were prepared to fulfill the
testing program of the experimental study. The piles were fixed to approximately rigid
rafts using super glue. Glue was used as a substitute for welding the piles to the raft since
the aluminum may melt in the extremely high temperature of welding. The glue simulates
a semi-fixed connection of piles to the raft.
Fig. (4) Load cell. Fig. (5) Digital weighing indicator.
71

Journal of Engineering and Development, Vol. 17, No.2, 2013, ISSN 1813- 7822 II. Attachment of strain gauge:
A strain gauge was placed in the middle of the pile shaft. The strain gauge was covered
with a thin layer of sponge to protect it from damage, at the same time; sponge does not
bear any load, and it is covered with tape to prevent the gauge from any moisture, as
shown in Figure (6).
III. Preparation of sand deposit and placing of piled raft model:
The sand was placed in the tank according to the raining technique, i.e. maintaining a
dropping height constant for each density. After each test, the sand box should be emptied
to a depth below the zone of influence (which was considered as 2 below the raft, where
l is the pile length). During the process of sand raining, the piled raft model was placed at
the center of the tank and under the load cell and then the raining was continued to a level
of the lower surface of the raft. The final layer of the sand is leveled by a sharp edge
ruler.
l
Fig. (6) Attachment of strain gauges.
IV. Connection of wires to the strain indicator:
A quarter bridge connections was performed through the use of strain indicator, a gauge
factor of 2.03, excitation voltage of 10V and shunt calibration resistor of 120 were
used to compensate for the lead wire resistant. Before starting the test, a reading of 0.00
was set in the strain indicator and waiting for 10 minutes to allow the system to be stable,
then if the reading is still around 0.00, the test can be started successfully.
V. Application of vertical load:
A vertical load is applied through a 5 ton load cell; a constant loading rate has been
adopted in the entire testing program. The test is continued until recoding a continuous
displacement of the piled raft under constant load. The load will be read from a digital
weighing indicator connected to the load cell. The central displacement of the raft is read
72

Journal of Engineering and Development, Vol. 17, No.2, 2013, ISSN 1813- 7822
by two dial gauges of 0.01 mm sensitivity, and the strain in the pile is read from the strain
indicator.
Some photos describing the loading process are shown in Figure (7). The loading and
measuring system assembly is shown in Figure (8).
Fig. (7) Testing process.
Fig. (8) Testing system assembly.
73

Journal of Engineering and Development, Vol. 17, No.2, 2013, ISSN 1813- 7822
Presentation and Discussion of Results
The load applied to the center of the model raft is transmitted partly to the soil and another
part is transmitted to the piles. The percent of load carried by piles to the total applied load
can be determined in the laboratory through instrumentation of the piles with strain gauges to
measure the strain initiated in each pile. Strain can be measured in three piles in the group.
Rigid rafts have been used to distribute the load equally to the piles, and by knowing the load
in three piles, the total load carried by other piles can be obtained due to symmetry. By
knowing the strain in a pile, one can calculate the load in that pile if the cross sectional area
and the modulus of elasticity are known.
Hansen’s Bearing Capacity Equation
The bearing capacity of model rafts on sandy soil is calculated using equation (1), where:
SBNq f 5.0 ………………………………………………. (1)
Where N and S are the bearing capacity factor and shape factor, respectively. Table (4)
shows the results of bearing capacity calculated by Hansen’s equation.
Configurations of Piled Rafts
Piled raft configurations used maintain symmetrical shapes, especially where the differential
settlement is expected to be of no major concern. Nine different configurations of piles are
used in the piled raft prototypes. The groups consist of (1x2), (1x3), (1x4), (2x2), (2x3),
(2x4), (3x3), (3x4) and (4x4) piles. A schematic diagram for the configuration models is
shown in Figure (9).
74

Journal of Engineering and Development, Vol. 17, No.2, 2013, ISSN 1813- 7822
Fig. (9) Schematic diagram for configuration models.
Effect of Sand Density
The pile groups are installed in sand of different densities. Figures (10) to (11) show the
load-settlement curves for a (3x3) group embedded in loose, medium and dense sand,
respectively, while Figures (13) to (15) are plotted for (4x4) group.
75

Journal of Engineering and Development, Vol. 17, No.2, 2013, ISSN 1813- 7822
Table (4) Bearing capacity of rafts by Hansen’s equation.
Raft Size
(m)
(kN/m3)
N
s
Bearing
Capacity
(kN/m2)
Bearing Load
(kN)
0.025 x 0.06 16.5 420 127.8 1.17 30.75 0.05
0.025 x 0.09 16.5 420 127.8 1.11 29.29 0.07
0.025 x 0.133 16.5 420 127.8 1.08 28.34 0.09
0.06 x 0.06 16.5 420 127.8 1.4 88.57 0.32
0.06 x 0.09 16.5 420 127.8 1.27 80.13 0.43
0.06 x 0.133 16.5 420 127.8 1.18 74.68 0.60
0.09 x 0.09 16.5 420 127.8 1.4 132.85 1.08
0.09 x 0.133 16.5 420 127.8 1.27 120.58 1.44
0.133 x 0.133 16.5 420 127.8 1.4 196.32 3.47
Fig. (10) Load-settlement curve for (3x3) free standing pile group in loose
sand.
76

Journal of Engineering and Development, Vol. 17, No.2, 2013, ISSN 1813- 7822
Fig. (11) Load-settlement curve for (3x3) free standing pile group in medium
sand.
Fig. (12) Load-settlement curve for (3x3) free standing pile group in dense
sand.
77

Journal of Engineering and Development, Vol. 17, No.2, 2013, ISSN 1813- 7822
Fig. (13) Load-settlement curve for (4x4) free standing pile group in loose
sand.
Fig. (14) Load-settlement curve for (4x4) free standing pile group in medium
sand.
78

Journal of Engineering and Development, Vol. 17, No.2, 2013, ISSN 1813- 7822
Fig. (15) Load-settlement curve for (4x4) free standing pile group in dense
sand.
The effect of density on free standing pile group is clear; the load capacity increases by
increasing the sand density, and the effect of density on (4x4) pile group is greater than the
effect on (3x3) pile group.
The comparison of load-settlement curves for piles embedded in sands of different densities
is also presented in Figures (16) and (17) for (3x3) and (4x4) group, respectively. In Figure
(16), the increasing of ultimate load from loose to medium is about 25% and from medium to
dense is about 32%, while in Figure (17) the increasing of load from loose to medium is
about 55% and from medium to dense is about 10%.
It is shown that for comparison between (3x3) and (4x4) group, the ultimate load is
increased by 35%, 64% and 33% when the group is changed from (3x3) to (4x4) in loose,
medium, and dense sand, respectively. These results lead to the conclusion that the bearing
capacity factors are not linearly varying with the increase in the angle of internal friction but
they might be affected by the shape of the group.
79

Journal of Engineering and Development, Vol. 17, No.2, 2013, ISSN 1813- 7822
Fig. (16) Load-settlement curve for (3x3) different sand densities free
standing pile group.
Fig. (17) Load-settlement curve for (4x4) different sand densities free
standing pile group.
Selection of Failure Criterion
Several criteria have been proposed for defining the failure load of the foundations and
piles. Some of these criteria are described by Fellenius (2009) as follows:
Terzaghi (1947) proposal; where failure is defined as the load corresponding to
dispalcment of 10% of the model footing width (or pile diameter ).
De Beer (1968) proposal (as reported by Winterkorn and Fang, 1975). The
bearing capacity is taken at break point of two interesting straight lines of different
80

Journal of Engineering and Development, Vol. 17, No.2, 2013, ISSN 1813- 7822
slopes after plotting the load-settlement relationship in log-log plot. This break point
represents failure.
Tangent proposal; in which definition of failure is based on the intersection of the
two tangents of load-settelment curve, the first one is the upper flatter portion tangent
of the curve while the second is tangent to the lower flatter portion of the curve.
Chin-Kondner (1970) proposal; this method assumes that the load-settlement curve
is hyperbolic in shape when the failure load is approached. Each load value is divided
by its corresponding settlement value and the resulting value is plotted against the
settlement, the plotted value fall on a straight line, so the inverse of the slope of this
line is the Chin failure load.
Davisson (1972) proposal; the failure load is corresponding to the movement which
exceeds the elastic compression of the pile by a value of 0.15 inch (4 mm) plus a
factor equal to the diameter of the pile divided by 120.
Decourt (1999) proposal; a method by which each load is divided by its
corresponding settlement and the resulting value against the applied load. A linear
regression over the apparent line determines the line. Decourt identified the ultimate
load as intersection of this line with load axis.
The bearing capacities for rafts of different sizes are calculated using the previous
criteria and compared with those calculated by Hansen’s equation. The results are listed in
Table (6).
After examining the previous methods and by making a comparison of these methods
with Hansen equation for calculating the bearing capacity of the raft, it was found that
Decourt proposal can be adopted in specifying the ultimate capacity.
81

Journal of Engineering and Development, Vol. 17, No.2, 2013, ISSN 1813- 7822
Table (6) Different methods used for definition of failure of raft.
Raft
Size
(m)
Davisson
(kN)
Terzaghi
(kN)
Tangent
(kN)
Chin-
Kondner
(kN)
De Beer
(kN)
Decourt
(kN)
Bearing
capacity by
Hansen
Equation
(kN)
0.025 x
0.06 0.038 0.028 0.032 0.052 0.028 0.055
0.05
0.025 x
0.09 0.047 0.038 0.042 0.060 0.037 0.070
0.07
0.025 x
0.133 0.062 0.045 0.051 0.093 0.042 0.100
0.09
0.06 x
0.06 0.077 0.075 0.055 0.132 0.055 0.135
0.32
0.06 x
0.09 0.080 0.080 0.060 0.144 0.064 0.260
0.43
0.06 x
0.133 0.110 0.105 0.065 0.190 0.066 0.270
0.60
0.09 x
0.09 0.140 0.160 0.085 0.256 0.095 0.360
1.08
0.09 x
0.133 0.170 0.190 0.100 0.417 0.105 0.500
1.44
0.133 x
0.133 0.380 0.420 0.260 0.625 0.247 0.680
3.47
Load Carrying Capacity of Single Pile
In order to make a basic value for comparison, loading test was carried out on a single pile.
The load-settlement curve is presented in Figure (18).
82

Journal of Engineering and Development, Vol. 17, No.2, 2013, ISSN 1813- 7822
Fig. (18) Load-settlement curve for single pile.
Load Carrying Capacity of Free Standing Pile Groups
In order to make a comparison between the load carried by each pile and the summation of
loads carried by piles and the total load carried by the group, Figures (19) to (24) are drawn
for (1x2), (1x3), (1x4), (2x2), (2x3) and (2x4) group, respectively. It can be seen that the
load taken by the edge pile is approximately equal to (0.4-0.6) the load taken by the corner or
center pile, and the load carried by all piles approximately equals the external load (free
standing pile group load).
Figures (25) to (27) make a comparison between the load-settlement curves for the
center, edge and corner pile and the summation of loads carried by all these piles and actual
load carried by the free standing pile group for the cases of (3x3), (3x4) and (4x4) group,
respectively.
From these figures, it can be noticed that the load which goes to the center pile
approximately equals (2-2.25) the corner pile load, the load which goes to the edge pile
approximately equals (1.5-1.75) the corner pie load, and the summation of loads that all piles
carry is little bit less than the external load (free standing pile group load). This means that
the group works efficiently. In Figure (26) which deals with (3x4) group, it can be seen that
the load carried by the edge pile from short side is little greater than the load carried by edge
pile from long side.
83

Journal of Engineering and Development, Vol. 17, No.2, 2013, ISSN 1813- 7822
Fig. (19) Load-settlement curve for (1x2) free standing pile group.
Fig. (20) Load-settlement curve for (1x3) free standing pile group.
84

Journal of Engineering and Development, Vol. 17, No.2, 2013, ISSN 1813- 7822
Fig. (21) Load-settlement curve for (1x4) free standing pile group.
Fig. (22) Load-settlement curve for (2x2) free standing pile group.
85

Journal of Engineering and Development, Vol. 17, No.2, 2013, ISSN 1813- 7822
Fig. (23) Load-settlement curve for (2x3) free standing pile group.
Fig. (24) Load-settlement curve for (2x4) free standing pile group.
86

Journal of Engineering and Development, Vol. 17, No.2, 2013, ISSN 1813- 7822
Fig. (25) Load-settlement curve for (3x3) free standing pile group.
Fig. (26) Load-settlement curve for (3x4) free standing pile group.
87

Journal of Engineering and Development, Vol. 17, No.2, 2013, ISSN 1813- 7822
Fig. (27) Load-settlement curve for (4x4) free standing pile group.
Effect of sand density
In this section, (3x3) and (4x4) pile groups are selected to make a comparison between piles
embedded in sand of different densities. Figures (28) to (30) show the load-settlement
relationships for (3x3) group embedded in loose, medium and dense sand, respectively. It is
evident that the piled raft capacity increases by about 70%, when the sand is changed from
loose to dense, while the percent of load carried by raft (pile cap) is increased by about 26%.
Figures (31) to (33) are drawn for (4x4) pile group embedded in loose, medium and dense
sand, respectively. From Figures (28), (29) and (30), It can be concluded that the center pile
load equals 9 the corner pile load, the center pile load equals 2.8 the edge pile load. In
Figures (32) and (33), the center pile load equals 1.7 the corner pile load, while the center
pile load equals 1.25 the edge pile load. Figures (28) to (33) show difference between curves
representing (all piles+unpiled raft) and (piled raft) almost piled raft curve (external load) is
greater, this means that the pile raft works efficiently. These results are compatible with the
results of Hakam (2007) and Lutz (1993) who found that the efficiency of piled raft system is
greater than the sum of piles and raft capacities. Figures (28) to (33) show that by increasing
the sand density, the load carrying capacity is increased, and the effect of density is greater on
the (4x4) piled raft than on (3x3) piled raft. This may be reasoned by the footing size (cap)
which causes increase in bearing capacity.
88

Journal of Engineering and Development, Vol. 17, No.2, 2013, ISSN 1813- 7822
Fig. (28) Load-settlement curve for (3x3) piled raft in loose sand.
Fig. (29) Load-settlement curve for (3x3) piled raft in medium sand.
89

Journal of Engineering and Development, Vol. 17, No.2, 2013, ISSN 1813- 7822
Fig. (30) Load-settlement curve for (3x3) piled raft in dense sand.
Fig. (31) Load-settlement curve for (4x4) piled raft in loose sand.
90
Journal of Engineering and Development, Vol. 17, No.2, 2013, ISSN 1813- 7822
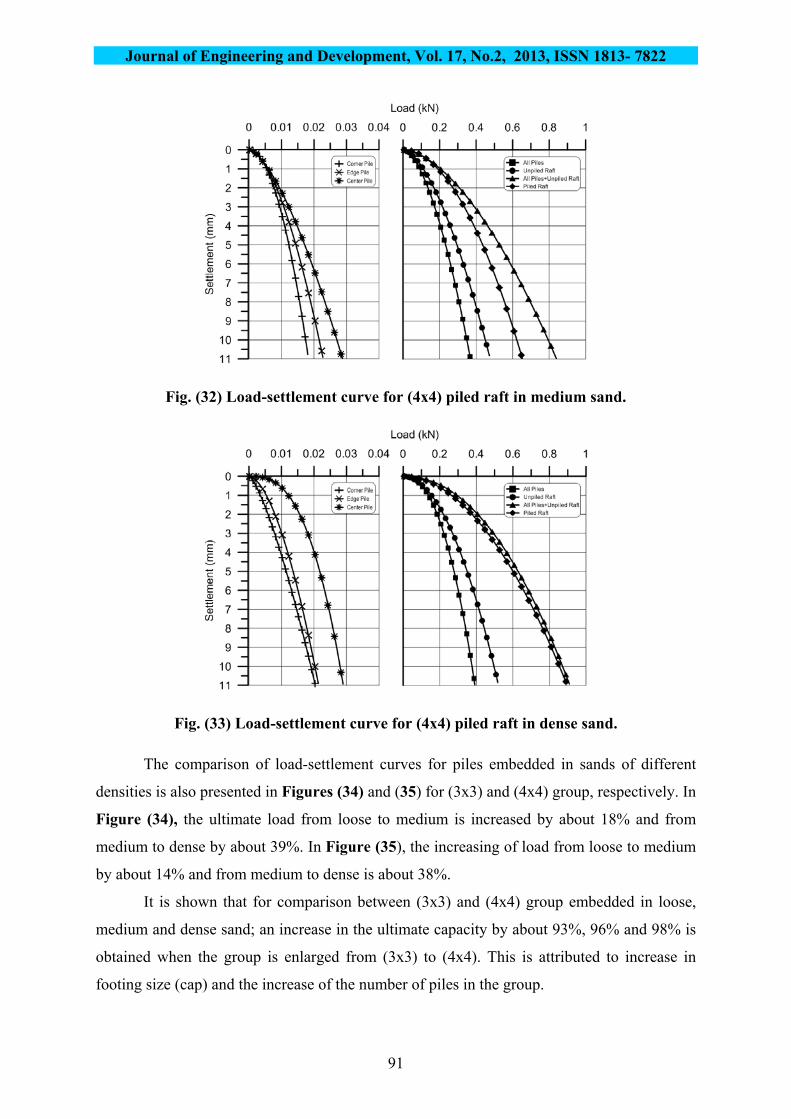
Fig. (32) Load-settlement curve for (4x4) piled raft in medium sand.
Fig. (33) Load-settlement curve for (4x4) piled raft in dense sand.
The comparison of load-settlement curves for piles embedded in sands of different
densities is also presented in Figures (34) and (35) for (3x3) and (4x4) group, respectively. In
Figure (34), the ultimate load from loose to medium is increased by about 18% and from
medium to dense by about 39%. In Figure (35), the increasing of load from loose to medium
by about 14% and from medium to dense is about 38%.
It is shown that for comparison between (3x3) and (4x4) group embedded in loose,
medium and dense sand; an increase in the ultimate capacity by about 93%, 96% and 98% is
obtained when the group is enlarged from (3x3) to (4x4). This is attributed to increase in
footing size (cap) and the increase of the number of piles in the group.
91

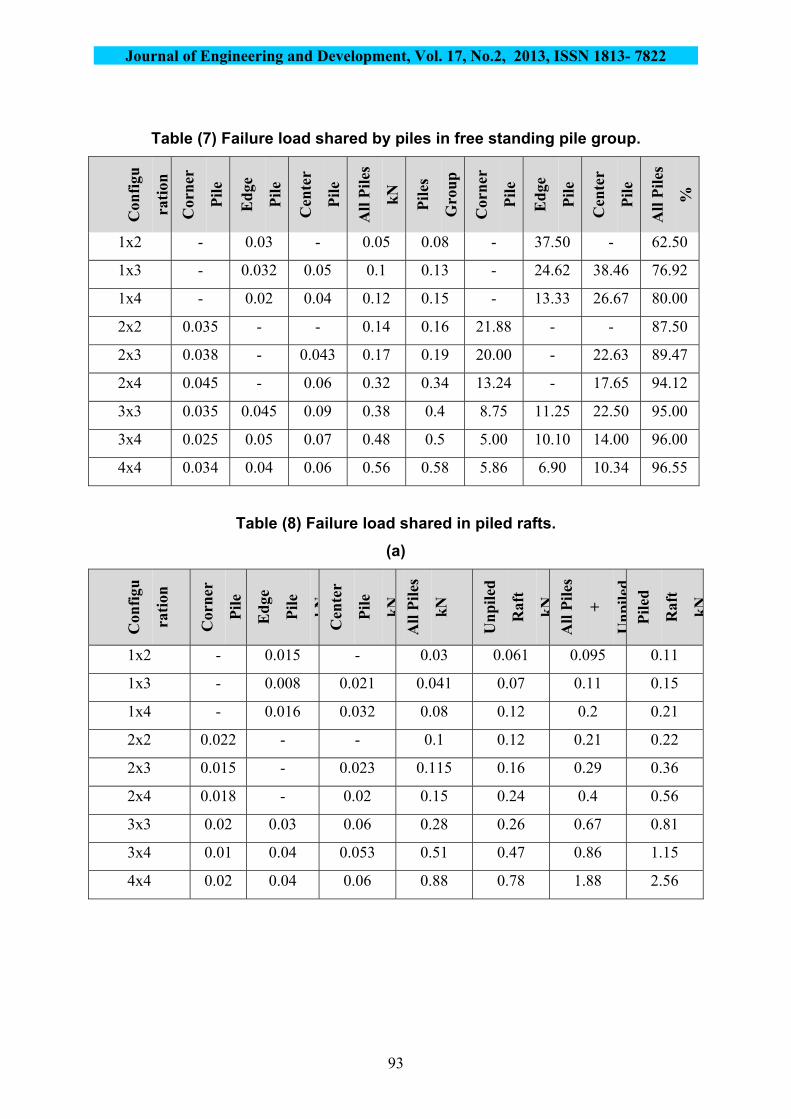
Journal of Engineering and Development, Vol. 17, No.2, 2013, ISSN 1813- 7822 Failure Load and Settlement
Based on the Decourt failure criterion, the failure load is calculated from the load-settlement
curves for each case. Sharing loads for all foundation elements are listed in Tables (7) and
(8) for free standing pile group and piled raft, respectively.
Fig. (34) Load-settlement curve for (3x3) piled raft embedded on sands of
different densities.
Fig. (35) Load-settlement curve for (4x4) embedded on sands of different
densities.
92
Journal of Engineering and Development, Vol. 17, No.2, 2013, ISSN 1813- 7822
Table (7) Failure load shared by piles in free standing pile group.
Con
figu
rati
on
Cor
ner
Pil
e
Ed
ge
Pil
e
Cen
ter
Pil
e
All
Pil
es
kN
Pil
es
Gro
up
Cor
ner
Pil
e
Ed
ge
Pil
e
Cen
ter
Pil
e
All
Pil
es
%
1x2 - 0.03 - 0.05 0.08 - 37.50 - 62.50
1x3 - 0.032 0.05 0.1 0.13 - 24.62 38.46 76.92
1x4 - 0.02 0.04 0.12 0.15 - 13.33 26.67 80.00
2x2 0.035 - - 0.14 0.16 21.88 - - 87.50
2x3 0.038 - 0.043 0.17 0.19 20.00 - 22.63 89.47
2x4 0.045 - 0.06 0.32 0.34 13.24 - 17.65 94.12
3x3 0.035 0.045 0.09 0.38 0.4 8.75 11.25 22.50 95.00
3x4 0.025 0.05 0.07 0.48 0.5 5.00 10.10 14.00 96.00
4x4 0.034 0.04 0.06 0.56 0.58 5.86 6.90 10.34 96.55
Table (8) Failure load shared in piled rafts.
(a)
Con
figu
rati
on
Cor
ner
Pil
e
Ed
ge
Pil
e
kN
Cen
ter
Pil
e
kN
All
Pil
es
kN
Un
pil
ed
Raf
t
kN
All
Pil
es
+
Un
pil
edP
iled
Raf
t
kN
1x2 - 0.015 - 0.03 0.061 0.095 0.11
1x3 - 0.008 0.021 0.041 0.07 0.11 0.15
1x4 - 0.016 0.032 0.08 0.12 0.2 0.21
2x2 0.022 - - 0.1 0.12 0.21 0.22
2x3 0.015 - 0.023 0.115 0.16 0.29 0.36
2x4 0.018 - 0.02 0.15 0.24 0.4 0.56
3x3 0.02 0.03 0.06 0.28 0.26 0.67 0.81
3x4 0.01 0.04 0.053 0.51 0.47 0.86 1.15
4x4 0.02 0.04 0.06 0.88 0.78 1.88 2.56
93

Journal of Engineering and Development, Vol. 17, No.2, 2013, ISSN 1813- 7822
(b)
Configuration Corner
Pile
%
Edge
Pile
%
Center
Pile
%
All
Piles
%
Unpiled
Raft
%
1x2 - 13.64 - 27.27 55.45
1x3 - 5.33 14.00 27.33 46.67
1x4 - 7.62 15.24 38.10 57.14
2x2 10.00 - - 45.45 54.55
2x3 4.17 - 6.39 31.94 44.44
2x4 3.21 - 3.57 26.79 42.86
3x3 2.47 3.70 7.41 34.57 32.10
3x4 0.87 3.48 4.61 44.35 40.87
4x4 0.78 1.56 2.34 34.38 30.47
Conclusions
1. For free standing piles in a group, the load taken by the edge pile is approximately equal
to (0.4-0.6) the load carried by the corner or center pile. This percent increases for groups
of greater number of piles. The load carried by the edge pile from short side is little
greater than the load carried by edge pile from long side.
2. When the raft (pile cap) becomes larger, the failure load increases and the settlement
decreases. This effect was found greater on the piled raft foundation than the raft or free
standing pile group.
3. When the number of piles within the group is small (less than 4), there is no evident
contribution of the raft to the load carrying capacity. The failure load for a piled raft
consisting of (9) piles is greater by about one time than free standing pile group
containing the same number of piles. This difference increases to about 4 times for (16)
pile group.
4. The piles work as settlement reducers effectively when the number of piles is greater than
(6) than when the number of piles is less than (6). The settlement can be increased by
about 8 times in (1x2) free standing pile group compared to the piled raft of the same
configuration. The effect of piled raft on reducing the settlement vanishes when the
94
Journal of Engineering and Development, Vol. 17, No.2, 2013, ISSN 1813- 7822
number of piles exceeds (6). This means that as the number of piles increases further, the
decrease in settlement becomes smaller and it is not economical to make use of piles as
settlement reducers.
5. For piled rafts (3x3) and (4x4) embedded in loose, medium and dense sand; an increase in
the ultimate capacity by about 93%, 96% and 98% is obtained when the group is enlarged
from (3x3) to (4x4). This is attributed to increase in footing size (cap) and the increase of
the number of piles in the group.
References
1. ASTM D3080-1998, “Standard Test Method for Direct Shear Test of Soils under
Consolidated Drained Conditions”, American Society of Testing and Materials.
2. ASTM D422-2001, “Standard Test Method for Particle Size-Analysis of Soils”,
American Society for Testing and Material.
3. ASTM D4253-2000, “Standard Test Method for Maximum Index Density and
Unit Weight of Soils Using a Vibratory Table”, American Society for Testing and
Materials.
4. ASTM D4254-2000, “Standard Test Method for Minimum Index Density and
Unit Weight of Soils and Calculation of Relative Density”, American Society for
Testing and Materials.
5. ASTM D854-2005, “Standard Test Method for Specific Gravity of Soil Solids by
Water Pycnometer”, American Society for Testing and Materials.
6. Bieganousky, W. N. and Marcuson, W. F. (1976),"Uniform Placement of Sand",
Journal of Geotechnical Engineering Div., ASCE, Vol. 102, No. GT.3, pp.229-233.
7. Fellenius, B.H., (2009), “Basics of Foundation Design”, Book Electronic Edition
www.Fellenius.net , 346p.
8. Hakam, A., (2007), "Estimation of Bearing Capacity of Floating Raft-Pile",
TEKNIKA, No. 28 Vol.1 Thn. XIV November 2007, School of Civil Engineering -
UNAND.
9. Hansen, B., (1970), “A Revised and Extended Formula for Bearing Capacity”,
Bulletin of the Danish Geotechnical Institute, Copenhagen, No. 28.
10. Hartman, F. and Jahn, P. (2001), “Boundary Element Analysis of Raft Foundations
on Piles”, Meccanica Vol. 3, pp. 351–366, Kluwer Academic Publishers.
Netherlands.
95

Journal of Engineering and Development, Vol. 17, No.2, 2013, ISSN 1813- 7822
96
11. Lutz B., (1993), "Piled-Raft-Foundations for Higb-Rise Buildings on Francfort Clay",
7th Young Geotechnical Engineers” Conference, Organised by the German
Geotechnical Society.
12. Poulos, H.G., (2001), “Methods of Analysis of Piled Raft Foundations”, a Report
prepared on Behalf of Technical Committee TC18 on Piled Foundations, International
Society of Soil Mechanics and Geotechnical Engineering.
13. Turner, J. P. and Kulhawy, F. H. (1987), “Experimental Analysis of Drilled
Foundations Subjected to Repeated Axial Loads Under Drained Conditions”,
Report EL-5325, Electric Power Research Institute, Palo Alto, California.
14. Winterkorn, H.F., and Hsai-Yang Fang., (1975), “Foundation Engineering Hand
Book”, Van Nostrand Reinhold Company, New York.
15. Yilmaz, B., (2010), "An Analytical and Experimental Study on Piled Raft
Foundations", MSc. Thesis, Middle East Technical University, Ankara.