bea union investment series
TRANSCRIPT

Interim Report (Unaudited)
For the period ended 30 June 2021
BEA Union Investment Series
BEA Union Investment Asian Bond and Currency Fund
BEA Union Investment China A-Share Equity Fund
BEA Union Investment Asian Pacific Multi Income Fund
BEA Union Investment China Phoenix Fund
BEA Union Investment RMB Core Bond Fund
BEA Union Investment Asia Pacific Flexi Allocation Fund
BEA Union Investment Global Flexi Allocation Fund
BEA Union Investment China High Yield Income Fund
BEA Union Investment Asian Strategic Bond Fund
BEA Union Investment Asian Opportunities Fund (formerly known as BEA Union Investment Asia Pacific Equity Dividend Fund)
BEA Union Investment China Gateway Fund
BEA Union Investment Asian Bond Target Maturity Fund 2022
BEA Union Investment Asian Corporate Target Maturity Fund 2023
BEA Union Investment Asian Bond Target Maturity Fund 2023

BEA UNION INVESTMENT SERIESFOR THE PERIOD ENDED 30 JUNE 2021
CONTENTS PAGE(S)
INVESTMENT REPORT 1-74
HOLDINGS OF COLLATERAL 75-76
STATEMENT OF COMPREHENSIVE INCOME 77-79
STATEMENT OF ASSETS AND LIABILITIES 80-85
STATEMENT OF CHANGES IN NET ASSETS ATTRIBUTABLE TO UNITHOLDERS 86-93
MANAGEMENT AND ADMINISTRATION
EAM017-IT (2021)
Note:The unaudited interim financial statements have been prepared in accordance with all applicable Hong Kong Financial Reporting Standards (“HKFRSs”), which collective term includes all applicable individual Hong Kong Financial Reporting Standards, Hong Kong Accounting Standards (“HKASs”) and Interpretations issued by the Hong Kong Institute of Certified Public Accountants (“HKICPA”), accounting principles generally accepted in Hong Kong, the relevant provisions of the Trust Deed, as amended, and the relevant provisions of the Code issued by the HKSFC.
The accounting policies applied are consistent with those described in the Notes to the Financial Statements of the annual financial statement.

2
A5請縮小打印70.5%
BEA UNION INVESTMENT SERIES
INVESTMENT REPORTAS AT 30 JUNE 2021 (UNAUDITED) (CONTINUED)
BEA UNION INVESTMENT SERIES
INVESTMENT REPORTAS AT 30 JUNE 2021 (UNAUDITED)
1
A5請縮小打印70.5%
Investment portfolio
BEA Union Investment Asian Bond and Currency Fund
Nominal value Market value % of net assetsUS$
Listed/quoted investments (98.89%)
Debt securities (98.90%)
Denominated in Renminbi (0.74%)
Export-Import Bank of Korea 2.80% 03/03/2024 13,000,000 2,035,707 0.25
HSBC Holdings PLC 3.40% 29/06/2027 10,000,000 1,558,578 0.19Vanke Real Estate Hong Kong Co Ltd 3.45%
25/05/2024 16,000,000 2,500,884 0.30
Denominated in Singapore Dollar (0.11%)
Lippo Malls Indonesia Retail Trust 7.00% Perpetual Callable – 27/09/2021 1,500,000 946,754 0.11
Denominated in United States Dollar (98.05%)
ABJA Investment Co Pte Ltd 5.45% 24/01/2028 5,500,000 6,067,314 0.73
ABJA Investment Co Pte Ltd 5.95% 31/07/2024 7,800,000 8,641,908 1.04
Adani Green Energy UP Ltd 6.25% 10/12/2024 6,200,000 6,904,976 0.83Adaro Indonesia PT 4.25% 31/10/2024 5,000,000 5,208,207 0.63Agile Group Holdings Ltd 5.75% 02/01/2025 1,300,000 1,357,083 0.16Anton Oilfield Services Group/Hong Kong
7.50% 02/12/2022 1,000,000 994,192 0.12Azure Power Solar Energy Pvt Ltd 5.65%
24/12/2024 4,700,000 5,006,903 0.60Bangkok Bank PCL/Hong Kong 5.00%
Perpetual Callable – 23/09/2025 2,200,000 2,356,422 0.28Bank Negara Indonesia Persero Tbk PT 3.75%
30/03/2026 3,000,000 3,098,457 0.37Bank Tabungan Negara Persero Tbk PT 4.20%
23/01/2025 2,000,000 2,087,947 0.25Bukit Makmur Mandiri Utama PT 7.75%
10/02/2026 700,000 739,168 0.09Champion Path Holdings Ltd 4.50%
27/01/2026 6,100,000 6,468,806 0.78Champion Path Holdings Ltd 4.85%
27/01/2028 4,500,000 4,792,577 0.58Champion Sincerity Holdings Ltd 8.125%
Perpetual Callable – 08/02/2022 2,300,000 2,445,646 0.30China Aoyuan Group Ltd 5.375% 13/09/2022 4,650,000 4,579,808 0.55China Aoyuan Group Ltd 7.95% 19/02/2023 1,500,000 1,533,780 0.18China Aoyuan Group Ltd 7.95% 21/06/2024 2,000,000 1,948,817 0.24
Nominal value Market value % of net assetsUS$
Listed/quoted investments (98.89%) (continued)
Debt securities (98.90%) (continued)
Denominated in United States Dollar (98.05%) (continued)
China Aoyuan Group Ltd 8.50% 23/01/2022 2,200,000 2,296,482 0.28China Evergrande Group 8.25% 23/03/2022 10,000,000 8,789,583 1.06China Evergrande Group 8.75% 28/06/2025 3,000,000 2,003,217 0.24China Evergrande Group 9.50% 11/04/2022 9,100,000 7,986,352 0.96China Evergrande Group 11.50% 22/01/2023 2,000,000 1,700,043 0.20China Hongqiao Group Ltd 6.25% 08/06/2024 2,400,000 2,453,503 0.30China Oil & Gas Group Ltd 4.70% 30/06/2026 3,500,000 3,559,502 0.43China Oil & Gas Group Ltd 5.50% 25/01/2023 2,000,000 2,102,787 0.25China SCE Group Holdings Ltd 5.875%
10/03/2022 8,285,000 8,536,653 1.03China SCE Group Holdings Ltd 7.25%
19/04/2023 8,800,000 9,200,400 1.11China SCE Group Holdings Ltd 7.375%
09/04/2024 2,000,000 2,108,337 0.25Chong Hing Bank Ltd 5.70% Perpetual Callable
– 15/07/2024 5,900,000 6,343,523 0.77CIFI Holdings Group Co Ltd 4.45% 17/08/2026 5,000,000 5,016,444 0.61CIFI Holdings Group Co Ltd 5.95% 20/10/2025 2,700,000 2,893,090 0.35CIFI Holdings Group Co Ltd 6.45% 07/11/2024 3,000,000 3,209,895 0.39CIFI Holdings Group Co Ltd 6.55% 28/03/2024 1,425,000 1,524,124 0.18Clean Renewable Power Mauritius Pte Ltd
4.25% 25/03/2027 1,100,000 1,133,576 0.14Cliffton Ltd 6.25% 25/10/2025 11,000,000 11,053,753 1.33CNAC HK Finbridge Co Ltd 3.00% 22/09/2030 1,950,000 1,947,172 0.23CNAC HK Finbridge Co Ltd 4.125% 19/07/2027 2,000,000 2,207,905 0.27Continuum Energy Levanter Pte Ltd 4.50%
09/02/2027 4,000,000 4,180,720 0.50Delhi International Airport Ltd 6.125%
03/02/2022 1,500,000 1,548,931 0.19Delhi International Airport Ltd 6.125%
31/10/2026 3,000,000 3,107,275 0.38Delhi International Airport Ltd 6.45%
04/06/2029 450,000 459,035 0.06Easy Tactic Ltd 5.75% 13/01/2022 6,800,000 6,838,919 0.83Easy Tactic Ltd 5.875% 13/02/2023 300,000 273,597 0.03Easy Tactic Ltd 8.125% 27/02/2023 3,700,000 3,564,603 0.43Easy Tactic Ltd 8.875% 27/09/2021 4,100,000 4,201,941 0.51Easy Tactic Ltd 9.125% 28/07/2022 700,000 720,714 0.09Easy Tactic Ltd 11.75% 02/08/2023 7,700,000 7,962,277 0.96Fantasia Holdings Group Co Ltd 6.95%
17/12/2021 4,600,000 4,459,331 0.54
Investment portfolio (continued)
BEA Union Investment Asian Bond and Currency Fund (continued)

3 4
A5請縮小打印70.5% A5請縮小打印70.5%
BEA UNION INVESTMENT SERIES
INVESTMENT REPORTAS AT 30 JUNE 2021 (UNAUDITED) (CONTINUED)
BEA UNION INVESTMENT SERIES
INVESTMENT REPORTAS AT 30 JUNE 2021 (UNAUDITED) (CONTINUED)
Nominal value Market value % of net assetsUS$
Listed/quoted investments (98.89%) (continued)
Debt securities (98.90%) (continued)
Denominated in United States Dollar (98.05%) (continued)
Fantasia Holdings Group Co Ltd 11.75% 17/04/2022 3,750,000 3,630,835 0.44
Fantasia Holdings Group Co Ltd 15.00% 18/12/2021 3,850,000 3,860,998 0.47
Fortune Star BVI Ltd 5.00% 18/05/2026 4,800,000 4,898,411 0.59Fortune Star BVI Ltd 5.05% 27/01/2027 1,350,000 1,392,785 0.17Fortune Star BVI Ltd 5.95% 19/10/2025 7,050,000 7,507,545 0.91Fortune Star BVI Ltd 6.75% 02/07/2023 5,700,000 6,195,743 0.75Fortune Star BVI Ltd 6.85% 02/07/2024 3,100,000 3,424,910 0.41GMR Hyderabad International Airport Ltd 4.75%
02/02/2026 7,300,000 7,581,413 0.92GMR Hyderabad International Airport Ltd
5.375% 10/04/2024 5,500,000 5,776,011 0.70Golden Eagle Retail Group Ltd 4.625%
21/05/2023 7,400,000 7,547,178 0.91Greenko Dutch BV 3.85% 29/03/2026 2,100,000 2,178,538 0.26Greenko Solar Mauritius Ltd 5.55% 29/01/2025 6,100,000 6,427,407 0.78Greenko Solar Mauritius Ltd 5.95% 29/07/2026 6,800,000 7,514,763 0.91Greentown China Holdings Ltd 5.65%
13/07/2025 2,500,000 2,660,567 0.32Health & Happiness H&H International Holdings
Ltd 5.625% 24/10/2024 950,000 993,946 0.12Hong Seng Ltd 9.875% 27/08/2022 700,000 732,462 0.09Honghua Group Ltd 6.375% 01/08/2022 3,000,000 3,015,904 0.36HPCL-Mittal Energy Ltd 5.25% 28/04/2027 1,000,000 1,054,567 0.13IIFL Finance Ltd 5.875% 20/04/2023 9,400,000 9,339,058 1.13India Green Energy Holdings 5.375%
29/04/2024 4,200,000 4,453,247 0.54India Green Power Holdings 4.00% 22/02/2027 7,400,000 7,562,899 0.91Indiabulls Housing Finance Ltd 6.375%
28/05/2022 8,600,000 8,259,128 1.00Indika Energy Capital III Pte Ltd 5.875%
09/11/2024 9,500,000 9,724,733 1.17Indika Energy Capital IV Pte Ltd 8.25%
22/10/2025 13,700,000 14,774,114 1.78Jababeka International BV 6.50% 05/10/2023 2,300,000 2,293,808 0.28JSW Hydro Energy Ltd 4.125% 18/05/2031 5,900,000 6,022,172 0.73JSW Steel Ltd 5.375% 04/04/2025 3,000,000 3,242,189 0.39Kaisa Group Holdings Ltd 8.50% 30/06/2022 7,900,000 7,893,886 0.95Kaisa Group Holdings Ltd 9.375% 30/06/2024 3,800,000 3,586,214 0.43Kaisa Group Holdings Ltd 9.75% 28/09/2023 2,100,000 2,123,746 0.26Kaisa Group Holdings Ltd 10.50% 15/01/2025 4,000,000 3,963,107 0.48
Nominal value Market value % of net assetsUS$
Listed/quoted investments (98.89%) (continued)
Debt securities (98.90%) (continued)
Denominated in United States Dollar (98.05%) (continued)
Kaisa Group Holdings Ltd 10.875% 23/07/2023 750,000 788,017 0.10
Kaisa Group Holdings Ltd 11.25% 09/04/2022 3,100,000 3,257,960 0.39Kaisa Group Holdings Ltd 11.25% 16/04/2025 2,000,000 1,948,795 0.24Kaisa Group Holdings Ltd 11.50% 30/01/2023 6,900,000 7,327,566 0.88Kaisa Group Holdings Ltd 11.65% 01/06/2026 3,000,000 2,844,325 0.34Kaisa Group Holdings Ltd 11.70% 11/11/2025 3,500,000 3,362,450 0.41Kaisa Group Holdings Ltd 11.95% 22/10/2022 5,600,000 5,906,791 0.71Kaisa Group Holdings Ltd 11.95% 12/11/2023 2,600,000 2,706,068 0.33Kasikornbank PCL/Hong Kong 5.275%
Perpetual Callable – 14/10/2025 3,000,000 3,223,778 0.39Krung Thai Bank PCL/Cayman Islands 4.40%
Perpetual Callable – 25/03/2026 3,000,000 3,081,100 0.37KWG Group Holdings Ltd 5.20% 21/09/2022 200,000 204,973 0.02KWG Group Holdings Ltd 5.875% 10/11/2024 4,200,000 4,273,806 0.52KWG Group Holdings Ltd 5.95% 10/08/2025 500,000 510,422 0.06KWG Group Holdings Ltd 7.40% 05/03/2024 1,200,000 1,282,613 0.15KWG Group Holdings Ltd 7.875% 01/09/2023 2,900,000 3,044,159 0.37LMIRT Capital Pte Ltd 7.25% 19/06/2024 4,700,000 4,924,127 0.59LMIRT Capital Pte Ltd 7.50% 09/02/2026 12,250,000 13,081,571 1.58Logan Group Co Ltd 4.85% 14/12/2026 3,200,000 3,223,905 0.39Logan Group Co Ltd 5.25% 23/02/2023 4,000,000 4,073,687 0.49Logan Group Co Ltd 5.25% 19/10/2025 2,000,000 2,079,460 0.25Logan Group Co Ltd 6.50% 16/07/2023 4,230,000 4,459,104 0.54Marble II Pte Ltd 5.30% 20/06/2022 2,700,000 2,711,824 0.33Medco Bell Pte Ltd 6.375% 30/01/2027 2,700,000 2,864,347 0.35Medco Oak Tree Pte Ltd 7.375% 14/05/2026 9,000,000 9,929,686 1.20Medco Platinum Road Pte Ltd 6.75%
30/01/2025 13,000,000 14,014,812 1.69Melco Resorts Finance Ltd 5.25% 26/04/2026 2,400,000 2,519,806 0.30Melco Resorts Finance Ltd 5.375% 04/12/2029 2,600,000 2,755,795 0.33Melco Resorts Finance Ltd 5.625% 17/07/2027 3,900,000 4,188,580 0.51Melco Resorts Finance Ltd 5.75% 21/07/2028 2,100,000 2,276,013 0.27MGM China Holdings Ltd 5.25% 18/06/2025 500,000 521,358 0.06MGM China Holdings Ltd 5.875% 15/05/2026 6,710,000 7,100,703 0.86Minejesa Capital BV 4.625% 10/08/2030 2,000,000 2,161,829 0.26Modern Land China Co Ltd 11.50%
13/11/2022 1,550,000 1,578,809 0.19Modern Land China Co Ltd 11.80%
26/02/2022 6,300,000 6,464,066 0.78Modern Land China Co Ltd 12.85%
25/10/2021 2,050,000 2,108,504 0.25
Investment portfolio (continued)
BEA Union Investment Asian Bond and Currency Fund (continued)
Investment portfolio (continued)
BEA Union Investment Asian Bond and Currency Fund (continued)

5 6
A5請縮小打印70.5% A5請縮小打印70.5%
BEA UNION INVESTMENT SERIES
INVESTMENT REPORTAS AT 30 JUNE 2021 (UNAUDITED) (CONTINUED)
BEA UNION INVESTMENT SERIES
INVESTMENT REPORTAS AT 30 JUNE 2021 (UNAUDITED) (CONTINUED)
Nominal value Market value % of net assetsUS$
Listed/quoted investments (98.89%) (continued)
Debt securities (98.90%) (continued)
Denominated in United States Dollar (98.05%) (continued)
Nanyang Commercial Bank Ltd 5.00% Perpetual Callable – 02/06/2022 8,400,000 8,487,593 1.02
New Metro Global Ltd 4.80% 15/12/2024 3,300,000 3,333,308 0.40New Metro Global Ltd 5.00% 08/08/2022 1,000,000 1,030,141 0.12New Metro Global Ltd 6.50% 20/05/2022 2,000,000 2,059,646 0.25New Metro Global Ltd 6.80% 05/08/2023 3,000,000 3,208,523 0.39New Metro Global Ltd 7.50% 20/03/2022 300,000 313,084 0.04NWD Finance BVI Ltd 4.125% Perpetual
Callable – 10/03/2028 2,400,000 2,432,823 0.29Pakuwon Jati Tbk PT 4.875% 29/04/2028 5,900,000 6,211,908 0.75Perenti Finance Pty Ltd 6.50% 07/10/2025 2,800,000 2,995,935 0.36Periama Holdings LLC/DE 5.95% 19/04/2026 14,800,000 16,281,184 1.97Powerlong Real Estate Holdings Ltd 3.90%
13/04/2022 4,300,000 4,332,816 0.52Powerlong Real Estate Holdings Ltd 5.95%
30/04/2025 2,700,000 2,817,941 0.34Powerlong Real Estate Holdings Ltd 6.25%
10/08/2024 1,800,000 1,912,427 0.23Powerlong Real Estate Holdings Ltd 6.95%
23/07/2023 4,600,000 4,894,137 0.59Powerlong Real Estate Holdings Ltd 7.125%
08/11/2022 1,800,000 1,892,069 0.23Radiance Capital Investments Ltd 8.80%
17/09/2023 1,400,000 1,449,787 0.18Radiance Capital Investments Ltd 10.50%
16/01/2022 2,020,000 2,156,744 0.26Radiance Capital Investments Ltd 11.75%
31/10/2021 4,500,000 4,677,344 0.56Redco Properties Group Ltd 8.50%
19/08/2021 2,500,000 2,581,926 0.31Redsun Properties Group Ltd 9.95%
11/04/2022 1,000,000 1,036,181 0.13ReNew Power Pvt Ltd 5.875% 05/03/2027 8,900,000 9,739,854 1.18ReNew Power Pvt Ltd 6.45% 27/09/2022 3,000,000 3,162,958 0.38ReNew Power Synthetic 6.67% 12/03/2024 6,000,000 6,446,012 0.78ReNew Wind Energy AP2 4.50% 14/07/2028 2,300,000 2,368,873 0.29RKPF Overseas 2019 A Ltd 6.70% 30/09/2024 600,000 647,914 0.08Ronshine China Holdings Ltd 5.25%
03/12/2021 2,000,000 1,988,647 0.24Ronshine China Holdings Ltd 5.50%
01/02/2022 2,000,000 2,015,468 0.24Ronshine China Holdings Ltd 10.50%
01/03/2022 4,600,000 4,821,904 0.58
Nominal value Market value % of net assetsUS$
Listed/quoted investments (98.89%) (continued)
Debt securities (98.90%) (continued)
Denominated in United States Dollar (98.05%) (continued)
Shriram Transport Finance Co Ltd 4.40% 13/03/2024 4,000,000 4,100,253 0.49
Shriram Transport Finance Co Ltd 5.10% 16/07/2023 3,000,000 3,120,285 0.38
Shriram Transport Finance Co Ltd 5.70% 27/02/2022 2,000,000 2,064,047 0.25
Shriram Transport Finance Co Ltd 5.95% 24/10/2022 4,700,000 4,869,499 0.59
Shui On Development Holding Ltd 6.15% 24/08/2024 300,000 318,227 0.04
Sinic Holdings Group Co Ltd 8.50% 24/01/2022 500,000 477,512 0.06
Sinic Holdings Group Co Ltd 9.50% 18/10/2021 4,050,000 4,015,940 0.48
SoftBank Group Corp 4.625% 06/07/2028 8,700,000 8,700,000 1.05SoftBank Group Corp 5.25% 06/07/2031 7,300,000 7,300,000 0.88Sri Lanka Government International Bond
5.75% 18/04/2023 7,000,000 5,362,278 0.65Sri Lanka Government International Bond
6.85% 14/03/2024 4,500,000 3,226,814 0.39Studio City Finance Ltd 6.00% 15/07/2025 9,700,000 10,484,019 1.27Studio City Finance Ltd 6.50% 15/01/2028 4,500,000 4,952,710 0.60Sunac China Holdings Ltd 5.95% 26/04/2024 6,800,000 6,884,647 0.83Sunac China Holdings Ltd 6.50% 09/07/2023 4,000,000 4,215,542 0.51Sunac China Holdings Ltd 7.25% 14/06/2022 6,400,000 6,588,951 0.80Sunac China Holdings Ltd 7.50% 01/02/2024 500,000 528,435 0.06Sunac China Holdings Ltd 7.95% 08/08/2022 1,300,000 1,373,540 0.17Sunac China Holdings Ltd 8.35% 19/04/2023 7,700,000 8,107,869 0.98Theta Capital Pte Ltd 6.75% 31/10/2026 1,600,000 1,593,932 0.19Theta Capital Pte Ltd 8.125% 22/01/2025 12,300,000 13,223,428 1.60Times China Holdings Ltd 5.55% 04/06/2024 4,800,000 4,833,948 0.58Times China Holdings Ltd 6.60% 02/03/2023 5,850,000 5,985,564 0.72Times China Holdings Ltd 6.75% 08/07/2025 1,400,000 1,467,085 0.18Times China Holdings Ltd 7.625% 21/02/2022 470,000 488,901 0.06TMBThanachart Bank PCL 4.90% Perpetual
Callable – 02/12/2024 1,850,000 1,891,564 0.23TML Holdings Pte Ltd 4.35% 09/06/2026 2,400,000 2,421,812 0.29Vedanta Resources Finance II PLC 8.00%
23/04/2023 8,400,000 8,104,161 0.98Vedanta Resources Finance II PLC 13.875%
21/01/2024 7,800,000 9,089,880 1.10Vedanta Resources Ltd 6.375% 30/07/2022 22,000,000 22,361,011 2.70
Investment portfolio (continued)
BEA Union Investment Asian Bond and Currency Fund (continued)
Investment portfolio (continued)
BEA Union Investment Asian Bond and Currency Fund (continued)

7 8
A5請縮小打印70.5% A5請縮小打印70.5%
BEA UNION INVESTMENT SERIES
INVESTMENT REPORTAS AT 30 JUNE 2021 (UNAUDITED) (CONTINUED)
BEA UNION INVESTMENT SERIES
INVESTMENT REPORTAS AT 30 JUNE 2021 (UNAUDITED) (CONTINUED)
Nominal value Market value % of net assetsUS$
Listed/quoted investments (98.89%) (continued)
Debt securities (98.90%) (continued)
Denominated in United States Dollar (98.05%) (continued)
Vedanta Resources Ltd 7.125% 31/05/2023 6,000,000 5,607,730 0.68West China Cement Ltd 4.95% 08/07/2026 4,200,000 4,257,750 0.51Woori Bank 4.25% Perpetual Callable –
04/10/2024 1,500,000 1,575,466 0.19Wynn Macau Ltd 5.50% 15/01/2026 7,180,000 7,702,138 0.93Wynn Macau Ltd 5.50% 01/10/2027 2,300,000 2,433,906 0.29Wynn Macau Ltd 5.625% 26/08/2028 1,050,000 1,119,448 0.14Yango Justice International Ltd 5.30%
11/01/2022 2,000,000 2,021,061 0.24Yango Justice International Ltd 10.25%
18/03/2022 5,860,000 6,069,767 0.73Yanlord Land HK Co Ltd 6.75% 23/04/2023 1,500,000 1,575,810 0.19Yanlord Land HK Co Ltd 6.80% 27/02/2024 2,860,000 3,078,510 0.37Yes Bank Ifsc Banking Unit Branch 3.75%
06/02/2023 5,000,000 5,036,571 0.61Yuzhou Group Holdings Co Ltd 6.00%
25/01/2022 1,000,000 1,004,990 0.12Yuzhou Group Holdings Co Ltd 6.00%
25/10/2023 1,500,000 1,333,980 0.16Yuzhou Group Holdings Co Ltd 8.375%
30/10/2024 6,000,000 5,455,746 0.66Yuzhou Group Holdings Co Ltd 8.50%
04/02/2023 2,400,000 2,353,892 0.28Yuzhou Group Holdings Co Ltd 8.50%
26/02/2024 4,300,000 4,062,786 0.49Yuzhou Group Holdings Co Ltd 8.625%
23/01/2022 1,400,000 1,454,718 0.18Zhenro Properties Group Ltd 5.98%
13/04/2022 3,500,000 3,551,186 0.43Zhenro Properties Group Ltd 8.70%
03/08/2022 4,500,000 4,777,635 0.58Zhenro Properties Group Ltd 10.25%
Perpetual Callable – 25/01/2022 200,000 212,457 0.03 Total debt securities 819,225,259 98.90
Underlying Counterparty
Notional amount of contracts outstanding Fair value % of net assets
US$
Bond future (-0.01%)
The United States of America (-0.01%)
US 10Yr Note Future 21/09/2021 Citibank, Hong Kong (120) (62,665) (0.01)
Total bond future (62,665) (0.01) Total investments 819,162,594 98.89
Foreign currency forward contracts (-0.07%)
Buy Australian Dollars/sell United States Dollars Citibank, Hong Kong AU$10,456,398 (72,180) (0.01)
Buy Australian Dollars/sell United States Dollars Citibank, Hong Kong AU$4,416 (36) (0.00)
Buy British Pound/sell United States Dollars Citibank, Hong Kong GBP 6,000,000 (212,352) (0.02)
Buy British Pound/sell United States Dollars Citibank, Hong Kong GBP 6,000,000 (165,012) (0.02)
Buy Canadian Dollars/sell United States Dollars Citibank, Hong Kong CA$10,000,000 (56,466) (0.01)
Buy Euro/sell United States Dollars Citibank, Hong Kong EUR 35,215,224 (302,076) (0.03)
Buy New Zealand Dollars/sell United States Dollars Citibank, Hong Kong NZ$11,500,000 (84,076) (0.01)
Buy Norwegian Krone/sell United States Dollars Citibank, Hong Kong NOK 70,000,000 (80,056) (0.01)
Buy Renminbi/sell United States Dollars Citibank, Hong Kong RMB97,000,000 (154,512) (0.02)
Buy Renminbi/sell United States Dollars Citibank, Hong Kong RMB624,691,778 112,830 0.01
Buy Renminbi/sell United States Dollars Citibank, Hong Kong RMB806,631,509 145,692 0.02
Buy Renminbi/sell United States Dollars Citibank, Hong Kong RMB9,308 3 0.00
Buy Renminbi/sell United States Dollars Citibank, Hong Kong RMB2,218,033 809 0.00
Buy Renminbi/sell United States Dollars Citibank, Hong Kong RMB2,896,013 900 0.00
Investment portfolio (continued)
BEA Union Investment Asian Bond and Currency Fund (continued)
Investment portfolio (continued)
BEA Union Investment Asian Bond and Currency Fund (continued)

9 10
A5請縮小打印70.5% A5請縮小打印70.5%
BEA UNION INVESTMENT SERIES
INVESTMENT REPORTAS AT 30 JUNE 2021 (UNAUDITED) (CONTINUED)
BEA UNION INVESTMENT SERIES
INVESTMENT REPORTAS AT 30 JUNE 2021 (UNAUDITED) (CONTINUED)
Underlying Counterparty
Notional amount of contracts outstanding Fair value % of net assets
US$
Foreign currency forward contracts (-0.07%) (continued)
Buy Renminbi/sell United States Dollars Citibank, Hong Kong RMB3,459,434 (297) (0.00)
Buy Renminbi/sell United States Dollars Citibank, Hong Kong RMB225,120 (13) (0.00)
Buy United States Dollars/sell British Pound Citibank, Hong Kong US$8,388,000 99,012 0.01
Buy United States Dollars/sell British Pound Citibank, Hong Kong US$8,319,000 30,012 0.00
Buy United States Dollars/sell Canadian Dollars Citibank, Hong Kong US$8,122,157 46,657 0.01
Buy United States Dollars/sell New Zealand Dollars Citibank, Hong Kong US$8,007,600 (27,784) (0.00)
Buy United States Dollars/sell Norwegian Krone Citibank, Hong Kong US$8,236,263 100,723 0.01
Buy United States Dollars/sell Renminbi Citibank, Hong Kong US$3,011 (7) (0.00)
Buy United States Dollars/sell Renminbi Citibank, Hong Kong US$8,867 3 0.00
Buy United States Dollars/sell Renminbi Citibank, Hong Kong US$4,780 (4) (0.00)
Buy United States Dollars/sell Renminbi Citibank, Hong Kong US$241,414 (180) (0.00)
Total foreign currency forward contracts (618,410) (0.07) Other net assets 9,805,487 1.18 Total net assets 828,349,671 100.00 Total investments, at cost 786,245,401
Investment portfolio (continued)
BEA Union Investment China A-Share Equity Fund
Holding shares/units Market value % of net assets
US$
Listed/quoted investments (96.93%)
Equities (89.97%)
China (89.97%)
Aier Eye Hospital Group Co Ltd – A 90,830 997,871 2.42Bank of Ningbo Co Ltd – A 82,000 494,566 1.20Beijing Oriental Yuhong Waterproof
Technology Co Ltd – A 30,000 256,870 0.62BOE Technology Group Co Ltd – A 280,000 270,404 0.66Chacha Food Co Ltd – A 57,700 384,878 0.93Changsha Jingjia Microelectronics Co Ltd – A 11,999 181,855 0.44China CSSC Holdings Ltd – A 200,000 511,031 1.24China Life Insurance Co Ltd – A 50,000 262,271 0.64China Merchants Bank Co Ltd – A 190,875 1,600,850 3.89China Shipbuilding Industry Co Ltd – A 300,000 191,288 0.46China Tourism Group Duty Free Corp Ltd – A 40,528 1,882,343 4.57Chongqing Changan Automobile Co Ltd – A 100,000 406,720 0.99CITIC Securities Co Ltd – A 80,000 308,785 0.75Contemporary Amperex Technology Co Ltd – A 15,000 1,241,517 3.01COSCO SHIPPING Holdings Co Ltd – A 120,000 567,230 1.38East Money Information Co Ltd – A 610,944 3,100,365 7.53ENN Natural Gas Co Ltd – A 220,000 562,134 1.37Foshan Haitian Flavouring & Food Co Ltd – A 31,491 628,517 1.53Gigadevice Semiconductor Beijing Inc – A 16,800 488,547 1.19GoerTek Inc – A 130,000 859,959 2.09Gree Electric Appliances Inc of Zhuhai – A 40,000 322,543 0.78Haier Smart Home Co Ltd – A 100,000 400,994 0.97Haitong Securities Co Ltd – A 180,000 320,361 0.78Hangzhou Hikvision Digital Technology Co Ltd – A 45,000 449,243 1.09Hangzhou Tigermed Consulting Co Ltd – A 35,450 1,060,518 2.57Hengli Petrochemical Co Ltd – A 50,000 203,069 0.49Industrial Bank Co Ltd – A 330,000 1,049,552 2.55Inner Mongolia Yili Industrial Group Co Ltd – A 60,000 341,997 0.83JCET Group Co Ltd – A 80,000 466,521 1.13Jiangsu Cnano Technology Co Ltd – A 30,000 547,865 1.33Jiangsu Hengrui Medicine Co Ltd – A 95,161 1,001,096 2.43Kweichow Moutai Co Ltd – A 5,500 1,750,667 4.25LONGi Green Energy Technology Co Ltd – A 97,998 1,347,432 3.27Luxshare Precision Industry Co Ltd – A 183,935 1,309,530 3.18Maxscend Microelectronics Co Ltd – A 8,400 698,823 1.70Midea Group Co Ltd – A 53,000 585,432 1.42NAURA Technology Group Co Ltd – A 10,000 429,284 1.04Ningbo Ronbay New Energy Technology Co Ltd – A 25,000 468,935 1.14Ningbo Tuopu Group Co Ltd – A 37,972 219,985 0.53
Investment portfolio (continued)
BEA Union Investment Asian Bond and Currency Fund (continued)

11 12
A5請縮小打印70.5% A5請縮小打印70.5%
BEA UNION INVESTMENT SERIES
INVESTMENT REPORTAS AT 30 JUNE 2021 (UNAUDITED) (CONTINUED)
BEA UNION INVESTMENT SERIES
INVESTMENT REPORTAS AT 30 JUNE 2021 (UNAUDITED) (CONTINUED)
Holding shares/units Market value % of net assets
US$
Listed/quoted investments (96.93%) (continued)
Equities (89.97%) (continued)
China (89.97%) (continued)
Ping An Bank Co Ltd – A 100,000 350,108 0.85Ping An Insurance Group Co of China Ltd – A 63,852 635,272 1.54Poly Developments and Holdings Group Co Ltd – A 300,090 559,226 1.36Shengyi Technology Co Ltd – A 90,000 326,072 0.79Sinofibers Technology Co Ltd – A 38,000 265,705 0.64Suzhou Dongshan Precision Manufacturing Co
Ltd – A 120,000 387,069 0.94TongFu Microelectronics Co Ltd – A 80,000 297,669 0.72Tongwei Co Ltd – A 100,038 669,979 1.63Venustech Group Inc – A 79,912 358,814 0.87Wanhua Chemical Group Co Ltd – A 15,000 252,644 0.61Western Superconducting Technologies Co Ltd – A 50,000 501,977 1.22Will Semiconductor Co Ltd Shanghai – A 12,000 598,062 1.45Wingtech Technology Co Ltd – A 25,000 374,916 0.91Wuliangye Yibin Co Ltd – A 15,000 691,602 1.68Yantai Jereh Oilfield Services Group Co Ltd – A 40,000 276,743 0.67Yonyou Network Technology Co Ltd – A 50,983 262,432 0.64Yunnan Energy New Material Co Ltd – A 48,000 1,739,177 4.22Zhejiang Lante Optics Co Ltd – A 80,000 344,319 0.84
Total equities 37,063,634 89.97
Investment funds (6.96%)
China (6.96%)
BU China Multi-Asset No. 1 Private Investment Fund 8,486,431 1,785,559 4.33
BU China Quant Select No. 1 Private Investment Fund 7,000,350 1,083,727 2.63
Total investment funds 2,869,286 6.96
Total investments 39,932,920 96.93
Other net assets 1,263,214 3.07
Total net assets 41,196,134 100.00
Total investments, at cost 25,931,900
Investment portfolio (continued)
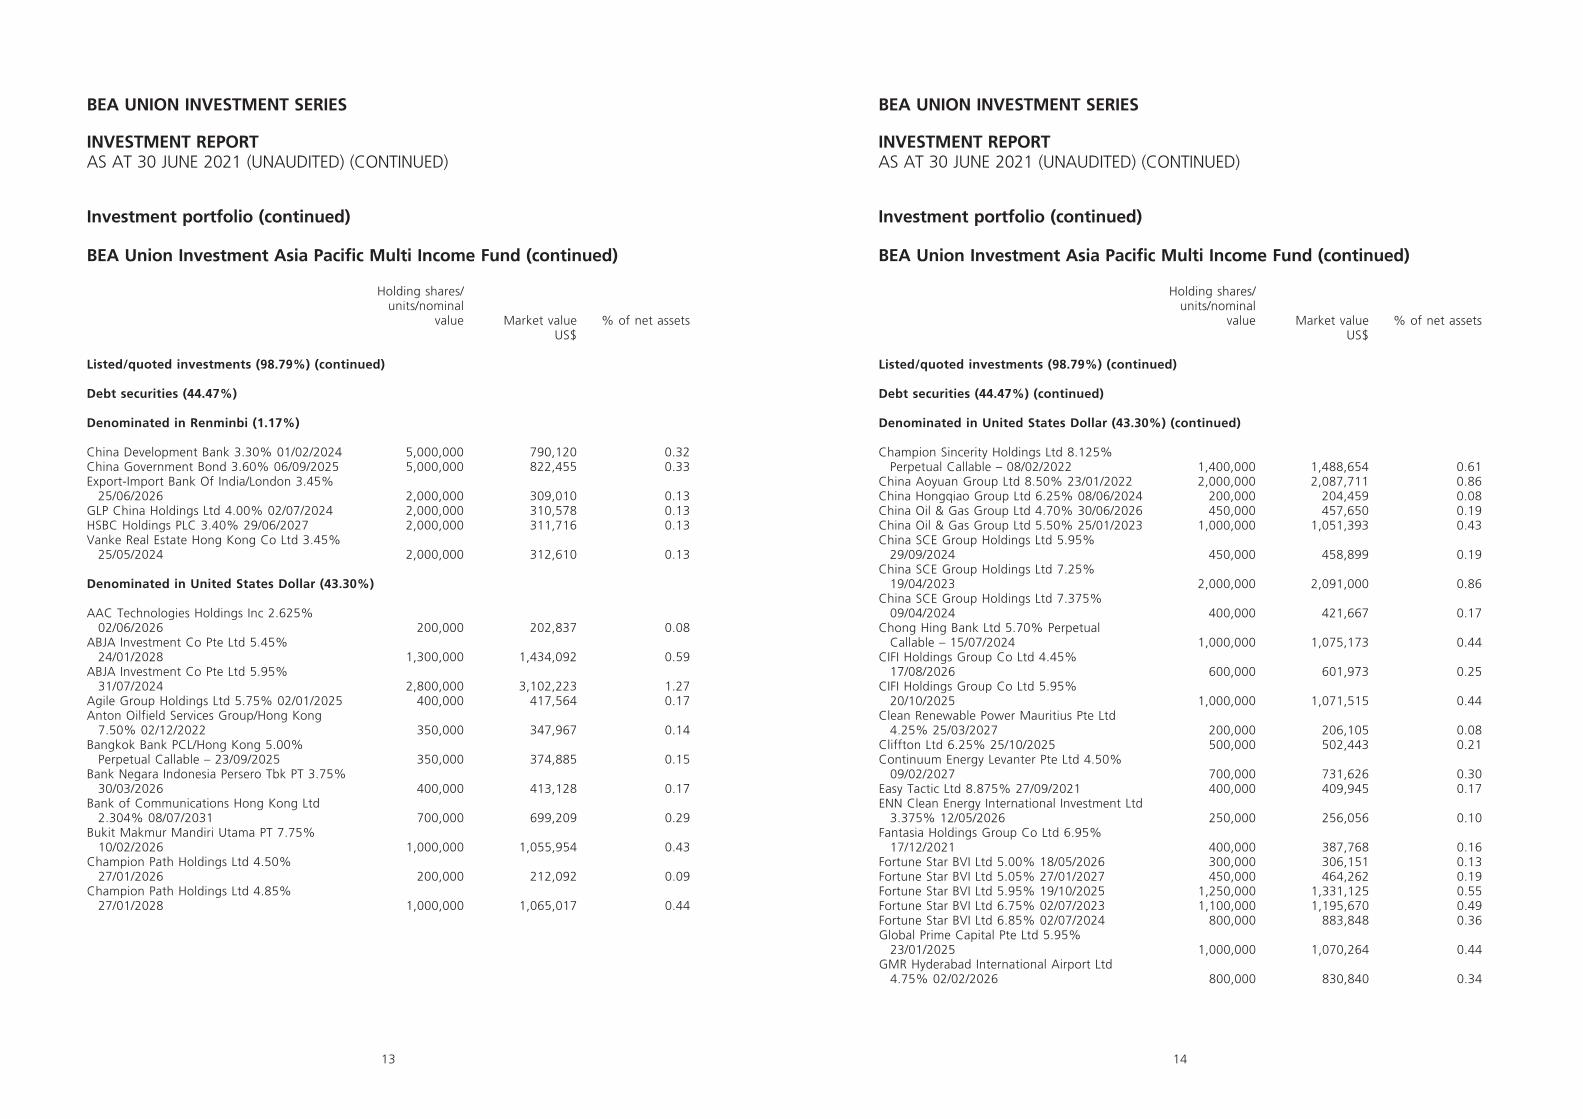
BEA Union Investment Asia Pacific Multi Income Fund
Holding shares/units/nominal
value Market value % of net assetsUS$
Listed/quoted investments (98.79%)
Equities (14.30%)
Australia (6.18%)
BHP Group Ltd 104,365 3,805,558 1.56Evolution Mining Ltd 373,811 1,262,874 0.52Megaport Ltd 215,769 2,985,449 1.22OZ Minerals Ltd 132,594 2,237,770 0.92Qantas Airways Ltd 669,719 2,343,009 0.96Viva Energy Group Ltd 1,686,122 2,443,102 1.00
China (0.61%)
LONGi Green Energy Technology Co Ltd – A 107,660 1,480,376 0.61
Hong Kong (1.01%)
Hong Kong Exchanges & Clearing Ltd 41,200 2,455,285 1.01
Korea (0.95%)
Samsung Electro-Mechanics Co Ltd 14,695 2,309,649 0.95
Taiwan (3.48%)
ASE Technology Holding Co Ltd 894,000 3,593,694 1.47MediaTek Inc 83,000 2,865,753 1.18Taiwan Semiconductor Manufacturing Co Ltd 95,000 2,028,739 0.83
Thailand (1.24%)
Precious Shipping PCL – NVDR 4,622,300 3,014,206 1.24
The United States of America (0.83%)
Crowdstrike Holdings Inc 8,086 2,032,093 0.83
Total equities 34,857,557 14.30
Investment portfolio (continued)
BEA Union Investment China A-Share Equity Fund (continued)
13 14
A5請縮小打印70.5% A5請縮小打印70.5%
BEA UNION INVESTMENT SERIES
INVESTMENT REPORTAS AT 30 JUNE 2021 (UNAUDITED) (CONTINUED)
BEA UNION INVESTMENT SERIES
INVESTMENT REPORTAS AT 30 JUNE 2021 (UNAUDITED) (CONTINUED)
Holding shares/units/nominal
value Market value % of net assetsUS$
Listed/quoted investments (98.79%) (continued)
Debt securities (44.47%)
Denominated in Renminbi (1.17%)
China Development Bank 3.30% 01/02/2024 5,000,000 790,120 0.32China Government Bond 3.60% 06/09/2025 5,000,000 822,455 0.33Export-Import Bank Of India/London 3.45%
25/06/2026 2,000,000 309,010 0.13GLP China Holdings Ltd 4.00% 02/07/2024 2,000,000 310,578 0.13HSBC Holdings PLC 3.40% 29/06/2027 2,000,000 311,716 0.13Vanke Real Estate Hong Kong Co Ltd 3.45%
25/05/2024 2,000,000 312,610 0.13
Denominated in United States Dollar (43.30%)
AAC Technologies Holdings Inc 2.625% 02/06/2026 200,000 202,837 0.08
ABJA Investment Co Pte Ltd 5.45% 24/01/2028 1,300,000 1,434,092 0.59
ABJA Investment Co Pte Ltd 5.95% 31/07/2024 2,800,000 3,102,223 1.27
Agile Group Holdings Ltd 5.75% 02/01/2025 400,000 417,564 0.17Anton Oilfield Services Group/Hong Kong
7.50% 02/12/2022 350,000 347,967 0.14Bangkok Bank PCL/Hong Kong 5.00%
Perpetual Callable – 23/09/2025 350,000 374,885 0.15Bank Negara Indonesia Persero Tbk PT 3.75%
30/03/2026 400,000 413,128 0.17Bank of Communications Hong Kong Ltd
2.304% 08/07/2031 700,000 699,209 0.29Bukit Makmur Mandiri Utama PT 7.75%
10/02/2026 1,000,000 1,055,954 0.43Champion Path Holdings Ltd 4.50%
27/01/2026 200,000 212,092 0.09Champion Path Holdings Ltd 4.85%
27/01/2028 1,000,000 1,065,017 0.44
Holding shares/units/nominal
value Market value % of net assetsUS$
Listed/quoted investments (98.79%) (continued)
Debt securities (44.47%) (continued)
Denominated in United States Dollar (43.30%) (continued)
Champion Sincerity Holdings Ltd 8.125% Perpetual Callable – 08/02/2022 1,400,000 1,488,654 0.61
China Aoyuan Group Ltd 8.50% 23/01/2022 2,000,000 2,087,711 0.86China Hongqiao Group Ltd 6.25% 08/06/2024 200,000 204,459 0.08China Oil & Gas Group Ltd 4.70% 30/06/2026 450,000 457,650 0.19China Oil & Gas Group Ltd 5.50% 25/01/2023 1,000,000 1,051,393 0.43China SCE Group Holdings Ltd 5.95%
29/09/2024 450,000 458,899 0.19China SCE Group Holdings Ltd 7.25%
19/04/2023 2,000,000 2,091,000 0.86China SCE Group Holdings Ltd 7.375%
09/04/2024 400,000 421,667 0.17Chong Hing Bank Ltd 5.70% Perpetual
Callable – 15/07/2024 1,000,000 1,075,173 0.44CIFI Holdings Group Co Ltd 4.45%
17/08/2026 600,000 601,973 0.25CIFI Holdings Group Co Ltd 5.95%
20/10/2025 1,000,000 1,071,515 0.44Clean Renewable Power Mauritius Pte Ltd
4.25% 25/03/2027 200,000 206,105 0.08Cliffton Ltd 6.25% 25/10/2025 500,000 502,443 0.21Continuum Energy Levanter Pte Ltd 4.50%
09/02/2027 700,000 731,626 0.30Easy Tactic Ltd 8.875% 27/09/2021 400,000 409,945 0.17ENN Clean Energy International Investment Ltd
3.375% 12/05/2026 250,000 256,056 0.10Fantasia Holdings Group Co Ltd 6.95%
17/12/2021 400,000 387,768 0.16Fortune Star BVI Ltd 5.00% 18/05/2026 300,000 306,151 0.13Fortune Star BVI Ltd 5.05% 27/01/2027 450,000 464,262 0.19Fortune Star BVI Ltd 5.95% 19/10/2025 1,250,000 1,331,125 0.55Fortune Star BVI Ltd 6.75% 02/07/2023 1,100,000 1,195,670 0.49Fortune Star BVI Ltd 6.85% 02/07/2024 800,000 883,848 0.36Global Prime Capital Pte Ltd 5.95%
23/01/2025 1,000,000 1,070,264 0.44GMR Hyderabad International Airport Ltd
4.75% 02/02/2026 800,000 830,840 0.34
Investment portfolio (continued)
BEA Union Investment Asia Pacific Multi Income Fund (continued)
Investment portfolio (continued)
BEA Union Investment Asia Pacific Multi Income Fund (continued)

15 16
A5請縮小打印70.5% A5請縮小打印70.5%
BEA UNION INVESTMENT SERIES
INVESTMENT REPORTAS AT 30 JUNE 2021 (UNAUDITED) (CONTINUED)
BEA UNION INVESTMENT SERIES
INVESTMENT REPORTAS AT 30 JUNE 2021 (UNAUDITED) (CONTINUED)
Holding shares/units/nominal
value Market value % of net assetsUS$
Listed/quoted investments (98.79%) (continued)
Debt securities (44.47%) (continued)
Denominated in United States Dollar (43.30%) (continued)
GMR Hyderabad International Airport Ltd 5.375% 10/04/2024 2,200,000 2,310,404 0.95
Greenko Dutch BV 3.85% 29/03/2026 300,000 311,220 0.13Greenko Solar Mauritius Ltd 5.55%
29/01/2025 1,000,000 1,053,673 0.43Greentown China Holdings Ltd 4.70%
29/04/2025 500,000 507,977 0.21Greentown China Holdings Ltd 5.65%
13/07/2025 600,000 638,536 0.26Health & Happiness H&H International
Holdings Ltd 5.625% 24/10/2024 250,000 261,565 0.11Hong Seng Ltd 9.875% 27/08/2022 400,000 418,550 0.17Honghua Group Ltd 6.375% 01/08/2022 1,200,000 1,206,362 0.49India Green Energy Holdings 5.375%
29/04/2024 400,000 424,119 0.17India Green Power Holdings 4.00%
22/02/2027 450,000 459,906 0.19Indika Energy Capital III Pte Ltd 5.875%
09/11/2024 1,000,000 1,023,656 0.42Indika Energy Capital IV Pte Ltd 8.25%
22/10/2025 2,300,000 2,480,326 1.02JSW Hydro Energy Ltd 4.125% 18/05/2031 1,000,000 1,020,707 0.42JSW Steel Ltd 5.95% 18/04/2024 1,600,000 1,734,552 0.71Kaisa Group Holdings Ltd 9.75% 28/09/2023 700,000 707,915 0.29Kaisa Group Holdings Ltd 10.875%
23/07/2023 200,000 210,138 0.09Kaisa Group Holdings Ltd 11.50% 30/01/2023 800,000 849,573 0.35Kaisa Group Holdings Ltd 11.65% 01/06/2026 1,000,000 948,108 0.39Kaisa Group Holdings Ltd 11.70% 11/11/2025 450,000 432,315 0.18Kaisa Group Holdings Ltd 11.95% 22/10/2022 400,000 421,914 0.17Kaisa Group Holdings Ltd 11.95% 12/11/2023 400,000 416,318 0.17Kasikornbank PCL/Hong Kong 5.275%
Perpetual Callable – 14/10/2025 850,000 913,404 0.37Krung Thai Bank PCL/Cayman Islands 4.40%
Perpetual Callable – 25/03/2026 600,000 616,220 0.25KWG Group Holdings Ltd 7.875% 01/09/2023 900,000 944,739 0.39LMIRT Capital Pte Ltd 7.25% 19/06/2024 1,500,000 1,571,530 0.64LMIRT Capital Pte Ltd 7.50% 09/02/2026 500,000 533,942 0.22Logan Group Co Ltd 4.85% 14/12/2026 400,000 402,988 0.16
Holding shares/units/nominal
value Market value % of net assetsUS$
Listed/quoted investments (98.79%) (continued)
Debt securities (44.47%) (continued)
Denominated in United States Dollar (43.30%) (continued)
Logan Group Co Ltd 5.75% 14/01/2025 1,500,000 1,601,825 0.66Logan Group Co Ltd 6.50% 16/07/2023 1,000,000 1,054,162 0.43Logan Group Co Ltd 6.90% 09/06/2024 700,000 752,848 0.31Marble II Pte Ltd 5.30% 20/06/2022 3,000,000 3,013,138 1.24Medco Bell Pte Ltd 6.375% 30/01/2027 1,200,000 1,273,044 0.52Medco Oak Tree Pte Ltd 7.375% 14/05/2026 2,000,000 2,206,597 0.90Melco Resorts Finance Ltd 5.375% 04/12/2029 700,000 741,945 0.30Melco Resorts Finance Ltd 5.75% 21/07/2028 300,000 325,145 0.13MGM China Holdings Ltd 5.875% 15/05/2026 200,000 211,645 0.09Minejesa Capital BV 4.625% 10/08/2030 1,000,000 1,080,915 0.44New Metro Global Ltd 4.80% 15/12/2024 600,000 606,056 0.25New Metro Global Ltd 6.80% 05/08/2023 700,000 748,655 0.31NWD Finance BVI Ltd 4.125% Perpetual
Callable – 10/03/2028 500,000 506,838 0.21Pakuwon Jati Tbk PT 4.875% 29/04/2028 700,000 737,006 0.30Perenti Finance Pty Ltd 6.50% 07/10/2025 600,000 641,986 0.26Periama Holdings LLC/DE 5.95% 19/04/2026 2,000,000 2,200,160 0.90Powerlong Real Estate Holdings Ltd 3.90%
13/04/2022 500,000 503,816 0.21Powerlong Real Estate Holdings Ltd 5.95%
30/04/2025 200,000 208,736 0.09Powerlong Real Estate Holdings Ltd 6.25%
10/08/2024 400,000 424,984 0.17Powerlong Real Estate Holdings Ltd 7.125%
08/11/2022 700,000 735,805 0.30ReNew Power Pvt Ltd 6.45% 27/09/2022 1,200,000 1,265,183 0.52ReNew Power Synthetic 6.67% 12/03/2024 2,200,000 2,363,538 0.97ReNew Wind Energy AP2 4.50% 14/07/2028 300,000 308,983 0.13RKPF Overseas 2019 A Ltd 6.70% 30/09/2024 800,000 863,885 0.35RKPF Overseas 2019 A Ltd 7.875%
01/02/2023 1,000,000 1,072,522 0.44Ronshine China Holdings Ltd 5.50%
01/02/2022 500,000 503,867 0.21Ronshine China Holdings Ltd 10.50%
01/03/2022 1,600,000 1,677,184 0.69Ronshine China Holdings Ltd 11.25%
22/08/2021 200,000 209,750 0.09Shimao Group Holdings Ltd 4.60%
13/07/2030 700,000 725,380 0.30
Investment portfolio (continued)
BEA Union Investment Asia Pacific Multi Income Fund (continued)
Investment portfolio (continued)
BEA Union Investment Asia Pacific Multi Income Fund (continued)

17 18
A5請縮小打印70.5% A5請縮小打印70.5%
BEA UNION INVESTMENT SERIES
INVESTMENT REPORTAS AT 30 JUNE 2021 (UNAUDITED) (CONTINUED)
BEA UNION INVESTMENT SERIES
INVESTMENT REPORTAS AT 30 JUNE 2021 (UNAUDITED) (CONTINUED)
Holding shares/units/nominal
value Market value % of net assetsUS$
Listed/quoted investments (98.79%) (continued)
Debt securities (44.47%) (continued)
Denominated in United States Dollar (43.30%) (continued)
Shui On Development Holding Ltd 5.75% 12/11/2023 500,000 519,333 0.21
Sinic Holdings Group Co Ltd 9.50% 18/10/2021 750,000 743,692 0.30
SoftBank Group Corp 4.625% 06/07/2028 1,100,000 1,100,000 0.45SoftBank Group Corp 5.25% 06/07/2031 900,000 900,000 0.37Studio City Finance Ltd 6.00% 15/07/2025 300,000 324,248 0.13Studio City Finance Ltd 6.50% 15/01/2028 1,000,000 1,100,603 0.46Sunac China Holdings Ltd 5.95% 26/04/2024 500,000 506,224 0.21Sunac China Holdings Ltd 6.50% 09/07/2023 800,000 843,108 0.35Sunac China Holdings Ltd 6.50% 10/01/2025 700,000 711,147 0.29Sunac China Holdings Ltd 7.00% 09/07/2025 500,000 509,787 0.21Sunac China Holdings Ltd 7.50% 01/02/2024 600,000 634,122 0.26Theta Capital Pte Ltd 8.125% 22/01/2025 1,800,000 1,935,136 0.79Times China Holdings Ltd 5.55% 04/06/2024 600,000 604,243 0.25Times China Holdings Ltd 6.20% 22/03/2026 600,000 600,912 0.25Times China Holdings Ltd 6.60% 02/03/2023 500,000 511,587 0.21Times China Holdings Ltd 6.75% 16/07/2023 1,400,000 1,482,457 0.61Times China Holdings Ltd 6.75% 08/07/2025 900,000 943,126 0.39TMBThanachart Bank PCL 4.90% Perpetual
Callable – 02/12/2024 700,000 715,727 0.29TML Holdings Pte Ltd 4.35% 09/06/2026 400,000 403,635 0.17Vedanta Resources Finance II PLC 8.00%
23/04/2023 500,000 482,391 0.20Vedanta Resources Finance II PLC 13.875%
21/01/2024 250,000 291,342 0.12Vedanta Resources Ltd 6.375% 30/07/2022 2,600,000 2,642,665 1.08Vedanta Resources Ltd 7.125% 31/05/2023 500,000 467,311 0.19West China Cement Ltd 4.95% 08/07/2026 550,000 557,563 0.23Wynn Macau Ltd 5.50% 15/01/2026 300,000 321,816 0.13Wynn Macau Ltd 5.625% 26/08/2028 700,000 746,299 0.31
Holding shares/units/nominal
value Market value % of net assetsUS$
Listed/quoted investments (98.79%) (continued)
Debt securities (44.47%) (continued)
Denominated in United States Dollar (43.30%) (continued)
Yuzhou Group Holdings Co Ltd 8.375% 30/10/2024 800,000 727,433 0.30
Yuzhou Group Holdings Co Ltd 8.50% 04/02/2023 400,000 392,315 0.16
Yuzhou Group Holdings Co Ltd 8.625% 23/01/2022 1,900,000 1,974,260 0.81
Zhenro Properties Group Ltd 5.98% 13/04/2022 500,000 507,312 0.21
Zhenro Properties Group Ltd 9.80% 20/08/2021 1,000,000 1,042,831 0.43
Total debt securities 108,396,534 44.47
Stapled security (1.70%)
Australia (1.70%)
Transurban Group 387,772 4,142,635 1.70 Total stapled security 4,142,635 1.70
Investment funds (27.42%)
Hong Kong (27.42%)
BEA Union Investment Asian Opportunities Fund – Class ADU 2,006,104 29,590,027 12.14
BEA Union Investment Asian Bond and Currency Fund – Class ADU 55,388 689,032 0.28
BEA Union Investment Asian Bond and Currency Fund – Class IAU 1,141,575 12,568,738 5.16
BU APAC Bond Fund 2,310,000 24,000,900 9.84 Total investment funds 66,848,697 27.42
Investment portfolio (continued)
BEA Union Investment Asia Pacific Multi Income Fund (continued)
Investment portfolio (continued)
BEA Union Investment Asia Pacific Multi Income Fund (continued)

19 20
A5請縮小打印70.5% A5請縮小打印70.5%
BEA UNION INVESTMENT SERIES
INVESTMENT REPORTAS AT 30 JUNE 2021 (UNAUDITED) (CONTINUED)
BEA UNION INVESTMENT SERIES
INVESTMENT REPORTAS AT 30 JUNE 2021 (UNAUDITED) (CONTINUED)
Holding shares/units/nominal
value Market value % of net assetsUS$
Listed/quoted investments (98.79%) (continued)
Real estate investment trusts (10.90%)
Australia (1.86%)
Charter Hall Group 182,875 2,130,794 0.87Goodman Group 152,015 2,416,032 0.99
Hong Kong (1.55%)
Link REIT 389,800 3,777,110 1.55
Singapore (5.15%)
Ascendas Real Estate Investment Trust 1,181,995 2,594,023 1.06CapitaLand Integrated Commercial Trust 2,386,944 3,711,288 1.52Keppel DC REIT 665,100 1,232,033 0.51Mapletree Industrial Trust 1,330,665 2,801,505 1.15Mapletree Logistics Trust 1,459,757 2,226,233 0.91
The United States of America (2.34%)
Prologis Inc 47,626 5,692,736 2.34 Total real estate investment trusts 26,581,754 10.90
Underlying Counterparty
Notional amount of contracts outstanding Fair value % of net assets
US$
Bond future (0.00%)
The United States of America (0.00%)
US 10Yr Note Future 21/09/2021 Citibank, Hong Kong (20) (10,156) (0.00)
Total bond future (10,156) (0.00) Total investments 240,817,021 98.79
Foreign currency forward contracts (-0.18%)
Buy Australian Dollars/sell United States Dollars Citibank, Hong Kong AU$38,140,811 (263,286) (0.11)
Buy British Pound/sell United States Dollars Citibank, Hong Kong GBP1,800,000 (63,706) (0.03)
Buy British Pound/sell United States Dollars Citibank, Hong Kong GBP1,800,000 (49,504) (0.02)
Buy Canadian Dollars/sell United States Dollars Citibank, Hong Kong CA$3,000,000 (16,940) (0.01)
Buy Euro/sell United States Dollars Citibank, Hong Kong EUR49,773 (427) (0.00)
Buy Euro/sell United States Dollars Citibank, Hong Kong EUR53,082 (455) (0.00)
Buy New Zealand Dollars/sell United States Dollars Citibank, Hong Kong NZ$3,300,000 (24,126) (0.01)
Buy New Zealand Dollars/sell United States Dollars Citibank, Hong Kong NZ$11,384,742 (82,858) (0.03)
Buy Norwegian Krone/sell United States Dollars Citibank, Hong Kong NOK20,000,000 (22,873) (0.01)
Buy Renminbi/sell United States Dollars Citibank, Hong Kong RMB32,000,000 (50,973) (0.02)
Buy Renminbi/sell United States Dollars Citibank, Hong Kong RMB323,219,315 58,379 0.02
Buy Renminbi/sell United States Dollars Citibank, Hong Kong RMB478,838 87 0.00
Buy Renminbi/sell United States Dollars Citibank, Hong Kong RMB436,733 136 0.00
Buy Renminbi/sell United States Dollars Citibank, Hong Kong RMB1,000 – 0.00
Investment portfolio (continued)
BEA Union Investment Asia Pacific Multi Income Fund (continued)
Investment portfolio (continued)
BEA Union Investment Asia Pacific Multi Income Fund (continued)

21 22
A5請縮小打印70.5% A5請縮小打印70.5%
BEA UNION INVESTMENT SERIES
INVESTMENT REPORTAS AT 30 JUNE 2021 (UNAUDITED) (CONTINUED)
BEA UNION INVESTMENT SERIES
INVESTMENT REPORTAS AT 30 JUNE 2021 (UNAUDITED) (CONTINUED)
Underlying Counterparty
Notional amount of contracts outstanding Fair value % of net assets
US$
Foreign currency forward contracts (-0.18%) (continued)
Buy Renminbi/sell United States Dollars Citibank, Hong Kong RMB527,703 (31) (0.00)
Buy Renminbi/sell United States Dollars Citibank, Hong Kong RMB902 – 0.00
Buy United States Dollars/sell Australian Dollars Citibank, Hong Kong US$439,377 4,689 0.00
Buy United States Dollars/sell Australian Dollars Citibank, Hong Kong US$56,917 51 0.00
Buy United States Dollars/sell British Pound Citibank, Hong Kong US$2,516,400 29,704 0.01
Buy United States Dollars/sell British Pound Citibank, Hong Kong US$2,495,700 9,004 0.01
Buy United States Dollars/sell Canadian Dollars Citibank, Hong Kong US$2,436,647 13,997 0.01
Buy United States Dollars/sell New Zealand Dollars Citibank, Hong Kong US$2,297,833 (7,973) (0.00)
Buy United States Dollars/sell New Zealand Dollars Citibank, Hong Kong US$56,435 760 0.00
Buy United States Dollars/sell Norwegian Krone Citibank, Hong Kong US$2,353,218 28,778 0.01
Buy United States Dollars/sell Renminbi Citibank, Hong Kong US$54,965 (141) (0.00)
Buy United States Dollars/sell Renminbi Citibank, Hong Kong US$49 – 0.00
Buy United States Dollars/sell Renminbi Citibank, Hong Kong US$106,474 (80) (0.00)
Total foreign currency forward contracts (437,788) (0.18) Other net assets 3,394,291 1.39 Total net assets 243,773,524 100.00 Total investments, at cost 217,609,998
Investment portfolio (continued)
BEA Union Investment China Phoenix Fund
Holding shares/units Market value % of net assets
US$
Listed/quoted investments (100.00%)
Equities (100.00%)
China (31.41%)
Aier Eye Hospital Group Co Ltd – A 12,965 142,435 0.92Bank of Ningbo Co Ltd – A 15,000 90,476 0.58Chacha Food Co Ltd – A 10,000 66,709 0.43Changsha Jingjia Microelectronics Co Ltd – A 5,000 75,779 0.49China CSSC Holdings Ltd – A 79,997 204,423 1.32China Tourism Group Duty Free Corp Ltd – A 4,991 231,826 1.49Contemporary Amperex Technology Co Ltd – A 3,741 309,662 1.99East Money Information Co Ltd – A 71,998 365,402 2.35GoerTek Inc – A 25,000 165,380 1.06Hangzhou Tigermed Consulting Co Ltd – A 5,000 149,593 0.96Hengli Petrochemical Co Ltd – A 30,000 121,841 0.78Industrial Bank Co Ltd – A 35,000 111,324 0.72Inner Mongolia Yili Industrial Group Co Ltd – A 25,000 142,512 0.92Jiangsu Hengrui Medicine Co Ltd – A 12,800 134,659 0.87Kweichow Moutai Co Ltd – A 300 95,500 0.62LONGi Green Energy Technology Co Ltd – A 22,395 307,942 1.98Luxshare Precision Industry Co Ltd – A 51,004 363,138 2.34Maxscend Microelectronics Co Ltd – A 1,902 158,233 1.02Ningbo Tuopu Group Co Ltd – A 15,991 92,641 0.60Ping An Bank Co Ltd – A 22,000 77,024 0.50Proya Cosmetics Co Ltd – A 3,000 91,339 0.59Sinofibers Technology Co Ltd – A 20,000 139,857 0.90Suzhou Dongshan Precision Manufacturing Co
Ltd – A 50,000 161,279 1.04Tongwei Co Ltd – A 19,996 133,918 0.86Wanhua Chemical Group Co Ltd – A 3,500 58,950 0.38Western Superconducting Technologies Co Ltd – A 20,000 200,809 1.29Will Semiconductor Co Ltd Shanghai – A 3,500 174,435 1.12Wuliangye Yibin Co Ltd – A 3,800 175,206 1.13Yantai Jereh Oilfield Services Group Co Ltd – A 12,000 83,023 0.53Yunnan Energy New Material Co Ltd – A 7,000 253,635 1.63
Investment portfolio (continued)
BEA Union Investment Asia Pacific Multi Income Fund (continued)

23 24
A5請縮小打印70.5% A5請縮小打印70.5%
BEA UNION INVESTMENT SERIES
INVESTMENT REPORTAS AT 30 JUNE 2021 (UNAUDITED) (CONTINUED)
BEA UNION INVESTMENT SERIES
INVESTMENT REPORTAS AT 30 JUNE 2021 (UNAUDITED) (CONTINUED)
Holding shares/units Market value % of net assets
US$
Listed/quoted investments (100.00%) (continued)
Equities (100.00%) (continued)
Hong Kong (61.24%)
AAC Technologies Holdings Inc 20,000 149,630 0.96Alibaba Group Holding Ltd 50,864 1,440,935 9.28A-Living Smart City Services Co Ltd – H 50,000 248,846 1.60Baidu Inc 6,000 154,059 0.99BOC Aviation Ltd 14,900 125,672 0.81China BlueChemical Ltd – H 700,000 204,614 1.32China Construction Bank Corp – H 200,000 157,356 1.01China Mengniu Dairy Co Ltd 44,000 266,011 1.71China Merchants Bank Co Ltd – H 50,000 426,547 2.75China Mobile Ltd 12,000 75,021 0.48China Resources Beer Holdings Co Ltd 28,000 251,486 1.62Chow Tai Fook Jewellery Group Ltd 80,000 182,749 1.18CNOOC Ltd 170,000 193,295 1.25COSCO SHIPPING Holdings Co Ltd – H 70,000 176,311 1.14Ever Sunshine Lifestyle Services Group Ltd 30,000 74,480 0.48Galaxy Entertainment Group Ltd 15,000 120,045 0.77GDS Holdings Ltd 10,000 99,023 0.64Geely Automobile Holdings Ltd 32,000 100,749 0.65Hong Kong Exchanges & Clearing Ltd 3,000 178,783 1.15JD.com Inc 9,000 353,935 2.28KWG Group Holdings Ltd 45,000 60,264 0.39KWG Living Group Holdings Ltd 100,000 128,254 0.83Li Ning Co Ltd 12,000 146,488 0.94Longfor Group Holdings Ltd 22,000 123,232 0.79Meituan 21,000 866,409 5.58NetEase Inc 7,000 158,553 1.02New Oriental Education & Technology Group
Inc 8,000 65,930 0.42Pacific Basin Shipping Ltd 250,000 100,762 0.65Ping An Insurance Group Co of China Ltd – H 15,000 146,893 0.95Shenzhou International Group Holdings Ltd 5,000 126,258 0.81Sino Biopharmaceutical Ltd 80,000 78,498 0.51Sunac China Holdings Ltd 35,000 120,109 0.77Sunny Optical Technology Group Co Ltd 7,000 221,199 1.42Tencent Holdings Ltd 18,000 1,353,620 8.72Wuxi Biologics Cayman Inc 28,000 513,067 3.30Xiaomi Corp 30,000 104,303 0.67Zhaojin Mining Industry Co Ltd – H 130,000 123,541 0.80ZTE Corp – H 30,000 93,680 0.60
Holding shares/units Market value % of net assets
US$
Listed/quoted investments (100.00%) (continued)
Equities (100.00%) (continued)
The United States of America (7.35%)
ACM Research Inc 2,200 224,884 1.45Baidu Inc – ADR 1,100 224,290 1.45Bilibili Inc – ADR 1,000 121,840 0.78Futu Holdings Ltd – ADR 1,300 232,817 1.50Huazhu Group Ltd – ADR 1,000 52,810 0.34NetEase Inc – ADR 800 92,200 0.59Sea Ltd – ADR 700 192,220 1.24
Total equities 15,530,618 100.00
Total investments 15,530,618 100.00
Underlying Counterparty
Notional amount of contracts outstanding Fair value % of net assets
US$
Foreign currency forward contracts (0.02%)
Buy Renminbi/sell United States Dollars Citibank, Hong Kong RMB15,948,720 2,880 0.02
Buy Renminbi/sell United States Dollars Citibank, Hong Kong RMB915,860 (14) (0.00)
Buy United States Dollars/sell Renminbi Citibank, Hong Kong US$15,008 (33) (0.00)
Buy United States Dollars/sell Renminbi Citibank, Hong Kong US$69,650 (52) (0.00)
Total foreign currency forward contracts 2,781 0.02 Other net assets (2,088) (0.02) Total net assets 15,531,311 100.00 Total investments, at cost 11,940,320
Investment portfolio (continued)
BEA Union Investment China Phoenix Fund (continued)
Investment portfolio (continued)
BEA Union Investment China Phoenix Fund (continued)

25 26
A5請縮小打印70.5% A5請縮小打印70.5%
BEA UNION INVESTMENT SERIES
INVESTMENT REPORTAS AT 30 JUNE 2021 (UNAUDITED) (CONTINUED)
BEA UNION INVESTMENT SERIES
INVESTMENT REPORTAS AT 30 JUNE 2021 (UNAUDITED) (CONTINUED)
Investment portfolio (continued)
BEA Union Investment RMB Core Bond Fund
Nominal value Market value % of net assetsRMB
Listed/quoted investments (99.30%)
Debt securities (77.49%)
Denominated in Renminbi (77.49%)
Agricultural Development Bank of China 2.60% 11/08/2023 3,000,000 3,026,712 1.57
Agricultural Development Bank of China 3.25% 27/10/2025 3,000,000 3,070,373 1.60
Agricultural Development Bank of China 3.40% 06/11/2024 3,000,000 3,078,889 1.60
Bank of China Ltd/Frankfurt 2.85% 28/04/2023 6,000,000 6,029,744 3.14
Bank of China Ltd/Macau 3.30% 17/04/2022 1,000,000 1,010,940 0.53BMW Finance NV 2.80% 11/08/2023 3,000,000 3,059,334 1.59China Construction Bank Corp/Singapore
2.85% 22/04/2023 5,000,000 5,027,429 2.62China Development Bank 3.30% 01/02/2024 5,000,000 5,104,858 2.66China Development Bank 4.20% 19/01/2027 6,000,000 6,501,817 3.38China Development Bank 4.35% 19/09/2024 3,000,000 3,184,784 1.66China Development Bank/Hong Kong 2.65%
18/06/2024 2,000,000 1,998,042 1.04China Government Bond 3.38% 04/07/2026 5,000,000 5,268,116 2.74China Government Bond 3.48% 29/06/2027 6,000,000 6,275,224 3.27China Government Bond 3.60% 06/09/2025 5,000,000 5,313,769 2.76China Government Bond 3.60% 27/06/2028 4,500,000 4,755,536 2.47CIFI Holdings Group Co Ltd 5.85%
19/08/2023 2,000,000 2,113,052 1.10CIFI Holdings Group Co Ltd 6.70%
23/04/2022 4,000,000 4,129,943 2.15Daimler International Finance BV 3.78%
22/03/2022 1,000,000 1,017,020 0.53Eastern Creation II Investment Holdings Ltd
3.40% 26/11/2022 3,000,000 3,031,810 1.58Export-Import Bank Of India/London 3.45%
25/06/2026 3,000,000 2,994,711 1.56Export-Import Bank of Korea 2.80%
03/03/2024 4,000,000 4,046,902 2.11First Abu Dhabi Bank PJSC 3.10% 12/06/2023 2,000,000 2,003,558 1.04First Abu Dhabi Bank PJSC 3.50% 02/07/2025 3,000,000 3,146,982 1.64
Nominal value Market value % of net assetsRMB
Listed/quoted investments (99.30%) (continued)
Debt securities (77.49%) (continued)
Denominated in Renminbi (77.49%) (continued)
GLP China Holdings Ltd 4.00% 02/07/2024 4,000,000 4,013,200 2.09Hana Bank 3.01% 24/03/2024 6,000,000 6,066,505 3.16Hanwha Solutions Corp 3.00% 19/04/2024 2,000,000 2,008,040 1.04Henderson Land MTN Ltd 3.30% 13/05/2023 3,000,000 3,011,235 1.57HKCG Finance Ltd 3.00% 30/10/2023 5,000,000 5,107,824 2.66Hong Kong Mortgage Corp Ltd/The 2.70%
09/02/2024 5,000,000 5,051,721 2.63Hong Kong Mortgage Corp Ltd/The 2.80%
17/03/2022 3,000,000 3,024,335 1.57HSBC Holdings PLC 3.40% 29/06/2027 2,000,000 2,013,953 1.05Industrial & Commercial Bank of China Ltd/
Singapore 3.30% 25/04/2022 2,000,000 2,019,974 1.05Link Finance Cayman 2009 Ltd/The 2.80%
24/05/2024 5,000,000 5,005,825 2.60MTR Corp Ltd 2.80% 25/03/2024 2,000,000 2,022,296 1.05MTR Corp Ltd 2.90% 24/03/2024 5,000,000 5,070,229 2.64QNB Finance Ltd 3.80% 17/06/2025 2,000,000 2,037,755 1.06QNB Finance Ltd 4.35% 29/01/2022 2,000,000 2,052,048 1.07Sun Hung Kai Properties Capital Market Ltd
3.20% 14/08/2027 5,000,000 5,073,451 2.64Vanke Real Estate Hong Kong Co Ltd 3.45%
25/05/2024 6,000,000 6,059,204 3.15Volkswagen International Finance NV 3.40%
08/12/2023 2,000,000 2,060,752 1.07Wharf REIC Finance BVI Ltd 2.95%
19/01/2024 2,000,000 2,016,948 1.05 Total debt securities 148,904,840 77.49
Investment fund (21.81%)
Hong Kong (21.81%)
BEA Union Investment Asian Bond and Currency Fund – Class ADU 521,360 41,903,346 21.81
Total investment fund 41,903,346 21.81 Total investments 190,808,186 99.30
Investment portfolio (continued)
BEA Union Investment RMB Core Bond Fund (continued)

27 28
A5請縮小打印70.5% A5請縮小打印70.5%
BEA UNION INVESTMENT SERIES
INVESTMENT REPORTAS AT 30 JUNE 2021 (UNAUDITED) (CONTINUED)
BEA UNION INVESTMENT SERIES
INVESTMENT REPORTAS AT 30 JUNE 2021 (UNAUDITED) (CONTINUED)
Underlying Counterparty
Notional amount of contracts outstanding Fair value % of net assets
RMBForeign currency forward contracts (0.02%)
Buy Renminbi/sell United States Dollars Citibank, Hong Kong RMB36,400,000 46,467 0.02
Buy Renminbi/sell United States Dollars Citibank, Hong Kong RMB5,200,000 1,241 0.00
Total foreign currency forward contracts 47,708 0.02 Other net assets 1,294,067 0.68 Total net assets 192,149,961 100.00 Total investments, at cost 190,434,838
Investment portfolio (continued)
BEA Union Investment Asia Pacific Flexi Allocation Fund
Holding shares/units/nominal
value Market value % of net assetsUS$
Listed/quoted investments (99.77%)
Equities (77.67%)
Australia (14.88%)
Aristocrat Leisure Ltd 10,950 354,231 1.14Australia & New Zealand Banking Group Ltd 21,016 444,144 1.42BHP Group Ltd 15,868 578,610 1.85Evolution Mining Ltd 55,425 187,246 0.60Karoon Energy Ltd 658,661 657,671 2.11Megaport Ltd 42,795 592,125 1.90NEXTDC Ltd 37,378 332,810 1.07OZ Minerals Ltd 13,797 232,850 0.75Qantas Airways Ltd 52,280 182,901 0.59Rio Tinto Ltd 3,514 334,093 1.07Santos Ltd 50,104 266,694 0.85Viva Energy Group Ltd 84,711 122,742 0.39Westpac Banking Corp 18,344 355,449 1.14
China (5.65%)
Aier Eye Hospital Group Co Ltd – A 31,180 342,548 1.10Estun Automation Co Ltd – A 70,472 425,938 1.37Jiangsu Hengli Hydraulic Co Ltd – A 18,084 240,491 0.77LONGi Green Energy Technology Co Ltd – A 25,842 355,340 1.14Will Semiconductor Co Ltd Shanghai – A 5,700 284,080 0.91YanTai Shuangta Food Co Ltd – A 62,700 112,185 0.36
Hong Kong (15.73%)
AIA Group Ltd 37,000 459,770 1.47Alibaba Group Holding Ltd 8,000 226,633 0.73China East Education Holdings Ltd 72,000 113,111 0.36CITIC Securities Co Ltd – H 55,500 139,217 0.45Country Garden Services Holdings Co Ltd 42,000 453,756 1.46Ganfeng Lithium Co Ltd – H 13,200 197,171 0.63Hong Kong Exchanges & Clearing Ltd 5,400 321,809 1.03Innovent Biologics Inc 26,500 308,991 0.99JD.com Inc 4,850 190,731 0.61Longfor Group Holdings Ltd 57,000 319,283 1.02SITC International Holdings Co Ltd 168,000 701,997 2.25Tencent Holdings Ltd 14,900 1,120,496 3.59Wuxi Biologics Cayman Inc 19,400 355,482 1.14
Investment portfolio (continued)
BEA Union Investment RMB Core Bond Fund (continued)

29 30
A5請縮小打印70.5% A5請縮小打印70.5%
BEA UNION INVESTMENT SERIES
INVESTMENT REPORTAS AT 30 JUNE 2021 (UNAUDITED) (CONTINUED)
BEA UNION INVESTMENT SERIES
INVESTMENT REPORTAS AT 30 JUNE 2021 (UNAUDITED) (CONTINUED)
Holding shares/units/nominal
value Market value % of net assetsUS$
Listed/quoted investments (99.77%) (continued)
Equities (77.67%) (continued)
India (9.74%)
Adani Ports & Special Economic Zone Ltd 15,478 146,539 0.47Bajaj Finance Ltd 3,312 268,064 0.86HDFC Life Insurance Co Ltd 14,240 131,485 0.42IndiaMart InterMesh Ltd 1,177 110,723 0.35Infosys Ltd 22,830 485,550 1.56Reliance Industries Ltd 17,323 491,916 1.58SBI Cards & Payment Services Ltd 26,021 339,724 1.09SBI Life Insurance Co Ltd 15,862 215,147 0.69Tata Consultancy Services Ltd 6,558 295,200 0.94Tata Consumer Products Ltd 22,504 228,409 0.73Tata Steel Ltd 10,259 161,019 0.52Tech Mahindra Ltd 11,196 165,009 0.53
Indonesia (2.38%)
Aneka Tambang Tbk 623,800 98,954 0.31Bank Central Asia Tbk PT 76,500 158,946 0.51Bank Jago Tbk PT 325,466 305,846 0.98Merdeka Copper Gold Tbk PT 889,400 180,345 0.58
Korea (11.41%)
Kakao Corp 4,059 587,503 1.88NAVER Corp 728 269,893 0.86Samsung Electro-Mechanics Co Ltd 1,153 181,220 0.58Samsung Electronics Co Ltd 21,905 1,569,712 5.03Samsung SDI Co Ltd 507 314,244 1.01SK Hynix Inc 3,750 424,565 1.36SK Innovation Co Ltd 816 214,117 0.69
Malaysia (1.28%)
Dialog Group Bhd 97,700 68,012 0.22Greatech Technology Bhd 99,300 136,100 0.44Press Metal Aluminium Holdings Bhd 169,400 195,046 0.62
Singapore (0.77%)
DBS Group Holdings Ltd 10,800 239,509 0.77
Holding shares/units/nominal
value Market value % of net assetsUS$
Listed/quoted investments (99.77%) (continued)
Equities (77.67%) (continued)
Taiwan (11.73%)
ASE Technology Holding Co Ltd 102,000 410,019 1.31Evergreen Marine Corp Taiwan Ltd 80,000 565,642 1.81Hon Hai Precision Industry Co Ltd 46,000 184,910 0.59MediaTek Inc 11,000 379,799 1.22Novatek Microelectronics Corp 15,000 268,644 0.86Realtek Semiconductor Corp 15,000 271,874 0.87Taiwan Semiconductor Manufacturing Co Ltd 74,000 1,580,281 5.07
Thailand (1.25%)
Precious Shipping PCL – NVDR 295,100 192,435 0.62PTT PCL – NVDR 160,400 196,432 0.63
The United States of America (2.85%)
BeiGene Ltd – ADR 1,010 346,622 1.11Crowdstrike Holdings Inc 1,119 281,216 0.90GDS Holdings Ltd – ADR 3,338 262,000 0.84 Total equities 24,233,266 77.67
Debt securities (3.39%)
Denominated in United States Dollar (3.39%)
Kasikornbank PCL/Hong Kong 3.343% 02/10/2031 200,000 206,399 0.66
Pertamina Persero PT 4.70% 30/07/2049 200,000 221,139 0.71Tencent Music Entertainment Group 2.00%
03/09/2030 200,000 194,087 0.62Thaioil Treasury Center Co Ltd 5.375%
20/11/2048 200,000 240,360 0.77United States Treasury Note/Bond 2.00%
15/02/2050 200,000 197,222 0.63 Total debt securities 1,059,207 3.39
Investment portfolio (continued)
BEA Union Investment Asia Pacific Flexi Allocation Fund (continued)
Investment portfolio (continued)
BEA Union Investment Asia Pacific Flexi Allocation Fund (continued)

31 32
A5請縮小打印70.5% A5請縮小打印70.5%
BEA UNION INVESTMENT SERIES
INVESTMENT REPORTAS AT 30 JUNE 2021 (UNAUDITED) (CONTINUED)
BEA UNION INVESTMENT SERIES
INVESTMENT REPORTAS AT 30 JUNE 2021 (UNAUDITED) (CONTINUED)
Holding shares/units/nominal
value Market value % of net assetsUS$
Listed/quoted investments (99.77%) (continued)
Stapled security (0.93%)
Australia (0.93%)
Transurban Group 27,175 290,315 0.93 Total stapled security 290,315 0.93
Investment funds (11.89%)
Hong Kong (10.96%)
BEA Union Investment Asian Bond and Currency Fund – Class ADU 275,017 3,421,214 10.96
The United States of America (0.93%)
iShares Silver Trust 11,931 288,969 0.93 Total investment funds 3,710,183 11.89
Real estate investment trusts (5.89%)
Australia (4.00%)
Charter Hall Group 35,506 413,703 1.33Goodman Group 34,577 549,545 1.76Stockland 80,992 283,350 0.91
The United States of America (1.89%)
Prologis Inc 4,933 589,642 1.89 Total real estate investment trusts 1,836,240 5.89 Total investments 31,129,211 99.77
Underlying Counterparty
Notional amount of contracts outstanding Fair value % of net assets
US$
Foreign currency forward contracts (-0.06%)
Buy Australian Dollars/sell United States Dollars Citibank, Hong Kong AU$3,138,206 (21,663) (0.07)
Buy New Zealand Dollars/sell United States Dollars Citibank, Hong Kong NZ$1,089,047 (7,926) (0.02)
Buy Renminbi/sell United States Dollars Citibank, Hong Kong RMB51,123,608 9,234 0.03
Buy United States Dollars/sell Australian Dollars Citibank, Hong Kong US$40,017 354 0.00
Buy United States Dollars/sell Australian Dollars Citibank, Hong Kong US$47,181 42 0.00
Buy United States Dollars/sell Renminbi Citibank, Hong Kong US$15,422 (34) (0.00)
Total foreign currency forward contracts (19,993) (0.06)
Other net assets 92,757 0.29 Total net assets 31,201,975 100.00 Total investments, at cost 23,637,680
Investment portfolio (continued)
BEA Union Investment Asia Pacific Flexi Allocation Fund (continued)
Investment portfolio (continued)
BEA Union Investment Asia Pacific Flexi Allocation Fund (continued)

33 34
A5請縮小打印70.5% A5請縮小打印70.5%
BEA UNION INVESTMENT SERIES
INVESTMENT REPORTAS AT 30 JUNE 2021 (UNAUDITED) (CONTINUED)
BEA UNION INVESTMENT SERIES
INVESTMENT REPORTAS AT 30 JUNE 2021 (UNAUDITED) (CONTINUED)
Investment portfolio (continued)
BEA Union Investment Global Flexi Allocation Fund
Holding shares/units Market value % of net assets
US$
Listed/quoted investments (94.62%)
Equities (63.49%)
Australia (1.58%)
Macquarie Group Ltd 530 62,243 0.72Rio Tinto Ltd 772 73,398 0.86
Canada (0.68%)
Kinross Gold Corp 9,200 58,396 0.68
France (3.03%)
EssilorLuxottica SA 403 74,383 0.86LVMH Moet Hennessy Louis Vuitton SE 81 63,523 0.74TotalEnergies SE 2,708 122,532 1.43
Germany (1.97%)
BASF SE 1,325 104,398 1.22Henkel AG & Co KGaA 611 64,517 0.75
Hong Kong (3.11%)
AIA Group Ltd 13,000 161,541 1.88Tencent Holdings Ltd 1,400 105,282 1.23
Italy (0.95%)
Enel SpA 8,779 81,539 0.95
Japan (1.98%)
Japan Post Insurance Co Ltd 4,400 81,427 0.95Recruit Holdings Co Ltd 1,800 88,711 1.03
Holding shares/units Market value % of net assets
US$
Listed/quoted investments (94.62%) (continued)
Equities (63.49%) (continued)
Korea (0.87%)
Samsung Electronics Co Ltd 1,037 74,311 0.87
Netherlands (0.65%)
ASML Holding NV 81 55,656 0.65
Singapore (1.40%)
DBS Group Holdings Ltd 5,400 119,754 1.40
Switzerland (2.16%)
Nestle SA 507 63,197 0.74UBS Group AG 7,952 121,816 1.42
Taiwan (0.57%)
Taiwan Semiconductor Manufacturing Co Ltd 2,305 49,224 0.57
The United Kingdom (2.12%)
Compass Group PLC 3,688 77,543 0.90Vodafone Group PLC 62,233 104,318 1.22
The United States of America (42.42%)
Abbott Laboratories 957 110,945 1.29AbbVie Inc 980 110,387 1.29Alphabet Inc 127 310,107 3.61Amazon.com Inc 81 278,653 3.25Apple Inc 2,409 329,937 3.85Bank of America Corp 2,017 83,161 0.97
Investment portfolio (continued)
BEA Union Investment Global Flexi Allocation Fund (continued)

35 36
A5請縮小打印70.5% A5請縮小打印70.5%
BEA UNION INVESTMENT SERIES
INVESTMENT REPORTAS AT 30 JUNE 2021 (UNAUDITED) (CONTINUED)
BEA UNION INVESTMENT SERIES
INVESTMENT REPORTAS AT 30 JUNE 2021 (UNAUDITED) (CONTINUED)
Holding shares/units Market value % of net assets
US$
Listed/quoted investments (94.62%) (continued)
Equities (63.49%) (continued)
The United States of America (42.42%) (continued)
Coca-Cola Co/The 2,351 127,213 1.48CVS Health Corp 945 78,851 0.92Emerson Electric Co 726 69,870 0.81Exxon Mobil Corp 2,178 137,388 1.60Facebook Inc 288 100,140 1.17Honeywell International Inc 300 65,805 0.77IDEXX Laboratories Inc 127 80,207 0.93Illinois Tool Works Inc 530 118,487 1.38Johnson & Johnson 738 121,578 1.42JPMorgan Chase & Co 372 57,861 0.67Kraft Heinz Co/The 1,959 79,888 0.93Linde PLC 242 69,962 0.82Marvell Technology Inc 1,441 84,054 0.98McDonald’s Corp 403 93,089 1.09Microsoft Corp 1,291 349,732 4.08NVIDIA Corp 104 83,210 0.97Procter & Gamble Co/The 841 113,476 1.32Trip.com Group Ltd 1,959 69,466 0.81Union Pacific Corp 553 121,621 1.42UnitedHealth Group Inc 184 73,681 0.86Verizon Communications Inc 1,268 71,046 0.83Visa Inc 300 70,146 0.82Walmart Inc 818 115,354 1.34Wells Fargo & Co 1,406 63,678 0.74
Total equities 5,446,702 63.49
Investment funds (31.13%)
Hong Kong (18.58%)
BEA Union Investment Asian Bond and Currency Fund – Class ADU 128,146 1,594,141 18.58
Holding shares/units Market value % of net assets
US$
Listed/quoted investments (94.62%) (continued)
Investment funds (31.13%) (continued)
The United States of America (12.55%)
Invesco QQQ Trust Series 1 173 61,316 0.72iShares Core MSCI Europe ETF 1,729 99,037 1.15iShares Global Consumer Staples ETF 3,642 222,672 2.60iShares Global Energy ETF 5,486 145,873 1.70iShares Global Financials ETF 1,798 139,543 1.63iShares MSCI Japan ETF 3,537 238,889 2.78SPDR S&P 500 ETF Trust 395 169,084 1.97 Total investment funds 2,670,555 31.13 Total investments 8,117,257 94.62 Other net assets 461,498 5.38 Total net assets 8,578,755 100.00 Total investments, at cost 7,650,867
Investment portfolio (continued)
BEA Union Investment Global Flexi Allocation Fund (continued)
Investment portfolio (continued)
BEA Union Investment Global Flexi Allocation Fund (continued)

37 38
A5請縮小打印70.5% A5請縮小打印70.5%
BEA UNION INVESTMENT SERIES
INVESTMENT REPORTAS AT 30 JUNE 2021 (UNAUDITED) (CONTINUED)
BEA UNION INVESTMENT SERIES
INVESTMENT REPORTAS AT 30 JUNE 2021 (UNAUDITED) (CONTINUED)
Investment portfolio (continued)
BEA Union Investment China High Yield Income Fund
Nominal value Market value % of net assetsUS$
Listed/quoted investments (97.51%)
Debt securities (97.52%)
Denominated in United States Dollar (97.52%)
Central China Real Estate Ltd 7.75% 24/05/2024 300,000 269,990 0.52Champion Path Holdings Ltd 4.50% 27/01/2026 200,000 212,092 0.41Champion Path Holdings Ltd 4.85% 27/01/2028 200,000 213,003 0.41China Aoyuan Group Ltd 5.375% 13/09/2022 700,000 689,433 1.34China Aoyuan Group Ltd 6.35% 08/02/2024 700,000 680,935 1.32China Aoyuan Group Ltd 7.95% 19/02/2023 500,000 511,260 0.99China Aoyuan Group Ltd 8.50% 23/01/2022 200,000 208,771 0.41China Evergrande Group 8.25% 23/03/2022 400,000 351,583 0.68China Evergrande Group 8.75% 28/06/2025 600,000 400,643 0.78China Evergrande Group 9.50% 11/04/2022 3,200,000 2,808,388 5.46China Evergrande Group 11.50% 22/01/2023 300,000 255,006 0.50China Oil & Gas Group Ltd 4.70% 30/06/2026 450,000 457,650 0.89China SCE Group Holdings Ltd 5.95%
29/09/2024 250,000 254,944 0.50China SCE Group Holdings Ltd 7.25%
19/04/2023 850,000 888,675 1.73China SCE Group Holdings Ltd 7.375%
09/04/2024 200,000 210,834 0.41CIFI Holdings Group Co Ltd 4.45% 17/08/2026 300,000 300,987 0.58CIFI Holdings Group Co Ltd 5.95% 20/10/2025 400,000 428,606 0.83CIFI Holdings Group Co Ltd 6.00% 16/07/2025 300,000 324,945 0.63CIFI Holdings Group Co Ltd 6.45% 07/11/2024 550,000 588,481 1.14Cliffton Ltd 6.25% 25/10/2025 500,000 502,443 0.98Continuum Energy Levanter Pte Ltd 4.50%
09/02/2027 200,000 209,036 0.41Easy Tactic Ltd 5.75% 13/01/2022 800,000 804,579 1.56Easy Tactic Ltd 5.875% 13/02/2023 300,000 273,597 0.53Easy Tactic Ltd 8.125% 27/02/2023 300,000 289,022 0.56Easy Tactic Ltd 8.875% 27/09/2021 800,000 819,891 1.59Easy Tactic Ltd 9.125% 28/07/2022 200,000 205,918 0.40Easy Tactic Ltd 11.75% 02/08/2023 300,000 310,219 0.60Fantasia Holdings Group Co Ltd 6.95%
17/12/2021 500,000 484,710 0.94Fantasia Holdings Group Co Ltd 11.75%
17/04/2022 600,000 580,934 1.13Fantasia Holdings Group Co Ltd 15.00%
18/12/2021 1,050,000 1,052,999 2.05
Investment portfolio (continued)
BEA Union Investment China High Yield Income Fund (continued)
Nominal value Market value % of net assetsUS$
Listed/quoted investments (97.51%) (continued)
Debt securities (97.52%) (continued)
Denominated in United States Dollar (97.52%) (continued)
Fortune Star BVI Ltd 5.00% 18/05/2026 200,000 204,100 0.40Fortune Star BVI Ltd 5.95% 19/10/2025 1,250,000 1,331,125 2.59Fortune Star BVI Ltd 6.75% 02/07/2023 400,000 434,789 0.84Fortune Star BVI Ltd 6.85% 02/07/2024 300,000 331,443 0.64Global Prime Capital Pte Ltd 5.95% 23/01/2025 400,000 428,106 0.83GMR Hyderabad International Airport Ltd 4.75%
02/02/2026 400,000 415,420 0.81Greentown China Holdings Ltd 5.65%
13/07/2025 200,000 212,845 0.41Hong Seng Ltd 9.875% 27/08/2022 200,000 209,275 0.41IIFL Finance Ltd 5.875% 20/04/2023 700,000 695,462 1.35Indiabulls Housing Finance Ltd 6.375%
28/05/2022 400,000 384,145 0.75Indika Energy Capital IV Pte Ltd 8.25%
22/10/2025 900,000 970,562 1.89JSW Hydro Energy Ltd 4.125% 18/05/2031 200,000 204,141 0.40Kaisa Group Holdings Ltd 9.375% 30/06/2024 500,000 471,870 0.92Kaisa Group Holdings Ltd 9.75% 28/09/2023 200,000 202,261 0.39Kaisa Group Holdings Ltd 10.50% 15/01/2025 700,000 693,544 1.35Kaisa Group Holdings Ltd 11.25% 16/04/2025 500,000 487,199 0.95Kaisa Group Holdings Ltd 11.50% 30/01/2023 1,500,000 1,592,949 3.09Kaisa Group Holdings Ltd 11.65% 01/06/2026 200,000 189,622 0.37Kaisa Group Holdings Ltd 11.70% 11/11/2025 250,000 240,175 0.47Kaisa Group Holdings Ltd 11.95% 12/11/2023 300,000 312,239 0.61KWG Group Holdings Ltd 7.40% 05/03/2024 1,000,000 1,068,844 2.08LMIRT Capital Pte Ltd 7.50% 09/02/2026 200,000 213,577 0.41Logan Group Co Ltd 4.85% 14/12/2026 400,000 402,988 0.78Logan Group Co Ltd 5.25% 19/10/2025 200,000 207,946 0.40Logan Group Co Ltd 5.75% 14/01/2025 300,000 320,365 0.62Logan Group Co Ltd 6.50% 16/07/2023 400,000 421,665 0.82Logan Group Co Ltd 6.90% 09/06/2024 800,000 860,397 1.67MGM China Holdings Ltd 5.875% 15/05/2026 200,000 211,645 0.41Modern Land China Co Ltd 11.80% 26/02/2022 1,200,000 1,231,251 2.39New Metro Global Ltd 4.80% 15/12/2024 250,000 252,523 0.49New Metro Global Ltd 6.80% 05/08/2023 200,000 213,902 0.42

39 40
A5請縮小打印70.5% A5請縮小打印70.5%
BEA UNION INVESTMENT SERIES
INVESTMENT REPORTAS AT 30 JUNE 2021 (UNAUDITED) (CONTINUED)
BEA UNION INVESTMENT SERIES
INVESTMENT REPORTAS AT 30 JUNE 2021 (UNAUDITED) (CONTINUED)
Nominal value Market value % of net assetsUS$
Listed/quoted investments (97.51%) (continued)
Debt securities (97.52%) (continued)
Denominated in United States Dollar (97.52%) (continued)
Powerlong Real Estate Holdings Ltd 3.90% 13/04/2022 200,000 201,526 0.39
Powerlong Real Estate Holdings Ltd 6.95% 23/07/2023 300,000 319,183 0.62
Powerlong Real Estate Holdings Ltd 7.125% 08/11/2022 400,000 420,460 0.82
Radiance Capital Investments Ltd 8.80% 17/09/2023 700,000 724,894 1.41
Radiance Capital Investments Ltd 11.75% 31/10/2021 400,000 415,764 0.81
Redco Properties Group Ltd 8.50% 19/08/2021 200,000 206,554 0.40ReNew Power Synthetic 6.67% 12/03/2024 300,000 322,301 0.63Ronshine China Holdings Ltd 5.25% 03/12/2021 300,000 298,297 0.58Ronshine China Holdings Ltd 5.50% 01/02/2022 300,000 302,320 0.59Ronshine China Holdings Ltd 10.50%
01/03/2022 900,000 943,416 1.83Scenery Journey Ltd 12.00% 24/10/2023 300,000 252,136 0.49Shriram Transport Finance Co Ltd 5.10%
16/07/2023 500,000 520,048 1.01Shriram Transport Finance Co Ltd 5.95%
24/10/2022 300,000 310,819 0.60Sinic Holdings Group Co Ltd 8.50% 24/01/2022 700,000 668,516 1.30Sinic Holdings Group Co Ltd 9.50% 18/10/2021 900,000 892,431 1.73SoftBank Group Corp 4.625% 06/07/2028 400,000 400,000 0.78SoftBank Group Corp 5.25% 06/07/2031 300,000 300,000 0.58Studio City Finance Ltd 6.00% 15/07/2025 200,000 216,165 0.42Studio City Finance Ltd 6.50% 15/01/2028 300,000 330,181 0.64Sunac China Holdings Ltd 5.95% 26/04/2024 400,000 404,979 0.79Sunac China Holdings Ltd 6.50% 26/01/2026 300,000 298,556 0.58Sunac China Holdings Ltd 6.65% 03/08/2024 600,000 618,689 1.20Sunac China Holdings Ltd 7.00% 09/07/2025 200,000 203,915 0.40Sunac China Holdings Ltd 7.95% 08/08/2022 300,000 316,971 0.62Sunac China Holdings Ltd 8.35% 19/04/2023 900,000 947,673 1.84Times China Holdings Ltd 5.55% 04/06/2024 350,000 352,475 0.68Times China Holdings Ltd 6.60% 02/03/2023 800,000 818,539 1.59Times China Holdings Ltd 6.75% 08/07/2025 400,000 419,167 0.81Vedanta Resources Finance II PLC 8.00%
23/04/2023 200,000 192,956 0.37Vedanta Resources Finance II PLC 13.875%
21/01/2024 200,000 233,074 0.45
Nominal value Market value % of net assetsUS$
Listed/quoted investments (97.51%) (continued)
Debt securities (97.52%) (continued)
Denominated in United States Dollar (97.52%) (continued)
Vedanta Resources Ltd 6.375% 30/07/2022 1,100,000 1,118,051 2.17West China Cement Ltd 4.95% 08/07/2026 700,000 709,625 1.38Yango Justice International Ltd 5.30%
11/01/2022 200,000 202,106 0.39Yango Justice International Ltd 10.25%
18/03/2022 1,000,000 1,035,796 2.01Yanlord Land HK Co Ltd 6.80% 27/02/2024 500,000 538,201 1.05Yuzhou Group Holdings Co Ltd 6.00%
25/10/2023 300,000 266,796 0.52Yuzhou Group Holdings Co Ltd 8.375%
30/10/2024 200,000 181,858 0.35Yuzhou Group Holdings Co Ltd 8.50%
04/02/2023 250,000 245,197 0.48Yuzhou Group Holdings Co Ltd 8.50%
26/02/2024 500,000 472,417 0.92Yuzhou Group Holdings Co Ltd 8.625%
23/01/2022 300,000 311,725 0.61Zhenro Properties Group Ltd 5.98% 13/04/2022 200,000 202,925 0.39Zhenro Properties Group Ltd 8.70% 03/08/2022 700,000 743,188 1.44Zhenro Properties Group Ltd 9.15% 06/05/2023 300,000 316,623 0.61 Total debt securities 50,202,462 97.52
Underlying Counterparty
Notional amount of contracts outstanding Fair value % of net assets
US$
Bond future (-0.01%)
The United States of America (-0.01%)
US 10Yr Note Future 21/09/2021 Citibank, Hong Kong (8) (4,167) (0.01)
Total bond future (4,167) (0.01)
Total investments 50,198,295 97.51
Investment portfolio (continued)
BEA Union Investment China High Yield Income Fund (continued)
Investment portfolio (continued)
BEA Union Investment China High Yield Income Fund (continued)

42
A5請縮小打印70.5%
BEA UNION INVESTMENT SERIES
INVESTMENT REPORTAS AT 30 JUNE 2021 (UNAUDITED) (CONTINUED)
41
A5請縮小打印70.5%
BEA UNION INVESTMENT SERIES
INVESTMENT REPORTAS AT 30 JUNE 2021 (UNAUDITED) (CONTINUED)
Underlying Counterparty
Notional amount of contracts outstanding Fair value % of net assets
US$
Foreign currency forward contracts (-0.11%)
Buy Australian Dollars/sell United States Dollars Citibank, Hong Kong AU$4,704,740 (32,477) (0.06)
Buy British Pound/sell United States Dollars Citibank, Hong Kong GBP400,000 (14,157) (0.03)
Buy British Pound/sell United States Dollars Citibank, Hong Kong GBP400,000 (11,001) (0.02)
Buy Canadian Dollars/sell United States Dollars Citibank, Hong Kong CA$700,000 (3,953) (0.01)
Buy New Zealand Dollars/sell United States Dollars Citibank, Hong Kong NZ$700,000 (5,118) (0.01)
Buy Norwegian Krone/sell United States Dollars Citibank, Hong Kong NOK4,000,000 (4,575) (0.01)
Buy Renminbi/sell United States Dollars Citibank, Hong Kong RMB7,000,000 (11,150) (0.02)
Buy Renminbi/sell United States Dollars Citibank, Hong Kong RMB52,455,763 9,474 0.02
Buy Renminbi/sell United States Dollars Citibank, Hong Kong RMB463,798 169 0.00
Buy Renminbi/sell United States Dollars Citibank, Hong Kong RMB369,328 115 0.00
Buy Renminbi/sell United States Dollars Citibank, Hong Kong RMB49,587 1 0.00
Buy Renminbi/sell United States Dollars Citibank, Hong Kong RMB23,569 (2) (0.00)
Buy United States Dollars/sell Australian Dollars Citibank, Hong Kong US$169,754 (136) (0.00)
Buy United States Dollars/sell British Pound Citibank, Hong Kong US$559,200 6,601 0.01
Buy United States Dollars/sell British Pound Citibank, Hong Kong US$554,600 2,001 0.00
Buy United States Dollars/sell Canadian Dollars Citibank, Hong Kong US$568,551 3,266 0.01
Buy United States Dollars/sell New Zealand Dollars Citibank, Hong Kong US$487,419 (1,691) (0.00)
Buy United States Dollars/sell Norwegian Krone Citibank, Hong Kong US$470,644 5,756 0.01
Total foreign currency forward contracts (56,877) (0.11) Other net assets 1,342,852 2.60 Total net assets 51,484,270 100.00 Total investments, at cost 49,933,472
Investment portfolio (continued)
BEA Union Investment China High Yield Income Fund (continued)
Investment portfolio (continued)
BEA Union Investment Asian Strategic Bond Fund
Nominal value Market value % of net assetsUS$
Listed/quoted investments (103.26%)
Debt securities (88.80%)
Denominated in Renminbi (2.30%)
Export-Import Bank Of India/London 3.45% 25/06/2026 2,000,000 309,010 0.34
GLP China Holdings Ltd 4.00% 02/07/2024 1,500,000 232,933 0.25HSBC Holdings PLC 3.40% 29/06/2027 2,000,000 311,716 0.34Vanke Real Estate Hong Kong Co Ltd 3.45%
25/05/2024 3,000,000 468,916 0.51Wharf REIC Finance BVI Ltd 3.20% 15/09/2023 5,000,000 790,740 0.86
Denominated in United States Dollar (86.50%)
AAC Technologies Holdings Inc 2.625% 02/06/2026 200,000 202,837 0.22
AAC Technologies Holdings Inc 3.75% 02/06/2031 250,000 256,898 0.28
ABJA Investment Co Pte Ltd 5.95% 31/07/2024 200,000 221,587 0.24Anton Oilfield Services Group/Hong Kong
7.50% 02/12/2022 300,000 298,257 0.32Azure Power Energy Ltd 5.50% 03/11/2022 500,000 513,165 0.56Azure Power Solar Energy Pvt Ltd 5.65%
24/12/2024 300,000 319,590 0.35Bangkok Bank PCL/Hong Kong 5.00% Perpetual
Callable – 23/09/2025 200,000 214,220 0.23Bank Negara Indonesia Persero Tbk PT 3.75%
30/03/2026 200,000 206,564 0.23Bank of China Hong Kong Ltd 5.90% Perpetual
Callable – 14/09/2023 500,000 547,818 0.60Bank of Communications Hong Kong Ltd
2.304% 08/07/2031 1,000,000 998,870 1.09Bluestar Finance Holdings Ltd 3.375%
16/07/2024 1,000,000 1,060,919 1.15Bukit Makmur Mandiri Utama PT 7.75%
10/02/2026 400,000 422,382 0.46Champion Path Holdings Ltd 4.50% 27/01/2026 200,000 212,092 0.23Champion Sincerity Holdings Ltd 8.125%
Perpetual Callable – 08/02/2022 200,000 212,665 0.23China Aoyuan Group Ltd 8.50% 23/01/2022 600,000 626,313 0.68China Huaneng Group Hong Kong Treasury
Management Holding Ltd 3.08% Perpetual Callable – 09/12/2025 800,000 819,802 0.89
China Oil & Gas Group Ltd 4.70% 30/06/2026 200,000 203,400 0.22China Oil & Gas Group Ltd 5.50% 25/01/2023 300,000 315,418 0.34

43 44
A5請縮小打印70.5% A5請縮小打印70.5%
BEA UNION INVESTMENT SERIES
INVESTMENT REPORTAS AT 30 JUNE 2021 (UNAUDITED) (CONTINUED)
BEA UNION INVESTMENT SERIES
INVESTMENT REPORTAS AT 30 JUNE 2021 (UNAUDITED) (CONTINUED)
Nominal value Market value % of net assetsUS$
Listed/quoted investments (103.26%) (continued)
Debt securities (88.80%) (continued)
Denominated in United States Dollar (86.50%) (continued)
Greenko Dutch BV 3.85% 29/03/2026 200,000 207,480 0.23Greenko Solar Mauritius Ltd 5.55% 29/01/2025 400,000 421,469 0.46Greentown China Holdings Ltd 4.70%
29/04/2025 200,000 203,191 0.22Greentown China Holdings Ltd 5.65%
13/07/2025 200,000 212,845 0.23HKT Capital No 5 Ltd 3.25% 30/09/2029 600,000 640,389 0.70Hong Seng Ltd 9.875% 27/08/2022 200,000 209,275 0.23Honghua Group Ltd 6.375% 01/08/2022 200,000 201,060 0.22India Green Energy Holdings 5.375%
29/04/2024 250,000 265,074 0.29India Green Power Holdings 4.00% 22/02/2027 250,000 255,503 0.28Indika Energy Capital III Pte Ltd 5.875%
09/11/2024 500,000 511,828 0.56Indika Energy Capital IV Pte Ltd 8.25%
22/10/2025 750,000 808,802 0.88Indonesia Asahan Aluminium Persero PT 4.75%
15/05/2025 200,000 221,554 0.24Indonesia Asahan Aluminium Persero PT 5.45%
15/05/2030 1,650,000 1,936,760 2.11JMH Co Ltd 2.50% 09/04/2031 900,000 916,915 1.00JMH Co Ltd 2.875% 09/04/2036 750,000 764,151 0.83JSW Hydro Energy Ltd 4.125% 18/05/2031 600,000 612,424 0.67JSW Steel Ltd 5.95% 18/04/2024 200,000 216,819 0.24Kaisa Group Holdings Ltd 6.50% 07/12/2021 200,000 201,535 0.22Kaisa Group Holdings Ltd 9.375% 30/06/2024 500,000 471,870 0.51Kaisa Group Holdings Ltd 11.25% 16/04/2025 200,000 194,879 0.21Kaisa Group Holdings Ltd 11.50% 30/01/2023 200,000 212,393 0.23Kaisa Group Holdings Ltd 11.65% 01/06/2026 500,000 474,054 0.52Kaisa Group Holdings Ltd 11.70% 11/11/2025 200,000 192,140 0.21Kaisa Group Holdings Ltd 11.95% 22/10/2022 200,000 210,957 0.23Kaisa Group Holdings Ltd 11.95% 12/11/2023 300,000 312,239 0.34Kasikornbank PCL/Hong Kong 5.275%
Perpetual Callable – 14/10/2025 200,000 214,918 0.23Krung Thai Bank PCL/Cayman Islands 4.40%
Perpetual Callable – 25/03/2026 200,000 205,407 0.22KWG Group Holdings Ltd 7.875% 01/09/2023 200,000 209,942 0.23LG Chem Ltd 2.375% 07/07/2031 650,000 650,221 0.71
Investment portfolio (continued)
BEA Union Investment Asian Strategic Bond Fund (continued)
Nominal value Market value % of net assetsUS$
Listed/quoted investments (103.26%) (continued)
Debt securities (88.80%) (continued)
Denominated in United States Dollar (86.50%) (continued)
China SCE Group Holdings Ltd 7.25% 19/04/2023 500,000 522,750 0.57
Chong Hing Bank Ltd 5.70% Perpetual Callable – 15/07/2024 1,500,000 1,612,760 1.75
CIFI Holdings Group Co Ltd 6.45% 07/11/2024 350,000 374,488 0.41Cliffton Ltd 6.25% 25/10/2025 500,000 502,443 0.55CMB Wing Lung Bank Ltd 3.75% 22/11/2027 600,000 616,009 0.67CNAC HK Finbridge Co Ltd 3.375% 19/06/2024 900,000 944,563 1.03CNAC HK Finbridge Co Ltd 4.125% 19/07/2027 500,000 551,976 0.60CNAC HK Finbridge Co Ltd 5.125% 14/03/2028 500,000 580,271 0.63CNOOC Finance 2013 Ltd 3.30% 30/09/2049 300,000 282,189 0.31CNOOC Petroleum North America ULC 5.875%
10/03/2035 500,000 628,307 0.68Continuum Energy Levanter Pte Ltd 4.50%
09/02/2027 250,000 261,295 0.28Country Garden Holdings Co Ltd 5.125%
14/01/2027 200,000 218,515 0.24Country Garden Holdings Co Ltd 6.15%
17/09/2025 400,000 446,791 0.49Country Garden Holdings Co Ltd 7.25%
08/04/2026 400,000 450,562 0.49Dah Sing Bank Ltd 4.25% 30/11/2026 500,000 506,045 0.55Easy Tactic Ltd 5.75% 13/01/2022 200,000 201,145 0.22Easy Tactic Ltd 8.875% 27/09/2021 200,000 204,973 0.22ENN Clean Energy International Investment Ltd
3.375% 12/05/2026 250,000 256,056 0.28Fantasia Holdings Group Co Ltd 6.95%
17/12/2021 700,000 678,594 0.74Fortune Star BVI Ltd 5.00% 18/05/2026 200,000 204,100 0.22Fortune Star BVI Ltd 5.95% 29/01/2023 300,000 316,228 0.34Fortune Star BVI Ltd 5.95% 19/10/2025 400,000 425,960 0.46Fortune Star BVI Ltd 6.75% 02/07/2023 300,000 326,092 0.35Fortune Star BVI Ltd 6.85% 02/07/2024 200,000 220,962 0.24GC Treasury Center Co Ltd 2.98% 18/03/2031 700,000 720,906 0.78GC Treasury Center Co Ltd 4.30% 18/03/2051 1,000,000 1,114,243 1.21Global Prime Capital Pte Ltd 5.95% 23/01/2025 400,000 428,106 0.47GLP China Holdings Ltd 2.95% 29/03/2026 450,000 459,926 0.50GMR Hyderabad International Airport Ltd 4.75%
02/02/2026 500,000 519,275 0.56GMR Hyderabad International Airport Ltd
5.375% 10/04/2024 200,000 210,037 0.23
Investment portfolio (continued)
BEA Union Investment Asian Strategic Bond Fund (continued)

45 46
A5請縮小打印70.5% A5請縮小打印70.5%
BEA UNION INVESTMENT SERIES
INVESTMENT REPORTAS AT 30 JUNE 2021 (UNAUDITED) (CONTINUED)
BEA UNION INVESTMENT SERIES
INVESTMENT REPORTAS AT 30 JUNE 2021 (UNAUDITED) (CONTINUED)
Nominal value Market value % of net assetsUS$
Listed/quoted investments (103.26%) (continued)
Debt securities (88.80%) (continued)
Denominated in United States Dollar (86.50%) (continued)
Perusahaan Listrik Negara PT 5.45% 21/05/2028 500,000 588,193 0.64
Perusahaan Listrik Negara PT 6.15% 21/05/2048 300,000 380,737 0.41
Petronas Capital Ltd 3.404% 28/04/2061 1,300,000 1,344,144 1.46Philippine Government International Bond
3.20% 06/07/2046 600,000 602,995 0.66Poly Developments and Holdings Group Co Ltd
4.75% 17/09/2023 350,000 376,426 0.41Power Finance Corp Ltd 3.75% 06/12/2027 1,000,000 1,043,564 1.13Powerlong Real Estate Holdings Ltd 3.90%
13/04/2022 200,000 201,526 0.22Powerlong Real Estate Holdings Ltd 6.25%
10/08/2024 200,000 212,492 0.23Powerlong Real Estate Holdings Ltd 7.125%
08/11/2022 300,000 315,345 0.34PTT PCL 5.875% 03/08/2035 800,000 1,048,994 1.14Qatar Petroleum 1.375% 12/09/2026 650,000 649,383 0.71Qatar Petroleum 2.25% 12/07/2031 650,000 643,090 0.70Qatar Petroleum 3.125% 12/07/2041 1,500,000 1,494,465 1.62Radiance Capital Investments Ltd 10.50%
16/01/2022 200,000 213,539 0.23ReNew Power Pvt Ltd 6.45% 27/09/2022 200,000 210,864 0.23ReNew Power Synthetic 6.67% 12/03/2024 250,000 268,584 0.29RKPF Overseas 2019 A Ltd 7.875% 01/02/2023 200,000 214,504 0.23Ronshine China Holdings Ltd 5.50%
01/02/2022 200,000 201,547 0.22Ronshine China Holdings Ltd 11.25%
22/08/2021 200,000 209,750 0.23Shimao Group Holdings Ltd 4.60% 13/07/2030 500,000 518,128 0.56Shimao Group Holdings Ltd 5.60% 15/07/2026 600,000 647,095 0.70Sinic Holdings Group Co Ltd 8.50% 24/01/2022 300,000 286,507 0.31Sinic Holdings Group Co Ltd 9.50% 18/10/2021 200,000 198,318 0.22SMBC Aviation Capital Finance DAC 2.30%
15/06/2028 400,000 405,957 0.44SoftBank Group Corp 4.625% 06/07/2028 400,000 400,000 0.44SoftBank Group Corp 5.25% 06/07/2031 300,000 300,000 0.33Sri Lanka Government International Bond 5.75%
18/04/2023 700,000 536,228 0.58Sri Lanka Government International Bond 6.85%
14/03/2024 500,000 358,535 0.39
Investment portfolio (continued)
BEA Union Investment Asian Strategic Bond Fund (continued)
Nominal value Market value % of net assetsUS$
Listed/quoted investments (103.26%) (continued)
Debt securities (88.80%) (continued)
Denominated in United States Dollar (86.50%) (continued)
LMIRT Capital Pte Ltd 7.25% 19/06/2024 250,000 261,922 0.28LMIRT Capital Pte Ltd 7.50% 09/02/2026 200,000 213,577 0.23Logan Group Co Ltd 5.25% 19/10/2025 200,000 207,946 0.23Logan Group Co Ltd 6.90% 09/06/2024 300,000 322,649 0.35Malaysia Wakala Sukuk Bhd 3.075%
28/04/2051 500,000 525,741 0.57Medco Oak Tree Pte Ltd 7.375% 14/05/2026 700,000 772,309 0.84Meituan 2.125% 28/10/2025 500,000 498,124 0.54Melco Resorts Finance Ltd 5.375% 04/12/2029 200,000 211,984 0.23Melco Resorts Finance Ltd 5.625% 17/07/2027 1,000,000 1,073,995 1.17Minejesa Capital BV 4.625% 10/08/2030 700,000 756,640 0.82Minejesa Capital BV 5.625% 10/08/2037 200,000 221,752 0.24Mirae Asset Securities Co Ltd 2.625%
30/07/2025 950,000 987,839 1.07Mongolia Government International Bond
3.50% 07/07/2027 200,000 197,336 0.21New Metro Global Ltd 4.80% 15/12/2024 200,000 202,019 0.22New Metro Global Ltd 6.80% 05/08/2023 300,000 320,852 0.35New Metro Global Ltd 7.50% 16/12/2021 200,000 204,579 0.22New World China Land Ltd 4.75% 23/01/2027 400,000 437,443 0.48NTPC Ltd 4.25% 26/02/2026 900,000 983,976 1.07NWD Finance BVI Ltd 4.125% Perpetual
Callable – 10/03/2028 300,000 304,103 0.33NWD Finance BVI Ltd 6.25% Perpetual Callable
– 07/03/2024 600,000 646,189 0.70NWD MTN Ltd 3.75% 14/01/2031 850,000 874,536 0.95Oil India International Pte Ltd 4.00%
21/04/2027 500,000 532,874 0.58ONGC Videsh Ltd 4.625% 15/07/2024 800,000 887,701 0.97Pakuwon Jati Tbk PT 4.875% 29/04/2028 200,000 210,573 0.23Pelabuhan Indonesia II PT 4.25% 05/05/2025 800,000 881,089 0.96Perenti Finance Pty Ltd 6.50% 07/10/2025 200,000 213,995 0.23Periama Holdings LLC/DE 5.95% 19/04/2026 750,000 825,060 0.90Pertamina Persero PT 2.30% 09/02/2031 600,000 582,271 0.63Pertamina Persero PT 6.45% 30/05/2044 850,000 1,114,319 1.21Perusahaan Listrik Negara PT 3.875%
17/07/2029 750,000 811,030 0.88Perusahaan Listrik Negara PT 4.125%
15/05/2027 1,000,000 1,093,041 1.19
Investment portfolio (continued)
BEA Union Investment Asian Strategic Bond Fund (continued)

47 48
A5請縮小打印70.5% A5請縮小打印70.5%
BEA UNION INVESTMENT SERIES
INVESTMENT REPORTAS AT 30 JUNE 2021 (UNAUDITED) (CONTINUED)
BEA UNION INVESTMENT SERIES
INVESTMENT REPORTAS AT 30 JUNE 2021 (UNAUDITED) (CONTINUED)
Nominal value Market value % of net assetsUS$
Listed/quoted investments (103.26%) (continued)
Investment fund (14.47%)
Hong Kong (14.47%)
BU APAC Bond Fund 1,280,639 13,305,841 14.47 Total Investment fund 13,305,841 14.47
Underlying Counterparty
Notional amount of
contracts outstanding Fair value
% of net assets
US$
Bond future (-0.01%)
The United States of America (-0.01%)
US 10Yr Note Future 21/09/2021 Citibank, Hong Kong (16) (8,333) (0.01) Total bond future (8,333) (0.01) Total investments 94,976,855 103.26
Investment portfolio (continued)
BEA Union Investment Asian Strategic Bond Fund (continued)
Nominal value Market value % of net assetsUS$
Listed/quoted investments (103.26%) (continued)
Debt securities (88.80%) (continued)
Denominated in United States Dollar (86.50%) (continued)
Studio City Finance Ltd 6.00% 15/07/2025 200,000 216,165 0.24Studio City Finance Ltd 6.50% 15/01/2028 500,000 550,301 0.60Sunac China Holdings Ltd 6.50% 09/07/2023 300,000 316,166 0.34Sunac China Holdings Ltd 7.00% 09/07/2025 200,000 203,915 0.22Sunac China Holdings Ltd 7.50% 01/02/2024 300,000 317,061 0.34Talent Yield International Ltd 3.125%
06/05/2031 700,000 732,098 0.80Tencent Holdings Ltd 2.88% 22/04/2031 250,000 259,867 0.28Tencent Holdings Ltd 3.68% 22/04/2041 900,000 964,569 1.05Tencent Holdings Ltd 3.84% 22/04/2051 700,000 760,046 0.83Theta Capital Pte Ltd 8.125% 22/01/2025 700,000 752,553 0.82Three Gorges Finance I Cayman Islands Ltd
3.20% 16/10/2049 360,000 353,494 0.38Times China Holdings Ltd 5.55% 04/06/2024 400,000 402,829 0.44Times China Holdings Ltd 6.60% 02/03/2023 300,000 306,952 0.33Times China Holdings Ltd 6.75% 16/07/2023 200,000 211,779 0.23TMBThanachart Bank PCL 4.90% Perpetual
Callable – 02/12/2024 750,000 766,850 0.83TML Holdings Pte Ltd 4.35% 09/06/2026 200,000 201,818 0.22TNB Global Ventures Capital Bhd 3.244%
19/10/2026 1,000,000 1,075,588 1.17United Overseas Bank Ltd 2.00% 14/10/2031 600,000 603,383 0.66Vanke Real Estate Hong Kong Co Ltd 3.15%
12/05/2025 500,000 521,304 0.57Vedanta Resources Finance II PLC 8.00%
23/04/2023 500,000 482,391 0.52Vedanta Resources Finance II PLC 13.875%
21/01/2024 400,000 466,148 0.51Vedanta Resources Ltd 6.375% 30/07/2022 700,000 711,487 0.77Vedanta Resources Ltd 7.125% 31/05/2023 500,000 467,311 0.51West China Cement Ltd 4.95% 08/07/2026 200,000 202,750 0.22Wynn Macau Ltd 5.625% 26/08/2028 500,000 533,071 0.58Yuzhou Group Holdings Co Ltd 8.50%
04/02/2023 200,000 196,158 0.21Yuzhou Group Holdings Co Ltd 8.625%
23/01/2022 500,000 519,542 0.56Zhenro Properties Group Ltd 5.98% 13/04/2022 200,000 202,925 0.22Zhenro Properties Group Ltd 8.70% 03/08/2022 400,000 424,679 0.46 Total debt securities 81,679,347 88.80
Investment portfolio (continued)
BEA Union Investment Asian Strategic Bond Fund (continued)

49 50
A5請縮小打印70.5% A5請縮小打印70.5%
BEA UNION INVESTMENT SERIES
INVESTMENT REPORTAS AT 30 JUNE 2021 (UNAUDITED) (CONTINUED)
BEA UNION INVESTMENT SERIES
INVESTMENT REPORTAS AT 30 JUNE 2021 (UNAUDITED) (CONTINUED)
Investment portfolio (continued)
BEA Union Investment Asian Opportunities Fund (formerly known as BEA Union Investment Asia Pacific Equity Dividend Fund)
Holding shares/units Market value % of net assets
US$
Listed/quoted investments (97.66%)
Equities (94.51%)
Australia (8.54%)
BHP Group Ltd 7,725 281,684 0.95Evolution Mining Ltd 40,311 136,186 0.46Karoon Energy Ltd 488,277 487,543 1.64Megaport Ltd 48,503 671,103 2.27NEXTDC Ltd 29,646 263,965 0.89OZ Minerals Ltd 15,083 254,554 0.86Qantas Airways Ltd 43,879 153,510 0.52Santos Ltd 33,304 177,271 0.60Viva Energy Group Ltd 71,393 103,445 0.35
China (6.43%)
Aier Eye Hospital Group Co Ltd – A 32,191 353,655 1.19Estun Automation Co Ltd – A 65,676 396,951 1.34Jiangsu Hengli Hydraulic Co Ltd – A 27,972 371,986 1.26LONGi Green Energy Technology Co Ltd – A 29,888 410,974 1.39Will Semiconductor Co Ltd Shanghai – A 5,500 274,112 0.93YanTai Shuangta Food Co Ltd – A 52,700 94,293 0.32
Hong Kong (21.43%)
AIA Group Ltd 56,200 698,353 2.36Alibaba Group Holding Ltd 10,400 294,623 0.99China East Education Holdings Ltd 73,500 115,467 0.39CITIC Securities Co Ltd – H 38,500 96,574 0.33Country Garden Services Holdings Co Ltd 48,000 518,579 1.75Ganfeng Lithium Co Ltd – H 20,000 298,744 1.01Hong Kong Exchanges & Clearing Ltd 6,700 399,282 1.35Innovent Biologics Inc 34,500 402,271 1.36JD.com Inc 5,650 222,192 0.75Longfor Group Holdings Ltd 74,000 414,507 1.40SITC International Holdings Co Ltd 168,000 701,997 2.37Tencent Holdings Ltd 22,900 1,722,105 5.82Wuxi Biologics Cayman Inc 25,100 459,928 1.55
Underlying Counterparty
Notional amount of
contracts outstanding Fair value
% of net assets
US$
Foreign currency forward contracts (-0.21%)
Buy Australian Dollars/sell United States Dollars
Citibank, Hong Kong
AU$23,485,472 (162,120) (0.18)
Buy Australian Dollars/sell United States Dollars
Citibank, Hong Kong
AU$13,841 (93) (0.00)
Buy British Pound/sell United States Dollars Citibank, Hong Kong
GBP700,000 (24,774) (0.03)
Buy British Pound/sell United States Dollars Citibank, Hong Kong
GBP700,000 (19,251) (0.02)
Buy Canadian Dollars/sell United States Dollars
Citibank, Hong Kong
CA$1,200,000 (6,776) (0.01)
Buy New Zealand Dollars/sell United States Dollars
Citibank, Hong Kong
NZ$1,300,000 (9,504) (0.01)
Buy Norwegian Krone/sell United States Dollars
Citibank, Hong Kong
NOK8,000,000 (9,149) (0.01)
Buy Renminbi/sell United States Dollars Citibank, Hong Kong
RMB6,500,000 (10,354) (0.01)
Buy Renminbi/sell United States Dollars Citibank, Hong Kong
RMB93,000,948 16,798 0.03
Buy Renminbi/sell United States Dollars Citibank, Hong Kong
RMB15,086 (1) (0.00)
Buy United States Dollars/sell Australian Dollars
Citibank, Hong Kong
US$398,609 4,254 0.00
Buy United States Dollars/sell Australian Dollars
Citibank, Hong Kong
US$22,360 188 0.00
Buy United States Dollars/sell British Pound Citibank, Hong Kong
US$978,600 11,551 0.01
Buy United States Dollars/sell British Pound Citibank, Hong Kong
US$970,550 3,501 0.00
Buy United States Dollars/sell Canadian Dollars
Citibank, Hong Kong
US$974,659 5,599 0.01
Buy United States Dollars/sell New Zealand Dollars
Citibank, Hong Kong
US$905,207 (3,141) (0.00)
Buy United States Dollars/sell Norwegian Krone
Citibank, Hong Kong
US$941,287 11,511 0.01
Total foreign currency forward contracts (191,761) (0.21) Other net assets (2,803,281) (3.05) Total net assets 91,981,813 100.00 Total investments, at cost 92,124,167
Investment portfolio (continued)
BEA Union Investment Asian Strategic Bond Fund (continued)

51 52
A5請縮小打印70.5% A5請縮小打印70.5%
BEA UNION INVESTMENT SERIES
INVESTMENT REPORTAS AT 30 JUNE 2021 (UNAUDITED) (CONTINUED)
BEA UNION INVESTMENT SERIES
INVESTMENT REPORTAS AT 30 JUNE 2021 (UNAUDITED) (CONTINUED)
Holding shares/units Market value % of net assets
US$
Listed/quoted investments (97.66%) (continued)
Equities (94.51%) (continued)
Malaysia (1.45%)
Dialog Group Bhd 96,500 67,177 0.23Greatech Technology Bhd 100,200 137,333 0.46Press Metal Aluminium Holdings Bhd 194,000 223,370 0.76
Singapore (1.02%)
DBS Group Holdings Ltd 13,600 301,604 1.02
Taiwan (17.51%)
ASE Technology Holding Co Ltd 116,000 466,296 1.58Evergreen Marine Corp Taiwan Ltd 106,000 749,476 2.53Hon Hai Precision Industry Co Ltd 68,000 273,346 0.92MediaTek Inc 16,000 552,434 1.87Novatek Microelectronics Corp 24,000 429,831 1.45Realtek Semiconductor Corp 26,000 471,249 1.59Taiwan Semiconductor Manufacturing Co Ltd 105,000 2,242,290 7.57
Thailand (1.84%)
Precious Shipping PCL – NVDR 522,500 340,723 1.15PTT PCL – NVDR 166,800 204,270 0.69
Investment portfolio (continued)
BEA Union Investment Asian Opportunities Fund (formerly known as BEA Union Investment Asia Pacific Equity Dividend Fund) (continued)
Holding shares/units Market value % of net assets
US$
Listed/quoted investments (97.66%) (continued)
Equities (94.51%) (continued)
India (14.27%)
Adani Ports & Special Economic Zone Ltd 28,168 266,683 0.90Bajaj Finance Ltd 3,681 297,930 1.01HDFC Life Insurance Co Ltd 31,748 293,145 0.99IndiaMart InterMesh Ltd 1,461 137,440 0.47Infosys Ltd 24,277 516,325 1.74Reliance Industries Ltd 26,568 754,443 2.55SBI Cards & Payment Services Ltd 22,409 292,567 0.99SBI Life Insurance Co Ltd 16,462 223,285 0.75Tata Consultancy Services Ltd 7,309 329,005 1.11Tata Consumer Products Ltd 66,972 679,746 2.30Tata Steel Ltd 15,895 249,479 0.84Tech Mahindra Ltd 12,440 183,343 0.62
Indonesia (2.79%)
Aneka Tambang Tbk 858,400 136,169 0.46Bank Central Asia Tbk PT 91,600 190,319 0.64Bank Jago Tbk PT 338,995 318,559 1.08Merdeka Copper Gold Tbk PT 897,300 181,947 0.61
Korea (15.45%)
Kakao Corp 4,810 696,203 2.35NAVER Corp 861 319,200 1.08NHN KCP Corp 2,411 124,387 0.42Samsung Electro-Mechanics Co Ltd 1,280 201,181 0.68Samsung Electronics Co Ltd 28,113 2,014,577 6.80Samsung SDI Co Ltd 774 479,733 1.62SK Hynix Inc 4,416 499,968 1.69SK Innovation Co Ltd 911 239,045 0.81
Investment portfolio (continued)
BEA Union Investment Asian Opportunities Fund (formerly known as BEA Union Investment Asia Pacific Equity Dividend Fund) (continued)

53 54
A5請縮小打印70.5% A5請縮小打印70.5%
BEA UNION INVESTMENT SERIES
INVESTMENT REPORTAS AT 30 JUNE 2021 (UNAUDITED) (CONTINUED)
BEA UNION INVESTMENT SERIES
INVESTMENT REPORTAS AT 30 JUNE 2021 (UNAUDITED) (CONTINUED)
Investment portfolio (continued)
BEA Union Investment China Gateway Fund
Holding shares/units/nominal
value Market value % of net assetsUS$
Listed/quoted investments (96.85%)
Equities (72.23%)
China (19.80%)
Aier Eye Hospital Group Co Ltd – A 21,117 231,994 0.45China CSSC Holdings Ltd – A 180,000 459,969 0.88China Tourism Group Duty Free Corp Ltd – A 15,996 742,996 1.43CITIC Securities Co Ltd – A 180,000 694,829 1.33Contemporary Amperex Technology Co Ltd –
A 6,000 496,652 0.95East Money Information Co Ltd – A 119,998 609,010 1.17Gigadevice Semiconductor Beijing Inc – A 11,380 330,962 0.64GoerTek Inc – A 110,000 727,673 1.40Industrial Bank Co Ltd – A 65,000 206,745 0.40Inner Mongolia Yili Industrial Group Co Ltd –
A 79,928 455,627 0.88Jiangsu Hengrui Medicine Co Ltd – A 24,000 252,486 0.49Kweichow Moutai Co Ltd – A 1,398 445,028 0.86LONGi Green Energy Technology Co Ltd – A 36,391 500,394 0.96Luxshare Precision Industry Co Ltd – A 177,855 1,266,290 2.43Ningbo Tuopu Group Co Ltd – A 44,972 260,538 0.50Suzhou Dongshan Precision Manufacturing Co
Ltd – A 150,000 483,836 0.93Tongwei Co Ltd – A 80,000 535,780 1.03Western Superconducting Technologies Co Ltd
– A 65,000 652,629 1.25Wuliangye Yibin Co Ltd – A 8,000 368,855 0.71Yunnan Energy New Material Co Ltd – A 16,000 579,736 1.11
Holding shares/units Market value % of net assets
US$
Listed/quoted investments (97.66%) (continued)
Equities (94.51%) (continued)
The United States of America (3.78%)
BeiGene Ltd – ADR 1,101 377,852 1.27Crowdstrike Holdings Inc 1,059 266,137 0.90GDS Holdings Ltd – ADR 6,066 476,120 1.61 Total equities 27,980,041 94.51
Investment fund (0.90%)
The United States of America (0.90%)
iShares Silver Trust 10,991 266,202 0.90 Total Investment fund 266,202 0.90
Real estate investment trusts (2.25%)
Australia (0.55%)
Charter Hall Group 14,135 164,696 0.55
The United States of America (1.70%)
Prologis Inc 4,207 502,863 1.70 Total real estate investment trusts 667,559 2.25 Total investments 28,913,802 97.66 Other net assets 691,995 2.34 Total net assets 29,605,797 100.00 Total investments, at cost 19,157,197
Investment portfolio (continued)
BEA Union Investment Asian Opportunities Fund (formerly known as BEA Union Investment Asia Pacific Equity Dividend Fund) (continued)

55 56
A5請縮小打印70.5% A5請縮小打印70.5%
BEA UNION INVESTMENT SERIES
INVESTMENT REPORTAS AT 30 JUNE 2021 (UNAUDITED) (CONTINUED)
BEA UNION INVESTMENT SERIES
INVESTMENT REPORTAS AT 30 JUNE 2021 (UNAUDITED) (CONTINUED)
Holding shares/units/nominal
value Market value % of net assetsUS$
Listed/quoted investments (96.85%) (continued)
Equities (72.23%) (continued)
Singapore (0.80%)
Yangzijiang Shipbuilding Holdings Ltd 400,000 419,580 0.80
The United States of America (6.71%)
ACM Research Inc 6,000 613,320 1.18Baidu Inc – ADR 1,500 305,850 0.59Bilibili Inc – ADR 3,000 365,520 0.70Futu Holdings Ltd – ADR 4,000 716,360 1.38Pinduoduo Inc – ADR 8,500 1,079,670 2.07Sea Ltd – ADR 1,500 411,900 0.79
Total equities 37,589,332 72.23
Debt securities (4.80%)
Denominated in United States Dollar (4.80%)
China Oil & Gas Group Ltd 5.50% 25/01/2023 200,000 210,279 0.40CNAC HK Finbridge Co Ltd 5.125%
14/03/2028 200,000 232,109 0.45ENN Clean Energy International Investment Ltd
3.375% 12/05/2026 200,000 204,845 0.39
Investment portfolio (continued)
BEA Union Investment China Gateway Fund (continued)
Holding shares/units/nominal
value Market value % of net assetsUS$
Listed/quoted investments (96.85%) (continued)
Equities (72.23%) (continued)
Hong Kong (44.92%)
AAC Technologies Holdings Inc 35,000 261,852 0.50Alibaba Group Holding Ltd 116,076 3,288,338 6.32A-Living Smart City Services Co Ltd – H 160,000 796,308 1.53Baidu Inc 32,000 821,649 1.58Bilibili Inc 3,300 406,240 0.78China BlueChemical Ltd – H 1,200,000 350,767 0.67China Construction Bank Corp – H 500,000 393,389 0.76China Mengniu Dairy Co Ltd 80,000 483,656 0.93China Merchants Bank Co Ltd – H 70,000 597,166 1.15China Mobile Ltd 80,000 500,139 0.96China Resources Beer Holdings Co Ltd 70,000 628,715 1.21CNOOC Ltd 300,000 341,109 0.65COSCO SHIPPING Holdings Co Ltd – H 220,000 554,119 1.06Country Garden Services Holdings Co Ltd 30,000 324,112 0.62Galaxy Entertainment Group Ltd 50,000 400,150 0.77GDS Holdings Ltd 22,000 217,851 0.42Hangzhou Tigermed Consulting Co Ltd – H 32,000 749,951 1.44JD.com Inc 35,118 1,381,052 2.65KWG Living Group Holdings Ltd 330,000 423,238 0.81Longfor Group Holdings Ltd 60,000 336,087 0.65Meituan 56,000 2,310,425 4.44NetEase Inc 12,000 271,806 0.52New Oriental Education & Technology Group
Inc 30,000 247,237 0.48Pacific Basin Shipping Ltd 2,500,000 1,007,617 1.94SJM Holdings Ltd 300,000 327,588 0.63Sunny Optical Technology Group Co Ltd 6,000 189,599 0.36Tencent Holdings Ltd 53,200 4,000,698 7.69Wuxi Biologics Cayman Inc 57,000 1,044,458 2.01Xiaomi Corp 85,000 295,525 0.57Zhaojin Mining Industry Co Ltd – H 200,000 190,063 0.37ZTE Corp – H 75,000 234,199 0.45
Investment portfolio (continued)
BEA Union Investment China Gateway Fund (continued)

57 58
A5請縮小打印70.5% A5請縮小打印70.5%
BEA UNION INVESTMENT SERIES
INVESTMENT REPORTAS AT 30 JUNE 2021 (UNAUDITED) (CONTINUED)
BEA UNION INVESTMENT SERIES
INVESTMENT REPORTAS AT 30 JUNE 2021 (UNAUDITED) (CONTINUED)
Underlying Counterparty
Notional amount of contracts outstanding Fair value % of net assets
US$
Foreign currency forward contracts (-0.07%)
Buy Australian Dollars/sell United States Dollars Citibank, Hong Kong AU$6,490,690 (44,805) (0.09)
Buy Australian Dollars/sell United States Dollars Citibank, Hong Kong AU$570,745 (4,626) (0.01)
Buy Renminbi/sell United States Dollars Citibank, Hong Kong RMB67,099,502 12,119 0.03
Buy Renminbi/sell United States Dollars Citibank, Hong Kong RMB3,609,530 45 0.00
Total foreign currency forward contracts (37,267) (0.07) Other net assets 1,674,112 3.22 Total net assets 52,039,280 100.00 Total investments, at cost 43,994,825
Investment portfolio (continued)
BEA Union Investment China Gateway Fund (continued)
Holding shares/units/nominal
value Market value % of net assetsUS$
Listed/quoted investments (96.85%) (continued)
Debt securities (4.80%) (continued)
Denominated in United States Dollar (4.80%) (continued)
Fortune Star BVI Ltd 6.75% 02/07/2023 300,000 326,092 0.63Gemdale Ever Prosperity Investment Ltd 5.60%
14/06/2022 100,000 102,865 0.20Honghua Group Ltd 6.375% 01/08/2022 200,000 201,060 0.39Kaisa Group Holdings Ltd 11.95% 22/10/2022 200,000 210,957 0.41NWD Finance BVI Ltd 4.125% Perpetual
Callable – 10/03/2028 200,000 202,735 0.39Powerlong Real Estate Holdings Ltd 7.125%
08/11/2022 200,000 210,230 0.40Shimao Group Holdings Ltd 5.60%
15/07/2026 300,000 323,548 0.62Yuzhou Group Holdings Co Ltd 8.375%
30/10/2024 300,000 272,787 0.52 Total debt securities 2,497,507 4.80
Investment funds (19.82%)
Hong Kong (19.82%)
BEA Union Investment Asian Bond and Currency Fund – Class IAU 539,118 5,935,691 11.40
BEA Union Investment China A-Share Equity Fund – Class IAU 98,000 2,940,003 5.65
BU APAC Bond Fund 138,585 1,439,902 2.77 Total investment funds 10,315,596 19.82 Total investments 50,402,435 96.85
Investment portfolio (continued)
BEA Union Investment China Gateway Fund (continued)

59 60
A5請縮小打印70.5% A5請縮小打印70.5%
BEA UNION INVESTMENT SERIES
INVESTMENT REPORTAS AT 30 JUNE 2021 (UNAUDITED) (CONTINUED)
BEA UNION INVESTMENT SERIES
INVESTMENT REPORTAS AT 30 JUNE 2021 (UNAUDITED) (CONTINUED)
Nominal value Market value % of net assetsUS$
Listed/quoted investments (97.81%) (continued)
Debt securities (97.81%) (continued)
Denominated in United States Dollar (97.81%) (continued)
New Metro Global Ltd 7.50% 16/12/2021 600,000 613,737 1.68Powerlong Real Estate Holdings Ltd 4.875%
15/09/2021 400,000 407,274 1.11Shanghai Pudong Development Bank Co Ltd/
Hong Kong FRN 24/09/2021 1,800,000 1,801,007 4.92SPIC 2016 US dollar Bond Co Ltd 3.00%
06/12/2021 500,000 504,982 1.38Sumitomo Mitsui Financial Group Inc FRN
11/01/2022 1,500,000 1,510,204 4.12TMBThanachart Bank PCL 3.108% 01/10/2021 200,000 202,440 0.55Yuzhou Group Holdings Co Ltd 8.625%
23/01/2022 2,500,000 2,597,710 7.09Zhenro Properties Group Ltd 9.80%
20/08/2021 1,800,000 1,877,096 5.13 Total debt securities 35,824,705 97.81 Total investments 35,824,705 97.81
Underlying Counterparty
Notional amount of contracts outstanding Fair value % of net assets
US$
Foreign currency forward contracts (0.01%)
Buy Renminbi/sell United States Dollars Citibank, Hong Kong RMB29,045,563 5,246 0.01
Total foreign currency forward contracts 5,246 0.01 Other net assets 795,492 2.18 Total net assets 36,625,443 100.00 Total investments, at cost 35,039,827
Investment portfolio (continued)
BEA Union Investment Asian Bond Target Maturity Fund 2022 (continued)
Investment portfolio (continued)
BEA Union Investment Asian Bond Target Maturity Fund 2022
Nominal value Market value % of net assetsUS$
Listed/quoted investments (97.81%)
Debt securities (97.81%)
Denominated in United States Dollar (97.81%)
Agile Group Holdings Ltd 8.50% 18/07/2021 1,500,000 1,562,784 4.27CDBL Funding 1 FRN 15/11/2021 2,600,000 2,605,401 7.11China Aoyuan Group Ltd 8.50% 23/01/2022 2,400,000 2,505,253 6.84China Construction Bank Corp/Hong Kong
FRN 24/09/2021 400,000 400,309 1.09CICC Hong Kong Finance 2016 MTN Ltd FRN
11/09/2021 2,600,000 2,602,043 7.11CIFI Holdings Group Co Ltd 5.50%
23/01/2022 2,500,000 2,596,297 7.09Clifford Capital Pte Ltd 3.423% 15/11/2021 200,000 203,068 0.55Country Garden Holdings Co Ltd 7.125%
27/01/2022 2,500,000 2,622,210 7.16Gemdale Ever Prosperity Investment Ltd 6.00%
06/09/2021 1,300,000 1,337,020 3.65Indonesia Government International Bond
3.70% 08/01/2022 1,000,000 1,035,643 2.83Industrial & Commercial Bank of China Ltd/
London FRN 25/10/2021 500,000 501,309 1.37Inventive Global Investments Ltd FRN
19/09/2021 1,400,000 1,401,069 3.83KWG Group Holdings Ltd 6.00% 11/01/2022 1,000,000 1,038,323 2.83KWG Group Holdings Ltd 7.875% 09/08/2021 700,000 725,650 1.98Legend Fortune Ltd FRN 16/07/2021 2,600,000 2,607,514 7.12Logan Group Co Ltd 5.75% 03/01/2022 1,000,000 1,041,301 2.84Mirae Asset Securities Co Ltd 4.125%
07/11/2021 1,500,000 1,525,061 4.16

61 62
A5請縮小打印70.5% A5請縮小打印70.5%
BEA UNION INVESTMENT SERIES
INVESTMENT REPORTAS AT 30 JUNE 2021 (UNAUDITED) (CONTINUED)
BEA UNION INVESTMENT SERIES
INVESTMENT REPORTAS AT 30 JUNE 2021 (UNAUDITED) (CONTINUED)
Nominal value Market value % of net assetsUS$
Listed/quoted investments (96.74%) (continued)
Debt securities (96.74%) (continued)
Denominated in United States Dollar (96.74%) (continued)
Pertamina Persero PT 4.30% 20/05/2023 1,500,000 1,603,961 1.15Philippine National Bank 4.25% 27/04/2023 1,409,000 1,498,310 1.07POSCO 2.375% 17/01/2023 4,300,000 4,449,896 3.19RKPF Overseas 2019 A Ltd 7.875%
01/02/2023 1,900,000 2,037,793 1.46Ronshine China Holdings Ltd 8.95%
22/01/2023 6,000,000 6,189,535 4.44Sunac China Holdings Ltd 8.35% 19/04/2023 6,700,000 7,054,899 5.06Times China Holdings Ltd 6.60% 02/03/2023 4,800,000 4,911,232 3.52Vedanta Resources Finance II PLC 8.00%
23/04/2023 3,800,000 3,666,168 2.63Yuzhou Group Holdings Co Ltd 8.50%
04/02/2023 5,500,000 5,394,336 3.87Zhenro Properties Group Ltd 9.15%
06/05/2023 2,500,000 2,639,158 1.89 Total debt securities 134,983,857 96.74 Total investments 134,983,857 96.74
Underlying Counterparty
Notional amount of contracts outstanding Fair value % of net assets
US$
Foreign currency forward contracts (0.02%)
Buy Renminbi/sell United States Dollars Citibank, Hong Kong RMB183,974,223 33,229 0.02
Total foreign currency forward contracts 33,229 0.02 Other net assets 4,522,312 3.24 Total net assets 139,539,398 100.00 Total investments, at cost 132,471,853
Investment portfolio (continued)
BEA Union Investment Asian Corporate Target Maturity Fund 2023 (continued)
Investment portfolio (continued)
BEA Union Investment Asian Corporate Target Maturity Fund 2023
Nominal value Market value % of net assetsUS$
Listed/quoted investments (96.74%)
Debt securities (96.74%)
Denominated in United States Dollar (96.74%)
Azure Orbit IV International Finance Ltd 3.75% 25/01/2023 5,600,000 5,895,512 4.22
Barclays PLC 4.61% 15/02/2023 4,600,000 4,796,308 3.44BOC Aviation Ltd 3.50% 31/01/2023 6,000,000 6,289,683 4.51BOC Aviation Ltd 4.375% 02/05/2023 1,000,000 1,063,830 0.76CDBL Funding 1 3.00% 24/04/2023 7,000,000 7,234,034 5.18China Aoyuan Group Ltd 7.95% 19/02/2023 4,500,000 4,601,340 3.30China Railway Resources Huitung Ltd 3.85%
05/02/2023 3,400,000 3,587,421 2.57China SCE Group Holdings Ltd 7.25%
19/04/2023 5,500,000 5,750,250 4.12CITIC Ltd 6.80% 17/01/2023 5,677,000 6,336,598 4.54CNAC HK Finbridge Co Ltd 4.625%
14/03/2023 7,700,000 8,202,860 5.88CRCC Yuxiang Ltd 3.50% 16/05/2023 2,216,000 2,316,551 1.66Easy Tactic Ltd 8.125% 27/02/2023 4,000,000 3,853,625 2.76Fortune Star BVI Ltd 5.95% 29/01/2023 2,700,000 2,846,214 2.04Hyundai Capital America 5.75% 06/04/2023 3,500,000 3,848,868 2.76Hyundai Capital Services Inc 3.75%
05/03/2023 4,000,000 4,242,413 3.04Kaisa Group Holdings Ltd 11.50% 30/01/2023 4,300,000 4,566,454 3.27Kia Corp 3.00% 25/04/2023 3,600,000 3,764,700 2.70Kuwait Projects Co SPC Ltd 5.00%
15/03/2023 5,100,000 5,375,105 3.85Logan Group Co Ltd 5.25% 23/02/2023 1,200,000 1,222,106 0.88ONGC Videsh Ltd 3.75% 07/05/2023 3,800,000 3,982,685 2.85PCCW-HKT Capital No 5 Ltd 3.75%
08/03/2023 5,455,000 5,762,012 4.13

63 64
A5請縮小打印70.5% A5請縮小打印70.5%
BEA UNION INVESTMENT SERIES
INVESTMENT REPORTAS AT 30 JUNE 2021 (UNAUDITED) (CONTINUED)
BEA UNION INVESTMENT SERIES
INVESTMENT REPORTAS AT 30 JUNE 2021 (UNAUDITED) (CONTINUED)
Nominal value Market value % of net assetsUS$
Listed/quoted investments (98.59%) (continued)
Debt securities (98.59%) (continued)
Denominated in United States Dollar (98.59%) (continued)
Pertamina Persero PT 4.30% 20/05/2023 1,500,000 1,603,961 2.16Philippine National Bank 4.25% 27/04/2023 2,250,000 2,392,618 3.23Powerlong Real Estate Holdings Ltd 6.95%
23/07/2023 2,600,000 2,766,251 3.73REC Ltd 4.75% 19/05/2023 2,000,000 2,118,943 2.86Ronshine China Holdings Ltd 8.95%
22/01/2023 2,300,000 2,372,655 3.20Sands China Ltd 4.60% 08/08/2023 3,000,000 3,250,762 4.38Seazen Group Ltd 6.15% 15/04/2023 2,300,000 2,386,074 3.22State Bank of India/London 4.50% 28/09/2023 1,500,000 1,624,178 2.19Sunac China Holdings Ltd 8.35% 19/04/2023 3,050,000 3,211,559 4.33Times China Holdings Ltd 6.60% 02/03/2023 1,000,000 1,023,173 1.38Times China Holdings Ltd 6.75% 16/07/2023 750,000 794,173 1.07Yango Justice International Ltd 9.25%
15/04/2023 1,400,000 1,448,276 1.95Yanlord Land HK Co Ltd 6.75% 23/04/2023 750,000 787,905 1.06Yuzhou Group Holdings Co Ltd 8.50%
04/02/2023 3,000,000 2,942,365 3.97Zhenro Properties Group Ltd 8.30%
15/09/2023 1,400,000 1,468,081 1.98
Total debt securities 73,094,712 98.59
Total investments 73,094,712 98.59
Investment portfolio (continued)
BEA Union Investment Asian Bond Target Maturity Fund 2023 (continued)
Investment portfolio (continued)
BEA Union Investment Asian Bond Target Maturity Fund 2023
Nominal value Market value % of net assetsUS$
Listed/quoted investments (98.59%)
Debt securities (98.59%)
Denominated in United States Dollar (98.59%)
ABJA Investment Co Pte Ltd 4.45% 24/07/2023 400,000 420,599 0.57
Azure Orbit IV International Finance Ltd 3.75% 25/01/2023 3,050,000 3,210,948 4.33
BOC Aviation Ltd 4.375% 02/05/2023 3,750,000 3,989,363 5.38China Aoyuan Group Ltd 7.95% 19/02/2023 1,950,000 1,993,914 2.69China SCE Group Holdings Ltd 7.25%
19/04/2023 3,300,000 3,450,150 4.65CICC Hong Kong Finance 2016 MTN Ltd
1.75% 10/08/2023 4,050,000 4,105,502 5.54CMHI Finance BVI Co Ltd 4.375% 06/08/2023 1,500,000 1,620,317 2.19CNAC HK Finbridge Co Ltd 4.625%
14/03/2023 3,800,000 4,048,165 5.46CRCC Yuxiang Ltd 3.50% 16/05/2023 380,000 397,242 0.54Fortune Star BVI Ltd 6.75% 02/07/2023 2,000,000 2,140,382 2.89Greenko Mauritius Ltd 6.25% 21/02/2023 400,000 422,120 0.57Indian Oil Corp Ltd 5.75% 01/08/2023 2,900,000 3,222,330 4.35Inventive Global Investments Ltd 1.50%
15/07/2023 3,300,000 3,338,104 4.50Kaisa Group Holdings Ltd 10.875%
23/07/2023 3,100,000 3,257,136 4.39Kaisa Group Holdings Ltd 11.50% 30/01/2023 400,000 424,786 0.57KWG Group Holdings Ltd 7.875% 01/09/2023 3,100,000 3,254,101 4.39ONGC Videsh Ltd 3.75% 07/05/2023 3,050,000 3,196,629 4.31PCCW-HKT Capital No 5 Ltd 3.75%
08/03/2023 390,000 411,950 0.56

65 66
A5請縮小打印70.5% A5請縮小打印70.5%
BEA UNION INVESTMENT SERIES
INVESTMENT REPORTAS AT 30 JUNE 2021 (UNAUDITED) (CONTINUED)
BEA UNION INVESTMENT SERIES
INVESTMENT REPORTAS AT 30 JUNE 2021 (UNAUDITED) (CONTINUED)
Statement of movements in portfolio holdings
BEA Union Investment Asian Bond and Currency Fund
% of net assetsAt 30 June
2021At 31 December
2020
Debt securities
Indonesian Rupiah – 2.90Renminbi 0.74 –Singapore Dollar 0.11 –United States Dollar 98.05 94.62
Bond future
The United States of America (0.01) 0.00
Credit default swaps – 0.26
Foreign currency forward contracts (0.07) 0.24 98.82 98.02
BEA Union Investment China A-Share Equity Fund
% of net assetsAt 30 June
2021At 31 December
2020
Equities
China 89.97 93.45
Investment funds
China 6.96 3.50 96.93 96.95
Underlying Counterparty
Notional amount of contracts outstanding Fair value % of net assets
US$
Foreign currency forward contracts (0.02%)
Buy Renminbi/sell United States Dollars Citibank, Hong Kong RMB68,522,438 12,376 0.02
Total foreign currency forward contracts 12,376 0.02 Other net assets 1,030,015 1.39 Total net assets 74,137,103 100.00 Total investments, at cost 73,021,880
Investment portfolio (continued)
BEA Union Investment Asian Bond Target Maturity Fund 2023 (continued)

67 68
A5請縮小打印70.5% A5請縮小打印70.5%
BEA UNION INVESTMENT SERIES
INVESTMENT REPORTAS AT 30 JUNE 2021 (UNAUDITED) (CONTINUED)
BEA UNION INVESTMENT SERIES
INVESTMENT REPORTAS AT 30 JUNE 2021 (UNAUDITED) (CONTINUED)
Statement of movements in portfolio holdings (continued)
BEA Union Investment China Phoenix Fund
% of net assetsAt 30 June
2021At 31 December
2020
Equities
China 31.41 26.27Hong Kong 61.24 63.35The United States of America 7.35 7.18
Foreign currency forward contracts 0.02 0.04
100.02 96.84
BEA Union Investment RMB Core Bond Fund
% of net assetsAt 30 June
2021At 31 December
2020
Debt securities
Renminbi 77.49 78.57
Investment fund
Hong Kong 21.81 19.99
Foreign currency forward contracts 0.02 0.44 99.32 99.00
Statement of movements in portfolio holdings (continued)
BEA Union Investment Asia Pacific Multi Income Fund
% of net assetsAt 30 June
2021At 31 December
2020
Equities
Australia 6.18 2.77China 0.61 –Hong Kong 1.01 1.25Korea 0.95 –Singapore – 1.56Taiwan 3.48 5.24Thailand 1.24 –The United States of America 0.83 –
Debt securities
Hong Kong Dollar – 0.62Indonesian Rupiah – 1.55Renminbi 1.17 0.58United States Dollar 43.30 41.91
Stapled security
Australia 1.70 1.68
Investment funds
Hong Kong 27.42 24.14
Real estate investment trusts
Australia 1.86 1.56Hong Kong 1.55 1.86Singapore 5.15 11.50The United States of America 2.34 1.73
Bond future
The United States of America (0.00) –
Foreign currency forward contracts (0.18) 0.35 98.61 98.30

69 70
A5請縮小打印70.5% A5請縮小打印70.5%
BEA UNION INVESTMENT SERIES
INVESTMENT REPORTAS AT 30 JUNE 2021 (UNAUDITED) (CONTINUED)
BEA UNION INVESTMENT SERIES
INVESTMENT REPORTAS AT 30 JUNE 2021 (UNAUDITED) (CONTINUED)
Statement of movements in portfolio holdings (continued)
BEA Union Investment Global Flexi Allocation Fund
% of net assetsAt 30 June
2021At 31 December
2020
Equities
Australia 1.58 1.81Canada 0.68 0.98France 3.03 1.07Germany 1.97 1.33Hong Kong 3.11 1.04Italy 0.95 0.81Japan 1.98 1.52Korea 0.87 0.70Netherlands 0.65 1.28Singapore 1.40 –Switzerland 2.16 1.06Taiwan 0.57 –The United Kingdom 2.12 1.44The United States of America 42.42 21.24
Debt securities
United States Dollar – 28.82
Investment funds
Hong Kong 18.58 17.23The United Kingdom – 2.01The United States of America 12.55 16.88
94.62 99.22
Statement of movements in portfolio holdings (continued)
BEA Union Investment Asia Pacific Flexi Allocation Fund
% of net assetsAt 30 June
2021At 31 December
2020
Equities
Australia 14.88 9.23China 5.65 7.28Hong Kong 15.73 20.08India 9.74 6.40Indonesia 2.38 0.63Korea 11.41 12.26Malaysia 1.28 0.29Singapore 0.77 1.13Taiwan 11.73 10.34Thailand 1.25 –The United States of America 2.85 4.74
Debt securities
United States Dollar 3.39 5.21
Stapled security
Australia 0.93 0.98
Investment funds
Hong Kong 10.96 12.12The United States of America 0.93 1.01
Real estate investment trusts
Australia 4.00 3.12Singapore – 0.47The United States of America 1.89 1.69
Foreign currency forward contracts (0.06) 0.24 99.71 97.22

71 72
A5請縮小打印70.5% A5請縮小打印70.5%
BEA UNION INVESTMENT SERIES
INVESTMENT REPORTAS AT 30 JUNE 2021 (UNAUDITED) (CONTINUED)
BEA UNION INVESTMENT SERIES
INVESTMENT REPORTAS AT 30 JUNE 2021 (UNAUDITED) (CONTINUED)
Statement of movements in portfolio holdings (continued)
BEA Union Investment Asian Opportunities Fund (formerly known as BEA Union Investment Asia Pacific Equity Dividend Fund)
% of net assetsAt 30 June
2021At 31 December
2020
Equities
Australia 8.54 5.73China 6.43 9.26Hong Kong 21.43 27.09India 14.27 9.82Indonesia 2.79 0.84Korea 15.45 17.35Malaysia 1.45 0.31Singapore 1.02 1.48Taiwan 17.51 14.33Thailand 1.84 –The United States of America 3.78 6.28
Investment fund
The United States of America 0.90 1.02
Real estate investment trusts
Australia 0.55 0.61Singapore – 1.20The United States of America 1.70 1.59
97.66 96.91
Statement of movements in portfolio holdings (continued)
BEA Union Investment China High Yield Income Fund
% of net assetsAt 30 June
2021At 31 December
2020
Debt securities
Indonesian Rupiah – 2.06United States Dollar 97.52 96.03
Bond future
The United States of America (0.01) 0.00
Foreign currency forward contracts (0.11) 0.26 97.40 98.35
BEA Union Investment Asian Strategic Bond Fund
% of net assetsAt 30 June
2021At 31 December
2020
Debt securities
Indonesian Rupiah – 2.58Renminbi 2.30 1.03United States Dollar 86.50 82.88
Investment fund
Hong Kong 14.47 12.25
Bond future
The United States of America (0.01) –
Foreign currency forward contracts (0.21) 0.41 103.05 99.15

73 74
A5請縮小打印70.5% A5請縮小打印70.5%
BEA UNION INVESTMENT SERIES
INVESTMENT REPORTAS AT 30 JUNE 2021 (UNAUDITED) (CONTINUED)
BEA UNION INVESTMENT SERIES
INVESTMENT REPORTAS AT 30 JUNE 2021 (UNAUDITED) (CONTINUED)
Statement of movements in portfolio holdings (continued)
BEA Union Investment Asian Bond Target Maturity Fund 2022
% of net assetsAt 30 June
2021At 31 December
2020
Debt securities
United States Dollar 97.81 99.25
Foreign currency forward contracts 0.01 0.05 97.82 99.30
BEA Union Investment Asian Corporate Target Maturity Fund 2023
% of net assetsAt 30 June
2021At 31 December
2020
Debt securities
United States Dollar 96.74 98.70
Foreign currency forward contracts 0.02 0.07 96.76 98.77
BEA Union Investment Asian Bond Target Maturity Fund 2023(1)
% of net assetsAt 30 June
2021At 31 December
2020
Debt securities
United States Dollar 98.59 99.25
Foreign currency forward contracts 0.02 0.05
98.61 99.30
(1) The date of commencement for BEA Union Investment Asian Bond Target Maturity Fund 2023 was 14 September 2020.
Statement of movements in portfolio holdings (continued)
BEA Union Investment China Gateway Fund
% of net assetsAt 30 June
2021At 31 December
2020
Equities
China 19.80 13.27Hong Kong 44.92 44.38Singapore 0.80 –The United States of America 6.71 4.67
Debt securities
United States Dollar 4.80 18.64
Investment fund
Hong Kong 19.82 16.45
Foreign currency forward contracts (0.07) 0.20 96.78 97.61

76
A5請縮小打印70.5%
BEA UNION INVESTMENT SERIES
HOLDINGS OF COLLATERALAS AT 30 JUNE 2021 (UNAUDITED) (CONTINUED)
75
A5請縮小打印70.5%
BEA UNION INVESTMENT SERIES
HOLDINGS OF COLLATERALAS AT 30 JUNE 2021 (UNAUDITED)
BEA Union Investment Asian Bond and Currency Fund
Collateral providerNature of collateral
Maturity tenor
Currency denomination
% of net asset value
by collateralValue of
the collateralUS$
Citibank N.A., New York Branch Cash N/A US$ 0.57 4,700,310
Barclays Bank PLC Cash N/A US$ 0.09 770,000BNP Paribas Cash N/A US$ 0.05 390,000
As at 30 June 2021, the sub-fund does not have any re-investment of cash collateral.
BEA Union Investment Asia Pacific Multi Income Fund
Collateral providerNature of collateral
Maturity tenor
Currency denomination
% of net asset value
by collateralValue of
the collateralUS$
Citibank N.A., New York Branch Cash N/A US$ 0.89 2,170,136
As at 30 June 2021, the sub-fund does not have any re-investment of cash collateral.
BEA Union Investment Asia Pacific Flexi Allocation Fund
Collateral providerNature of collateral
Maturity tenor
Currency denomination
% of net asset value
by collateralValue of
the collateralUS$
Citibank N.A., New York Branch Cash N/A US$ 0.00 13
As at 30 June 2021, the sub-fund does not have any re-investment of cash collateral.
BEA Union Investment China High Yield Income Fund
Collateral providerNature of collateral
Maturity tenor
Currency denomination
% of net asset value
by collateralValue of
the collateralUS$
Citibank N.A., New York Branch Cash N/A US$ 0.54 280,016
As at 30 June 2021, the sub-fund does not have any re-investment of cash collateral.
BEA Union Investment Asian Strategic Bond Fund
Collateral providerNature of collateral
Maturity tenor
Currency denomination
% of net asset value
by collateralValue of
the collateralUS$
Citibank N.A., New York Branch Cash N/A US$ 0.97 890,051
As at 30 June 2021, the sub-fund does not have any re-investment of cash collateral.

BEA UNION INVESTMENT SERIES
STATEMENT OF COMPREHENSIVE INCOME FOR THE PERIOD ENDED 30 JUNE 2021 (UNAUDITED)
77
A5請縮小打印70.5%
BEA Union Investment Asian Bond and Currency Fund
BEA Union Investment China A-Share Equity Fund
BEA Union Investment Asia Pacific Multi Income Fund
BEA Union Investment China Phoenix Fund
BEA Union Investment RMB Core Bond Fund
2021 2020 2021 2020 2021 2020 2021 2020 2021 2020US$ US$ US$ US$ US$ US$ US$ US$ RMB RMB
Income
Dividend income – – 177,817 281,783 935,850 1,254,640 71,508 64,023 925,573 170,342Interest on bank deposits 1,308 20,307 1,122 1,981 347 10,219 8 203 2,706 1,908Other investment income 47,780 63,500 5,745 228 328,072 248,907 – – 141,591 27,364Net realised gains/(losses) on investments 27,581,067 (81,475,243) 2,225,637 3,038,559 3,686,464 (9,016,234) 996,536 982,804 2,807,212 4,984,441Net movement in unrealised (losses)/gains on investments (18,638,439) (28,836,333) 1,051,020 466,852 5,451,169 (14,511,396) 187,188 171,466 (1,362,859) (57,672)Exchange (losses)/gains (164,595) (188,698) 251,202 (354,144) (1,120,189) (2,591,954) (6,642) (2,328) 99,119 84,457
Total investment income 8,827,121 (110,416,467) 3,712,543 3,435,259 9,281,713 (24,605,818) 1,248,598 1,216,168 2,613,342 5,210,840
Other income – 7,829,214 – – – – – – – –
8,827,121 (102,587,253) 3,712,543 3,435,259 9,281,713 (24,605,818) 1,248,598 1,216,168 2,613,342 5,210,840
Expenses
Investment management fees 4,244,392 4,094,343 295,468 212,103 1,774,108 2,087,990 120,746 69,835 715,976 1,018,193Trustee’s fees 519,988 466,910 33,903 24,321 190,083 223,713 12,075 6,984 89,497 127,274Safe custody and bank charges 40,124 39,942 20,431 20,952 13,706 17,208 6,825 5,953 12,092 15,111Auditors’ remuneration 5,687 5,234 5,687 5,234 5,687 5,234 5,687 5,234 36,788 36,869Registrar’s fees 76,030 69,702 9,687 6,949 32,645 36,046 3,450 1,995 35,798 50,910Printing and publication expenses 9,718 8,504 448 405 2,877 4,276 167 125 1,540 2,935Regulatory fees 580 1,167 582 583 579 1,166 – 3,000 3,809 4,090Legal and professional fees 11,516 8,185 47 – 11,516 18,692 47 2,693 302 –Transaction costs 15,281 28,363 50,598 133,639 251,654 236,119 46,845 26,534 – 583Interest expenses 3,073 1,763 12 1,337 29 692 34 3 13 1,934Other operating expenses 73,661 74,395 820 859 29,232 29,947 1,226 1,043 4,618 5,444
5,000,050 4,798,508 417,683 406,382 2,312,116 2,661,083 197,102 123,399 900,433 1,263,343
Profit/(loss) before finance costs 3,827,071 (107,385,761) 3,294,860 3,028,877 6,969,597 (27,266,901) 1,051,496 1,092,769 1,712,909 3,947,497
Distribution to unitholders (19,709,986) (13,191,336) – – (7,674,496) (9,478,161) – – (3,589,938) (4,603,921)
(Loss)/profit before taxation (15,882,915) (120,577,097) 3,294,860 3,028,877 (704,899) (36,745,062) 1,051,496 1,092,769 (1,877,029) (656,424)
Taxation (including withholding tax) (8,784) (254,783) (18,073) (28,628) (68,194) (180,646) (5,219) (3,298) – –
(Loss)/profit and total comprehensive income for the period (15,891,699) (120,831,880) 3,276,787 3,000,249 (773,093) (36,925,708) 1,046,277 1,089,471 (1,877,029) (656,424)

BEA UNION INVESTMENT SERIES
STATEMENT OF COMPREHENSIVE INCOME FOR THE PERIOD ENDED 30 JUNE 2021 (UNAUDITED) (CONTINUED)
78
A5請縮小打印70.5%
BEA Union Investment Asia Pacific Flexi Allocation Fund
BEA Union Investment Global Flexi Allocation Fund
BEA Union Investment China High Yield Income Fund
BEA Union Investment Asian Strategic Bond Fund
BEA Union Investment Asian Opportunities Fund
(formerly known as BEA Union Investment Asia Pacific Equity Dividend Fund)
2021 2020 2021 2020 2021 2020 2021 2020 2021 2020US$ US$ US$ US$ US$ US$ US$ US$ US$ US$
Income
Dividend income 338,311 264,475 117,388 107,671 – – – – 185,126 145,169Interest on bank deposits 12 321 8 6 81 272 176 3,490 11 232Other investment income 20,691 20,549 9,641 12,462 1,050 1,886 35,849 6,338 – –Net realised gains/(losses) on investments 2,269,181 (476,223) 737,739 (89,257) 1,862,134 1,131,772 2,169,734 3,486,930 1,669,236 (576,373)Net movement in unrealised (losses)/gains on investments 919,675 (102,987) (381,103) (284,863) (2,438,406) (1,949,968) (3,093,866) (1,878,300) 1,948,722 893,263Exchange (losses)/gains (327,075) (278,894) (37,131) (7,044) (5,398) (1,340) (17,856) (69,333) (288,091) (264,912)
Total investment income 3,220,795 (572,759) 446,542 (261,025) (580,539) (817,378) (905,963) 1,549,125 3,515,004 197,379
Other income – – – – – – – – – –
3,220,795 (572,759) 446,542 (261,025) (580,539) (817,378) (905,963) 1,549,125 3,515,004 197,379
Expenses
Investment management fees 239,560 164,845 65,735 86,523 321,848 326,213 538,845 689,374 210,296 137,632Trustee’s fees 23,956 16,485 6,573 8,652 40,231 40,777 67,356 86,172 21,030 13,763Safe custody and bank charges 5,527 8,000 1,917 2,059 4,993 5,580 8,129 11,303 5,126 7,647Auditors’ remuneration 5,687 5,234 5,687 5,234 5,687 5,234 5,687 5,234 5,687 5,234Registrar’s fees 7,985 5,495 2,191 2,884 13,309 13,464 21,658 24,015 7,010 4,588Printing and publication expenses 360 300 99 164 630 752 1,112 1,881 809 262Regulatory fees – – 580 581 579 581 – – 580 –Legal and professional fees 5,926 6,373 5,298 4,298 47 – 47 – 5,990 6,242Transaction costs 45,163 46,340 8,427 4,494 960 676 2,047 799 35,906 52,891Interest expenses 55 642 – 34 27 6 102 268 – 112Other operating expenses 4,016 2,338 714 769 4,054 3,173 10,405 11,118 714 769
338,235 256,052 97,221 115,692 392,365 396,456 655,388 830,164 293,148 229,140
Profit/(loss) before finance costs 2,882,560 (828,811) 349,321 (376,717) (972,904) (1,213,834) (1,561,351) 718,961 3,221,856 (31,761)
Distribution to unitholders (517,167) (416,112) (178,197) (269,736) (2,196,270) (2,270,169) (2,767,896) (3,516,700) – –
(Loss)/profit before taxation 2,365,393 (1,244,923) 171,124 (646,453) (3,169,174) (3,484,003) (4,329,247) (2,797,739) 3,221,856 (31,761)
Taxation (including withholding tax) (21,962) (5,151) (13,744) (3,018) 106 – (1,379) (35,470) (28,370) (16,216)
(Loss)/profit and total comprehensive income for the period 2,343,431 (1,250,074) 157,380 (649,471) (3,169,068) (3,484,003) (4,330,626) (2,833,209) 3,193,486 (47,977)

BEA UNION INVESTMENT SERIES
STATEMENT OF COMPREHENSIVE INCOME FOR THE PERIOD ENDED 30 JUNE 2021 (UNAUDITED) (CONTINUED)
79
A5請縮小打印70.5%
BEA Union Investment China Gateway Fund
BEA Union Investment Asian Bond Target Maturity Fund 2022
BEA Union Investment Asian Corporate Target Maturity Fund
2023
BEA Union Investment Asian Bond
Target Maturity Fund 2023 (1)
2021 2020 2021 2020 2021 2020 2021US$ US$ US$ US$ US$ US$ US$
Income
Dividend income 121,199 172,319 – – – – –Interest on bank deposits 21 198 21 61 56 49 21Other investment income 39,386 24,494 – 510 3,800 958 –Net realised gains/(losses) on investments 5,024,260 4,132,559 320,218 1,135,121 3,545,351 3,193,518 27,808Net movement in unrealised (losses)/gains on investments (2,111,677) 1,151,476 (356,201) (702,225) (2,469,811) (488,227) (1,160,624)Exchange (losses)/gains (20,610) (82,935) 239 (2,170) 255 (4,575) (128)
Total investment income 3,052,579 5,398,111 (35,723) 431,297 1,079,651 2,701,723 (1,132,923)
Other income – – – – – – –
3,052,579 5,398,111 (35,723) 431,297 1,079,651 2,701,723 (1,132,923)
Expenses
Investment management fees 329,756 305,741 112,684 146,221 436,273 335,758 231,720Trustee’s fees 32,975 30,574 23,476 30,463 32,721 25,182 17,379Safe custody and bank charges 8,771 9,003 1,577 2,006 5,951 4,857 3,109Auditors’ remuneration 5,687 5,234 5,687 5,234 5,687 5,234 5,687Registrar’s fees 10,988 10,189 9,390 12,171 24,538 21,797 17,984Printing and publication expenses 579 627 431 688 1,639 1,480 878Regulatory fees 580 581 – – – – –Legal and professional fees 47 187 1 – 1 – 1Transaction costs 142,480 172,579 – – – – –Interest expenses 86 10,000 – – – 4 8Other operating expenses 4,335 4,697 4,304 4,645 11,506 8,479 2,388
536,284 549,412 157,550 201,428 518,316 402,791 279,154
Profit/(loss) before finance costs 2,516,295 4,848,699 (193,273) 229,869 561,335 2,298,932 (1,412,077)
Distribution to unitholders (1,034,381) (790,793) (495,408) (790,322) (3,162,457) (2,302,747) (1,374,926)
(Loss)/profit before taxation 1,481,914 4,057,906 (688,681) (560,453) (2,601,122) (3,815) (2,787,003)
Taxation (including withholding tax) (8,286) (9,681) – – – – –
(Loss)/profit and total comprehensive income for the period 1,473,628 4,048,225 (688,681) (560,453) (2,601,122) (3,815) (2,787,003)
(1) The date of commencement for BEA Union Investment Asian Bond Target Maturity Fund 2023 was 14 September 2020

BEA UNION INVESTMENT SERIES
STATEMENT OF ASSETS AND LIABILITIES AT 30 JUNE 2021 (UNAUDITED)
80
A5請縮小打印70.5%
BEA Union Investment Asian Bond and Currency Fund
BEA Union Investment China A-Share Equity Fund
BEA Union Investment Asia Pacific Multi Income Fund
BEA Union Investment China Phoenix Fund
BEA Union Investment RMB Core Bond Fund
30 June 2021 31 December 2020 30 June 2021 31 December 2020 30 June 2021 31 December 2020 30 June 2021 31 December 2020 30 June 2021 31 December 2020US$ US$ US$ US$ US$ US$ US$ US$ RMB RMB
Assets
Investments 819,162,594 830,395,674 39,932,920 38,564,672 240,817,021 269,399,582 15,530,618 10,628,423 190,808,186 117,029,156Amounts receivable from foreign currency
forward contracts – 2,052,717 – – – 940,708 2,781 3,906 47,708 524,247Dividend receivables – – – – 189,203 96,948 19,657 3,808 – –Amounts receivable from sale of investments 11,597,910 875,665 1,527 – 4,811,185 1,661,126 1,482,909 1,029,016 – –Amounts receivable on subscription 341,595 2,338,304 – – 809,458 506,928 89,957 14,879 138,389 –Other receivables – – 2,203 6,276 53,621 53,275 – – 34,516 20,074Amounts due from brokers 635,489 306,159 52,231 52,246 107,878 32,187 96,499 96,575 52,906 53,212Bank balances 29,299,857 18,477,727 1,292,869 1,242,679 3,513,880 11,741,415 307,566 268,885 5,394,955 1,323,094
Total assets 861,037,445 854,446,246 41,281,750 39,865,873 250,302,246 284,432,169 17,529,987 12,045,492 196,476,660 118,949,783
Liabilities
Amounts payable on redemption 1,428,042 1,929,269 – – 706,519 1,195,979 355,631 – 80,508 –Amounts payable on foreign currency forward
contracts 618,410 – – – 437,788 – – – – –Amounts payable for purchase of investments 28,615,709 2,368,349 1,530 – 4,859,570 7,784,490 1,607,108 1,033,365 4,000,000 –Amounts due to brokers 1,141,822 – – – 151,937 – – – – –Accruals and other payables 883,791 869,178 84,086 86,413 372,908 425,519 35,937 31,968 246,191 208,034
Total liabilities (excluding net assets attributable to unitholders) 32,687,774 5,166,796 85,616 86,413 6,528,722 9,405,988 1,998,676 1,065,333 4,326,699 208,034
Net assets attributable to unitholders
Financial liabilities 828,349,671 849,279,450 41,196,134 39,779,460 243,773,524 275,026,181 15,531,311 10,980,159 192,149,961 118,741,749
Equity – – – – – – – – – –

BEA UNION INVESTMENT SERIES
STATEMENT OF ASSETS AND LIABILITIES AT 30 JUNE 2021 (UNAUDITED) (CONTINUED)
81
A5請縮小打印70.5%
BEA Union Investment Asia Pacific Flexi Allocation Fund
BEA Union Investment Global Flexi Allocation Fund
BEA Union Investment China High Yield Income Fund
BEA Union Investment Asian Strategic Bond Fund
BEA Union Investment Asian Opportunities Fund
(formerly known as BEA Union Investment Asia Pacific Equity Dividend Fund)
30 June 2021 31 December 2020 30 June 2021 31 December 2020 30 June 2021 31 December 2020 30 June 2021 31 December 2020 30 June 2021 31 December 2020US$ US$ US$ US$ US$ US$ US$ US$ US$ US$
Assets
Investments 31,129,211 28,193,595 8,117,257 9,456,094 50,198,295 54,416,080 94,976,855 126,694,516 28,913,802 25,595,066Amounts receivable from foreign currency
forward contracts – 69,000 – – – 149,424 – 537,598 – –Dividend receivables 57,317 23,025 9,023 4,416 – – – – 33,458 15,891Amounts receivable from sale of investments 277,117 9,410 – 200,849 149,809 26,439 7,983,962 1,264,772 275,967 –Amounts receivable on subscription 22,611 242,669 14,039 – 90,229 218,393 2,335 224,961 – –Other receivables 3,399 3,558 1,584 1,658 – – 5,453 6,638 – –Amounts due from brokers 18,703 18,708 373 373 101,792 92,111 63,750 60,373 725 725Bank balances 13,257 713,820 463,891 45,073 2,580,112 750,329 2,165,937 1,727,559 574,246 853,978
Total assets 31,521,615 29,273,785 8,606,167 9,708,463 53,120,237 55,652,776 105,198,292 130,516,417 29,798,198 26,465,660
Liabilities
Amounts payable on redemption 74,445 130,950 5,295 149,111 16,459 68,301 931,050 265,767 – –Amounts payable on foreign currency forward
contracts 19,993 – – – 56,877 – 191,761 – – –Amounts payable for purchase of investments 162,244 9,536 – – 1,416,440 26,793 11,837,166 1,785,782 138,082 –Amounts due to brokers – – – – 75,969 – 151,937 – – –Accruals and other payables 62,958 60,891 22,117 28,543 70,222 81,342 104,565 147,328 54,319 53,349
Total liabilities (excluding net assets attributable to unitholders) 319,640 201,377 27,412 177,654 1,635,967 176,436 13,216,479 2,198,877 192,401 53,349
Net assets attributable to unitholders
Financial liabilities 31,201,975 29,072,408 8,578,755 9,530,809 51,484,270 55,476,340 91,981,813 128,317,540 – –
Equity – – – – – – – – 29,605,797 26,412,311

BEA UNION INVESTMENT SERIES
STATEMENT OF ASSETS AND LIABILITIES AT 30 JUNE 2021 (UNAUDITED) (CONTINUED)
A5請縮小打印70.5%
82
BEA Union Investment China Gateway Fund
BEA Union Investment Asian Bond Target Maturity Fund 2022
BEA Union Investment Asian Corporate Target
Maturity Fund 2023BEA Union Investment
Asian Bond Target Maturity Fund 2023 (1)
30 June 2021 31 December 2020 30 June 2021 31 December 2020 30 June 2021 31 December 2020 30 June 2021 31 December 2020US$ US$ US$ US$ US$ US$ US$ US$
Assets
Investments 50,402,435 38,331,283 35,824,705 38,527,069 134,983,857 154,163,505 73,094,712 81,126,000Amounts receivable from foreign currency
forward contracts – 79,704 5,246 18,886 33,229 117,045 12,376 42,246Dividend receivables 17,836 11,931 – – – – – –Amounts receivable from sale of investments 3,330,221 1,355,709 – – – 1,097,930 – –Amounts receivable on subscription 26,521 35,347 – – – – – –Other receivables 8,147 5,593 – – – – – –Amounts due from brokers 32,265 32,273 – – – – – –Bank balances 2,654,315 549,700 2,077,615 319,792 8,414,073 999,670 3,610,177 767,292
Total assets 56,471,740 40,401,540 37,907,566 38,865,747 143,431,159 156,378,150 76,717,265 81,935,538
Liabilities
Amounts payable on redemption 498,928 67,241 – – 103,659 35,024 – 139,307Amounts payable on foreign currency forward
contracts 37,267 – – – – – – –Amounts payable for purchase of investments 3,812,893 911,119 1,238,873 – 3,690,871 34,984 2,525,487 –Amounts due to brokers – – – – – – – –Accruals and other payables 83,372 70,800 43,250 48,314 97,231 111,793 54,675 58,579
Total liabilities (excluding net assets attributable to unitholders) 4,432,460 1,049,160 1,282,123 48,314 3,891,761 181,801 2,580,162 197,886
Net assets attributable to unitholders
Financial liabilities 52,039,280 39,352,380 36,625,443 38,817,433 139,539,398 156,196,349 74,137,103 81,737,652
Equity – – – – – – – –

BEA UNION INVESTMENT SERIES
STATEMENT OF ASSETS AND LIABILITIES AT 30 JUNE 2021 (UNAUDITED) (CONTINUED)
A5請縮小打印70.5%
83
BEA Union Investment Asian Bond and Currency Fund
BEA Union Investment China A-Share Equity Fund
BEA Union Investment Asia Pacific Multi Income Fund
BEA Union Investment China Phoenix Fund
BEA Union Investment RMB Core Bond Fund
30 June 2021 31 December 2020 30 June 2021 31 December 2020 30 June 2021 31 December 2020 30 June 2021 31 December 2020 30 June 2021 31 December 2020Class ANumber of units in issue – – 50,145.84 90,252.60 – – – – – –Net asset value per unit as reported in the financial statements (2) – – 24.04 22.18 – – – – – –Class A AccumulatingNumber of units in issue 4,246,119.10 3,482,472.51 – – 168,712.93 165,799.86 102,589.80 124,147.92 – –Net asset value per unit as reported in the financial statements (2) 24.91 24.85 – – 15.09 14.66 17.78 16.43 – –Class A Accumulating (HK$)Number of units in issue – – – – – – 486,921.44 371,191.95 – –Net asset value per unit as reported in the financial statements (2) – – – – – – 22.87 21.14 – –Class A Accumulating Hedged (EUR)Number of units in issue 3,512,988.76 2,808,804.66 – – 5,000.00 5,000.00 – – – –Net asset value per unit as reported in the financial statements (2) 12.09 12.50 – – 12.56 12.65 – – – –Class A Accumulating Hedged (RMB)Number of units in issue 5,728,769.44 4,949,959.43 – – 4,086.06 3,431.52 88,488.17 41,182.65 – –Net asset value per unit as reported in the financial statements (2) 17.13 16.81 – – 18.88 18.06 29.04 26.47 – –Class A DistributingNumber of units in issue 8,396,327.46 9,595,008.07 – – 5,927,350.28 6,738,741.01 – – 260,365.20 228,199.29Net asset value per unit as reported in the financial statements (2) 12.44 12.81 – – 9.85 9.84 – – 57.91 58.57Class A Distributing (HK$)Number of units in issue – – – – 7,361,240.14 8,040,349.33 – – 1,611,319.57 379,438.56Net asset value per unit as reported in the financial statements (2) – – – – 12.69 12.68 – – 74.62 75.48Class A Distributing (RMB)Number of units in issue – – – – – – – – 593,140.91 791,454.75Net asset value per unit as reported in the financial statements (2) – – – – – – – – 95.79 96.94Class A Distributing Hedged (AU$)Number of units in issue 1,200,358.01 1,130,949.32 – – 4,982,353.00 6,093,295.42 – – – –Net asset value per unit as reported in the financial statements (2) 6.63 7.02 – – 5.85 6.01 – – – –Class A Distributing Hedged (EUR)Number of units in issue – – – – 5,198.92 5,198.92 – – – –Net asset value per unit as reported in the financial statements (2) – – – – 11.20 11.55 – – – –Class A Distributing Hedged (NZ$)Number of units in issue – – – – 1,478,686.11 1,613,700.68 – – – –Net asset value per unit as reported in the financial statements (2) – – – – 5.52 5.69 – – – –Class A Distributing Hedged (RMB)Number of units in issue 8,487,955.26 6,946,417.72 – – 3,869,267.64 4,370,275.33 – – – –Net asset value per unit as reported in the financial statements (2) 14.76 15.12 – – 13.39 13.32 – – – –Class H Distributing (HK$)Number of units in issue 77,457,429.32 74,602,737.85 – – – – – – – –Net asset value per unit as reported in the financial statements (2) 1.28 1.31 – – – – – – – –Class INumber of units in issue – – 1,254,827.88 1,288,686.88 – – – –Net asset value per unit as reported in the financial statements (2) – – 30.00 27.64 – – – – – –Class I AccumulatingNumber of units in issue 4,779,639.36 4,682,492.42 – – – – – – – –Net asset value per unit as reported in the financial statements (2) 11.01 10.96 – – – – – – – –Class I Distributing (HK$)Number of units in issue 16,350,671.90 21,450,028.23 – – – – – – – –Net asset value per unit as reported in the financial statements (2) 11.75 12.05 – – – – – – – –Class PNumber of units in issue – – 80,000.00 80,000.00 – – – – – –Net asset value per unit as reported in the financial statements (2) - - 29.19 26.93 - - - - - -

BEA UNION INVESTMENT SERIES
STATEMENT OF ASSETS AND LIABILITIES AT 30 JUNE 2021 (UNAUDITED) (CONTINUED)
A5請縮小打印70.5%
84
BEA Union Investment Asia Pacific Flexi Allocation Fund
BEA Union Investment Global Flexi Allocation Fund
BEA Union Investment China High Yield Income Fund
BEA Union Investment Asian Strategic Bond Fund
BEA Union Investment Asian Opportunities Fund
(formerly known as BEA Union Investment Asia Pacific Equity Dividend Fund)
30 June 2021 31 December 2020 30 June 2021 31 December 2020 30 June 2021 31 December 2020 30 June 2021 31 December 2020 30 June 2021 31 December 2020Class ANumber of units in issue – – – – – – – – – –Net asset value per unit as reported in the financial statements (2) – – – – – – – – – –Class A AccumulatingNumber of units in issue 98,844.18 38,997.57 – – – – 44,518.15 41,081.57 – –Net asset value per unit as reported in the financial statements (2) 15.24 13.84 – – – – 12.24 12.36 – –Class A Accumulating (HK$)Number of units in issue – – – – – – – – – –Net asset value per unit as reported in the financial statements (2) – – – – – – – – – –Class A Accumulating Hedged (EUR)Number of units in issue – – – – – – – – – –Net asset value per unit as reported in the financial statements (2) – – – – – – – – – –Class A Accumulating Hedged (RMB)Number of units in issue – – – – – – – – – –Net asset value per unit as reported in the financial statements (2) – – – – – – – – – –Class A DistributingNumber of units in issue 807,105.50 844,644.06 682,717.60 759,179.14 1,589,258.40 1,793,047.90 3,008,786.87 5,003,090.09 2,006,103.53 2,006,103.53Net asset value per unit as reported in the financial statements (2) 11.95 11.00 11.73 11.52 9.02 9.56 9.68 10.01 14.75 13.16Class A Distributing (HK$)Number of units in issue 573,811.89 675,853.25 37,707.68 52,972.39 2,218,678.66 2,199,162.85 2,549,775.47 3,018,521.13 – –Net asset value per unit as reported in the financial statements (2) 15.43 14.21 15.06 14.78 11.63 12.33 12.49 12.91 – –Class A Distributing (RMB)Number of units in issue – – – – – – – – – –Net asset value per unit as reported in the financial statements (2) – – – – – – – – – –Class A Distributing Hedged (AU$)Number of units in issue 298,604.95 347,984.36 – – 534,741.08 667,563.62 2,430,334.95 2,826,210.53 – –Net asset value per unit as reported in the financial statements (2) 7.78 7.40 – – 6.26 6.85 6.79 7.25 – –Class A Distributing Hedged (EUR)Number of units in issue – – – – – – – – – –Net asset value per unit as reported in the financial statements (2) – – – – – – – – – –Class A Distributing Hedged (NZ$)Number of units in issue 104,372.24 123,388.62 – – – – – – – –Net asset value per unit as reported in the financial statements (2) 7.43 7.07 – – – – – – – –Class A Distributing Hedged (RMB)Number of units in issue 443,283.91 369,162.26 – – 581,616.14 458,129.79 942,680.90 1,200,553.64 – –Net asset value per unit as reported in the financial statements (2) 18.26 16.74 – – 13.71 14.47 14.75 15.18 – –Class H Distributing (HK$)Number of units in issue – – – – – – – – – –Net asset value per unit as reported in the financial statements (2) – – – – – – – – – –Class INumber of units in issue – – – – – – – – – –Net asset value per unit as reported in the financial statements (2) – – – – – – – – – –Class I AccumulatingNumber of units in issue – – – – – – – – – –Net asset value per unit as reported in the financial statements (2) – – – – – – – – – –Class I Distributing (HK$)Number of units in issue – – – – – – – – – –Net asset value per unit as reported in the financial statements (2) – – – – – – – – – –Class PNumber of units in issue – – – – – – – – – –Net asset value per unit as reported in the financial statements (2) – – – – – – – – – –

BEA UNION INVESTMENT SERIES
STATEMENT OF ASSETS AND LIABILITIES AT 30 JUNE 2021 (UNAUDITED) (CONTINUED)
A5請縮小打印70.5%
85
BEA Union Investment China Gateway Fund
BEA Union Investment Asian Bond Target Maturity Fund 2022
BEA Union Investment Asian Corporate Target Maturity Fund 2023
BEA Union Investment Asian Bond Target Maturity Fund 2023 (1)
30 June 2021 31 December 2020 30 June 2021 31 December 2020 30 June 2021 31 December 2020 30 June 2021 31 December 2020Class ANumber of units in issue – – – – – – – –Net asset value per unit as reported in the financial statements (2) – – – – – – – –Class A AccumulatingNumber of units in issue 64,714.11 45,897.24 – – – – – –Net asset value per unit as reported in the financial statements (2) 13.37 12.74 – – – – – –Class A Accumulating (HK$)Number of units in issue – – – – – – – –Net asset value per unit as reported in the financial statements (2) – – – – – – – –Class A Accumulating Hedged (EUR)Number of units in issue – – – – – – – –Net asset value per unit as reported in the financial statements (2) – – – – – – – –Class A Accumulating Hedged (RMB)Number of units in issue – – – – – – – –Net asset value per unit as reported in the financial statements (2) – – – – – – – –Class A DistributingNumber of units in issue 1,314,004.16 1,073,245.67 818,173.72 823,124.21 4,622,971.32 4,921,065.14 1,692,726.32 1,756,922.88Net asset value per unit as reported in the financial statements (2) 11.55 11.25 10.19 10.39 10.03 10.23 9.70 10.06Class A Distributing (HK$)Number of units in issue 1,326,346.17 1,112,358.09 1,832,555.75 1,891,825.26 5,075,979.09 5,654,411.02 3,780,901.13 4,035,336.06Net asset value per unit as reported in the financial statements (2) 14.75 14.37 12.99 13.24 12.79 13.04 12.52 12.98Class A Distributing (RMB)Number of units in issue – – – – – – – –Net asset value per unit as reported in the financial statements (2) – – – – – – – –Class A Distributing Hedged (AU$)Number of units in issue 666,263.85 429,003.02 – – – – – –Net asset value per unit as reported in the financial statements (2) 8.19 8.26 – – – – – –Class A Distributing Hedged (EUR)Number of units in issue – – – – – – – –Net asset value per unit as reported in the financial statements (2) – – – – – – – –Class A Distributing Hedged (NZ$)Number of units in issue – – – – – – – –Net asset value per unit as reported in the financial statements (2) – – – – – – – –Class A Distributing Hedged (RMB)Number of units in issue 629,487.22 422,859.97 282,305.85 326,321.80 1,806,493.94 2,039,035.38 684,537.37 749,287.29Net asset value per unit as reported in the financial statements (2) 17.42 16.90 15.83 15.94 15.59 15.73 15.15 15.55Class H Distributing (HK$)Number of units in issue – – – – – – – –Net asset value per unit as reported in the financial statements (2) – – – – – – – –Class INumber of units in issue – – – – – – – –Net asset value per unit as reported in the financial statements (2) – – – – – – – –Class I AccumulatingNumber of units in issue – – – – – – – –Net asset value per unit as reported in the financial statements (2) – – – – – – – –Class I Distributing (HK$)Number of units in issue – – – – – – – –Net asset value per unit as reported in the financial statements (2) – – – – – – – –Class PNumber of units in issue – – – – – – – –Net asset value per unit as reported in the financial statements (2) – – – – – – – –
(1) The date of commencement for BEA Union Investment Asian Bond Target Maturity Fund 2023 was 14 September 2020.(2) The net asset value per unit is rounded down to 2 decimal places in accordance with the Explanatory Memorandum.

BEA UNION INVESTMENT SERIES
STATEMENT OF CHANGES IN NET ASSETS ATTRIBUTABLE TO UNITHOLDERS FOR THE PERIOD ENDED 30 JUNE 2021 (UNAUDITED)
86
A5請縮小打印70.5%
BEA Union Investment Asian Bond and Currency Fund
BEA Union Investment China A-Share Equity Fund
BEA Union Investment Asia Pacific Multi Income Fund
BEA Union Investment China Phoenix Fund
BEA Union Investment RMB Core Bond Fund
2021 2020 2021 2020 2021 2020 2021 2020 2021 2020US$ US$ US$ US$ US$ US$ US$ US$ RMB RMB
Balance at 1 January/date of commencement 849,279,450 936,195,961 39,779,460 28,078,003 275,026,181 348,898,386 10,980,159 8,096,210 118,741,749 212,414,236
Transactions with owners recorded directly in equity/transactions with unitholders
Subscription of units during the period 217,123,130 375,324,615 594,754 2,500 16,368,364 51,103,195 8,092,022 2,598,410 111,507,365 22,768,095Redemption of units during the period (222,161,210) (508,769,765) (2,454,867) (630,004) (46,847,928) (65,302,606) (4,587,147) (4,668,778) (36,222,124) (75,005,439)
Total transactions with owners/unitholders (5,038,080) (133,445,150) (1,860,113) (627,504) (30,479,564) (14,199,411) 3,504,875 (2,070,368) 75,285,241 (52,237,344)
(Loss)/profit and total comprehensive income for the period (15,891,699) (120,831,880) 3,276,787 3,000,249 (773,093) (36,925,708) 1,046,277 1,089,471 (1,877,029) (656,424)
Balance at 30 June 828,349,671 681,918,931 41,196,134 30,450,748 243,773,524 297,773,267 15,531,311 7,115,313 192,149,961 159,520,468
BEA Union Investment Asia Pacific Flexi Allocation Fund
BEA Union Investment Global Flexi Allocation Fund
BEA Union Investment China High Yield Income Fund
BEA Union Investment Asian Strategic Bond Fund
BEA Union Investment Asian Opportunities Fund
(formerly known as BEA Union Investment Asia Pacific Equity Dividend Fund)
2021 2020 2021 2020 2021 2020 2021 2020 2021 2020US$ US$ US$ US$ US$ US$ US$ US$ US$ US$
Balance at 1 January/date of commencement 29,072,408 25,950,837 9,530,809 11,735,914 55,476,340 59,442,011 128,317,540 159,326,421 26,412,311 19,738,864
Transactions with owners recorded directly in equity/transactions with unitholders
Subscription of units during the period 12,453,601 321,005 102,928 1,864,263 9,177,817 11,999,968 14,087,478 49,194,340 – –Redemption of units during the period (12,667,465) (2,906,655) (1,212,362) (1,896,440) (10,000,819) (14,608,060) (46,092,579) (72,508,093) – –
Total transactions with owners/unitholders (213,864) (2,585,650) (1,109,434) (32,177) (823,002) (2,608,092) (32,005,101) (23,313,753) – –
(Loss)/profit and total comprehensive income for the period 2,343,431 (1,250,074) 157,380 (649,471) (3,169,068) (3,484,003) (4,330,626) (2,833,209) 3,193,486 (47,977)
Balance at 30 June 31,201,975 22,115,113 8,578,755 11,054,266 51,484,270 53,349,916 91,981,813 133,179,459 29,605,797 19,690,887

BEA UNION INVESTMENT SERIES
STATEMENT OF CHANGES IN NET ASSETS ATTRIBUTABLE TO UNITHOLDERS FOR THE PERIOD ENDED 30 JUNE 2021 (UNAUDITED) (CONTINUED)
87
A5請縮小打印70.5%
BEA Union Investment China Gateway Fund
BEA Union Investment Asian Bond Target Maturity Fund 2022
BEA Union Investment Asian Corporate Target Maturity Fund 2023
BEA Union Investment Asian Bond
Target Maturity Fund 2023 (1)
2021 2020 2021 2020 2021 2020 2021US$ US$ US$ US$ US$ US$ US$
Balance at 1 January/date of commencement 39,352,380 51,655,595 38,817,433 52,397,655 156,196,349 98,288,291 81,737,652
Transactions with owners recorded directly in equity/transactions with unitholders
Subscription of units during the period 33,618,887 9,688,278 – – – 82,291,528 –Redemption of units during the period (22,405,615) (23,842,702) (1,503,309) (4,080,104) (14,055,829) (4,704,944) (4,813,546)
Total transactions with owners/unitholders 11,213,272 (14,154,424) (1,503,309) (4,080,104) (14,055,829) 77,586,584 (4,813,546)
(Loss)/profit and total comprehensive income for the period 1,473,628 4,048,225 (688,681) (560,453) (2,601,122) (3,815) (2,787,003)
Balance at 30 June 52,039,280 41,549,396 36,625,443 47,757,098 139,539,398 175,871,060 74,137,103

BEA UNION INVESTMENT SERIES
STATEMENT OF CHANGES IN NET ASSETS ATTRIBUTABLE TO UNITHOLDERS FOR THE PERIOD ENDED 30 JUNE 2021 (UNAUDITED) (CONTINUED)
88
A5請縮小打印70.5%
BEA Union Investment Asian Bond and Currency Fund
BEA Union Investment China A-Share Equity Fund
BEA Union Investment Asia Pacific Multi Income Fund
BEA Union Investment China Phoenix Fund
BEA Union Investment RMB Core Bond Fund
2021 2020 2021 2020 2021 2020 2021 2020 2021 2020
Class ANumber of units in issue at beginning of the period – – 90,252.60 100,529.23 – – – – – –Units issued during the period – – 27,344.65 170.41 – – – – – –Units redeemed during the period – – (67,451.41) (8,456.83) – – – – – –
Number of units in issue at end of the period – – 50,145.84 92,242.81 – – – – – –
Class A Accumulating (US$)Number of units in issue at beginning of the period 3,482,472.51 5,397,059.34 – – 165,799.86 247,975.61 124,147.92 145,452.20 – –Units issued during the period 2,849,767.74 765,234.73 – – 22,223.49 103,624.34 69,493.20 124,826.12 – –Units redeemed during the period (2,086,121.15) (2,257,495.31) – – (19,310.42) (150,887.08) (91,051.32) (140,933.68) – –
Number of units in issue at end of the period 4,246,119.10 3,904,798.76 – – 168,712.93 200,712.87 102,589.80 129,344.64 – –
Class A Accumulating (HK$)Number of units in issue at beginning of the period – – – – – – 371,191.95 395,359.32 – –Units issued during the period – – – – – – 234,765.00 49,689.51 – –Units redeemed during the period – – – – – – (119,035.51) (156,965.48) – –
Number of units in issue at end of the period – – – – – – 486,921.44 288,083.35 – –
Class A Accumulating Hedged (EUR)Number of units in issue at beginning of the period 2,808,804.66 4,104,636.82 – – 5,000.00 5,000.00 – – – –Units issued during the period 1,789,929.50 3,521,327.71 – – – – – – – –Units redeemed during the period (1,085,745.40) (6,054,330.16) – – – – – – – –
Number of units in issue at end of the period 3,512,988.76 1,571,634.37 – – 5,000.00 5,000.00 – – – –
Class A Accumulating Hedged (RMB)Number of units in issue at beginning of the period 4,949,959.43 14,757,492.04 – – 3,431.52 122,419.06 41,182.65 45,232.75 – –Units issued during the period 1,833,640.14 6,621,222.19 – – 1,111.33 1,636.39 60,315.58 31,329.91 – –Units redeemed during the period (1,054,830.13) (13,452,206.02) – – (456.79) (1,286.08) (13,010.06) (39,316.15) – –
Number of units in issue at end of the period 5,728,769.44 7,926,508.21 – – 4,086.06 122,769.37 88,488.17 37,246.51 – –
Class A Distributing (US$)Number of units in issue at beginning of the period 9,595,008.07 8,829,416.17 – – 6,738,741.01 8,127,409.68 – – 228,199.29 273,352.99Units issued during the period 1,364,788.49 1,968,201.05 – – 204,511.32 548,295.39 – – 81,541.94 35,057.24Units redeemed during the period (2,563,469.10) (2,009,960.24) – – (1,015,902.05) (1,490,528.73) – – (49,376.03) (74,765.32)
Number of units in issue at end of the period 8,396,327.46 8,787,656.98 – – 5,927,350.28 7,185,176.34 – – 260,365.20 233,644.91
Class A Distributing (HK$)Number of units in issue at beginning of the period – – – – 8,040,349.33 10,126,098.28 – – 379,438.56 429,145.51Units issued during the period – – – – 482,988.29 2,317,548.22 – – 1,333,123.73 19,459.80Units redeemed during the period – – – – (1,162,097.48) (2,383,999.02) – – (101,242.72) (73,011.03)
Number of units in issue at end of the period – – – – 7,361,240.14 10,059,647.48 – – 1,611,319.57 375,594.28
Class A Distributing (RMB)Number of units in issue at beginning of the period – – – – – – – – 791,454.75 1,668,924.78Units issued during the period – – – – – – – – 68,704.61 195,833.74Units redeemed during the period – – – – – – – – (267,018.45) (664,807.71)
Number of units in issue at end of the period – – – – – – – – 593,140.91 1,199,950.81
Class A Distributing Hedged (AU$)Number of units in issue at beginning of the period 1,130,949.32 1,307,036.60 – – 6,093,295.42 9,565,708.94 – – – –Units issued during the period 408,094.24 585,064.55 – – 380,490.92 558,862.80 – – – –Units redeemed during the period (338,685.55) (776,346.22) – – (1,491,433.34) (1,761,556.08) – – – –
Number of units in issue at end of the period 1,200,358.01 1,115,754.93 – – 4,982,353.00 8,363,015.66 – – – –

BEA UNION INVESTMENT SERIES
STATEMENT OF CHANGES IN NET ASSETS ATTRIBUTABLE TO UNITHOLDERS FOR THE PERIOD ENDED 30 JUNE 2021 (UNAUDITED) (CONTINUED)
89
A5請縮小打印70.5%
BEA Union Investment Asia Pacific Flexi Allocation Fund
BEA Union Investment Global Flexi Allocation Fund
BEA Union Investment China High Yield Income Fund
BEA Union Investment Asian Strategic Bond Fund
BEA Union Investment Asian Opportunities Fund
(formerly known as BEA Union Investment Asia Pacific Equity Dividend Fund)
2021 2020 2021 2020 2021 2020 2021 2020 2021 2020
Class ANumber of units in issue at beginning of the period – – – – – – – – – –Units issued during the period – – – – – – – – – –Units redeemed during the period – – – – – – – – – –
Number of units in issue at end of the period – – – – – – – – – –
Class A Accumulating (US$)Number of units in issue at beginning of the period 38,997.57 85,603.64 – – – – 41,081.57 30,909.88 – –Units issued during the period 73,569.85 2,266.16 – – – – 3,436.58 2,524.88 – –Units redeemed during the period (13,723.24) (46,562.95) – – – – – – – –
Number of units in issue at end of the period 98,844.18 41,306.85 – – – – 44,518.15 33,434.76 – –
Class A Accumulating (HK$)Number of units in issue at beginning of the period – – – – – – – – – –Units issued during the period – – – – – – – – – –Units redeemed during the period – – – – – – – – – –
Number of units in issue at end of the period – – – – – – – – – –
Class A Accumulating Hedged (EUR)Number of units in issue at beginning of the period – – – – – – – – – –Units issued during the period – – – – – – – – – –Units redeemed during the period – – – – – – – – – –
Number of units in issue at end of the period – – – – – – – – – –
Class A Accumulating Hedged (RMB)Number of units in issue at beginning of the period – – – – – – – – – –Units issued during the period – – – – – – – – – –Units redeemed during the period – – – – – – – – – –
Number of units in issue at end of the period – – – – – – – – – –
Class A Distributing (US$)Number of units in issue at beginning of the period 844,644.06 833,128.42 759,179.14 914,036.57 1,793,047.90 1,712,694.66 5,003,090.09 3,144,445.62 2,006,103.53 2,006,103.53Units issued during the period 386,481.54 11,219.79 6,779.12 115,380.05 338,982.62 585,306.48 302,356.22 2,637,074.14 – –Units redeemed during the period (424,020.10) (37,306.16) (83,240.66) (141,433.05) (542,772.12) (497,714.99) (2,296,659.44) (902,919.74) – –
Number of units in issue at end of the period 807,105.50 807,042.05 682,717.60 887,983.57 1,589,258.40 1,800,286.15 3,008,786.87 4,878,600.02 2,006,103.53 2,006,103.53
Class A Distributing (HK$)Number of units in issue at beginning of the period 675,853.25 880,392.26 52,972.39 99,314.16 2,199,162.85 2,685,653.81 3,018,521.13 5,978,179.08 – –Units issued during the period 177,076.65 70.05 1,596.10 40,192.58 301,919.74 333,472.69 476,124.90 1,437,312.76 – –Units redeemed during the period (279,118.01) (117,738.51) (16,860.81) (30,215.45) (282,403.93) (832,105.74) (944,870.56) (3,457,813.55) – –
Number of units in issue at end of the period 573,811.89 762,723.80 37,707.68 109,291.29 2,218,678.66 2,187,020.76 2,549,775.47 3,957,678.29 – –
Class A Distributing (RMB)Number of units in issue at beginning of the period – – – – – – – – – –Units issued during the period – – – – – – – – – –Units redeemed during the period – – – – – – – – – –
Number of units in issue at end of the period – – – – – – – – – –
Class A Distributing Hedged (AU$)Number of units in issue at beginning of the period 347,984.36 471,619.92 – – 667,563.62 372,481.85 2,826,210.53 3,532,296.58 – –Units issued during the period 33,768.41 1,995.15 – – 123,320.95 373,731.15 517,336.55 817,975.40 – –Units redeemed during the period (83,147.82) (71,579.09) – – (256,143.49) (63,864.23) (913,212.13) (1,365,692.47) – –
Number of units in issue at end of the period 298,604.95 402,035.98 – – 534,741.08 682,348.77 2,430,334.95 2,984,579.51 – –

BEA UNION INVESTMENT SERIES
STATEMENT OF CHANGES IN NET ASSETS ATTRIBUTABLE TO UNITHOLDERS FOR THE PERIOD ENDED 30 JUNE 2021 (UNAUDITED) (CONTINUED)
90
A5請縮小打印70.5%
BEA Union Investment China Gateway Fund
BEA Union Investment Asian Bond Target Maturity Fund 2022
BEA Union Investment Asian Corporate Target Maturity Fund 2023
BEA Union Investment Asian Bond Target Maturity
Fund 2023 (1)
2021 2020 2021 2020 2021 2020 2021
Class ANumber of units in issue at beginning of the period – – – – – – –Units issued during the period – – – – – – –Units redeemed during the period – – – – – – –
Number of units in issue at end of the period – – – – – – –
Class A Accumulating (US$)Number of units in issue at beginning of the period 45,897.24 118,926.74 – – – – –Units issued during the period 20,249.22 408.60 – – – – –Units redeemed during the period (1,432.35) (68,567.65) – – – – –
Number of units in issue at end of the period 64,714.11 50,767.69 – – – – –
Class A Accumulating (HK$)Number of units in issue at beginning of the period – – – – – – –Units issued during the period – – – – – – –Units redeemed during the period – – – – – – –
Number of units in issue at end of the period – – – – – – –
Class A Accumulating Hedged (EUR)Number of units in issue at beginning of the period – – – – – – –Units issued during the period – – – – – – –Units redeemed during the period – – – – – – –
Number of units in issue at end of the period – – – – – – –
Class A Accumulating Hedged (RMB)Number of units in issue at beginning of the period – – – – – – –Units issued during the period – – – – – – –Units redeemed during the period – – – – – – –
Number of units in issue at end of the period – – – – – – –
Class A Distributing (US$)Number of units in issue at beginning of the period 1,073,245.67 2,132,569.09 823,124.21 1,084,963.73 4,921,065.14 2,237,759.28 1,756,922.88Units issued during the period 927,901.67 252,718.02 – – 55,000.00 3,320,116.50 –Units redeemed during the period (687,143.18) (1,324,142.61) (4,950.49) (135,330.85) (353,093.82) (70,037.81) (64,196.56)
Number of units in issue at end of the period 1,314,004.16 1,061,144.50 818,173.72 949,632.88 4,622,971.32 5,487,837.97 1,692,726.32
Class A Distributing (HK$)Number of units in issue at beginning of the period 1,112,358.09 1,465,106.45 1,891,825.26 2,611,057.43 5,654,411.02 4,319,473.63 4,035,336.06Units issued during the period 682,633.67 93,792.28 – – – 3,021,667.45 –Units redeemed during the period (468,645.59) (353,368.94) (59,269.51) (201,178.38) (578,431.93) (291,678.98) (254,434.93)
Number of units in issue at end of the period 1,326,346.17 1,205,529.79 1,832,555.75 2,409,879.05 5,075,979.09 7,049,462.10 3,780,901.13
Class A Distributing (RMB)Number of units in issue at beginning of the period – – – – – – –Units issued during the period – – – – – – –Units redeemed during the period – – – – – – –
Number of units in issue at end of the period – – – – – – –
Class A Distributing Hedged (AU$)Number of units in issue at beginning of the period 429,003.02 901,232.48 – – – – –Units issued during the period 605,918.31 226,127.93 – – – – –Units redeemed during the period (368,657.48) (543,427.90) – – – – –
Number of units in issue at end of the period 666,263.85 583,932.51 – – – - -

BEA UNION INVESTMENT SERIES
STATEMENT OF CHANGES IN NET ASSETS ATTRIBUTABLE TO UNITHOLDERS FOR THE PERIOD ENDED 30 JUNE 2021 (UNAUDITED) (CONTINUED)
91
A5請縮小打印70.5%
BEA Union Investment Asian Bond and Currency Fund
BEA Union Investment China A-Share Equity Fund
BEA Union Investment Asia Pacific Multi Income Fund
BEA Union Investment China Phoenix Fund
BEA Union Investment RMB Core Bond Fund
2021 2020 2021 2020 2021 2020 2021 2020 2021 2020
Class A Distributing Hedged (EUR)Number of units in issue at beginning of the period – – – – 5,198.92 12,418.39 – – – –Units issued during the period – – – – – – – – – –Units redeemed during the period – – – – – (7,219.47) – – – –
Number of units in issue at end of the period – – – – 5,198.92 5,198.92 – – – –
Class A Distributing Hedged (NZ$)Number of units in issue at beginning of the period – – – – 1,613,700.68 2,207,344.32 – – – –Units issued during the period – – – – 117,318.00 105,622.65 – – – –Units redeemed during the period – – – – (252,332.57) (360,458.88) – – – –
Number of units in issue at end of the period – – – – 1,478,686.11 1,952,508.09 – – – –
Class A Distributing Hedged (RMB)Number of units in issue at beginning of the period 6,946,417.72 7,506,051.11 – – 4,370,275.33 4,629,872.66 – – – –Units issued during the period 2,864,386.52 1,410,757.08 – – 369,232.46 1,181,868.45 – – – –Units redeemed during the period (1,322,848.98) (2,200,029.57) – – (870,240.15) (791,932.12) – – – –
Number of units in issue at end of the period 8,487,955.26 6,716,778.62 – – 3,869,267.64 5,019,808.99 – – – –
Class H Distributing (HK$)Number of units in issue at beginning of the period 74,602,737.85 85,813,348.84 – – – – – – – –Units issued during the period 15,315,457.27 12,969,611.36 – – – – – – – –Units redeemed during the period (12,460,765.80) (23,757,784.21) – – – – – – – –
Number of units in issue at end of the period 77,457,429.32 75,025,175.99 – – – – – – – –
Class INumber of units in issue at beginning of the period – – 1,288,686.88 1,399,495.12 – – – – – –Units issued during the period – – – – – – – – – –Units redeemed during the period – – (33,859.00) (15,286.30) – – – – – –
Number of units in issue at end of the period – – 1,254,827.88 1,384,208.82 – – – – – –
Class I AccumulatingNumber of units in issue at beginning of the period 4,682,492.42 7,563,520.08 – – – – – – – –Units issued during the period 889,099.85 6,100,360.46 – – – – – – – –Units redeemed during the period (791,952.91) (11,111,308.06) – – – – – – – –
Number of units in issue at end of the period 4,779,639.36 2,552,572.48 – – – – – – – –
Class I Distributing (HK$)Number of units in issue at beginning of the period 21,450,028.23 5,868,816.66 – – – – – – – –Units issued during the period – 7,548,707.43 – – – – – – – –Units redeemed during the period (5,099,356.33) (1,596,328.44) – – – – – – – –
Number of units in issue at end of the period 16,350,671.90 11,821,195.65 – – – – – – – –
Class PNumber of units in issue at beginning of the period – – 80,000.00 92,330.54 – – – – – –Units issued during the period – – – – – – – – – –Units redeemed during the period – – – (12,330.54) – – – – – –
Number of units in issue at end of the period – – 80,000.00 80,000.00 – – – – – –

BEA UNION INVESTMENT SERIES
STATEMENT OF CHANGES IN NET ASSETS ATTRIBUTABLE TO UNITHOLDERS FOR THE PERIOD ENDED 30 JUNE 2021 (UNAUDITED) (CONTINUED)
92
A5請縮小打印70.5%
BEA Union Investment Asia Pacific Flexi Allocation Fund
BEA Union Investment Global Flexi Allocation Fund
BEA Union Investment China High Yield Income Fund
BEA Union Investment Asian Strategic Bond Fund
BEA Union Investment Asian Opportunities Fund
(formerly known as BEA Union Investment Asia Pacific Equity Dividend Fund)
2021 2020 2021 2020 2021 2020 2021 2020 2021 2020
Class A Distributing Hedged (EUR)Number of units in issue at beginning of the period – – – – – – – – – –Units issued during the period – – – – – – – – – –Units redeemed during the period – – – – – – – – – –
Number of units in issue at end of the period – – – – – – – – – –
Class A Distributing Hedged (NZ$)Number of units in issue at beginning of the period 123,388.62 118,886.13 – – – – – – – –Units issued during the period 73,550.88 4,039.60 – – – – – – – –Units redeemed during the period (92,567.26) – – – – – – – – –
Number of units in issue at end of the period 104,372.24 122,925.73 – – – – – – – –
Class A Distributing Hedged (RMB)Number of units in issue at beginning of the period 369,162.26 276,169.10 – – 458,129.79 458,651.25 1,200,553.64 1,908,476.24 – –Units issued during the period 195,231.65 13,644.13 – – 160,581.83 30,008.70 87,899.61 65,060.54 – –Units redeemed during the period (121,110.00) (35,103.58) – – (37,095.48) (28,828.05) (345,772.35) (793,191.84) – –
Number of units in issue at end of the period 443,283.91 254,709.65 – – 581,616.14 459,831.90 942,680.90 1,180,344.94 – –
Class H Distributing (HK$)Number of units in issue at beginning of the period – – – – – – – – – –Units issued during the period – – – – – – – – – –Units redeemed during the period – – – – – – – – – –
Number of units in issue at end of the period – – – – – – – – – –
Class INumber of units in issue at beginning of the period – – – – – – – – – –Units issued during the period – – – – – – – – – –Units redeemed during the period – – – – – – – – – –
Number of units in issue at end of the period – – – – – – – – – –
Class I AccumulatingNumber of units in issue at beginning of the period – – – – – – – – – –Units issued during the period – – – – – – – – – –Units redeemed during the period – – – – – – – – – –
Number of units in issue at end of the period – – – – – – – – – –
Class I Distributing (HK$)Number of units in issue at beginning of the period – – – – – – – – – –Units issued during the period – – – – – – – – – –Units redeemed during the period – – – – – – – – – –
Number of units in issue at end of the period – – – – – – – – – –
Class PNumber of units in issue at beginning of the period – – – – – – – – – –Units issued during the period – – – – – – – – – –Units redeemed during the period – – – – – – – – – –
Number of units in issue at end of the period – – – – – – – – – –

BEA UNION INVESTMENT SERIES
STATEMENT OF CHANGES IN NET ASSETS ATTRIBUTABLE TO UNITHOLDERS FOR THE PERIOD ENDED 30 JUNE 2021 (UNAUDITED) (CONTINUED)
93
A5請縮小打印70.5%
BEA Union Investment China Gateway Fund
BEA Union Investment Asian Bond Target Maturity Fund 2022
BEA Union Investment Asian Corporate Target Maturity Fund 2023
BEA Union Investment Asian Bond Target Maturity
Fund 2023 (1)
2021 2020 2021 2020 2021 2020 2021
Class A Distributing Hedged (EUR)Number of units in issue at beginning of the period – – – – – – –Units issued during the period – – – – – – –Units redeemed during the period – – – – – – –
Number of units in issue at end of the period – – – – – – –
Class A Distributing Hedged (NZ$)Number of units in issue at beginning of the period – – – – – – –Units issued during the period – – – – – – –Units redeemed during the period – – – – – – –
Number of units in issue at end of the period – – – – – – –
Class A Distributing Hedged (RMB)Number of units in issue at beginning of the period 422,859.97 835,008.44 326,321.80 459,570.70 2,039,035.38 1,364,004.08 749,287.29Units issued during the period 448,548.03 416,598.93 – – – 868,491.42 –Units redeemed during the period (241,920.78) (329,353.71) (44,015.95) (11,693.06) (232,541.44) (24,080.87) (64,749.92)
Number of units in issue at end of the period 629,487.22 922,253.66 282,305.85 447,877.64 1,806,493.94 2,208,414.63 684,537.37
Class H Distributing (HK$)Number of units in issue at beginning of the period – – – – – – –Units issued during the period – – – – – – –Units redeemed during the period – – – – – – –
Number of units in issue at end of the period – – – – – – –
Class INumber of units in issue at beginning of the period – – – – – – –Units issued during the period – – – – – – –Units redeemed during the period – – – – – – –
Number of units in issue at end of the period – – – – – – –
Class I AccumulatingNumber of units in issue at beginning of the period – – – – – – –Units issued during the period – – – – – – –Units redeemed during the period – – – – – – –
Number of units in issue at end of the period – – – – – – –
Class I Distributing (HK$)Number of units in issue at beginning of the period – – – – – – –Units issued during the period – – – – – – –Units redeemed during the period – – – – – – –
Number of units in issue at end of the period – – – – – – –
Class PNumber of units in issue at beginning of the period – – – – – – –Units issued during the period – – – – – – –Units redeemed during the period – – – – – – –
Number of units in issue at end of the period – – – – – – –
(1) The date of commencement for BEA Union Investment Asian Bond Target Maturity Fund 2023 was 14 September 2020.

MANAGEMENT AND ADMINISTRATION
Trustee and Registrar
Bank of East Asia (Trustees) Limited32nd Floor, BEA Tower
Millennium City 5418 Kwun Tong RoadKwun Tong, Kowloon,
Hong Kong
Manager
BEA Union Investment Management Limited5th Floor, The Bank of East Asia Building
10 Des Voeux Road CentralHong Kong
Auditor
KPMG8th Floor, Prince’s Building
10 Chater RoadCentral, Hong Kong
Legal Adviser
Deacons5th Floor, Alexandra House
18 Chater RoadCentral, Hong Kong