be clear on cancer: regional and national lung cancer
TRANSCRIPT
National Cancer Registration and Analysis Service
Be Clear on Cancer: Regional and national lung cancer awareness campaigns 2011 to 2014
Final evaluation results

Be Clear on Cancer: Regional and national lung cancer awareness campaigns 2011 to 2014
2
About Public Health England
Public Health England exists to protect and improve the nation’s health and
wellbeing, and reduce health inequalities. We do this through world-leading science,
knowledge and intelligence, advocacy, partnerships and the delivery of specialist
public health services. We are an executive agency of the Department of Health and
Social Care, and a distinct delivery organisation with operational autonomy. We
provide government, local government, the NHS, Parliament, industry and the public
with evidence-based professional, scientific and delivery expertise and support.
Public Health England
Wellington House
133-155 Waterloo Road
London SE1 8UG
Tel: 020 7654 8000
www.gov.uk/phe
Twitter: @PHE_uk
Facebook: www.facebook.com/PublicHealthEngland
Prepared by: Professor Michael Peake
For queries relating to this document, please contact: Be Clear on Cancer Evaluation
team at [email protected]
© Crown copyright 2018
You may re-use this information (excluding logos) free of charge in any format or
medium, under the terms of the Open Government Licence v3.0. To view this licence,
visit OGL. Where we have identified any third party copyright information you will
need to obtain permission from the copyright holders concerned.
Published February 2018
PHE publications PHE supports the UN
gateway number: 2017795 Sustainable Development Goals

Be Clear on Cancer: Regional and national lung cancer awareness campaigns 2011 to 2014
3
Public Health England (PHE)
National Cancer Registration and Analysis Service (NCRAS)
Be Clear on Cancer: Regional and national lung cancer awareness campaigns
2011 to 2014
Author:
Professor Michael Peake, Clinical Lead for Early Diagnosis, NCRAS, PHE; Honorary
Consultant and Professor of Respiratory Medicine, University Hospitals of Leicester;
Director of Centre for Cancer Outcomes, University College London Hospitals Cancer
Collaborative
Contributors:
Marketing team, PHE: Helen Duggan, Karen Eldridge, Emma Logan, Ellen
O’Donoghue, Christine Roberts
NCRAS analysts: Matthew Barclay, John Broggio, Rebecca Brown, Eleanor
Fitzgerald, Anna Fry, Carolynn Gildea, Rebecca Girdler, Ruth Jack, Jennifer Lai,
Margreet Luchtenborg, Vivian Mak, Roy Maxwell, Sean McPhail, Isobel Tudge, Ann
Watters, Kwok Wong
Cancer Intelligence team, Cancer Research UK: Isabella Carneiro, Lucy Ironmonger,
Ella Ohuma, Nick Ormiston-Smith, Catherine S Thomson
National Lung Cancer Audit (NLCA) team: Michael Peake, Roz Stanley
NCRAS Be Clear on Cancer evaluation team: Colin Campbell, Lucy Elliss-Brookes,
Katie Haddock, Gurnam Johal, Shona Lucitt, Alexandra Thackeray
Be Clear on Cancer Steering Group members
Mayden and Co
Kantar Public (formerly known as TNS-BMRB)

Be Clear on Cancer: Regional and national lung cancer awareness campaigns 2011 to 2014
4
Contents Figures 8
Tables 13
1. Foreword 17
2. Executive headlines 20
2.1 The problem 20
2.2 Aim of the Be Clear on Cancer campaigns 20
2.3 History of campaigns 20
2.4 Campaign recognition and public awareness 21
2.5 Attendance at GP practices 21
2.6 Urgent GP referrals for suspected lung cancer 21
2.7 Lung cancer diagnosis information from the Cancer Waiting Times (CWT) data 21
2.8 Numbers of new lung cancers 22
2.9 Emergency presentation rates 22
2.10 Stage at diagnosis 22
2.11 Performance status 22
2.12 Treatment rates 22
2.13 Diagnostic imaging 22
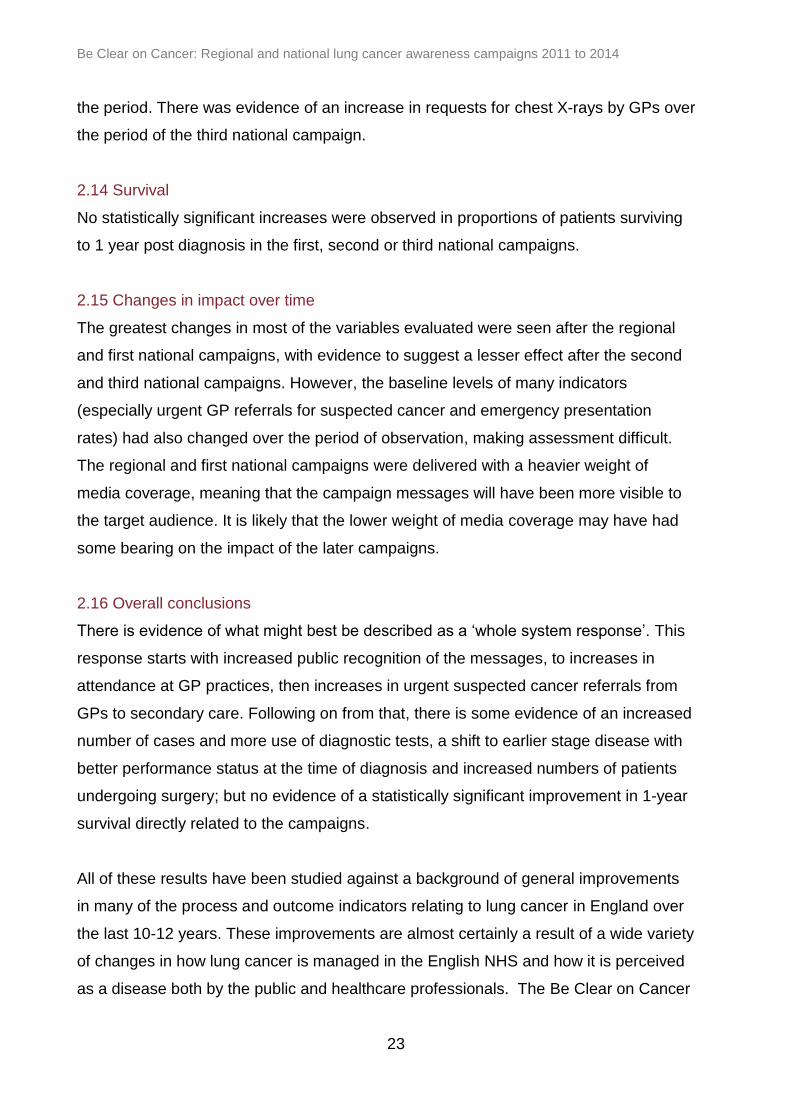
2.14 Survival 23
2.15 Changes in impact over time 23
2.16 Overall conclusions 23
3. Summary report 25
3.1 Background: scale and nature of lung cancer as a public health issue 25
3.2 History and aims of lung cancer awareness campaigns 28
3.3 Creative development of campaign materials 28
3.3.1 The choice of persistent cough as the target symptom and local pilot projects 29
3.3.2 Local to regional 30
3.3.3 Regional to national 31
3.3.4 Campaign weights 33
3.4 Evaluation metrics 33
3.5 Public awareness and campaign recognition 34

Be Clear on Cancer: Regional and national lung cancer awareness campaigns 2011 to 2014
5
3.5.1 Demographics 34
3.5.2 Campaign recognition, first national campaign 34
3.5.3 Campaign recognition, second national campaign 35
3.5.4 Campaign communication, second national campaign 35
3.5.5 Knowledge of symptoms, second national campaign 35
3.5.6 Attitudinal questions, second national campaign 36
3.5.7 Campaign impact, second national campaign 36
3.5.8 Summary of marketing and campaign recognition 37
3.6 Attendances at GP practices 37
3.7 Analysis of CWT Data 38
3.7.1 Urgent GP referrals for suspected lung cancer 38
3.7.2 Cancer diagnoses resulting from an urgent GP referral for suspected lung cancer 39
3.7.3 Conversion rate 40
3.7.4 Lung cancer diagnoses recorded in the CWT dataset 41
3.7.5 Detection rate 41
3.8 Emergency presentation rate 42
3.9. Number of cases of lung cancer diagnosed 42
3.9.1 Number of new lung cancers, regional and first national campaign 42
3.9.2 Number of new lung cancers, second and third national campaigns 44
3.9.3 Demographics of new cases 46
3.10 Impact on stage at diagnosis 46
3.11 Impact on performance status at diagnosis 49
3.12 Diagnostic imaging 49
3.13 Impact on treatment 50
3.14 Impact on survival 51
3.15 Cost-effectiveness 52
3.16 Relationship of campaign impact with age and socio-economic status 52
3.17 Limitations of data and analysis 53
3.18 Summary, discussion and conclusions 54
3.18.1 Overall summary 54
3.18.2 Changing impact over time 54

Be Clear on Cancer: Regional and national lung cancer awareness campaigns 2011 to 2014
6
3.18.3 Wider impact 55
3.18.4 Survival as an endpoint 57
3.18.5 Findings elsewhere in the UK – the example of Scotland 60
4. References 61
5. Appendices 1 – additional details of methods and results 65
5.1 Marketing evaluation – methods 65
5.2 Public awareness – demographics of respondents 66
5.3 Detailed results of public awareness 67
5.4 Attendances at GP practices - regional and first national campaigns 69
5.5 Urgent GP referrals for suspected lung cancer – CWT data 72
5.5.1 The CWT dataset 72
5.5.2 Defining the campaign and comparison periods 73
5.5.3 Comparator referral types 75
5.5.4 Statistical results and methods 75
5.5.5 Urgent GP referrals for suspected cancer 76
5.5.6 Lung cancer diagnoses resulting from an urgent GP referral for suspected cancer 81
5.5.7 Conversion rate 85
5.5.8 Cancer diagnoses recorded in the CWT dataset 89
5.5.9 Detection rate 93
5.6 Emergency presentation 97
5.6.1 Regional and first national campaigns 97
5.6.2 Second and third national campaigns 99
5.6.3 Summary of impact on emergency presentation 100
5.7 Demographics of new cases diagnosed post campaign 101
5.8 Stage at diagnosis 101
5.8.1 Stage - regional campaign 102
5.8.2 Stage of SCLC – regional campaign 102
5.8.3 Stage of NSCLC – regional campaign 103
5.8.4 Stage - first national campaign 103
5.8.5 Stage, second national campaign 106
5.8.6 Stage, third national campaign 108

Be Clear on Cancer: Regional and national lung cancer awareness campaigns 2011 to 2014
7
5.8.7 Stage, summary 111
5.9. Performance status 112
5.9.1 Performance status in the regional campaign 112
5.9.2 Performance status in the first national campaign 112
5.9.3 Summary of performance status findings 113
5.10 Diagnostic imaging 113
5.10.1 Methods 113
5.10.2 Methods used in first national campaign 113
5.10.3 Methods used in the second and third national campaigns 114
5.10.4 Results of the first national campaign on the level of diagnostic imaging tests 114
5.10.5 Results of the second and third national campaigns on the level of diagnostic
imaging tests 116
5.10.6 Changes in the number of tests requested by consultants 116
5.10.7 Changes in the number of tests requested by GPs 118
5.10.8 Summary of diagnostic imaging findings 120
5.11 Treatment 121
5.11.1 Regional and first national campaigns 121
5.11.2 Second and third national campaigns 125
5.11.3 Summary of impact on treatment 125
5.12 Survival 126
5.12.1 Regional campaign 126
5.12.2 One year survival, first national campaign 126
5.12.3 One year survival, second national campaign 127
5.12.4 One year survival, third national campaign 127
5.12.5 Summary of impact on survival 127
6. Appendices 2 – supplementary information 128
6.1 DID (NICIP) Imaging code list used in the analysis of the impact on diagnostic
imaging for the first national campaign 129
6.2 DID (NICIP) Imaging code list used in the analysis of the impact on diagnostic
imaging for the second and third national campaigns 130
6.3 OPCS4 procedure code list (extracted from HES) 130

Be Clear on Cancer: Regional and national lung cancer awareness campaigns 2011 to 2014
8
Figures
Figure 1. An example of one of the advertisements from a local pilot .......................... 30
Figure 2. Examples of the posters for the Regional Campaign .................................... 31
Figure 3. First national campaign: number of GP presentations for a cough per week
adjusted for bank holidays, patients aged 50+, data from 486 practices January 2010 to
May 2013. (Figure S1 from Ironmonger et al, 2015) ..................................................... 37
Figure 4. Number of urgent GP referrals for suspected lung cancer between January
2011 and March 2015 (not adjusted for working days) ................................................. 38
Figure 5.First National Campaign: urgent GP referrals, England January 2010 to
November 2012 (monthly average number of urgent GP referrals for suspected lung
cancer per working day) ............................................................................................... 39
Figure 6. Monthly average number of lung cancers diagnosed per working day,
England Jan 2010 to Dec 2012 (by month first seen for lung cancer) (Figure S3 from
Ironmonger et al, 2015) ................................................................................................ 44
Figure 7. Second national campaign: the number of lung cancer cases (C33-34) by
week, comparing 2011 with 2013 and the median for England for 2013 ...................... 45
Figure 8. Third national campaign: the number of lung cancer cases (C33-34) by week,
comparing 2013 and 2014 ............................................................................................ 46
Figure 9. First national campaign: percentage changes in stage distribution of cases of
NSCLC diagnosed pre and post campaign .................................................................. 47
Figure 10. Proportion of lung cancers diagnosed at stage 1 and 2 in England by week
following the second national campaign (2013), against the weekly median for 2013 . 48
Figure 11. Distribution (%) of early and late stage lung cancer in England 2012 to 2015
(source: NLCA) ............................................................................................................. 49

Be Clear on Cancer: Regional and national lung cancer awareness campaigns 2011 to 2014
9
Figure 12. Responses over time to telephone survey questions relating to broader
issues of attitudes to cancer (TRNS BRMB) ................................................................. 56
Figure 13. Crude surgical resection rates in England and Wales between 2005 and
2015. Overall = patients with lung cancer of any description; NSCLC = patients with a
confirmed diagnosis of Non-Small Cell Carcinoma (source; NLCA) ............................. 58
Figure 14. 1 and 2 year survival (%) 2011 to 2012 derived from the Cancer Analysis
System ......................................................................................................................... 59
Figure 15. Net actual and predicted) 1 and 5 year survival rates for lung cancer in
England 1995 to 2013 (adapted from Walters et al., 2015) .......................................... 59
Figure 16. Stage distribution (%) pre and post the Scottish ‘Detect Cancer Early’ lung
campaigns (Black et al. 2016). ..................................................................................... 60
Figure 17. First national campaign: number of GP presentations for a cough per week
adjusted for bank holidays, patients aged 50+, data from 486 practices January 2010 to
May 2013. (Figure S1 from Ironmonger et al 2015) ...................................................... 72
Figure 18. Number of urgent GP referrals for suspected lung cancer, January 2011 to
May 2014, England....................................................................................................... 78
Figure 19. Number of urgent GP referrals for other suspected cancers (all suspected
cancers excluding lung and lower GI cancers) and for suspected head and neck
cancers, January 2011 to May 2014, England ............................................................. 78
Figure 20. Number of urgent GP referrals for suspected lung cancer, January 2011 to
May 2014, by age ......................................................................................................... 79
Figure 21. Number of urgent GP referrals for suspected lung cancer, January 2011 to
May 2014, by sex ......................................................................................................... 81
Figure 22. Number of lung cancer diagnoses resulting from an urgent GP referral for
suspected lung cancer, January 2011 to May 2014, England ...................................... 82

Be Clear on Cancer: Regional and national lung cancer awareness campaigns 2011 to 2014
10
Figure 23. Number of lung cancer diagnoses resulting from an urgent GP referral for
suspected lung cancer, January 2011 to May 2014, by age ......................................... 83
Figure 24. Number of lung cancer diagnoses resulting from an urgent GP referral for
suspected lung cancer, January 2011 to May 2014, by sex ......................................... 85
Figure 25. Conversion rates for urgent GP referrals for suspected lung cancer, January
2011 to May 2014, England .......................................................................................... 86
Figure 26. Conversion rates for urgent GP referrals for suspected lung cancer, January
2011 to May 2014, by age ............................................................................................ 87
Figure 27. Conversion rates for urgent GP referrals for suspected lung cancer, January
2011 to May 2014, by sex ........................................................................................... 89
Figure 28. Number of lung cancer diagnoses recorded in the CWT dataset, January
2011 to June 2014, England ......................................................................................... 90
Figure 29. Number of lung cancer diagnoses recorded in the CWT dataset, January
2011 to June 2014, by age ........................................................................................... 91
Figure 30. Number of lung cancer diagnoses recorded in the CWT dataset, January
2011 to June 2014, by sex ........................................................................................... 93
Figure 31. Detection rates for lung cancer diagnoses, January 2011 to June 2014,
England ........................................................................................................................ 94
Figure 32. Detection rates for lung cancer diagnoses, January 2011 to June 2014, by
age ............................................................................................................................... 95
Figure 33. Detection rates for lung cancer diagnoses, January 2011 to June 2014, by
sex ................................................................................................................................ 96
Figure 34. Proportion of emergency presentations for lung cancer, second national
campaign - England, 2011 versus 2013 ....................................................................... 99

Be Clear on Cancer: Regional and national lung cancer awareness campaigns 2011 to 2014
11
Figure 35. Proportion of emergency presentations for lung cancer, third national
campaign - England, 2013 versus 2014 ..................................................................... 100
Figure 36. Proportion of staged cases diagnosed as stage 3 by week, 2013, England
................................................................................................................................... 107
Figure 37. Proportion of total cases diagnosed as stage unknown by week, 2013,
England ...................................................................................................................... 108
Figure 38. Percentage of staged cases diagnosed with stage 1 or 2 by week, 2013 and
2014, lung C33-C34 cases England, all ages ............................................................. 109
Figure 39. Percentage of staged cases diagnosed with stage 3 by week, 2013 and
2014, lung C33-C34 cases England, all ages ............................................................. 110
Figure 40. Percentage of staged cases diagnosed with stage unknown by week, 2013
and 2014, lung C33-C34 cases England, all ages ...................................................... 111
Figure 41. Number of plain chest X-rays requested by consultants each month, July
2012 to December 2014 ............................................................................................. 116
Figure 42. Number of CT scans requested by consultants each month, July 2012 to
December 2014 .......................................................................................................... 117
Figure 43. Number of CT scans, with and without contrast enhancement requested by
consultants each month, July 2012 to December 2014 .............................................. 118
Figure 44. Number of plain chest X-rays per working day requested by GPs each
month, July 2012 to December 2014 .......................................................................... 119
Figure 45. Total (unadjusted for working days) number of CT scans, with and without
contrast enhancement requested by GPs per month, July 2012 to December 2014. . 120
Figure 46. Monthly proportion of patients diagnosed with lung cancer receiving
resection as a first definitive treatment, England Jan 2010 to Dec 2012 (by month first
seen for lung cancer) .................................................................................................. 124

Be Clear on Cancer: Regional and national lung cancer awareness campaigns 2011 to 2014
12
Figure 47. Number of surgical resections for lung cancer by month 2009 to 2013 ..... 124
Figure 48. Number of potentially curative surgical operations in lung cancer patient
recorded in HES by month 2012 to 2014 in relation to campaign periods .................. 125

Be Clear on Cancer: Regional and national lung cancer awareness campaigns 2011 to 2014
13
Tables
Table 1. Dates, duration, TVRs, reach and frequency, and media costs for the regional
and national campaigns. .............................................................................................. 33
Table 2. Regional campaign: number of lung cancers diagnosed comparing the
campaign months of October to December 2011 with October to December 2010 for
the pilot and control areas (Table S7 from Ironmonger et al, 2015) ............................. 43
Table 3. First national campaign: number of lung cancers diagnosed for the campaign
and control periods (Table 5 from Ironmonger et al, 2015) ........................................... 43
Table 4. Survey respondent demographics pre- and post-regional campaign for pilot
and control areas .......................................................................................................... 66
Table 5. First national campaign: public awareness pre- and post-campaign survey
results (Table 1, Ironmonger et al, 2015) ...................................................................... 68
Table 6. First national campaign: presentations per GP practice per week for patients
aged 50+, data from 486 practices. (Table 2 from Ironmonger et al, 2015) .................. 70
Table 7. First national campaign: number of GP presentations for cough (unadjusted)
for the eight weeks of the campaign by age group, data from 486 practices (Table S4
from Ironmonger et al, 2015) ........................................................................................ 71
Table 8. For three national lung cancer campaigns, the number of urgent GP referrals
for suspected lung cancer and for comparator referrals, with referral rate and
percentage change in number of referrals, England ..................................................... 77
Table 9. For three national lung cancer awareness campaigns, number of urgent GP
referrals for suspected lung cancer, with referral rate and percentage change in number
of referrals, by age........................................................................................................ 80

Be Clear on Cancer: Regional and national lung cancer awareness campaigns 2011 to 2014
14
Table 10. For three national lung cancer awareness campaigns, number of urgent GP
referrals for suspected lung cancer, with referral rate and percentage change in number
of referrals, by sex ........................................................................................................ 81
Table 11. For three national lung cancer awareness campaigns, number of lung cancer
diagnoses resulting from an urgent GP referral for suspected lung cancer, with
percentage change in number of cancers, England ..................................................... 83
Table 12. For three national lung cancer awareness campaigns, number of lung cancer
diagnoses resulting from an urgent GP referral for suspected lung cancer, with
percentage change in number of cancers, by age ........................................................ 84
Table 13. For three national lung cancer awareness campaigns, number of lung cancer
diagnoses resulting from an urgent GP referral for suspected lung cancer, with
percentage change in number of cancers, by sex ........................................................ 85
Table 14. For three national lung cancer awareness campaigns, conversion rates for
urgent GP referrals for suspected lung cancer, with change, England ......................... 86
Table 15. For three national lung cancer awareness campaigns, conversion rates for
urgent GP referrals for suspected lung cancer, with change, by age ........................... 88
Table 16. For three national lung cancer awareness campaigns, conversion rates for
urgent GP referrals for suspected lung cancer, with change, by sex ............................ 89
Table 17. For three national lung cancer awareness campaigns, number of lung cancer
diagnoses recorded in the CWT dataset, with percentage change in number of cancers,
England ........................................................................................................................ 90
Table 18. For three national lung cancer campaigns, number of lung cancer diagnoses
recorded in the CWT database, with percentage change in number of cancers, by age
..................................................................................................................................... 92

Be Clear on Cancer: Regional and national lung cancer awareness campaigns 2011 to 2014
15
Table 19. For three national lung cancer campaigns, number of lung cancer diagnoses
recorded in the CWT dataset, with percentage change in number of cancers, by sex . 93
Table 20. For three national lung cancer campaigns, detection rates for lung cancer
diagnoses, with change, England ................................................................................. 94
Table 21. For three national lung cancer campaigns, detection rates for lung cancer
diagnoses, with change, by age ................................................................................... 96
Table 22. For three national lung cancer campaigns, detection rates for lung cancer
diagnoses, with change, by sex .................................................................................... 97
Table 23 . First national campaign: source of referral of lung cancer for the campaign
and control periods (derived from NLCA data) (Table S11 from Ironmonger et al, 2015)
..................................................................................................................................... 98
Table 24. Lung cancers diagnosed during the first national campaign by age and sex
................................................................................................................................... 101
Table 25. Distribution of stage in SCLC patients between pilot and control trusts post
the regional campaign 2012 compared with the same period 2011 ........................... 102
Table 26. Distribution of stage in NSCLC patients between pilot and control trusts post
the regional campaign in 2011 compared with the same period 2010 ........................ 103
Table 27. First national campaign: number and proportion of NSCLC and SCLC
diagnosed at each stage for the campaign and control periods (Table 6, Ironmonger et
al, 2015) ..................................................................................................................... 104
Table 28. proportion of patients with early stage disease and total proportion with stage
recorded at all for lung cancer in various periods in 2012 .......................................... 106
Table 29. National campaign: performance status of lung cancer patients first seen
during the campaign months and control months in 2011 and 2012 (Table 8,
Ironmonger et al, 2015) .............................................................................................. 113

Be Clear on Cancer: Regional and national lung cancer awareness campaigns 2011 to 2014
16
Table 30. First national campaign: number of chest X-rays and chest and/or abdomen
CT scans, May/June/July compared with April, 2012 and 2013 (table 8, Ironmonger et
al, 2015) ..................................................................................................................... 115
Table 31. Number of requests for chest X-rays and CT scans from consultants, for
campaign periods and the remainder of the respective years .................................... 117
Table 32. Average number of requests for chest X-rays from GPs for the periods of the
second and third national campaigns (+ 1 month) compared with the remainder of the
respective years ......................................................................................................... 119
Table 33. Regional campaign: first definitive treatment received for the campaign
months of October to December 2011 and October to December 2010 for the pilot and
control areas (Table S9, Ironmonger et al, 2015) ....................................................... 122
Table 34. National campaign: first definitive treatment received for lung cancer for the
campaign and control period (Table 7, Ironmonger et al, 2015) ................................. 123
Table 35. One year age-standardised survival rates by pilot vs ‘control’ trust for patients
diagnosed during post the regional campaign (2011) compared with the previous year
(2010) ......................................................................................................................... 126
Table 36. Difference in age-standardised 1-year net survival rates in patients diagnosed
during and in the month after the first national campaign 2012 compared with that of
patients diagnosed in the rest of that year .................................................................. 127
Table 37. List of lung campaign related symptom Read codes .................................. 128
Table 38. Definition of performance status categories................................................ 129
Table 39. List of campaign evaluation metrics and their descriptions ......................... 131

Be Clear on Cancer: Regional and national lung cancer awareness campaigns 2011 to 2014
17
1. Foreword
It gives me great pleasure to introduce this evaluation report on the impact of the Be
Clear on Cancer lung campaigns which ran from 2011 to 2014. It represents the
culmination of a huge amount of work by staff in PHE, the Department of Health (DH)
and NHS England (NHSE), together with significant contributions from partner
organisations, particularly Cancer Research UK. I would like to thank all involved in
making a success of this innovative programme. A complex range of analyses and
interpretations of data from a large number of sources provide us with insight into the
potential impact of the lung campaigns across the patient pathway, from awareness of
symptoms in the general public, through to GP attendance and survival.
This document examines the evaluation metrics published on the NCRAS website and
takes a close look at the findings in the wider context of what we know about lung
cancer and early diagnosis. The results are of great interest, though not straightforward
to interpret. However, what is clear is that these campaigns have raised awareness of
the symptoms of lung cancer prompting people to see their GPs, triggering increases in
referrals for suspected cancer. This has led to a shift in the proportion of patients
diagnosed with earlier stage disease, allowing them the possibility of securing more
effective treatment. This is balanced against the fact that we have not been able to
demonstrate a significant improvement in survival directly as a result of the campaigns.
Be Clear on Cancer is now in its eighth year, and has become a well-established,
award-winning brand, working to improve cancer outcomes and reduce health
inequalities. The Independent Cancer Taskforce supported our work in the 2015
Strategy for England, recognising how Be Clear on Cancer is making a real difference
to people’s lives by improving outcomes and increasing awareness of the fact that
many cancers are treatable if caught early. Early diagnosis is crucial to improving
outcomes from cancer and other serious diseases. Be Clear on Cancer is part of the
national drive to tackle cancer, contributing towards making earlier diagnosis a reality
for the thousands of people diagnosed with cancer each year.

Be Clear on Cancer: Regional and national lung cancer awareness campaigns 2011 to 2014
18
The Be Clear on Cancer programme is run by PHE in partnership with DH and NHSE,
working closely with Cancer Research UK, clinical colleagues and the wider academic
and charity sectors.
PHE has been responsible for the development, marketing and evaluation of all
campaigns run since April 2013. They have carried out careful evaluation, often using
bespoke analyses of complex datasets in order to establish as best they can the impact
of the campaigns.
Professor Chris Harrison, National Clinical Director for Cancer, NHS England Chair of the Be Clear on Cancer Steering Group

Be Clear on Cancer: Regional and national lung cancer awareness campaigns 2011 to 2014
19
Note: Structure of report
This report is written with a wide range of audiences in mind and includes many sets of
individual results and analyses. If read in full, is very long. It has therefore been divided
into several clear sections, not all of which will be of interest to all readers. The
Executive Headlines summarise all the major findings, followed by the Summary Report
which presents the findings with the most important elements of the analyses.
Appendices 1 and 2 provide a greater depth of detail on the methodology and evidence
and are intended more as reference sources.

Be Clear on Cancer: Regional and national lung cancer awareness campaigns 2011 to 2014
20
2. Executive headlines
2.1 The problem
Lung cancer kills more people than any other cancer. In 2015 it accounted for 21% of
all cancer deaths in England with 28,565 deaths and 36,637 new patients being
diagnosed with the disease. Late presentation is a major problem and in 2015 over
70% of patients had essentially incurable disease by the time they reached specialist
care. Patients diagnosed with the earliest stage disease (stage 1A) have a much better
prognosis with as many as 90% living to 5 years in some studies. Survival rates in
England are worse than many other parts of the developed world and this is, in part at
least, because a higher proportion of patients have advanced disease by the time they
are diagnosed.
2.2 Aim of the Be Clear on Cancer campaigns
The objective of the Be Clear on Cancer campaigns is to encourage more people to
recognise symptoms that might be an early indication of cancer and to see their GP
sooner, leading to earlier diagnosis and ultimately improved outcomes.
The ambitions from the Independent Cancer Taskforce are an additional 30,000
patients per year surviving cancer for ten years or more by 2020, of which almost
11,000 will be through earlier diagnosis. Alongside other actions, the Cancer
Taskforce’s recommendation is that there should be a minimum of two national Be
Clear on Cancer campaigns per year to support the overall ambition.
2.3 History of campaigns
A regional pilot of the Be Clear on Cancer campaign to raise public awareness of
persistent cough as a symptom of lung cancer ran in the East and West Midlands in
2011. Based on the early findings from the pilot, the first national campaign in 2012 was
commissioned, and then two further national campaigns in 2013 and 2014. Campaigns
were targeted at people over the age of 50 and people in the lower social class groups
known as C2DE. As a result of the initial evaluation of the four ‘cough’ campaigns
discussed in this report, a broader respiratory symptoms campaign was carried out

Be Clear on Cancer: Regional and national lung cancer awareness campaigns 2011 to 2014
21
nationally in 2016 and a reminder campaign launched in May 2017. These use both
breathlessness and cough as target symptoms and attempts will be made to assess
their impact on the diagnosis of other conditions such as chronic obstructive pulmonary
disease (COPD) and heart failure, as well as lung cancer.
2.4 Campaign recognition and public awareness
Three out of four of the Be Clear on Cancer lung cancer campaigns were evaluated by
tracking surveys among the general public before and after the campaigns. The three
campaigns achieved a high level of public recognition of persistent cough as a possible
symptom of lung cancer. Across the campaigns almost one in five people surveyed
said they had taken action as a result of the campaign.
2.5 Attendance at GP practices
There were significant increases in the number of people seeing their GP for cough as
a result of the regional and first national campaigns, but the numbers involved were not
generally overwhelming for GPs, the typical impact being around three additional
attendances per pratice per week. No GP practice attendance data was available for
the second and third national campaigns.
2.6 Urgent GP referrals for suspected lung cancer
Between 2011 and 2015 the number of urgent GP referrals (also known as two week
wait referrals) for suspected lung cancer doubled. There were short-term faster rates of
increase after each of the campaigns, the increases were largest after the first national
campaign (32%) and became less in subsequent campaigns.
2.7 Lung cancer diagnosis information from the Cancer Waiting Times (CWT) data
The number of lung cancers diagnosed after an urgent GP referral for suspected lung
cancer and the total number of lung cancers recorded in the CWT database both
increased after the first national campaign, with no evidence of an increase after the
second and third campaigns. There were no significant changes in detection rates or
conversion rates.

Be Clear on Cancer: Regional and national lung cancer awareness campaigns 2011 to 2014
22
2.8 Numbers of new lung cancers
The numbers of new lung cancers detected overall increased significantly in the periods
following the regional and first national campaign. No significant increases were seen
after the second and third campaigns except for a modest increase in numbers of
female cases after the third campaign.
2.9 Emergency presentation rates
There was a long-term decreasing trend in the proportion of patients diagnosed as a
result of an emergency presentation. This was paralleled by an increase in the
proportion referred electively from GPs over the time period of the campaigns, making it
difficult to interpret any specific impact of the campaigns.
2.10 Stage at diagnosis
There is evidence of a significant and positive stage shift (towards earlier stage
disease) in patients diagnosed after all three of the national campaigns, and a trend
towards such a shift after the regional campaign.
2.11 Performance status
Performance status is a measure of how the cancer is affecting the daily living abilities
of the patient, overall fitness and if impaired, impacts on suitability for treatment. Since
it can deteriorate over a period of delay in diagnosis, it is of relevance when considering
treatment rates. It was only available for the regional pilot and first national campaign.
2.12 Treatment rates
The proportion of patients undergoing surgery increased after the regional and first
national campaign. These two campaigns were also followed by an increase in the
overall proportion of patients receiving any active anticancer treatment and a fall in the
proportion receiving only palliative care.
2.13 Diagnostic imaging
Following the first national campaign there were significant increases in requests for
chest X-rays and CT scans both by GPs and consultants. The impact was less clear for
the second and third campaigns though overall use of thoracic imaging increased over
Be Clear on Cancer: Regional and national lung cancer awareness campaigns 2011 to 2014
23
the period. There was evidence of an increase in requests for chest X-rays by GPs over
the period of the third national campaign.
2.14 Survival
No statistically significant increases were observed in proportions of patients surviving
to 1 year post diagnosis in the first, second or third national campaigns.
2.15 Changes in impact over time
The greatest changes in most of the variables evaluated were seen after the regional
and first national campaigns, with evidence to suggest a lesser effect after the second
and third national campaigns. However, the baseline levels of many indicators
(especially urgent GP referrals for suspected cancer and emergency presentation
rates) had also changed over the period of observation, making assessment difficult.
The regional and first national campaigns were delivered with a heavier weight of
media coverage, meaning that the campaign messages will have been more visible to
the target audience. It is likely that the lower weight of media coverage may have had
some bearing on the impact of the later campaigns.
2.16 Overall conclusions
There is evidence of what might best be described as a ‘whole system response’. This
response starts with increased public recognition of the messages, to increases in
attendance at GP practices, then increases in urgent suspected cancer referrals from
GPs to secondary care. Following on from that, there is some evidence of an increased
number of cases and more use of diagnostic tests, a shift to earlier stage disease with
better performance status at the time of diagnosis and increased numbers of patients
undergoing surgery; but no evidence of a statistically significant improvement in 1-year
survival directly related to the campaigns.
All of these results have been studied against a background of general improvements
in many of the process and outcome indicators relating to lung cancer in England over
the last 10-12 years. These improvements are almost certainly a result of a wide variety
of changes in how lung cancer is managed in the English NHS and how it is perceived
as a disease both by the public and healthcare professionals. The Be Clear on Cancer

Be Clear on Cancer: Regional and national lung cancer awareness campaigns 2011 to 2014
24
lung cancer campaigns have been one part of this environmental change and ascribing
direct cause and effect is not possible. Whilst the marketing impact appears to have
been sustained over the three campaigns in which it was measured, there is evidence
of a progressive fall in indicators of clinical impact and outcome over the course of the
four campaigns. This may, in part, be related to reduced levels of spend on marketing
or diminishing returns against continuing background improvement. However, the
overall short-term evaluation of these campaigns presented in this document suggests
that they appear to have had a significant and positive impact on outcomes for lung
cancer patients in this country.

Be Clear on Cancer: Regional and national lung cancer awareness campaigns 2011 to 2014
25
3. Summary report
3.1 Background: scale and nature of lung cancer as a public health issue
Lung cancer is very common with 36,637 new incident cases being diagnosed in 2015
(ONS, 2017). It is also the commonest cause of death from cancer in England with
28,586 deaths being recorded in 2015, this representing 21% of all cancer deaths in
that year (ONS, 2017).
Although survival rates for lung cancer have been improving in England in recent years
(Walters et al, 2015), they remain poor compared with many other cancers. 39.5% of
patients diagnosed in 2012 survived to 1 year post diagnosis and only 11.0% of those
diagnosed in 2008 were alive 5 years later. In addition, survival rates in England (and
the UK in general) are worse than those reported from a number of other countries with
equivalent expenditure on healthcare (Francisci et al, 2015 and Coleman et al, 2011).
This can be explained, at least in part, by a combination of late diagnosis and poorer
stage-specific survival suggesting lower treatment rates (Walters et al, 2013), and
perhaps higher rates of comorbidity (Imperatori et al, 2006 and 2016). In England, the
large majority of patients have advanced and currently largely incurable cancers by the
time they reach secondary care. In 2014, for example, 70% had stages 3 and 4 disease
at the time of diagnosis (Royal College of Physicians, 2015). There is little robust data
comparing stage distribution between countries, but the International Cancer
Benchmarking Partnership reported that in England between 2004 and 2007, only
13.5% of patients presented with stage 1 disease compared with 20% in Canada and
19.6% in Sweden (Coleman et al, 2011).
Supporting evidence of late diagnosis comes from a study comparing excess death
rates for lung cancer 5 years from diagnosis in England, Norway and Sweden between
2001 and 2004 (Holmberg et al, 2010). Virtually all the excess deaths in England were
confined to the first year after diagnosis. Since there is no screening programme for
lung cancer in any of these three countries, a reasonable assumption is that patients
with symptoms are being diagnosed and treated earlier in Sweden and Norway. In
England, around 40% of lung cancer patients first come to the attention of secondary

Be Clear on Cancer: Regional and national lung cancer awareness campaigns 2011 to 2014
26
care via an emergency presentation and only around 12% of such patients are alive 1
year after diagnosis, compared with 35% of those referred electively by their GPs
(Elliss-Brookes et al, 2012).
The long term survival rates of patients treated with early stage disease are very much
better than those diagnosed with advanced cancer; 83% of patients diagnosed with
stage 1 lung cancer in England in 2014 survived to 1 year compared with only 17% of
those diagnosed at stage 4 (ONS and PHE 2017). Equivalent international current 5-
year survival rates are not yet available but international studies report that 5-year
survival for stage 1A disease can be as high as 92% and that for stage 4 disease this is
around 6% (Goldstraw et al, 2015).
In January 2011, Improving Outcomes: A Strategy for Cancer (DH, 2011) set out the
government’s ambition to save an additional 5,000 lives by 2014/15. One estimate is
that if England were to improve its lung cancer survival to match the best in Europe,
around 1,300 deaths from lung cancer 5 years from the date of diagnosis could be
avoided annually (Abdel-Rahman et al, 2009). The Improving Outcomes Strategy
stated that this was to be achieved through earlier diagnosis (through increased
awareness of symptoms and earlier presentation) and better access to optimal
treatments.
Low awareness of cancer symptoms is likely to contribute to patient delays in
presenting to medical professionals (Smith et al, 2009), and in turn contribute to later
stage diagnosis. This is likely to be compounded by a negative attitude to the value of
early detection and worries that treatment is often worse than the disease. A systematic
review by Austoker et al (2009) found limited evidence of the effectiveness of
community-level interventions to promote cancer awareness, with some evidence they
can promote earlier stage at diagnosis, but only one study demonstrated a sustained
effect of the campaign over several years. The review did not find any studies on lung
cancer symptom awareness interventions (including publications up to 2008).
Lung cancer in the Western world is strongly linked to tobacco smoking. It has been
estimated that, in the UK, personal cigarette smoking accounts for 85% of all cases of

Be Clear on Cancer: Regional and national lung cancer awareness campaigns 2011 to 2014
27
lung cancer (Parkin et al, 2011) which conversely means that, in England, around 5,500
cases of lung cancer occur in people who have never smoked. Lung cancer is
commoner in older people, with the average age at diagnosis being 72 years. It is
strongly associated with socio-economic deprivation and it has been estimated that, in
England between 1996 and 2011, there was an average annual excess of 11,700
incident cases of, and 9,900 deaths from lung cancer, associated with socio-economic
deprivation (National Cancer Intelligence Network (NCIN), 2014).
Lung cancer survival is dependent on a number of factors, the most important of which
are:
stage at diagnosis
morphology (cell type) – crudely broken down as Small Cell Lung Cancer (SCLC)
and Non-Small Cell Lung Cancer (NSCLC), though the morphological and
molecular sub-types of NSCLC have very different patterns of behaviour
fitness for treatment – which includes performance status (the extent of limitation
of functional activity related to the effects of the cancer), presence and severity of
co-morbidities and age
tumour biology (including racial factors and molecular biomarker status)
In the context of public awareness campaigns, it is the stage of the disease at
diagnosis that is probably the most important of these. However, fitness for treatment
may also deteriorate rapidly over a period of diagnostic delays, which can significantly
limit the proportion of patients fit enough to be able to undergo potentially curative
treatment. Surgical resection is the mode of treatment most likely to result in long term
survival and is very largely limited to patients with early stage disease (stages 1A to 2B
NSCLC). NSCLC accounts for almost 89% of lung cancers in the UK (NLCA report)
with the other 11% being SCLC. SCLC is a rapidly progressive cancer which is rarely
amenable to surgery and has poor long term survival. Even in SCLC however,
diagnostic and treatment delays can significantly impact on medium term survival rates,
including 1-year survival.

Be Clear on Cancer: Regional and national lung cancer awareness campaigns 2011 to 2014
28
3.2 History and aims of lung cancer awareness campaigns
The first reported lung cancer awareness campaign in the UK was carried out in
Doncaster in 2008. This was a relatively small-scale, community-based project which
used a range of approaches to raise public and primary care awareness of persistent
cough as a sign of lung cancer (Athey et al, 2012). The project resulted in enhanced
public recall of cough as an important symptom; behavioural change with more patients
visiting their GP; a change in GP behaviour with a 20% increase in chest X-ray
requests; and an increase in lung cancer diagnoses. There was a trend towards a
stage shift, in that more patients were diagnosed with early-stage disease. It is
particularly notable that the impact was greatest in areas of the town where there was a
combined approach, targeting primary care professionals as well as the public. The
project was too small in scale to allow for the identification of any major and statistically
significant improvements in other outcomes.
3.3 Creative development of campaign materials
In 2010, PHE commissioned a creative agency to produce an overarching proposition
for a series of new cancer awareness campaigns which would enable the target
audience to:
become clear about the symptoms
understand the action that they need to take (ie visiting their GP)
understand the benefit of doing so (cancer is treatable if caught early)
Following qualitative research, which assessed a number of creative propositions, Be
Clear on Cancer was chosen because it was felt to be authoritative, avoided skirting
around the issue of cancer and the ‘stamp’ was seen as direct and conveying
seriousness, while also highlighting the positive news that early diagnosis could make
cancer more treatable. The brand was also seen to stand on its own and was clearly
about cancer when seen in isolation.
Following this initial assessment stage, refinements were made to the Be Clear on
Cancer creative materials and the first Be Clear on Cancer regional pilot campaign,

Be Clear on Cancer: Regional and national lung cancer awareness campaigns 2011 to 2014
29
which focused on bowel cancer, ran from January 2011 to March 2011, moving on to
lung cancer later that year.
In 2010/11, the DH had funded a series of 53 local-level projects as part of their NAEDI
programme (National Awareness and Early Diagnosis Initiative), 39 of which targeted
lung cancer; 18 of these used Be Clear on Cancer branded materials. Therefore, at the
same time as developing a bowel cancer campaign, a version for lung cancer was
created. Experts from different clinical settings as well as public health and the voluntary
sector helped to develop the key messages.
3.3.1 The choice of persistent cough as the target symptom and local pilot
projects
There are many symptoms of lung cancer, none of which are highly specific for the
disease (Shim et al, 2014), but in a number of studies cough emerges as the most
common symptom, being recorded as a presenting symptom at the time of diagnosis in
well over half of cases (Hamilton et al, 2005; Smith et al, 2009). In their ‘Referral
Guidelines for Suspected Cancer’, National Institute for Health and Clinical Excellence
(NICE) identified cough persisting for more than three weeks as one of its major trigger
symptoms (NICE, 2005). From a clinical standpoint, cough is more likely to be
associated with treatable disease than symptoms such as breathlessness and chest
pain, which are more often seen in advanced disease.
Whilst there is one small retrospective case-cohort study (Hamilton et al, 2005), there
are no prospective, population-based studies examining the predictive value of
symptoms or symptom clusters in lung cancer. For many reasons, not least of which is
the huge size and cost of such studies, there is no prospect of such evidence becoming
available. On the basis of this evidence, the DH took the pragmatic view that, whilst the
symptom profile of lung cancer is obviously complex, the public ‘message’ had to be kept
simple, so the single symptom of cough persisting for three or more weeks was chosen
as the basis of the Be Clear on Cancer lung campaigns.

Be Clear on Cancer: Regional and national lung cancer awareness campaigns 2011 to 2014
30
Initial feedback at the end of 2010 and early 2011 from the local NAEDI projects
suggested that the Be Clear on Cancer approach for lung cancer was working, but
minor refinements would be appropriate before a wider roll-out. When moving to a
regional pilot, TV advertising would also be introduced and it was important to
understand what would motivate the audience to act and how to make the most of the
30-second TV advert. Therefore in August 2011 further qualitative research was
commissioned to ensure the messaging was as clear as possible.
3.3.2 Local to regional
Following the assessment that the local pilot campaigns had demonstrated feasibility
and a good level of acceptance, a regional lung cancer awareness pilot, again based
on the symptom of persistent, unexplained cough, was funded and ran in the Central
TV region (predominantly East and West Midlands) from 10 October to 13 November
2011.
The campaign, and subsequent campaigns, was generally targeted at those who were
aged over 50 years and from lower socio-economic groups (categorised as C2DE).
This target audience was selected because of incidence, mortality, survival and staging
data that were available at the time for England. However, for some elements of the
campaign, such as buying media, a slightly older demographic of over 55 years was
Figure 1. An example of one of the advertisements from a local pilot

Be Clear on Cancer: Regional and national lung cancer awareness campaigns 2011 to 2014
31
selected. This is a standard age band for buying media and would hopefully minimise
the influence on younger people.
The campaign consisted of various activities, including TV, radio and press adverts, ten
face-to-face events and out-of-home advertising eg on pharmacy bags and screens in
GP practices. It was delivered in partnership with the former Cancer Networks, clinical
leads in local hospitals, general practice and public health teams.
The primary objectives of the campaign were to:
raise the awareness of the signs and symptoms of lung cancer among the target
audience
encourage people with symptoms of potential lung cancer to see their GP
promptly, focusing on the target audience
The hope was that by raising awareness and encouraging people with the promoted
symptoms to present to their GP promptly, more cancers would be diagnosed at an
earlier stage and may therefore lead to better overall outcomes. In addition, DH was
mindful that it needed a campaign mechanism that was manageable and would not
cause unnecessary pressures on the NHS, therefore the impact on NHS services was
also assessed.
Figure 2. Examples of the posters for the Regional Campaign
3.3.3 Regional to national
An assessment of this first regional campaign concluded that a) it was feasible, b) that
its messages were recognised by the public and c) that it did not cause unbearable
pressure on GPs or secondary care. It was therefore decided to run a national

Be Clear on Cancer: Regional and national lung cancer awareness campaigns 2011 to 2014
32
campaign in 2012 which was repeated as national reminder campaigns in 2013 and
2014.
The first national Be Clear on Cancer lung cancer campaign ran from 8 May to 30 June
2012 and the primary target audience was those aged 50 and over from lower socio-
economic groups based on lung cancer statistics such as incidence and mortality. The
campaign’s objectives were the same as for the regional campaign and the key
message again was: “Been coughing for 3 weeks? Tell your doctor”.
The campaign activity included advertising, public relations and face-to-face events in
shopping centres. Advertising to communicate the key messages ran nationally on TV,
radio, in the press, on pharmacy bags and online. Posters and leaflets were displayed
in GP practices and in other community settings. There was also some activity targeted
at older Black African and Caribbean and South Asian men and women as cultural,
religious and language barriers can reduce the likelihood of people from these
communities seeing their GP promptly.
The second national Be Clear on Cancer lung cancer campaign ran for 6 weeks from 2
July to 11 August 2013 and used the same channels for advertising as the first
campaign (TV, radio, press, on pharmacy bags and online). The campaign had the
same objectives and key messages however the Public Relations (PR) activity
included a launch based on key statistics around lung cancer survival, the support of
well-known people who had a connection with the disease, case studies and a range of
spokespeople, as well as promotion of the face-to-face events. The campaign website
was updated and posters and leaflets were displayed, as for the first campaign.
The third national lung cancer awareness campaign ran in England for 8 weeks from 10
March until the end of April 2014 using the same materials as those used in the second
national campaign.
All four campaigns were timed to avoid the peak winter seasonal increases in
respiratory tract infections, to avoid undue overloading of primary care services.

Be Clear on Cancer: Regional and national lung cancer awareness campaigns 2011 to 2014
33
3.3.4 Campaign weights
The weight of media varied between campaigns, meaning that there were differences
between the percentage of the target audience who saw the advertising and the
number of times that they would have seen it. There were also differences in the use of
supporting activities such as face-to-face events and PR.
Table 1. Dates, duration, TVRs, reach and frequency, and media costs for the regional and national campaigns.
Timing Campaign Adult TVRS*
Reach and frequency**
Duration Media budget
Non-media
activity
10 October 2011 to 13 November
2011
Regional 856 94.5% @ 9.1OTS
5 weeks £1.4m PR; Events
8 May 2012 to 1July 2012
First National
654 88.4% @ 7.4OTS
8 weeks £2.87m
PR; Events (door drop
in Yorkshire only)
2 July 2013 to 11August
2013
Second National
496 75.2% @ 6.6OTS
6 weeks £1.45m PR; Events
10 March 2014 to 30
April 2014
Third National
564 71.5% @ 7.3OTS
8 weeks £1.92m PR
(minimal)
*TVR (television rating) is the measure of the popularity of a programme, daypart, commercial break
or advertisement by comparing its audience to the population as a whole. One TVR is numerically
equivalent to one per cent of a target audience.
**Reach is the term used to express the total percentage of a target audience who are exposed to a
commercial at least once throughout a campaign period. This figure represents unduplicated
audience exposure. Frequency describes the average number of times that a person within the target
audience has had the opportunity to see an advertisement over the campaign period. OTS stands for
opportunity to see.
3.4 Evaluation metrics
The range of metrics and indicators used to evaluate these various campaigns is large
and the analyses have been carried out by many different individuals and groups who
are acknowledged at the front of this report. The regional pilot and the first national

Be Clear on Cancer: Regional and national lung cancer awareness campaigns 2011 to 2014
34
campaign were analysed by Cancer Research UK and the second and third national
campaigns by NCRAS in PHE.
The main areas of evaluation covered:
marketing evaluation – public recognition of the featured symptom pre- and post-
campaign and the need for action (ie seeing their GP) (details of methods set out
in the section 5.1)
attendance at a GP practice with cough
urgent GP referrals for suspected lung cancer – number of referrals, related
cancers, and conversion and detection rates
numbers of new lung cancer cases diagnosed during and shortly after the period
of the campaigns
stage of lung cancers at diagnosis
performance status of lung cancer patients at the time of diagnosis
proportion of patients undergoing surgical resection
proportion of patients alive at 1 year post-diagnosis
3.5 Public awareness and campaign recognition
3.5.1 Demographics
With regards to the demographics of the surveyed populations, the results of the later
campaigns were similar to the regional pilot. Of the pre- and post-campaign survey
respondents, 54% were female, 42% were aged 55 to 64 years, and approximately
60% were from lower socio-economic groups in both the pilot and control areas. These
findings are illustrated graphically in table 4 in section 5.2.
3.5.2 Campaign recognition, first national campaign
When asked to describe the signs and symptoms of lung cancer, spontaneous
mentions of a cough increased from 54% pre-campaign to 65% post-campaign
(p<0.001), with specific mentions of a persistent/prolonged cough increasing from 12%
to 15% (p=0.048). Prompted knowledge of a cough for three or more weeks was the
symptom with the largest increase in recognition, rising from 18% pre-campaign to 33%
after (p<0.001).

Be Clear on Cancer: Regional and national lung cancer awareness campaigns 2011 to 2014
35
Similar trends were seen in the regional pilot area following the regional campaign
(Ironmonger et al, 2015). For instance, prompted knowledge of a cough for three or
more weeks increased from 19% to 34% (p<0.001) (TNS-BMRB, 2013). For
comparison, changes in the control area were generally not statistically significant.
3.5.3 Campaign recognition, second national campaign
The second national campaign was well recognised, with eight in ten people aware of
one or more Be Clear on Cancer lung marketing materials. While there was probably
some residual awareness from the first national campaign, this was a significant result
given the lower spend levels in this second campaign. As expected, awareness was
driven largely by the TV advertisement (71%) and this was higher among the target
C2DE group (77%). One in four recalled hearing the radio advertisement (27%) and
seeing the print advertisement (25%), while 15% recognised the leaflet.
3.5.4 Campaign communication, second national campaign
After being shown the campaign adverts, almost three quarter of respondents thought
that the main message of the advertisement was to see their GP (73%), a significant
increase from the first national campaign (68%), indicating the call to action had the
intended consequences.
As seen with previous Be Clear on Cancer campaigns, almost all respondents agreed
that it was important that adverts like these were shown (91%) and that the adverts
were clear and easy to understand (91%). There was evidence that the second
national campaign strengthened agreement with these statements, with movement
from people agreeing slightly to agreeing strongly. Around half agreed that the
advertising was relevant to them (53%) and 44% thought the advertising told them
something new, in line with the first national lung cancer campaign.
3.5.5 Knowledge of symptoms, second national campaign
Four out of five (83%) spontaneously mentioned a correct symptom of lung cancer after
the second campaign, this was a significant increase from the pre-campaign level of
73%. Particularly encouraging was the fact that spontaneous knowledge of the key
campaign symptom of a persistent cough increased significantly following this

Be Clear on Cancer: Regional and national lung cancer awareness campaigns 2011 to 2014
36
campaign to a higher level than after the first national campaign (22% after the second
campaign, up from 15% after the first campaign).
The campaign had a positive effect on confidence in knowledge of signs and symptoms
of lung cancer, increasing from 42% to 52% after the second campaign, which was in
line with the results seen after the first campaign.
The second campaign also had a positive impact on prompted knowledge of signs and
symptoms with an increase in the proportion stating a cough for 3 weeks or more that
doesn’t go away was definitely a warning sign of cancer (from 22% pre- campaign to
30% post-campaign).
3.5.6 Attitudinal questions, second national campaign
There were positive shifts on a range of attitudinal measures related to early diagnosis
and barriers to visiting the GP with a potential symptom of lung cancer. This is
particularly encouraging as it is harder to change attitudes than knowledge or
confidence and there is often little or no movement in these measures. These shifts
may be partially attributed to the cumulative effect of the broad range of Be Clear on
Cancer activity seen to date and partially attributed to the impact of the repeat airing.
3.5.7 Campaign impact, second national campaign
Three quarters (76%) agreed the advertising would make them more likely to see the
GP if they had symptoms and felt concerned. This was in line with the results from the
first campaign, but strength of agreement with this measure had deepened. Sixteen
percent of those who had recognised one of the advertisements said they had taken
action as a result of seeing the advertisements, slightly less than the 19% who did so
following the first campaign. Respondents said they were as likely to have made an
appointment with their GP as they were to have talked to friends or family about the
advertisements (4%).
There was no marketing evaluation of the third national campaign.
Be Clear on Cancer: Regional and national lung cancer awareness campaigns 2011 to 2014
37
3.5.8 Summary of marketing and campaign recognition
These were very successful campaigns in terms of recognition. Public awareness of the
target symptom increased after all the campaigns that were evaluated. Spontaneous
recognition of persistent cough as a possible symptom of lung cancer increased
progressively across the campaigns starting prior to the regional pilot at between 38%
and 50% (control and pilot areas, respectively) to 83% after the second national
campaign. Between 16% and 19% of respondents reported that they had taken action
as a result of seeing the campaigns.
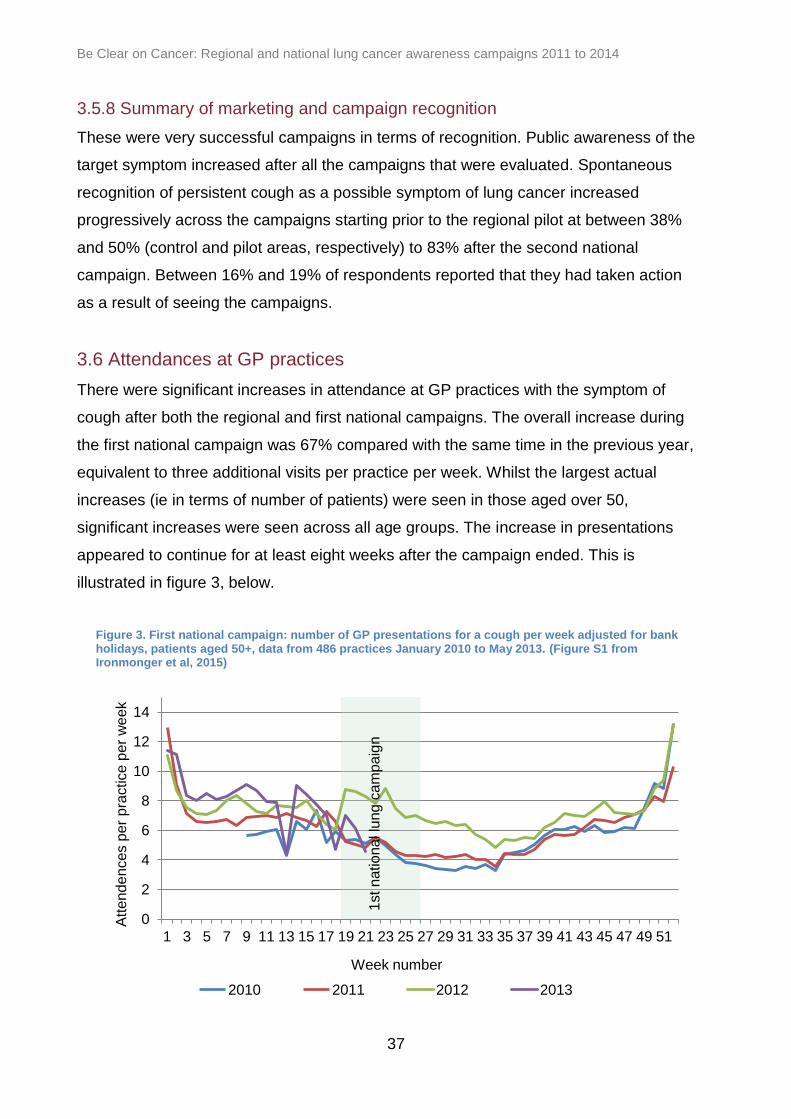
3.6 Attendances at GP practices
There were significant increases in attendance at GP practices with the symptom of
cough after both the regional and first national campaigns. The overall increase during
the first national campaign was 67% compared with the same time in the previous year,
equivalent to three additional visits per practice per week. Whilst the largest actual
increases (ie in terms of number of patients) were seen in those aged over 50,
significant increases were seen across all age groups. The increase in presentations
appeared to continue for at least eight weeks after the campaign ended. This is
illustrated in figure 3, below.
Figure 3. First national campaign: number of GP presentations for a cough per week adjusted for bank holidays, patients aged 50+, data from 486 practices January 2010 to May 2013. (Figure S1 from Ironmonger et al, 2015)
0
2
4
6
8
10
12
14
1 3 5 7 9 11 13 15 17 19 21 23 25 27 29 31 33 35 37 39 41 43 45 47 49 51
Att
end
en
ces p
er
pra
ctice
per
we
ek
Week number
2010 2011 2012 2013
1st national lu
ng
cam
paig
n

Be Clear on Cancer: Regional and national lung cancer awareness campaigns 2011 to 2014
38
More detail of the analysis and results relating to GP attendances are given in
Appendix 5.4.
3.7 Analysis of CWT Data
Full details of methodology and results are given in section 5.5.
3.7.1 Urgent GP referrals for suspected lung cancer
There is a strong long-term increasing trend in the number of urgent GP referrals for
suspected lung cancer, also known as Two Week Wait referrals (TWW), reflecting a
more general trend for all suspected cancer referrals. It is important to consider this
trend when comparing the number of referrals following any of the lung campaigns and
the number of referrals one or two years earlier. Between 2011 and 2015 the number of
two week wait referrals for suspected lung cancer doubled; a summary of that trend in
relation to the timing of the four campaigns is illustrated in figure 4 below.
Figure 4. Number of urgent GP referrals for suspected lung cancer between January 2011 and March 2015 (not adjusted for working days)
Following the first national lung cancer campaign, there was a significant 32% increase
in the number of urgent GP referrals for suspected lung cancer, when comparing the
period May to July 2011 with May to July 2012 (see figure 5), in comparison to a 12%
increase in urgent GP referrals for other suspected cancers.
Reg
iona
l pilo
t lu
ng c
am
pa
ign
1st na
tiona
l lu
ng c
am
pa
ign
2n
d n
ation
al lu
ng
cam
pa
ign
3rd
nation
al lu
ng
cam
pa
ign
0
1,000
2,000
3,000
4,000
5,000
6,000
Re
ferr
als
for
susp
ecte
d lu
ng
can
cer
Ja
n-2
011
Mar-
201
1
May-2
011
Ju
l-2
01
1
Sep
-201
1
No
v-2
01
1
Ja
n-2
012
Mar-
201
2
May-2
012
Ju
l-2
01
2
Sep
-201
2
No
v-2
01
2
Ja
n-2
013
Mar-
201
3
May-2
013
Ju
l-2
01
3
Sep
-201
3
No
v-2
01
3
Ja
n-2
014
Mar-
201
4
May-2
014
Ju
l-2
01
4
Sep
-201
4
No
v-2
01
4
Ja
n-2
015
Mar-
201
5
Month first seen
Data source: National Cancer Waiting Times Monitoring Dataset, NHS England. Analysed by: NCRAS

Be Clear on Cancer: Regional and national lung cancer awareness campaigns 2011 to 2014
39
Figure 5.First National Campaign: urgent GP referrals, England January 2010 to November 2012 (monthly average number of urgent GP referrals for suspected lung cancer per working day)
Following the second and third national lung cancer awareness campaigns, there were
smaller increases in urgent GP referrals for suspected lung cancer, which were
particularly smaller relative to increases in referrals for other suspected cancers. When
comparing the period July to September 2011 with July to September 2013, there was
a 30% increase in referrals for suspected lung cancer, compared to a 26% increase for
other suspected cancers. When comparing the period March to May 2013 with March
to May 2014, there was an 8% increase in referrals for suspected lung cancer,
compared to a 15% increase for suspected head and neck cancers (the control).
For all three campaigns, the largest percentage increases in urgent GP referrals for
suspected lung cancer were seen for those aged under 50 and 50 to 59, although the
referral rates remained considerably lower for these age-groups than for the older age-
groups. Increases in urgent GP referrals for suspected lung cancer were slightly larger
for women than for men for all three campaigns.
3.7.2 Cancer diagnoses resulting from an urgent GP referral for suspected lung
cancer
Following the first national lung cancer campaign, there was a significant 18% increase
in the number of lung cancer diagnoses resulting from an urgent GP referral for
1st na
tiona
l lu
ng c
am
pa
ign
0
50
100
150
200
250
Re
ferr
als
for
susp
ecte
d lu
ng
can
cer,
avera
ge p
er
work
ing
da
y
Jan Feb Mar Apr May Jun Jul Aug Sep Oct Nov DecMonth first seen
2010 2011 2012
Data source: National Cancer Waiting Times Monitoring Dataset, NHS England. Analysed by: NCRAS

Be Clear on Cancer: Regional and national lung cancer awareness campaigns 2011 to 2014
40
suspected lung cancer from May to July 2012 when compared with the same months in
the previous year.
When comparing the period May to July 2011 with May to July 2012, the largest
increase in lung cancer diagnoses resulting from an urgent GP referral for suspected
lung cancer was seen for those aged under 50 (43%, but based on small numbers),
with similar increases for most of the other age groups.
The increase in lung cancer diagnoses resulting from an urgent GP referral for
suspected lung cancer for the period May to July 2011 when compared with the same
months in 2012 was statistically significant for both men and women, although slightly
larger for men than for women.
In general, the second and third national lung cancer awareness campaigns did not
appear to have an impact on the number of lung cancer diagnoses resulting from an
urgent GP referral for suspected lung cancer.
There were no statistically significant changes for England overall or by age group
following either the second or third national campaigns. However, the third national lung
cancer awareness campaign appears to have had an impact on the number of lung
cancer diagnoses resulting from an urgent GP referral for women, with an 8.6%
statistically significant increase for the period March to May 2014 compared with March
to May 2013.
3.7.3 Conversion rate
In general, the lung cancer awareness campaigns did not appear to have an impact on
the conversion rate for urgent GP referrals for suspected lung cancer.
Although there were statistically significant decreases in the conversion rates following
the first campaign (between May to July 2011 and May to July 2012) and the second
campaign (between July to September 2011 and July to September 2013), these
changes appeared in line with the long-term decreasing trend rather than as a
particular effect following these campaigns.

Be Clear on Cancer: Regional and national lung cancer awareness campaigns 2011 to 2014
41
By age and sex, there were some statistically significant decreases following the first
and second national campaigns, but these appeared to reflect the long-term trend.
There were no statistically significant changes in the conversion rates following the third
national campaign (between March to May 2013 and March to May 2014), neither
nationally nor by age or sex.
3.7.4 Lung cancer diagnoses recorded in the CWT dataset
When comparing the period June to August 2011 with June to August 2012, there was
a statistically significant 4.5% increase in the total number of lung cancers recorded in
the CWT database, potentially an impact of the first national lung cancer awareness
campaign.
For the same period, increases in the number of lung cancers recorded in the CWT
database for those aged 80 and over and for women were statistically significant.
However, these changes do not appear to reflect a particular impact of the campaign,
as the trend in numbers for these groups are similar to those for the other age-groups
and for men.
The second and third national campaigns do not appear to have an impact on the
number of lung cancers recorded on the CWT dataset, with no significant changes in
the number of these cancers following either of these campaigns, either overall or by
age or sex.
3.7.5 Detection rate
In general, the national lung campaigns do not appear to have a specific impact on the
detection rate, with no significant changes in the national lung cancer detection rate
following any of the three campaigns. By age-group, there were some statistically
significant changes in the detection rate following the second national campaign, but
these appear to reflect natural variations rather than a specific impact of the campaign.
There were no statistically significant changes in the detection rate for either men or
women following any of the three campaigns.

Be Clear on Cancer: Regional and national lung cancer awareness campaigns 2011 to 2014
42
3.8 Emergency presentation rate
For the period of the first national campaign, there was an increase in the proportion of
patients recorded in the National Lung Cancer Audit (NLCA) database diagnosed via
GP referral (3.0 percentage point increase from 47.9% to 50.9%; p<0.001) and a
decrease in the proportion diagnosed after an emergency admission or A&E
attendance (1.9 percentage point decrease from 21.5% to 19.6%; p=0.004). For the
second and third campaigns, emergency presentation was defined in line with the proxy
for emergency presentations methodology. There were no significant differences in the
proportions of lung cancers diagnosed through emergency presentation for the year the
campaign ran compared with the previous year. Over the time period of all the
campaigns, however, there was a slow but consistent fall in the proportion of patients
diagnosed as an emergency presentation, in parallel with an increase in the proportion
referred electively from GPs, making interpretation of the specific impact of the
campaigns difficult. Details can be found on the NCRAS website.
3.9. Number of cases of lung cancer diagnosed
3.9.1 Number of new lung cancers, regional and first national campaign
Cancer Research UK analysed data from the NLCA database (data on confirmed lung
cancer patients from all English NHS trusts involved in the care of lung cancer) for the
evaluation of the regional and first national campaigns. They found that the number of
lung cancers diagnosed increased after the launch of the regional campaign by 12.3%
in the campaign area compared to 3.1% in the control area (table 2), (Ironmonger et al,
2015).

Be Clear on Cancer: Regional and national lung cancer awareness campaigns 2011 to 2014
43
Table 2. Regional campaign: number of lung cancers diagnosed comparing the campaign months of October to December 2011 with October to December 2010 for the pilot and control areas (Table S7 from Ironmonger et al, 2015)
Control Area (n=141 trusts) Pilot Area (n=32 trusts)
Number diagnosed
% change (adjusted1)
p-value
Number diagnosed
% change (adjusted1)
p-value
October to
December 2010
October to
December 2011
October to
December 2010
October to
December 2011
5,226 5,473 +3.1% 0.117 1,446 1,649 +12.3%* 0.001
1Adjusted for a five day working week excluding bank holidays (eg includes Easter, early May, spring
bank holidays and Queen’s Diamond Jubilee bank holiday for 2012)
*Statistically significant difference between 2011 and 2012 (likelihood ratio test of significance p<0.05)
Similarly, they found a 9.1% increase in lung cancers diagnosed during the period of
the first national campaign (adjusted for working days; p<0.001), whilst there was a
small non-significant 1.5% increase during the control period (p=0.373) (table 3).
Table 3. First national campaign: number of lung cancers diagnosed for the campaign and control periods (Table 5 from Ironmonger et al, 2015)
Control Period Campaign period (First national)
Number diagnosed
% change (adjusted1)
p-value
Number diagnosed
% change (adjusted1)
p-value
February to April 2011
February to April 2012
May to July 2011
May to July 2012
7,404 7,636 +1.5% 0.373 7,639 8,335 +9.1%* <0.001
1Adjusted for a five day working week excluding bank holidays (eg includes Easter, early May, spring
bank holidays and Queen’s Diamond Jubilee bank holiday for 2012)
*Statistically significant difference between 2011 and 2012 (likelihood ratio test of significance p<0.05)
Figure 6 suggests that the uplift in diagnoses surrounding the timing of the campaign
began to return to pre-campaign levels from around August 2012.
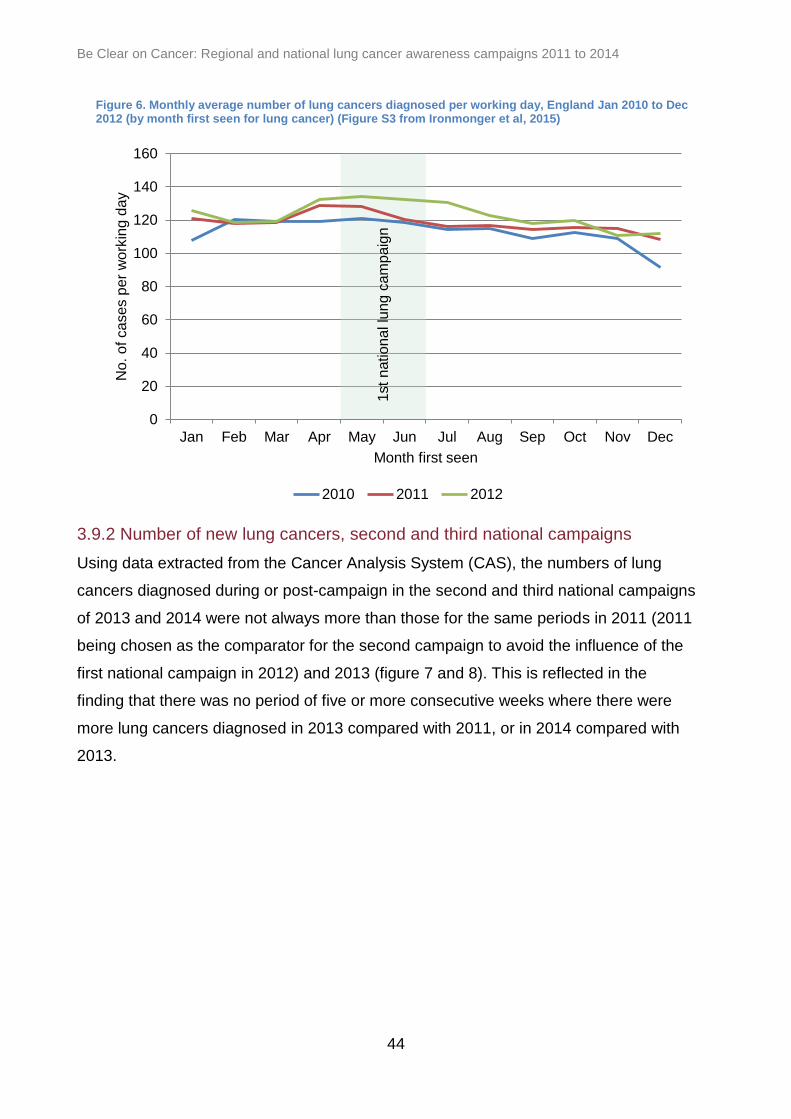
Be Clear on Cancer: Regional and national lung cancer awareness campaigns 2011 to 2014
44
Figure 6. Monthly average number of lung cancers diagnosed per working day, England Jan 2010 to Dec 2012 (by month first seen for lung cancer) (Figure S3 from Ironmonger et al, 2015)
3.9.2 Number of new lung cancers, second and third national campaigns
Using data extracted from the Cancer Analysis System (CAS), the numbers of lung
cancers diagnosed during or post-campaign in the second and third national campaigns
of 2013 and 2014 were not always more than those for the same periods in 2011 (2011
being chosen as the comparator for the second campaign to avoid the influence of the
first national campaign in 2012) and 2013 (figure 7 and 8). This is reflected in the
finding that there was no period of five or more consecutive weeks where there were
more lung cancers diagnosed in 2013 compared with 2011, or in 2014 compared with
2013.
0
20
40
60
80
100
120
140
160
Jan Feb Mar Apr May Jun Jul Aug Sep Oct Nov Dec
No
. o
f ca
ses p
er
wo
rkin
g d
ay
Month first seen
2010 2011 2012
1st
natio
na
l lu
ng
cam
paig
n

Be Clear on Cancer: Regional and national lung cancer awareness campaigns 2011 to 2014
45
Figure 7. Second national campaign: the number of lung cancer cases (C33-34) by week, comparing 2011 with 2013 and the median for England for 2013

Be Clear on Cancer: Regional and national lung cancer awareness campaigns 2011 to 2014
46
Figure 8. Third national campaign: the number of lung cancer cases (C33-34) by week, comparing 2013 and 2014
3.9.3 Demographics of new cases
There has been no evidence of a difference in the age or sex distribution of new cases
of lung cancer following any of the campaigns (more detail in appendix 5.7).
3.10 Impact on stage at diagnosis
There is evidence of a stage shift in patients diagnosed around and in the weeks
following the campaigns. The analyses relating to the regional and first national
campaigns were carried out by Cancer Research UK using NLCA data. Those for the
second and third national campaigns were carried out by NCRAS analysts using the
CAS and slightly different analytical methods (including slight differences in how the
stages were grouped) and different time periods have been used. However, there is
evidence of a statistically significant and positive stage shift (towards earlier stage
disease) in patients diagnosed after all three national campaigns (see figure 9 for first
national campaign and figure 10 for the second national campaign); there was also a

Be Clear on Cancer: Regional and national lung cancer awareness campaigns 2011 to 2014
47
trend towards such a shift after the regional campaign. With regards the second
national campaign in 2013, there were eight consecutive weeks (weeks 42 to 49) where
the proportions of early staged 1 and 2 cases were above the median (see figure 10);
this corresponded with five consecutive weeks (weeks 45 to 49) where the proportions
of stage 3 cancers were below the median. There was no change in the proportion of
stage 4 cancers during 2013.
These results relate to all cases of lung cancer irrespective of their morphology. Stage
in SCLC patients was analysed separately for the regional campaign and first national
campaign; a significant shift towards earlier stage (previously called ‘limited’) disease
was observed for the regional campaign, but although there was a trend towards a
similar positive shift in the national campaign, it was not statistically significant.
Figure 9. First national campaign: percentage changes in stage distribution of cases of NSCLC diagnosed pre and post campaign
-4
-3
-2
-1
0
1
2
3
4
Stage I Stage II Stage III Stage IV
Pe
rce
nta
ge
po
int ch
an
ge
be
twe
en
20
11
&
20
12
Control (Feb-April)
Campaign(May-July)
*
*
* p < 0.001

Be Clear on Cancer: Regional and national lung cancer awareness campaigns 2011 to 2014
48
Figure 10. Proportion of lung cancers diagnosed at stage 1 and 2 in England by week following the second national campaign (2013), against the weekly median for 2013
It is worth noting that there has been a gradual increase in the proportion of patients
being diagnosed with early stage lung cancer in England over the period of the
campaigns, as illustrated in figure 11 using data from the NLCA. The proportion of
patients being staged has also increased over that time period, but the proportion of
staged patients diagnosed with stage 1 and 2 disease has increased from 19.5% to
26% compared with that for stages 3B and 4 which has increased from 56% to 59%.

Be Clear on Cancer: Regional and national lung cancer awareness campaigns 2011 to 2014
49
Figure 11. Distribution (%) of early and late stage lung cancer in England 2012 to 2015 (source: NLCA)
3.11 Impact on performance status at diagnosis
Performance status is a clinical assessment of the impact of the cancer on the patient’s
ability to carry out the normal activities of daily living. It is a powerful prognostic factor
and can deteriorate quite quickly during the latter part of the course of disease. It has a
major impact on fitness for treatment, meaning that delays in diagnosis not only impact
on stage of disease, but also the feasibility of active treatment. Performance status was
analysed with respect to the regional and first national campaigns. There was a non-
statistically significant trend towards better performance status at diagnosis after the
regional campaign. There was also a trend towards a better performance status in
patients diagnosed in the period following the first national campaign.
3.12 Diagnostic imaging
Since the collection of the Diagnostic Imaging Dataset (DID) only began in 2012, no
data is available to evaluate the impact of the regional campaign on imaging. The
quality and completeness of the DID is likely to have changed over the period of
analysis presented here and results should therefore be considered as provisional. The
analysis of the first national campaign was carried out by Cancer Research UK and the
second and third by analysts in NCRAS; slightly different groups of CT scan codes
0
10
20
30
40
50
60
70
2012 2013 2014 2015
% s
tage
d
Stages 1 & 2 Stages 3B & 4

Be Clear on Cancer: Regional and national lung cancer awareness campaigns 2011 to 2014
50
were used by the two groups, which makes direct comparison difficult, however it is
unlikely that any major effect has gone undetected.
Following the first national campaign there were significant increases in requests for
chest X-rays and CT scans both by GPs and consultants, the most notable was an
increase in the number of GP requested chest X-rays of 18.6% (p<0.001) and an
overall increase of 12.3% in CT scan requests. Since CTs are mostly only carried out
where there was an abnormality on the chest X-rays, this implies a high detection rate
of patients with clinically significant problems, whether cancer or not. Over 2013 to
2014, the period that covered the second and third national campaigns, there was a
steady increase in the number of CT scans requested by consultants and GPs, though
the number requested by GPs was very small. However, there were no statistically
significant changes in any of the imaging test numbers directly related to the second
national campaign, either those requested by GPs or by consultants.
With respect to the third national campaign, the overall volume of imaging in 2014 was
compared to the median for the year 2013 and there was a statistically significant
increase in the volume of images when comparing the period March to May 2013 with
March to May 2014. The increase was only seen for GP chest X-ray referrals, which
increased by 23% during the campaign period in 2014 compared with the rest of that
year. There was no period of sustained increase in the volume of CT scans that
appeared to be directly related to the timing of the campaign (over and above the
generally increasing trend over time).
3.13 Impact on treatment
There is good evidence of a statistically and clinically significant increase in surgical
resection rate associated with both the regional and first national campaigns. In
absolute terms, the increase after the first national campaign was 2.3%, a relative
increase of 17%. These analyses were largely based on the NLCA data, confirmatory
evidence was seen using OPCS4 codes (classified as interventions or surgical
procedures) from Hospital Episode Statistics (HES) analysed independently by DH.
Further analysis using HES linked to cancer registry data suggests that there was an

Be Clear on Cancer: Regional and national lung cancer awareness campaigns 2011 to 2014
51
increase in surgical resections after the first and third national campaigns, but not after
the second national campaign.
Treatments other than surgery were examined after the regional and first national
campaigns. and there is evidence that those campaigns were associated with
statistically significant increases in overall active treatment rates and a fall in the
proportion of people receiving only palliative treatments.
3.14 Impact on survival
Analysis of the age-standardised 1-year crude survival rates over the period of the
regional campaign and the 6 week period following the campaign, compared with the
same time period 1 year earlier, revealed that in the campaign area there was a 4.0
percentage point increase (from 35.2% to 39.2%; p=0.024) compared to a 2.0
percentage point increase (from 37.3% to 39.3%; p=0.034) in the control area. There
was however no statistically significant difference (p=0.425) in these improvements
between the campaign and control areas (Ironmonger et al, 2015).
The period chosen for the survival analysis following the first, second and third national
campaigns was the survival of patients diagnosed during the period of the campaign
plus one month post-campaign, compared to the survival of patients diagnosed during
the rest of the same year. Analysed in this way, there was no evidence of any
difference of 1-year survival as a result of the first national campaign in 2012.
The 1-year survival of patients aged over 50 diagnosed in the period of the second
national campaign was numerically higher (41.1%) than those diagnosed in the rest of
the year (40.2%) but this was not statistically significant. Females had a significantly
higher 1-year survival than males. This difference was seen during and outside the
campaign period.
The 1-year survival of patients aged over 50 diagnosed in the period of the third
national campaign was not significantly different (41.0%) from that of patients
diagnosed in the rest of the year (41.2%). Females had a significantly higher 1-year
survival rate than males during and outside the campaign period.

Be Clear on Cancer: Regional and national lung cancer awareness campaigns 2011 to 2014
52
Survival data was re-analysed extending the time window to include three months post
the national campaigns and, analysed in this way, there were again no statistically
significant differences in survival rates of patients diagnosed over those extended
periods compared with those diagnosed during the rest of the same years.
3.15 Cost-effectiveness
Based on the stage shift in NSCLC seen after the regional and first national campaigns,
a cost-effectiveness analysis was carried out in partnership with colleagues from the
Centre for Health Economics at York University (Hinde et al, 2015). These included
measures such as Quality of Life Years (QALY) and incremental cost-effectiveness
ratios (ICERs). They concluded that: “the base-case theoretical model found the
regional and national early awareness campaigns to be associated with QALY gains of
289 and 178 QALYs and ICERs of £13,660 and £18,173 per QALY gained,
respectively” and that: “subject to the available evidence, the analysis suggests that
early awareness campaigns in lung cancer have the potential to be cost-effective.”
3.16 Relationship of campaign impact with age and socio-economic status
As was highlighted in section 3.1, lung cancer is much more common in people of lower
socio-economic status and it is likely that the main reason for that is the higher smoking
rates in these groups. It is also very much more common in people over the age of 50,
hence the fact that these campaigns have been targeted at people over the age of 50
and from socio-economic group C2DE. However, it is well recognised that attempts to
change health behaviour for the better have a greater impact on those from higher
socio-economic groups, increasing the deprivation gap (the Inverse Care Law (Tudor
Hart, 1971)).
Moffat et al (2015) used data from the evaluation of the bowel and lung cancer
awareness campaigns to assess the extent to which the campaign messages had
reached the target group. There were no significant differences in the magnitude of shift
in symptom awareness between ABC1 vs C2DE socio-economic groups. They
concluded that the national lung campaigns had reached their target audience but had
also influenced younger and more affluent groups.
Be Clear on Cancer: Regional and national lung cancer awareness campaigns 2011 to 2014
53
3.17 Limitations of data and analysis
One major weakness is that we have been very limited in our access to primary care
data. Access to such data at a national level would significantly improve our ability to
assess the impact on primary care and to better target work on public awareness
campaigns in future. It would also allow us to examine the impact of the campaigns on
non-cancer diagnoses, improvements in which could be a significant added benefit.
Detailed data on treatments other than surgery have only become available during the
course of these campaigns and so the impact on the use of non-surgical treatments
such as radiotherapy and systemic therapies has not been studied in any detail. This
limits our ability to assess the impact of treatment that may also prolong life (eg to 1
year) without necessarily leading to long term survival benefits.
The methods and datasets used in the analysis of stage have varied significantly
between campaigns. The fact that the findings on this metric have been inconsistent
may well be a result of the use of different datasets (NLCA and CAS), different
analytical methods (including slight differences in how the stages were grouped) and
different time periods that have been used. This also applies to the DID, which only
began collecting data in 2012 and the quality and completeness of which has improved
over the period of study. So the ability to reliably detect meaningful and comparable
changes over time using these datasets is limited.
Most of the analyses on the ‘clinical’ impact have been carried out defining the period of
analysis as the period of the campaign itself plus one month post campaign. This is an
arbitrary cut-off point and will have undoubtedly missed some new patients with lung
cancer whose trigger to seek advice was the campaign but who only received their
diagnosis after the end of the period chosen for analysis. It is unknown whether
extending the period of analysis would have made any significant impact on the results.
The completeness of data on performance status has, in contrast to that of most other
data items, deteriorated over the latter 2 years of the national campaigns as a result of
changes in how the NLCA database has been operating. It has therefore not been

Be Clear on Cancer: Regional and national lung cancer awareness campaigns 2011 to 2014
54
possible to analyse changes in performance status for the second and third national
campaigns.
3.18 Summary, discussion and conclusions
3.18.1 Overall summary
Whilst the findings have varied both between campaigns and for the different variables
that have been examined, there have been examples of positive changes in most of the
metrics that one would hope for after a series of national initiatives such as these.
There is evidence of what might best be described as a ‘whole system response’. From
public recognition of the messages to increases in attendance at GP practices,
increases in urgent GP referrals for suspected cancer to secondary care, some
evidence of an increased number of cases and more use of diagnostic tests, a shift to
earlier stage disease with better performance status at the time of diagnosis and
increased numbers of patients undergoing surgery. However there was no evidence of
a statistically significant improvement in 1-year survival rates in patients diagnosed
during and immediately after the campaign periods.
All of these metrics have been studied against a background of general improvements
in many of the process and outcome indicators relating to lung cancer in England over
the last 10 to12 years. These are almost certainly a result of a wide variety of changes
in how lung cancer is managed in the English NHS and how it is perceived as a
disease both by the public and healthcare professionals. Some of these changes, in
particular increases in urgent GP referrals for suspected cancer and a fall in emergency
presentation rates, have also been seen in other cancer types. The Be Clear on Cancer
lung campaigns have been one part of this environmental change and ascribing direct
cause and effect is not possible. The overall evaluation of these campaigns presented
in this document suggests that they are likely to have made a significant contribution to
the positive improvements seen in outcomes for lung cancer patients in this country
over recent years.
3.18.2 Changing impact over time
There is evidence from a number of the metrics used in the evaluation that the impact
has diminished to a varying extent over the course of the four campaigns, with almost

Be Clear on Cancer: Regional and national lung cancer awareness campaigns 2011 to 2014
55
universally the greatest effect being detectable after the regional and first national
campaigns. The weight of media coverage in the regional and first national campaigns
was significantly higher, taking account of limited geographical coverage of the regional
campaign, than in the second and third national campaigns, with varying use of
supporting channels, so it is likely that this was a major factor. The four campaigns also
ran for different durations and there was a relatively short interval of no more than a
year between each of them. From a combination of tracking research and modelling,
the campaign was planned to ensure maximum impact for the budget. We know the
rate at which we expect campaign awareness to decay and based on this, the
campaign ran for an extended period to maximise the impact of the campaign and
ensure efficiency of media spend.
3.18.3 Wider impact
There is unequivocal evidence of the positive impact of the campaigns on the level of
knowledge of some lung cancer symptoms in the general population and this has
resulted in many more patients visiting their GPs with cough. Other questions included
in the population based surveys, not reported here, have confirmed important changes
in people’s attitude to cancer in general, specifically: a) there has been an increase in
the proportion of people who agree that early diagnosis of cancer can improve
outcomes and b) a fall in the proportion of people who believe that treatment is worse
than the disease. These changes are illustrated in figure 12, below.

Be Clear on Cancer: Regional and national lung cancer awareness campaigns 2011 to 2014
56
Figure 12. Responses over time to telephone survey questions relating to broader issues of attitudes to cancer (TRNS BRMB)
These general messages form part of the wider range of issues raised in the Be Clear
on Cancer campaigns and intuitively would be expected to lead to the earlier detection
of disease. We have not measured the impact on other serious but benign diseases
such as COPD, asthma, interstitial lung disease and tuberculosis etc, but it is likely that
the people at higher risk of such diseases would also be more likely to visit their GPs as
a result of these campaigns, and thus receive effective treatment earlier than they
might have done otherwise.
We have not formally assessed the impact of the lung cancer campaigns on GP
awareness and attitudes, but there is general anecdotal agreement that GPs have
responded positively, especially as evidenced by the doubled number of urgent GP
referrals for suspected lung cancer over the period of the campaigns. The campaigns
0
20
40
60
Oct-
2011
Jan
-2012
Ap
r-2012
Jul-2
012
Oct-
2012
Jan
-2013
Ap
r-2013
Jul-2
013
Oct-
2013
Jan
-2014
Ap
r-2014
Jul-2
014
Oct-
2014
Jan
-2015
Ap
r-2015
Jul-2
015
Oct-
2015
Jan
-2016
Ap
r-2016
Going to my GP with a symptom of [x] cancer makes no difference to my chances of surviving cancerMost cancer treatment is terrible; it is even worse than death
2n
d n
ational lu
ng c
am
paig
n
1st national blo
od in p
ee c
am
paig
n
1st national bre
ast
cam
paig
n
2n
d n
ational blo
od in p
ee c
am
paig
n
1st national oesophago-g
astr
ic c
am
paig
n
2n
d n
ational bre
ast
cam
paig
n
3rd
national blo
od in p
ee c
am
paig
n
1st national lu
ng c
am
paig
n
2n
d n
ational bow
el cam
paig
n
% s
trongly
dis
agre
e w
ith t
he s
tate
ments

Be Clear on Cancer: Regional and national lung cancer awareness campaigns 2011 to 2014
57
may have given GPs ‘permission’ to refer patients at a lower threshold. The new NICE
guidelines on referral for suspected cancer (NICE, 2015) have been introduced since
the end of these campaigns; they promote a lower threshold for referral but will have
not impacted on referrals over the period of these analyses.
3.18.4 Survival as an endpoint
Improvements in short term survival are a very poor indicator of the real impact of such
interventions since lead time bias (patients who would die anyway but are simply being
diagnosed a little earlier in the course of their otherwise unaltered disease trajectory) is
very likely to play a part. An increase in the numbers of new cases being detected
during and shortly after a campaign, that do not fall back below baseline immediately, is
the hallmark of a really effective intervention; there is no clear evidence that has been
seen in the course of these campaigns. The increase in the rates of active treatment
seen after the regional and first national campaigns, especially the significant increase
in surgical treatment rates, is very encouraging and could result in a longer term
survival benefit. It is a fall in the mortality rate from lung cancer that would be the
ultimate hallmark of success, but it is too soon to expect to be able to detect this. Even
a fall in mortality would, (over the long period that it would take to look for such an
effect) be difficult to attribute directly to one factor such as a programme of public
awareness campaigns. Changes in patterns of clinical practice, service configuration
and the emergence of new treatments could all have (positive) confounding effects. For
example, there has been a slow but continuing fall in smoking rates in recent years, a
factor which would reduce incidence and therefore mortality rates. Another change has
been a dramatic increase in the surgical resection rate in England over the period since
2005, as illustrated by data from the NLCA shown in figure 13. There has also been the
introduction of Stereotactic Radiotherapy, a new modality of potentially curative
treatment applicable to older and less fit patients with limited stage disease, which, in
the Netherlands, has been linked with a fall in population mortality (Palma et al, 2010).

Be Clear on Cancer: Regional and national lung cancer awareness campaigns 2011 to 2014
58
Figure 13. Crude surgical resection rates in England and Wales between 2005 and 2015. Overall = patients with lung cancer of any description; NSCLC = patients with a confirmed diagnosis of Non-Small Cell Carcinoma (source; NLCA)
In addition, over the time period of the regional and first national campaigns there was
a gradual increase in both 1- and 2-year survival in lung cancer patients in England
(figure 14) which is part of a longer term trend (figure 15).
0%
5%
10%
15%
20%
25%
2005 2006 2007 2008 2009 2010 2011 2012 2013 2014 2015
% r
ese
ctio
n
Overall resection rate NSCLC resection rate

Be Clear on Cancer: Regional and national lung cancer awareness campaigns 2011 to 2014
59
Figure 14. 1 and 2 year survival (%) 2011 to 2012 derived from the Cancer Analysis System
Figure 15. Net actual and predicted) 1 and 5 year survival rates for lung cancer in England 1995 to 2013 (adapted from Walters et al., 2015)
0
5
10
15
20
25
30
35
40
Feb-April 2011 May-Jul 2011 Feb-April 2012 May-Jul 2012
% s
urv
iva
l
Period of diagnosis
1yr Male 2yr Male 1yr Female
2 yr Female 1yr Persons 2yr Persons
0%
5%
10%
15%
20%
25%
30%
35%
40%
45%
1995
1996
1997
1998
1999
2000
2001
2002
2003
2004
2005
2006
2007
2008
2009
2010
2011
2012
2013
% n
et su
rviv
al
1 year 5 year (predicted) 5 year
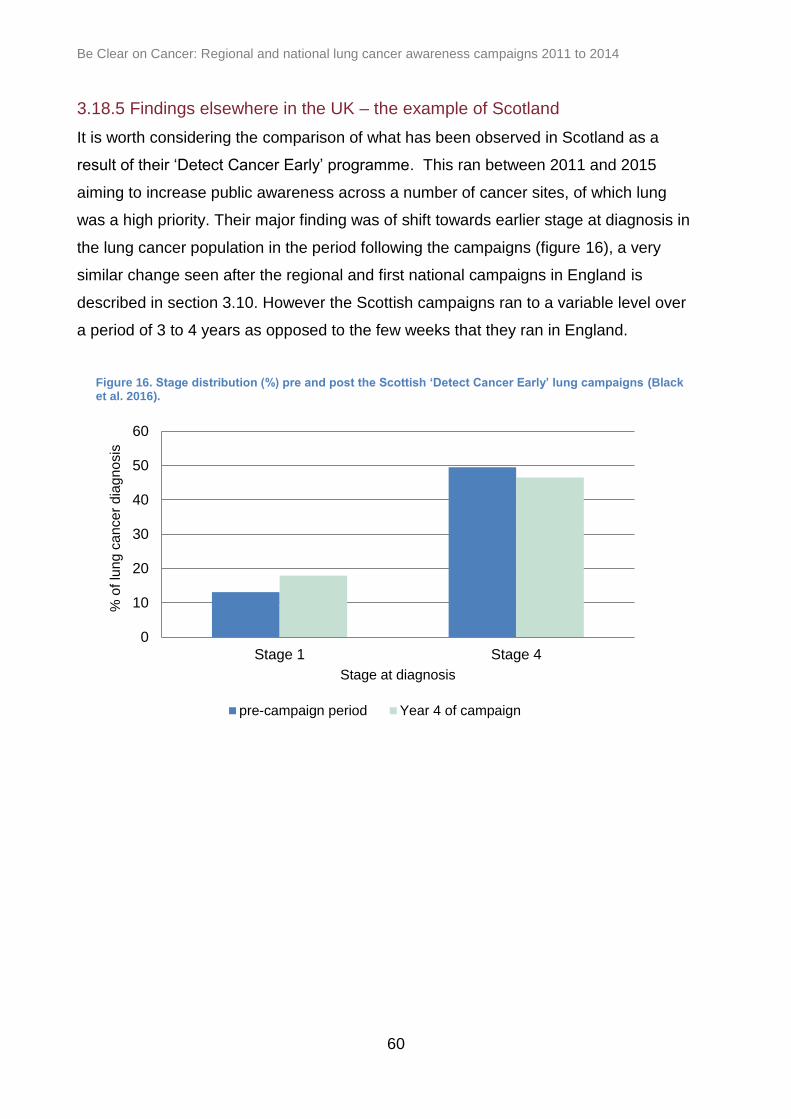
Be Clear on Cancer: Regional and national lung cancer awareness campaigns 2011 to 2014
60
3.18.5 Findings elsewhere in the UK – the example of Scotland
It is worth considering the comparison of what has been observed in Scotland as a
result of their ‘Detect Cancer Early’ programme. This ran between 2011 and 2015
aiming to increase public awareness across a number of cancer sites, of which lung
was a high priority. Their major finding was of shift towards earlier stage at diagnosis in
the lung cancer population in the period following the campaigns (figure 16), a very
similar change seen after the regional and first national campaigns in England is
described in section 3.10. However the Scottish campaigns ran to a variable level over
a period of 3 to 4 years as opposed to the few weeks that they ran in England.
Figure 16. Stage distribution (%) pre and post the Scottish ‘Detect Cancer Early’ lung campaigns (Black et al. 2016).
0
10
20
30
40
50
60
Stage 1 Stage 4
% o
f lu
ng
ca
nce
r d
iag
no
sis
Stage at diagnosis
pre-campaign period Year 4 of campaign

Be Clear on Cancer: Regional and national lung cancer awareness campaigns 2011 to 2014
61
4. References
Abdel-Rahman M, Stockton D, Rachet B, Hakulinen T and Coleman MP. (2009) What if
cancer survival in Britain were the same as in Europe: how many deaths are
avoidable? Brit J Cancer, 101: S115 – S124
Athey VL, Suckling RJ, Tod AM, Walters SJ, Rogers TK. (2012) Early diagnosis of lung
cancer: evaluation of a community-based social marketing intervention. Thorax, 67(5):
412-7
Austoker J, Bankhead C, Forbes LJL, Atkins L, Martin F, Robb K, Wardle J, Ramirez
AJ. (2009) Interventions to promote cancer awareness and early presentation:
systematic review. Br J Cancer, 101: S31–S39.
Black R et al. (2016), Personal communication; Information Services Division, NHS
Scotland
Coleman MP, Forman D, Bryant H, Butler J, Rachet B, Maringe C, Nur U, Tracey E,
Coory M, Hatcher J, McGahan CE, Turner D, Marrett L, Gjerstorff ML, Johannesen TB,
Adolfsson J, Lambe M, Lawrence G, Meechan D, Morris EJ, Middleton R, Steward J,
Richards MA. The ICBP Module 1 Working Group (2011) Cancer survival in Australia,
Canada, Denmark, Norway, Sweden, and the UK, 1995-2007 (the International Cancer
Benchmarking Partnership): an analysis of population-based cancer registry data.
Lancet, 377(9760): 127–138.
Department of Health: Improving Outcomes: A Strategy for Cancer, London, January
2011
Elliss-Brookes L, McPhail S, Ives A, Greenslade M, Shelton J, Hiom S and Richards M.
(2012) Routes to diagnosis for cancer – determining the patient journey using multiple
routine data sets. Brit J Cancer, 107: 1220–1226

Be Clear on Cancer: Regional and national lung cancer awareness campaigns 2011 to 2014
62
Francisci S, Minicozzi P, Pierannunzio D, Ardanaz E, Eberle A, Grimsrud TK, Knijn A,
Pastorino U, Salmerón D, Trama A, Sant M and the EUROCARE-5 Working Group.
(2015). Survival patterns in lung and pleural cancer in Europe 1999–2007: Results
from the EUROCARE-5 study. European Journal of Cancer; 51(15): 2242–2253
Goldstraw P, Chansky K, Crowley J, et al. (2015) The IASLC Lung Cancer Staging
Project: Proposals for the revision of the TNM stage groupings in the forthcoming
(Eighth) Edition of the TNM Classification for Lung Cancer. J Thorac Oncol, 11:39-51.
Hamilton W, Peters TJ, Round A, Sharp D. (2005) What are the clinical features of a
lung cancer before diagnosis is made? A population-based case-control study. Thorax,
60:1059–65.
Hinde S, McKenna C, Whyte S, Peake MD, Callister MEJ, Rogers T and Sculpher M.
(2015) Modelling the cost-effectiveness of public awareness campaigns for the early
detection of non-small-cell lung cancer. Br J Cancer, 113:135–141
Holmberg L, Sandin F, Bray F, Richards M, Spicer J, Lambe M, Kint A, Peake M,
Strand, T-E, Linklater K, Robinson D & Møller H. (2010) National comparisons of lung
cancer survival in England, Norway and Sweden 2001- 2004: differences occur early in
follow-up. Thorax, 65: 436-441.
Imperatori A, Harrison RN, Leitch DN, et al. (2006) Lung cancer in Teesside (UK) and
Varese (Italy): a comparison of management and survival. Thorax, 61:232–239.
Imperatori A, Harrison RN, Dominioni L, Leitch N, Nardecchia E, Jeebun V, Brown
J, Altieri E, Castiglioni M, Cattoni M and Rotolo N. (2016) Resection rate of lung cancer
in Teesside (UK) and Varese (Italy): a comparison after implementation of the National
Cancer Plan. Thorax, 71(3): 230-7.
Ironmonger L, Ohuma E, Ormiston-Smith N, Gildea C, Thomson CS, Peake MD. (2015)
An evaluation of the impact of large scale interventions to raise public awareness of a
lung cancer symptom. Br J Cancer, 112: 207–216.

Be Clear on Cancer: Regional and national lung cancer awareness campaigns 2011 to 2014
63
McPhail S, Johnson S, Greenberg D, Peake M, Rous B. (2015) Stage at diagnosis and
early mortality from cancer in England.Br J Cancer; 112: S108-115.
Mayden. (2014)
Moffat J, Bentley A, Ironmonger L, Boughey A, Radford G and Duffy S. (2015).The
impact of national cancer awareness campaigns for bowel and lung cancer symptoms
on sociodemographic inequalities in immediate key symptom awareness and GP
attendances. Br J Cancer; 112: S14–S21
Mountain CF. (1986) A New International Staging System for Lung Cancer. Chest, 89
(4 Suppl): 225S-233S
NCRAS. (2016) National trends in Cancer Waiting Times metrics, 2009/10 - 2014/15.
Palma D, Visser O, Lagerwaard FJ, et al (2010) Impact of introducing stereotactic lung
radiotherapy for elderly patients with stage I non-small-cell lung cancer: a population-
based time-trend analysis. J Clin Oncol, 10; 28(35):5153-9
National Cancer Intelligence Network (2014) Cancer by Deprivation in England:
Incidence, 1996-2010, Mortality, 1997-2011. Public Health England.
National Institute for Health and Care Excellence (NICE). (2005) Referral Guidelines for
suspected cancer.
Office for National Statistics. (2017) Cancer Registration Statistics.
Parkin DM. Tobacco-attributable cancer burden in the UK in 2010. (2011). Brit J
Cancer, 105: S6 – S13
Royal College of Physicians. (2015) National Lung Cancer Audit, Annual Report for
2015 (last accessed 23.1.17).

Be Clear on Cancer: Regional and national lung cancer awareness campaigns 2011 to 2014
64
Shim J, Brindle L, Simon, M and George S. (2014) A systematic review of symptomatic
diagnosis of lung cancer. Family Practice 31(2): 137-148.
Simon AE, Juszczyk D, Smyth N, Power E, Hiom S, Peake MD, Wardle J. (2012)
Knowledge of lung cancer symptoms and risk factors in the UK: development of a
measure and results from a population-based survey. Thorax, 67: 426–432.
Smith SM, Campbell NC, MacLeod U, Lee AJ, Raja A, Wyke S, Ziebland SB, Duff EM,
Ritchie LD, Nicolson MC. (2009) Factors contributing to the time taken to consult with
symptoms of lung cancer: a cross-sectional study. Thorax, 64: 523-531.
Sobin LH, Gospodarowicz MK, Wittekind C. (2009) TNM classification of malignant
tumours, 7th edition. Oxford: Union for International Cancer Control, Wiley-Blackwell.
Stubbings S, Robb K, Waller J, Ramirez A, Austoker J, Macleod U, Hiom S, Wardle J.
(2009) Development of a measurement tool to assess public awareness of cancer. Br J
Cancer, 101: S13-S17
TNS BMRB (2014)
Tudor Hart J. (1971). The inverse care law. Lancet, 297(7696): 405
Walters S, Benitez-Majano S, Muller P, Coleman MP, Allemani C, Butler J, Peake M,
Grønlie Guren M, Glimelius B Bergström S, Påhlman L and Rachet B. (2015) Is
England closing the international gap in cancer survival? Brit J Cancer, 113(5): 848-60

Be Clear on Cancer: Regional and national lung cancer awareness campaigns 2011 to 2014
65
5. Appendices 1 – additional details of
methods and results
5.1 Marketing evaluation – methods
For the regional and first national campaigns, pre- and post-campaign random location
quota surveys were undertaken by TNS BMRB, an independent market research
agency specialising in social research (TNS BMRB, 2014), to evaluate the impact of the
campaign on measures including public awareness of symptoms of lung cancer for
those aged 55 and over. Although the target age group of the whole campaign was 50
and over, data for the surveys were only collected for the population aged 55 and over
to match the media buying (the TV adverts were shown at times and on channels most
watched by those aged over 55 years, as that was the age group closest to the target
group). The surveys were informed by the general Cancer Awareness Measure
(Stubbings et al, 2009) and the lung-specific version (Simon et al, 2012). Questions
were added to the in-home, face-to-face omnibus survey which is carried out across
England, with ad-hoc face-to-face fieldwork in the Central England pilot area. The
survey took approximately 15 to 20 minutes. TNS BMRB also carried out surveys to
assess GPs’ views on numbers of patients presenting with symptoms of lung cancer,
numbers of suspected lung cancer referrals made, and GPs’ views on the campaign’s
communications.
Pre-regional campaign interviews took place between 12 September and 9 October
2011, and post-campaign interviews between 14 November and 11 December 2011.
Just over 500 interviews were carried out in the pilot region ( 571 pre-campaign and
536 post campaign) and around 450 interviews were available for the rest-of-England
control (452 pre-campaign and 451 post-campaign). Further details surrounding the
sampling methods can be found in the Supplementary Materials and Methods of the
paper by Ironmonger et al (2015).

Be Clear on Cancer: Regional and national lung cancer awareness campaigns 2011 to 2014
66
For the second national campaign, as previously, a representative sample of adults in
England were surveyed and approximately 1,570 people aged 50 and over were
interviewed at both pre- and post-campaign stages.
Results of the national campaign awareness surveys include embedded regional
results, which can be considered as an assessment of the longer-term impact on
awareness (around six and eight months after the regional campaign), compared with
the weeks immediately following the regional campaign (as assessed by the post-
campaign survey).
There was no marketing evaluation of the third national campaign which ran for 8
weeks between 10 March 2014 and 30 April 2014.
5.2 Public awareness – demographics of respondents
The demographics of the survey respondent were similar across all campaigns, a
typical example from the regional campaign being shown in figure 4 below.
Table 4. Survey respondent demographics pre- and post-regional campaign for pilot and control areas
Control Pilot
Pre-campaign Post-campaign Pre-campaign Post-campaign
Gender Male 46% 46% 46% 46%
Female 54% 54% 54% 54%
Age in years
55 - 64 42% 41% 42% 42%
65 - 74 31% 33% 32% 31%
75 - 84 21% 22% 23% 22%
85+ 7% 5% 4% 6%
Socio-demographic
group
ABC1 40% 39% 43% 42%
C2DE 60% 61% 57% 58%

Be Clear on Cancer: Regional and national lung cancer awareness campaigns 2011 to 2014
67
5.3 Detailed results of public awareness
When survey participants were asked to name as many symptoms of lung cancer as
possible (‘spontaneous awareness’), the proportion mentioning a cough increased from
54% pre-campaign to 65% post-campaign (p<0.001), with specific mentions of a
persistent or prolonged cough increasing from 12% to 15% (p=0.048). Details of pre-
and post-campaign results for the first national campaign are shown in Table 5. When
shown a list of lung cancer symptoms and asked how much of a lung cancer warning
sign each was (’prompted awareness’), a cough for three or more weeks was the
symptom with the largest increase in recognition, rising from 18% pre-campaign to 33%
after (p<0.001). Additionally, post-campaign awareness was higher amongst
participants recognising at least one campaign advertisement than those saying they
did not recognise any. For example, spontaneous awareness of cough was 69% for
those who recognised the campaign compared with 48% for those who didn’t
(p<0.001).

Be Clear on Cancer: Regional and national lung cancer awareness campaigns 2011 to 2014
68
Table 5. First national campaign: public awareness pre- and post-campaign survey results (Table 1, Ironmonger et al, 2015)
*Statistically significant difference between pre- and post-campaign surveys (two-sample test of proportions; p<0.05) **Statistically significant difference between those recognising any campaign advertisement to those not recognising one (two-sample test of proportions; p<0.05)
Survey question Pre N (%) Post N (%) p-value Non-recognisers Campaign
recognisers p-value
Weight base 1153 1121 - 235 886 -
There are many signs and symptoms of lung
cancer. Please name as many as you are aware
of (Spontaneous awareness)
Cough/ 478 (41%) 560 (50%)* <0.001 92 (39%) 468 (53%)** <0.001
hoarseness
Persistent/ 140 (12%) 168 (15%)* 0.048 21 (9%) 147 (17%)** 0.004
prolonged cough
TOTAL cough 618 (54%) 728 (65%)* <0.001 113 (48%) 615 (69%)** <0.001
Shortness of breath
239 (21%) 223 (20%) 0.621 39 (17%) 184 (21%) 0.154
Coughing up blood
224 (19%) 179 (16%)* 0.031 25 (11%) 154 (17%)** 0.012
Chest pain
97 (8%) 77 (7%) 0.166 12 (5%) 65 (7%) 0.23
Weight loss
95 (8%) 100 (9%) 0.562 11 (5%) 89 (10%)** 0.01
How confident are you that you know the signs and symptoms of lung cancer? (Those ‘very confident’ or ‘fairly
confident’) 514 (45%) 571 (51%)* 0.002 91(39%) 480 (54%)** <0.001
I’m going to list some symptoms that may or
may not be warning signs for lung cancer. For each one can you tell me the
extent to which you think it is a warning sign for
lung cancer (those saying definitely a
warning sign) (Prompted awareness)
A cough for three weeks or more that doesn’t go away
206 (18%) 373 (33%)* <0.001 45 (19%) 328 (37%)** <0.001
Breathlessness
256 (22%) 278 (25%) 0.144 45 (19%) 233 (26%)** 0.024
Coughing up blood
619 (54%) 637 (57%) 0.132 109 (46%) 529 (60%)** <0.001
A persistent pain in your chest or shoulder
147 (13%) 155 (14%) 0.449 21 (9%) 134 (15%)** 0.015
Losing weight for no obvious reason
264 (23%) 315 (28%)* 0.004 45 (19%) 270 (30%)** <0.001
A cough which has got worse or changes
231 (20%) 332 (30%)* <0.001 46 (20%) 286 (32%)** <0.001

Be Clear on Cancer: Regional and national lung cancer awareness campaigns 2011 to 2014
69
Similar trends were seen in the pilot area following the regional campaign (results available in
Supplementary Table S1, Ironmonger et al, 2015), for instance, prompted awareness of a
cough lasting for three or more weeks increased from 19% to 34% (p<0.001). For comparison,
any changes in the control area were generally not significant. In the first national campaign’s
pre-campaign survey, prompted awareness of a cough for three or more weeks had decreased
for those in the pilot region since the post-regional campaign survey, but remained higher than
for those in the control area (25% compared with 16%; p=0.002). Post campaign, prompted
awareness was similar for the national campaign in both areas (33% vs. 34%), and was also
similar to post-campaign awareness in the regional area following the regional campaign
(34%).
With the potential for the campaign’s focus on one symptom to falsely reassure the public that
other symptoms are not a sign of lung cancer, the impact on awareness of other lung cancer
symptoms was also assessed. After the national campaign there was a small but significant
decrease in the proportion spontaneously mentioning ‘coughing up blood’ as a symptom of lung
cancer (from 19% to 16%; p=0.031), although there was no decrease in the proportion saying
coughing up blood was definitely a warning sign (prompted awareness). Neither spontaneous
nor prompted awareness for other lung cancer symptoms mentioned in the survey decreased
after the national campaign (table 5). Following the regional campaign, in the pilot area there
was a significant fall in spontaneous mentions of chest pain (from 13% to 9%; p=0.026), yet
there was an increase in prompted awareness (from 12% to 17% p=0.026).
5.4 Attendances at GP practices - regional and first national campaigns
Healthcare IT specialists Mayden (2014) extracted data from a sample of 486 GP practices and
used Read codes to demonstrate the numbers of patients presenting to GP practices with
symptoms directly linked to the first national campaign (eg a cough) and selected control
symptoms each week after the first national campaign between March 2010 and May 2013.
The precise list of Read codes was determined with the support of primary care colleagues
from DH Policy Research Unit and a wide range of other clinicians (see table 37). Numbers of
visits in patients aged 50 years or more over the eight weeks around the campaign were
compared with the same weeks in the previous year. More people with a cough went to see
their GP following the campaign launch (table 6).

Be Clear on Cancer: Regional and national lung cancer awareness campaigns 2011 to 2014
70
Table 6. First national campaign: presentations per GP practice per week for patients aged 50+, data from 486 practices. (Table 2 from Ironmonger et al, 2015)
Symptoms Eight week
period
Presentations per practice per week
(adjusted1)
Change (2012
vs 2011)
% change (2012 vs
2011)
p-value
2011 2012
Key campaign symptom (cough)
Control 6.2 6.5 0.3 +5%* <0.001
Campaign 4.8 7.8 3 +63%* <0.001
Post-campaign
4.1 5.9 1.9 +46%* <0.001
Urinary Tract Infection Control 1.1 1.1 0 2% 0.386
Campaign 1.1 1.2 0.1 +5%* 0.016
Neck pain Control 0.8 0.8 0 -4% 0.142
Campaign 0.9 0.9 0 0% 0.963
Shoulder pain Control 1.9 1.9 0 -1% 0.604
Campaign 1.9 1.9 0 1% 0.681
Knee pain Control 2.5 2.5 0 1% 0.436
Campaign 2.8 2.8 0.1 3% 0.060 1Adjusted for a five day working week excluding bank holidays (eg includes Easter, Early May, Spring bank
holidays and Queen’s Diamond Jubilee bank holiday for 2012)
*Statistically significant difference between 2011 and 2012 (likelihood ratio test of significance p<0.05)
Presentations of patients aged 50+ with a cough increased by 63% for the eight weeks around
the campaign compared with the same weeks in 2011 (adjusting for working days; p<0.001).
This is equivalent to around three additional visits per practice per week (based on practices in
the sample which had an average list size of around 7,800 patients), whilst the England
average was around 6,800 visits for 2011/12 (HSCIC, 2012). For comparison: for those aged
50+ the largest increase in presentations for the control symptoms was 5% for urinary tract
Infections (p=0.016); and just 5% more people presented with a cough during the eight pre-
campaign control weeks in 2012 compared with those weeks in 2011 (p<0.001). This suggests
the increase following the campaign launch was over and above a small year on year increase
in presentations.
The increase in attendances was not confined to those over 50. Across all ages, there was a
67% increase in patients with a cough visiting their GP, equivalent to six additional visits per
practice per week (data not included in report). The age group with the highest actual increase

Be Clear on Cancer: Regional and national lung cancer awareness campaigns 2011 to 2014
71
in presentations during the campaign weeks was 60 to 69 year olds and the largest percentage
increase was in 50 to 59 year olds (table 7).
Table 7. First national campaign: number of GP presentations for cough (unadjusted) for the eight weeks of the campaign by age group, data from 486 practices (Table S4 from Ironmonger et al, 2015)
Age group
Number of GP presentations
Change % Change p-value (% of all ages)
2011 2012
0-9 6,389 (18.1%) 9,906 (17.3%) 3,517 +55.0%* <0.001
10-19 2,366 (6.7%) 4,025 (7.0%) 1,659 +70.1%* <0.001
20-29 1,883 (5.3%) 3,317 (5.8%) 1,434 +76.2%* <0.001
30-39 2,447 (6.9%) 4,213 (7.4%) 1,766 +72.2%* <0.001
40-49 3,648 (10.4%) 6,332 (11.1%) 2,684 +73.6%* <0.001
50-59 4,091 (11.6%) 7,478 (13.1%) 3,387 +82.8%* <0.001
60-69 5,632 (16.0%) 9,260 (16.2%) 3,628 +64.4%* <0.001
70-79 5,025 (14.3%) 7,467 (13.1%) 2,442 +48.6%* <0.001
80+ 3,742 (10.6%) 5,155 (9.0%) 1,413 +37.8%* <0.001
Total aged 50+ 18,490 (52.5%) 29,360 (51.4%) 10,870 +58.8%* <0.001
Total all ages 35,223 (100%) 57,153 (100%) 21,930 +62.3%* <0.001
*Statistically significant difference between 2011 and 2012 (likelihood ratio test of significance p<0.05)
The increase in presentations appeared to continue for at least eight weeks after the campaign
ended (figure 17). For the eight weeks post-campaign, there were 46% more presentations in
those aged 50 and over compared with the same period in 2011 (p<0.001).

Be Clear on Cancer: Regional and national lung cancer awareness campaigns 2011 to 2014
72
Figure 17. First national campaign: number of GP presentations for a cough per week adjusted for bank holidays, patients aged 50+, data from 486 practices January 2010 to May 2013. (Figure S1 from Ironmonger et al 2015)
During the regional campaign (results available in Supplementary table S5, in Ironmonger et al,
2015), there was a smaller, 22% increase in presentations for a cough amongst those aged 50
and over in the pilot area compared with the same time in the previous year (p<0.001). Data
was not collected for the control area.
No data was available to assess attendances to GP practices for the second and third national
campaigns.
5.5 Urgent GP referrals for suspected lung cancer – CWT data
5.5.1 The CWT dataset
The CWT Monitoring Dataset managed by NHS England provides the information on which an
assessment of the impact of the campaigns on GP referral behaviour and outcomes can be
measured. The analyses of the CWT data in this report considers five metrics:
Urgent GP referrals for suspected lung cancer
Urgent GP referrals for suspected lung cancer, presented by month first seen. Also known as
two week wait (TWW) referrals.
0
2
4
6
8
10
12
14
1 3 5 7 9 11 13 15 17 19 21 23 25 27 29 31 33 35 37 39 41 43 45 47 49 51
Att
end
en
ces p
er
pra
ctice
per
we
ek
Week number
2010 2011 2012 2013
1st n
atio
na
l lu
ng
ca
mp
aig
n

Be Clear on Cancer: Regional and national lung cancer awareness campaigns 2011 to 2014
73
Cancer diagnoses resulting from an urgent GP referral for suspected lung cancer
Those lung cancer diagnoses (ICD10 C33-C34, C37-C39, C45) resulting from an urgent GP
referral for suspected lung cancer, presented by month first seen. Also known as two week wait
(TWW) cancers, or 62 day cancers, based on the waiting times target from urgent GP referral to
first treatment.
Conversion rate
Percentage of urgent GP referrals for suspected lung cancer resulting in a diagnosis of lung
cancer, presented by month first seen.
Lung cancer diagnoses recorded in the CWT dataset
All lung cancer diagnoses recorded in the CWT dataset, presented by month of first treatment.
Also known as CWT cancers, or 31 day cancers, based on the waiting times target from
decision to treat to first treatment.
Detection Rate
Percentage of CWT dataset recorded lung cancer diagnoses which resulted from an urgent GP
referral for suspected lung cancer, presented by month of first treatment.
5.5.2 Defining the campaign and comparison periods
We might expect campaigns to have an impact on referrals first seen during the campaign
months and, allowing for reasonable intervals from campaign activity to referral, in the month
following the end of the campaign. These intervals may occur for several reasons, for example
some patients may only react after having seen the campaign materials multiple times, some
are eventually prompted to act by family and friends, some patients may need to wait for a GP
appointment, especially if they prefer a convenient time or a specific GP, and so may be seen
by the GP after the campaign ended. Some patients may be partially investigated in primary
care before being referred, so the real impact of the campaign cannot be timed precisely.
Dates are based on ‘date first seen’ as recorded in the CWT dataset, reflecting the date seen in
secondary care rather than primary care, and referrals made towards the end of the campaign
may not have been seen in secondary care until after the campaign ended.
Be Clear on Cancer: Regional and national lung cancer awareness campaigns 2011 to 2014
74
Therefore the campaign period for referrals has, in this analysis, been considered to be the
months of the campaign plus the following month. The same months are considered to be the
campaign period for cancer diagnoses resulting from an urgent GP referral for suspected
cancer and for the conversion rate, as these are defined using the date first seen recorded for
the referral. This period was chosen by NCRAS analysts whilst different periods were used by
Mayden in their assessment of GP attendance elsewhere in the report.
Similarly, there is a necessary period of time between the date first seen following an urgent GP
referral for suspected cancer and the start of treatment. This is because of the time required to
perform diagnostic tests, to establish the stage of disease and/or to plan and arrange treatment.
This interval will vary for different patients and trusts. This means that, for cancer diagnoses
recorded in the CWT dataset and the detection rate, it is not possible to identify a clear period
relating directly and specifically to the campaign. Diagnoses in the early campaign months could
include those resulting from referrals prior to the campaign or at the beginning of the campaign.
Similarly, diagnoses in the months after the campaign could include those resulting from
referrals during the campaign or after the end of the campaign. Taking into consideration the
average interval from date first seen to treatment start date, and the waiting times target of 62
days from urgent GP referral to first treatment, the campaign effect on all CWT recorded
cancers and detection rate has been thought to be best represented by the period one month
later than campaign period for referrals. This period should include many of the diagnoses
resulting from campaign period referrals without too many diagnoses from pre- or post-
campaign referrals.
For the first and third national lung cancer campaigns, comparisons are made to the respective
numbers or rates for the same campaign period months one year earlier. However, for the
second national campaign, the results are compared to those for the same period two years
previously, since the first national campaign took place at a similar time in the year and may
have affected the number of referrals. This comparator is not ideal, considering the background
trend for increasing referrals over this time period.
The specific campaign and comparison periods used, for each of the three campaigns and the
five metrics, are detailed in the following sections.

Be Clear on Cancer: Regional and national lung cancer awareness campaigns 2011 to 2014
75
5.5.3 Comparator referral types
The number of urgent GP referrals for suspected cancer has continued to increase year-on-year
(NCRAS, 2016) (see table 8 below). This means that the evaluation’s comparison of the change
over a 1 (or 2) year period is likely to reflect a combination of a campaign’s impact and the
general increase in referrals. It is not possible to separate results for these two causes of the
increase, but it is useful to consider the increases in urgent GP referrals for suspected lung
cancer alongside increases in urgent GP referrals for other suspected cancers in order to
provide an indication of increase that was not associated with the campaign.
For the first and second national lung cancer campaigns, comparison is therefore made to all
urgent GP referrals for suspected cancer excluding referrals for suspected lung and lower
gastro-intestinal (GI) cancers. For the third national campaign in 2014, the comparison is made
to urgent GP referrals for suspected head and neck cancers only. The reason for this choice of
comparator is that the majority of other referral types may have been affected by other Be Clear
on Cancer awareness campaigns run, locally, nationally or regionally, between 2012 and 2014.
5.5.4 Statistical results and methods
The numbers of urgent GP referrals for suspected cancer are presented for the campaign
period and the comparison period. Percentage change figures, between the comparison and
campaign periods, are calculated based on these referral counts, as this reflects the absolute
change in levels of activity.
A referral rate is also presented, in order to provide some context to explain how differences in
the percentage change between areas (or ages) may relate to differing referral patterns.
Differences in referral rates would suggest there may be underlying differences in referral
practices or cancer incidence between groups. It was not possible to assess whether any
apparent campaign impact may have resulted from these underlying differences. Urgent GP
referral rates vary greatly with age, so to take account of differing age profiles of patients in
different areas, the rates presented are directly age-standardised and presented as rates per
100,000 population using the 2013 European Standard Population weights. Age-specific crude
referral rates are presented for the age breakdown.
Data for cancer diagnoses resulting from an urgent GP referral for suspected cancer (TWW
cancers) and all cancers recorded in the CWT dataset (CWT cancers) are presented for the

Be Clear on Cancer: Regional and national lung cancer awareness campaigns 2011 to 2014
76
campaign period and the comparison period, alongside figures for the percentage change
figures between the comparison and campaign periods.
Data for the conversion rate and the detection rate are presented for the campaign period and
the comparison period, alongside results for the percentage point change in the rate between
the comparison and campaign period.
For referrals and cancer diagnoses within this section, data has not been adjusted for the
number of working days. For these numbers, the reported p-values were obtained from a
likelihood ratio test. The null hypothesis was that the number of urgent GP referrals or cancer
diagnoses in the campaign period and the comparison period came from the same Poisson
distribution.
For conversion and detection rates, the reported p-values are obtained from a two-sample
proportion test. The null hypothesis was that the rate in the campaign period was equal to the
equivalent rate in the comparison period.
P-values less than 0.05 indicate a statistically significant difference between the two periods, at
the 95% level. These analyses produce results from a large number of statistical tests, so as
with all multiple comparisons some caution needs to be adopted when considering these. Put
simply, with a considered significance level of 95%, you could expect 5% of tests to provide a
statistically significant result by chance alone.
Monthly diagnoses, conversion rate and detection rate data can be quite variable because they
are based on only a small number of cancer diagnoses, particularly for some of the smaller
breakdowns. Data on the number of urgent GP referrals or cancers diagnosed provided in this
section have not been adjusted for the number of working days.
5.5.5 Urgent GP referrals for suspected cancer
For several years, there has been a large upward trend in the number of urgent GP referrals for
suspected cancer, both for suspected lung cancer and for other suspected cancers (figures 18
and 19). For the first national campaign, there was a 32% increase in urgent GP referrals for
suspected lung cancer, when comparing the period May to July 2011 with May to July 2012
(table 8). In comparison, there was an increase of 12% in urgent GP referrals for all other

Be Clear on Cancer: Regional and national lung cancer awareness campaigns 2011 to 2014
77
suspected cancers (excluding lung and lower GI cancers), reflecting the general increasing
trend.
For the second national campaign, there was a smaller increase in urgent GP referrals for
suspected lung cancer relative to the general increasing trend. Over the 2 year period,
comparing July to September 2011 with July to September 2013, there was a 30% increase in
referrals for suspected lung cancer compared with a 26% increase in referrals for all suspected
cancers excluding lung cancer and lower GI cancer.
When comparing the period March to May 2014 with the same months in the previous year,
evaluating the third national campaign, there was a statistically significant 8% increase in the
number of urgent GP referrals for suspected lung cancer for England. This appears lower than
the general increasing trend in urgent GP referrals for suspected cancer, with a higher, 15%
increase, seen for urgent GP referrals for suspected head and neck cancers. However, figure
18 suggests there may have been a small impact of the third campaign, with a slight peak in
referrals, appearing above the general trend, in April 2014.
Table 8. For three national lung cancer campaigns, the number of urgent GP referrals for suspected lung cancer and for comparator referrals, with referral rate and percentage change in number of referrals, England
Campaign
Comparison and
campaign periods
Ref. type
Comparison period Campaign period % Change
in Number
p-value Number
Ref. Rate
LCL UCL Number Ref. Rate
LCL UCL
First national
Comparison: May to July
2011 Campaign: May to July
2012
Lung 10,504 62.2 61.0 63.5 13,849 83.7 82.3 85.2 31.8 <0.001
Other1 219,109 1449.9 1443.6 1456.2 244,464 1616.7 1610.1 1623.3 11.6 <0.001
Second national
Comparison: July to
September 2011
Campaign: July to
September 2013
Lung 9,948 56.8 55.7 58.0 12,887 74.8 73.5 76.2 29.5 <0.001
Other1 220,249 1405.0 1399.0 1411.1 276,639 1776.4 1769.6 1783.2 25.6 <0.001
Third national
Comparison: March to May
2013 Campaign:
March to May 2014
Lung 13,350 120.6 118.5 122.7 14,398 132.2 130.0 134.4 7.9 <0.001
Head & neck
30,336 257.2 254.3 260.2 34,776 300.4 297.2 303.6 14.6 <0.001
Referral rate (ref. rate) is age standardised, per 100,000
1 Urgent GP referrals for all suspected cancer is excluding lung and lower GI cancers

Be Clear on Cancer: Regional and national lung cancer awareness campaigns 2011 to 2014
78
Figure 18. Number of urgent GP referrals for suspected lung cancer, January 2011 to May 2014, England
Figure 19. Number of urgent GP referrals for other suspected cancers (all suspected cancers excluding lung and lower GI cancers) and for suspected head and neck cancers, January 2011 to May 2014, England
At least partially reflecting the long-term increasing trend (figure 20), for all three lung cancer
awareness campaigns there were statistically significant increases in the number of referrals for
suspected lung cancer for all age-groups (table 9). There were increases in the number of
1st n
atio
na
l lu
ng
ca
mp
aig
n
2n
d n
atio
na
l lu
ng
ca
mp
aig
n
3rd
na
tion
al lu
ng
ca
mp
aig
n
0
1,000
2,000
3,000
4,000
5,000
6,000
Re
ferr
als
for
susp
ecte
d lu
ng
can
cer
Ja
n-2
011
Mar-
201
1
May-2
011
Ju
l-2
01
1
Sep
-201
1
No
v-2
01
1
Ja
n-2
012
Mar-
201
2
May-2
012
Ju
l-2
01
2
Sep
-201
2
No
v-2
01
2
Ja
n-2
013
Mar-
201
3
May-2
013
Ju
l-2
01
3
Sep
-201
3
No
v-2
01
3
Ja
n-2
014
Mar-
201
4
May-2
014
Month first seen
Data source: National Cancer Waiting Times Monitoring Dataset, NHS England. Analysed by: NCRAS
1st
na
tio
na
l lu
ng
ca
mp
aig
n
2n
d n
atio
na
l lu
ng
ca
mp
aig
n
3rd
na
tio
na
l lu
ng
cam
pa
ign
0
3000
6000
9000
12000
15000
Susp
ecte
d h
ea
d a
nd
ne
ck c
an
cer
refe
rra
ls
0
10,000
20,000
30,000
40,000
50,000
60,000
70,000
80,000
90,000
100,000
Oth
er
susp
ecte
d c
ance
r re
ferr
als
Ja
n-2
011
Mar-
201
1
May-2
011
Ju
l-2
01
1
Sep
-201
1
No
v-2
01
1
Ja
n-2
012
Mar-
201
2
May-2
012
Ju
l-2
01
2
Sep
-201
2
No
v-2
01
2
Ja
n-2
013
Mar-
201
3
May-2
013
Ju
l-2
01
3
Sep
-201
3
No
v-2
01
3
Ja
n-2
014
Mar-
201
4
May-2
014
Month first seen
Other suspected cancer referrals Suspected head and neck cancer referrals
Data source: National Cancer Waiting Times Monitoring Dataset, NHS England. Analysed by: NCRAS

Be Clear on Cancer: Regional and national lung cancer awareness campaigns 2011 to 2014
79
urgent GP referrals for suspected lung cancer following the first national campaign for all ages.
The increase in referrals noted nationally during April 2014, following the third national lung
cancer awareness campaign, was largest for those aged in their 60s and 70s.
For all three campaigns, the largest increases in the number of referrals were seen for those
aged under 50 (50% increase over one year to the period May to July 2012, 41% increase over
two years to the period July to September 2013 and 13% increase over one year to the period
March to May 2014), and those aged 50 to 59 (45%, 42% and 8% respectively). Increases for
the other age-groups were more similar to the all-age England increases, although slightly
lower. However, despite the larger increases, the referral rate remains considerably lower for
those aged under 50 and aged 50 to 59 than for the older age-groups.
Figure 20. Number of urgent GP referrals for suspected lung cancer, January 2011 to May 2014, by age
1st
na
tio
na
l lu
ng
ca
mpa
ign
2n
d n
atio
na
l lu
ng
ca
mp
aig
n
3rd
na
tio
na
l lu
ng
cam
pa
ign
0
200
400
600
800
1,000
1,200
1,400
1,600
Re
ferr
als
for
susp
ecte
d lu
ng
can
cer
Ja
n-2
011
Mar-
201
1
May-2
011
Ju
l-2
01
1
Sep
-201
1
No
v-2
01
1
Ja
n-2
012
Mar-
201
2
May-2
012
Ju
l-2
01
2
Sep
-201
2
No
v-2
01
2
Ja
n-2
013
Mar-
201
3
May-2
013
Ju
l-2
01
3
Sep
-201
3
No
v-2
01
3
Ja
n-2
014
Mar-
201
4
May-2
014
Month first seen
<50 50-59 60-69 70-79 80+
Data source: National Cancer Waiting Times Monitoring Dataset, NHS England. Analysed by: NCRAS

Be Clear on Cancer: Regional and national lung cancer awareness campaigns 2011 to 2014
80
Table 9. For three national lung cancer awareness campaigns, number of urgent GP referrals for suspected lung cancer, with referral rate and percentage change in number of referrals, by age
Campaign
Comparison and
campaign periods
Age group
Comparison period Campaign period % Change
in Number
p-value Number
Ref. Rate
LCL UCL Number Ref. Rate
LCL UCL
First national
Comparison: May to July
2011 Campaign: May to July
2012
<50 914 10.6 10.0 11.4 1,368 16.0 15.2 16.9 49.5 <0.001
50-59 1,481 94.0 89.3 98.9 2,140 136.3 130.6 142.2 44.6 <0.001
60-69 2,926 209.1 201.6 216.8 3,842 275.7 267.0 284.5 31.3 <0.001
70-79 3,180 340.5 328.8 352.6 4,013 431.4 418.2 445.0 26.2 <0.001
80+ 2,003 325.6 311.5 340.2 2,486 405.7 389.9 422.0 24.1 <0.001
Second national
Comparison: July to
September 2011
Campaign: July to
September 2013
<50 850 9.6 9.0 10.3 1,197 13.6 12.9 14.4 40.8 <0.001
50-59 1,309 80.5 76.2 85.0 1,858 115.2 110.0 120.5 41.9 <0.001
60-69 2,790 193.3 186.2 200.6 3,492 243.8 235.8 252.0 25.2 <0.001
70-79 3,046 316.1 305.0 327.6 3,886 406.5 393.8 419.5 27.6 <0.001
80+ 1,953 307.7 294.2 321.6 2,454 389.7 374.4 405.4 25.7 <0.001
Third national
Comparison: March to May
2013 Campaign:
March to May 2014
<50 1,373 16.4 15.5 17.3 1,546 18.7 17.8 19.7 12.6 0.001
50-59 2,038 132.5 126.8 138.3 2,204 145.6 139.6 151.8 8.1 0.011
60-69 3,781 276.8 268.0 285.7 4,029 299.7 290.6 309.2 6.6 0.005
70-79 3,813 418.2 405.0 431.7 4,126 459.9 446.0 474.2 8.2 <0.001
80+ 2,345 390.4 374.8 406.5 2,493 421.9 405.5 438.8 6.3 0.033
Referral rate is the age-specific rate, per 100,000
There are long-term increasing trends in the number of urgent GP referrals for suspected lung
cancer for both men and women, but with consistently more referrals for men than for women
(figure 21).
Following all three national lung cancer awareness campaigns, the increases in referrals for
suspected lung cancer were slightly larger for women than for men (table 10). For the first
national campaign, there was an increase of 34% for women, when comparing the period May
to July 2011 with May to July 2012, compared to 30% for men. When comparing the period July
to September 2011 with July to September 2013, for the second national campaign, there was a
35% increase for women compared to 26% for men. When comparing the period March to May
2013 with March to May 2014, for the third campaign, there was a 9% increase for women
compared to 7% for men.

Be Clear on Cancer: Regional and national lung cancer awareness campaigns 2011 to 2014
81
Figure 21. Number of urgent GP referrals for suspected lung cancer, January 2011 to May 2014, by sex
Table 10. For three national lung cancer awareness campaigns, number of urgent GP referrals for suspected lung cancer, with referral rate and percentage change in number of referrals, by sex
Campaign
Comparison and
campaign periods
Sex
Comparison period Campaign period % Change
in Number
P-value Number
Ref. Rate
LCL UCL Number Ref. Rate
LCL UCL
First national
Comparison: May to July
2011 Campaign: May to July
2012
Men 6,045 75.6 73.7 77.6 7,876 100.1 97.9 102.4 30.3 <0.001
Women 4,459 48.8 47.3 50.3 5,973 67.4 65.6 69.2 34.0 <0.001
Second national
Comparison: July to
September 2011
Campaign: July to
September 2013
Men 5,732 69.2 67.4 71.1 7,196 88.1 86.0 90.2 25.5 <0.001
Women 4,216 44.5 43.1 45.9 5,691 61.6 60.0 63.4 35.0 <0.001
Third national
Comparison: Mar-May
2013 Campaign: Mar-May
2014
Men 7,482 144.4 141.1 147.7 7,993 156.9 153.5 160.5 6.8 <0.001
Women 5,868 96.8 94.3 99.3 6,405 107.4 104.7 110.0 9.2 <0.001
Referral rate is age standardised, per 100,000
5.5.6 Lung cancer diagnoses resulting from an urgent GP referral for suspected cancer
The number of lung cancer diagnoses resulting from an urgent GP referral for suspected lung
cancer in England has been relatively steady over the past couple of years, with notable natural
1st
na
tion
al lu
ng c
am
pa
ign
2n
d n
atio
na
l lu
ng
cam
pa
ign
3rd
na
tio
nal lu
ng
cam
pa
ign
0
500
1,000
1,500
2,000
2,500
3,000
Re
ferr
als
for
susp
ecte
d lu
ng
can
cer
Ja
n-2
011
Mar-
201
1
May-2
011
Ju
l-2
01
1
Sep
-201
1
No
v-2
01
1
Ja
n-2
012
Mar-
201
2
May-2
012
Ju
l-2
01
2
Sep
-201
2
No
v-2
01
2
Ja
n-2
013
Mar-
201
3
May-2
013
Ju
l-2
01
3
Sep
-201
3
No
v-2
01
3
Ja
n-2
014
Mar-
201
4
May-2
014
Month first seen
Men Women
Data source: National Cancer Waiting Times Monitoring Dataset, NHS England. Analysed by: NCRAS

Be Clear on Cancer: Regional and national lung cancer awareness campaigns 2011 to 2014
82
monthly variation (figure 22). There is evidence of an increase around the time of first national
lung campaign.
Following the first national lung cancer campaign, there was a statistically significant 18%
increase in the number of lung cancer diagnoses resulting from an urgent GP referral for
suspected lung cancer, from May to July 2012 when compared with the same months in the
previous year (table 11).
For the second and third national campaigns, there was no evidence of a change in the number
of lung cancer diagnoses resulting from an urgent GP referral for suspected lung cancer. There
was no significant change in the numbers either when comparing the period July to September
2011 with July to September 2013, or from March to May 2013 with March to May 2014.
Figure 22. Number of lung cancer diagnoses resulting from an urgent GP referral for suspected lung cancer, January 2011 to May 2014, England
1st
na
tio
na
l lu
ng
ca
mp
aig
n
2n
d n
atio
na
l lu
ng
ca
mp
aig
n
3rd
na
tio
na
l lu
ng
ca
mp
aig
n
0
200
400
600
800
1,000
1,200
Nu
mb
er
of T
WW
ca
nce
rs
Ja
n-2
011
Mar-
201
1
May-2
011
Ju
l-2
01
1
Sep
-201
1
No
v-2
01
1
Ja
n-2
012
Mar-
201
2
May-2
012
Ju
l-2
01
2
Sep
-201
2
No
v-2
01
2
Ja
n-2
013
Mar-
201
3
May-2
013
Ju
l-2
01
3
Sep
-201
3
No
v-2
01
3
Ja
n-2
014
Mar-
201
4
May-2
014
Month first seen
Data source: National Cancer Waiting Times Monitoring Dataset, NHS England. Analysed by: NCRAS

Be Clear on Cancer: Regional and national lung cancer awareness campaigns 2011 to 2014
83
Table 11. For three national lung cancer awareness campaigns, number of lung cancer diagnoses resulting from an urgent GP referral for suspected lung cancer, with percentage change in number of cancers, England
Campaign Comparison and
campaign periods Geography
Number of TWW cancers % Change in Number
p-value Comparison period Campaign period
First national
Comparison: May to July 2011
Campaign: May to July 2012
England 2,547 3,005 18.0 <0.001
Second national
Comparison: July to September 2011
Campaign: July to September 2013
England 2,598 2,695 3.7 0.182
Third national
Comparison: March to May 2013
Campaign: March to May 2014
England 2,640 2,769 4.9 0.079
Following the first national campaign, there were statistically significant increases in the number
of lung cancer diagnoses resulting from an urgent GP referral for suspected lung cancer for all
ages except those aged 60-69. The largest percentage increase, when comparing the period
May to July 2011 with May to July 2012, was seen for those aged under 50 (43%), but this was
based on a small number of diagnoses. For those aged in their 50s, 70s and 80s, there were
increases of just over 20% over the same period.
There were no significant differences by age in the number of lung cancer diagnoses resulting
from an urgent GP referral for suspected lung cancer following either the second or third
national lung cancer awareness campaigns (table 11 and figure 23).
Figure 23. Number of lung cancer diagnoses resulting from an urgent GP referral for suspected lung cancer, January 2011 to May 2014, by age
1st
na
tio
na
l lu
ng
ca
mp
aig
n
2n
d n
atio
na
l lu
ng
ca
mp
aig
n
3rd
na
tio
na
l lu
ng
ca
mp
aig
n
0
50
100
150
200
250
300
350
400
Nu
mb
er
of T
WW
ca
nce
rs
Ja
n-2
011
Mar-
201
1
May-2
011
Ju
l-2
01
1
Sep
-201
1
No
v-2
01
1
Ja
n-2
012
Mar-
201
2
May-2
012
Ju
l-2
01
2
Sep
-201
2
No
v-2
01
2
Ja
n-2
013
Mar-
201
3
May-2
013
Ju
l-2
01
3
Sep
-201
3
No
v-2
01
3
Ja
n-2
014
Mar-
201
4
May-2
014
Month first seen
<50 50-59 60-69 70-79 80+
Data source: National Cancer Waiting Times Monitoring Dataset, NHS England. Analysed by: NCRAS

Be Clear on Cancer: Regional and national lung cancer awareness campaigns 2011 to 2014
84
Table 12. For three national lung cancer awareness campaigns, number of lung cancer diagnoses resulting from an urgent GP referral for suspected lung cancer, with percentage change in number of cancers, by age
Campaign Comparison and
campaign periods Age
group
Number of TWW cancers % Change in Number
p-value Comparison period Campaign period
First national
Comparison: May to July 2011
Campaign: May to July 2012
<50 60 86 43.3 0.031
50-59 278 341 22.7 0.011
60-69 810 872 7.7 0.131
70-79 890 1079 21.2 <0.001
80+ 509 627 23.2 <0.001
Second national
Comparison: July to September 2011
Campaign: July to September 2013
<50 60 63 5.0 0.787
50-59 281 257 -8.5 0.301
60-69 800 803 0.4 0.940
70-79 896 978 9.2 0.058
80+ 561 594 5.9 0.332
Third national
Comparison: March to May 2013
Campaign: March to May 2014
<50 53 66 24.5 0.233
50-59 253 293 15.8 0.087
60-69 828 854 3.1 0.526
70-79 918 955 4.0 0.393
80+ 588 601 2.2 0.706
Following the first national campaign (May to July 2012) when compared with the same months
in the previous year, there were statistically significant increases for both men and women in the
number of lung cancer diagnoses resulting from an urgent GP referral for suspected lung
cancer. There was a slightly larger increase for men (20%) than for women (15%).
Following the second national campaign, there was no evidence of any change in the number of
lung cancer diagnoses resulting from an urgent GP referral for suspected lung cancer for either
sex (table 13 and figure 24). However, following the third national campaign, there was a
statistically significant 8.6% increase in the number of lung cancer diagnoses resulting from an
urgent GP referral for suspected lung cancer for women, when comparing the campaign period
of March to May 2014 with the same months in 2013. . For men, the smaller 2.0% change was
not statistically significant.

Be Clear on Cancer: Regional and national lung cancer awareness campaigns 2011 to 2014
85
Table 13. For three national lung cancer awareness campaigns, number of lung cancer diagnoses resulting from an urgent GP referral for suspected lung cancer, with percentage change in number of cancers, by sex
Campaign Comparison and
campaign periods Sex
Number of TWW cancers % Change in Number
p-value Comparison period Campaign period
First national
Comparison: May to July 2011
Campaign: May to July 2012
Men 1,415 1,704 20.4 <0.001
Women 1,132 1,301 14.9 <0.001
Second national
Comparison: July to September 2011
Campaign: July to September 2013
Men 1,463 1,513 3.4 0.359
Women 1,135 1,182 4.1 0.329
Third national
Comparison: March to May 2013
Campaign: March to May 2014
Men 1,485 1,515 2.0 0.584
Women 1,155 1,254 8.6 0.044
Figure 24. Number of lung cancer diagnoses resulting from an urgent GP referral for suspected lung cancer, January 2011 to May 2014, by sex
5.5.7 Conversion rate
There has been a general decreasing trend in the cancer conversion for urgent GP referrals for
suspected lung cancer rate for several years (figure 25).
There were statistically significant decreases in the conversion rates following the first national
campaign (2.5 percentage point decrease when comparing the period May to July 2011 with
May to July 2012) and the second national campaign (5.2 percentage point decrease when
1st
na
tio
na
l lu
ng
ca
mp
aig
n
2n
d n
atio
na
l lu
ng
ca
mp
aig
n
3rd
na
tio
na
l lu
ng
ca
mp
aig
n
0
100
200
300
400
500
600
700
Nu
mb
er
of T
WW
ca
nce
rs
Ja
n-2
011
Mar-
201
1
May-2
011
Ju
l-2
01
1
Sep
-201
1
No
v-2
01
1
Ja
n-2
012
Mar-
201
2
May-2
012
Ju
l-2
01
2
Sep
-201
2
No
v-2
01
2
Ja
n-2
013
Mar-
201
3
May-2
013
Ju
l-2
01
3
Sep
-201
3
No
v-2
01
3
Ja
n-2
014
Mar-
201
4
May-2
014
Month first seen
Men Women
Data source: National Cancer Waiting Times Monitoring Dataset, NHS England. Analysed by: NCRAS

Be Clear on Cancer: Regional and national lung cancer awareness campaigns 2011 to 2014
86
comparing the period July to September 2011 with July to September 2013) (table 14). In
contrast, there was no statistically significant change in the conversion rate when comparing the
period March to May 2013 with March to May 2014, following the third national campaign.
However, the changes following the first and second national campaigns appeared consistent
with the long-term trend rather than reflecting a particular change related to the campaign.
Figure 25. Conversion rates for urgent GP referrals for suspected lung cancer, January 2011 to May 2014, England
Table 14. For three national lung cancer awareness campaigns, conversion rates for urgent GP referrals for suspected lung cancer, with change, England
Campaign
Comparison and
campaign periods
Geography
Comparison period Campaign period Change in Conv. rate
p-value Conv. Rate (%)
LCL UCL Conv.
Rate (%) LCL UCL
First national
Comparison: May to July
2011 Campaign: May to July
2012
England 24.2 23.4 25.1 21.7 21.0 22.4 -2.5 <0.001
Second national
Comparison: July to
September 2011
Campaign: July to
September 2013
England 26.1 25.3 27.0 20.9 20.2 21.6 -5.2 <0.001
Third national
Comparison: March to May
2013 Campaign:
March to May 2014
England 19.8 19.1 20.5 19.2 18.6 19.9 -0.5 0.254
1st
na
tio
na
l lu
ng
ca
mp
aig
n
2n
d n
atio
na
l lu
ng
cam
pa
ign
3rd
na
tio
na
l lu
ng
ca
mp
aig
n
0
5
10
15
20
25
30
Co
nve
rsio
n r
ate
(%
)
Ja
n-2
011
Mar-
201
1
May-2
011
Ju
l-2
01
1
Sep
-201
1
No
v-2
01
1
Ja
n-2
012
Mar-
201
2
May-2
012
Ju
l-2
01
2
Sep
-201
2
No
v-2
01
2
Ja
n-2
013
Mar-
201
3
May-2
013
Ju
l-2
01
3
Sep
-201
3
No
v-2
01
3
Ja
n-2
014
Mar-
201
4
May-2
014
Month first seen
Data source: National Cancer Waiting Times Monitoring Dataset, NHS England. Analysed by: NCRAS

Be Clear on Cancer: Regional and national lung cancer awareness campaigns 2011 to 2014
87
The conversion rate has generally decreased for all ages (figure 26). For the first and second
national campaigns, there were statistically significant decreases for some age groups, when
comparing the period May to July 2011 with May to July 2012 (first campaign) and when
comparing the period July to September 2011 with July to September 2013 (second campaign)
(table 5.11), but these decreases generally appeared in line with the long-term trend and the
variability in it. There were no statistically significant decreases for the period March to May
2013 compared with March to May 2014, following the third national campaign.
Figure 26. Conversion rates for urgent GP referrals for suspected lung cancer, January 2011 to May 2014, by age
1st
na
tio
na
l lu
ng
ca
mp
aig
n
2n
d n
atio
na
l lu
ng
cam
pa
ign
3rd
na
tio
na
l lu
ng
ca
mp
aig
n
0
5
10
15
20
25
30
35
Co
nve
rsio
n r
ate
(%
)
Ja
n-2
011
Mar-
201
1
May-2
011
Ju
l-2
01
1
Sep
-201
1
No
v-2
01
1
Ja
n-2
012
Mar-
201
2
May-2
012
Ju
l-2
01
2
Sep
-201
2
No
v-2
01
2
Ja
n-2
013
Mar-
201
3
May-2
013
Ju
l-2
01
3
Sep
-201
3
No
v-2
01
3
Ja
n-2
014
Mar-
201
4
May-2
014
Month first seen
<50 50-59 60-69 70-79 80+
Data source: National Cancer Waiting Times Monitoring Dataset, NHS England. Analysed by: NCRAS

Be Clear on Cancer: Regional and national lung cancer awareness campaigns 2011 to 2014
88
Table 15. For three national lung cancer awareness campaigns, conversion rates for urgent GP referrals for suspected lung cancer, with change, by age
Campaign Comparison
and campaign periods
Age group
Comparison period Campaign period Change in Conv.
rate p-value
Conv. Rate (%) LCL UCL Conv. Rate (%) LCL UCL
First national
Comparison: May to July 2011 Campaign: May
to July 2012
<50 6.6 5.1 8.4 6.3 5.1 7.7 -0.3 0.790
50-59 18.8 16.9 20.8 15.9 14.4 17.5 -2.8 0.026
60-69 27.7 26.1 29.3 22.7 21.4 24 -5.0 <0.001
70-79 28.0 26.5 29.6 26.9 25.5 28.3 -1.1 0.299
80+ 25.4 23.6 27.4 25.2 23.6 27 -0.2 0.884
Second national
Comparison: July to September
2011 Campaign: July to September
2013
<50 7.1 5.5 9.0 5.3 4.1 6.7 -1.8 0.092
50-59 21.5 19.3 23.8 13.8 12.3 15.5 -7.6 <0.001
60-69 28.7 27.0 30.4 23.0 21.6 24.4 -5.7 <0.001
70-79 29.4 27.8 31.1 25.2 23.8 26.6 -4.2 <0.001
80+ 28.7 26.8 30.8 24.2 22.6 25.9 -4.5 <0.001
Third national
Comparison: March to May
2013 Campaign:
March to May 2014
<50 3.9 3.0 5.0 4.3 3.4 5.4 0.4 0.577
50-59 12.4 11.1 13.9 13.3 11.9 14.8 0.9 0.393
60-69 21.9 20.6 23.2 21.2 20.0 22.5 -0.7 0.450
70-79 24.1 22.7 25.5 23.1 21.9 24.5 -0.9 0.330
80+ 25.1 23.4 26.9 24.1 22.5 25.8 -1.0 0.435
Following the first and second national campaigns, the statistically significant decreases in
conversion rate appeared a little larger for women than for men (table 16). However, all
changes following the campaigns appeared in line with the long-term decreasing trends for both
men and women (figure 26); the slightly larger decreases for women reflected a slightly higher
conversion rate for women in 2011 as conversion rates were very similar for men and women
from 2012 onwards (table 14 and figure 27). There were no statistically significant changes for
either sex following the third campaign.

Be Clear on Cancer: Regional and national lung cancer awareness campaigns 2011 to 2014
89
Figure 27. Conversion rates for urgent GP referrals for suspected lung cancer, January 2011 to May 2014, by sex
Table 16. For three national lung cancer awareness campaigns, conversion rates for urgent GP referrals for suspected lung cancer, with change, by sex
5.5.8 Cancer diagnoses recorded in the CWT dataset
For England, trends in the number of lung cancers recorded in the CWT dataset remained fairly
consistent, with some natural monthly variation (figure 28). When comparing the period June to
August 2011 with June to August 2012, there was a statistically significant 4.5% increase in the
1st n
atio
na
l lu
ng c
am
pa
ign
2n
d n
ation
al lu
ng
ca
mp
aig
n
3rd
natio
na
l lu
ng
cam
pa
ign
0
5
10
15
20
25
30
Co
nve
rsio
n r
ate
(%
)
Ja
n-2
011
Mar-
201
1
May-2
011
Ju
l-2
01
1
Sep
-201
1
No
v-2
01
1
Ja
n-2
012
Mar-
201
2
May-2
012
Ju
l-2
01
2
Sep
-201
2
No
v-2
01
2
Ja
n-2
013
Mar-
201
3
May-2
013
Ju
l-2
01
3
Sep
-201
3
No
v-2
01
3
Ja
n-2
014
Mar-
201
4
May-2
014
Month first seen
Men Women
Data source: National Cancer Waiting Times Monitoring Dataset, NHS England. Analysed by: NCRAS
Campaign Comparison
and campaign periods
Sex
Comparison period Campaign period Change in
Conv. rate
p-value Conv. Rate (%) LCL UCL Conv. Rate (%) LCL UCL
First national
Comparison: May to July 2011
Campaign: May to July 2012
Men 23.4 22.4 24.5 21.6 20.7 22.6 -1.8 0.013
Women 25.4 24.1 26.7 21.8 20.8 22.8 -3.6 <0.001
Second national
Comparison: July to September
2011 Campaign: July to September
2013
Men 25.5 24.4 26.7 21.0 20.1 22.0 -4.5 <0.001
Women 26.9 25.6 28.3 20.8 19.7 21.8 -6.2 <0.001
Third national
Comparison: March to May
2013 Campaign:
March to May 2014
Men 19.8 19.0 20.8 19.0 18.1 19.8 -0.9 0.160
Women 19.7 18.7 20.7 19.6 18.6 20.6 -0.1 0.884

Be Clear on Cancer: Regional and national lung cancer awareness campaigns 2011 to 2014
90
number of lung cancers recorded in the CWT database (table 17), with numbers possibly
slightly higher than the general trend.
There were no statistically significant changes in the number of lung cancer diagnoses recorded
in the CWT dataset following either the second national campaign (comparing August to
October 2011 with August to October 2013) or the third national campaign (comparing April to
June 2013 with April to June 2014).
Figure 28. Number of lung cancer diagnoses recorded in the CWT dataset, January 2011 to June 2014, England
Table 17. For three national lung cancer awareness campaigns, number of lung cancer diagnoses recorded in the CWT dataset, with percentage change in number of cancers, England
Campaign Comparison and
campaign periods Geography
Number of CWT dataset cancers % Change in Number
p-value Comparison period Campaign period
First national
Comparison: June to August 2011
Campaign: June to August 2012
England 7,153 7,475 4.5 0.008
Second national
Comparison: August to October 2011
Campaign: August to October 2013
England 7,209 7,328 1.7 0.324
Third national
Comparison: April to June 2013
Campaign: April to June 2014
England 7,213 7,176 -0.5 0.758
1st
na
tio
na
l lu
ng
ca
mp
aig
n
2n
d n
atio
na
l lu
ng
ca
mp
aig
n
3rd
na
tio
na
l lu
ng
ca
mpa
ign
0
500
1,000
1,500
2,000
2,500
3,000
Nu
mb
er
of C
WT
can
cers
Ja
n-2
011
Mar-
201
1
May-2
011
Ju
l-2
01
1
Sep
-201
1
No
v-2
01
1
Ja
n-2
012
Mar-
201
2
May-2
012
Ju
l-2
01
2
Sep
-201
2
No
v-2
01
2
Ja
n-2
013
Mar-
201
3
May-2
013
Ju
l-2
01
3
Sep
-201
3
No
v-2
01
3
Ja
n-2
014
Mar-
201
4
May-2
014
Month first treated
Data source: National Cancer Waiting Times Monitoring Dataset, NHS England. Analysed by: NCRAS

Be Clear on Cancer: Regional and national lung cancer awareness campaigns 2011 to 2014
91
The number of lung cancer diagnoses recorded in the CWT dataset did not change statistically
significantly for any age group following either the second or third national lung cancer
campaigns (table 18 and figure 29). Following the first national campaign, there was only one
statistically significant change, for those aged 80 and over. However, the trend in the number of
lung cancer diagnoses recorded in the CWT dataset was similar for this age-group and for the
other ages.
Figure 29. Number of lung cancer diagnoses recorded in the CWT dataset, January 2011 to June 2014, by age
1st
na
tio
na
l lu
ng
ca
mp
aig
n
2n
d n
atio
na
l lu
ng
ca
mp
aig
n
3rd
na
tio
na
l lu
ng
ca
mp
aig
n
0
100
200
300
400
500
600
700
800
900
1,000
Nu
mb
er
of C
WT
can
cers
Ja
n-2
011
Mar-
201
1
May-2
011
Ju
l-2
01
1
Sep
-201
1
No
v-2
01
1
Ja
n-2
012
Mar-
201
2
May-2
012
Ju
l-2
01
2
Sep
-201
2
No
v-2
01
2
Ja
n-2
013
Mar-
201
3
May-2
013
Ju
l-2
01
3
Sep
-201
3
No
v-2
01
3
Ja
n-2
014
Mar-
201
4
May-2
014
Month first treated
<50 50-59 60-69 70-79 80+
Data source: National Cancer Waiting Times Monitoring Dataset, NHS England. Analysed by: NCRAS
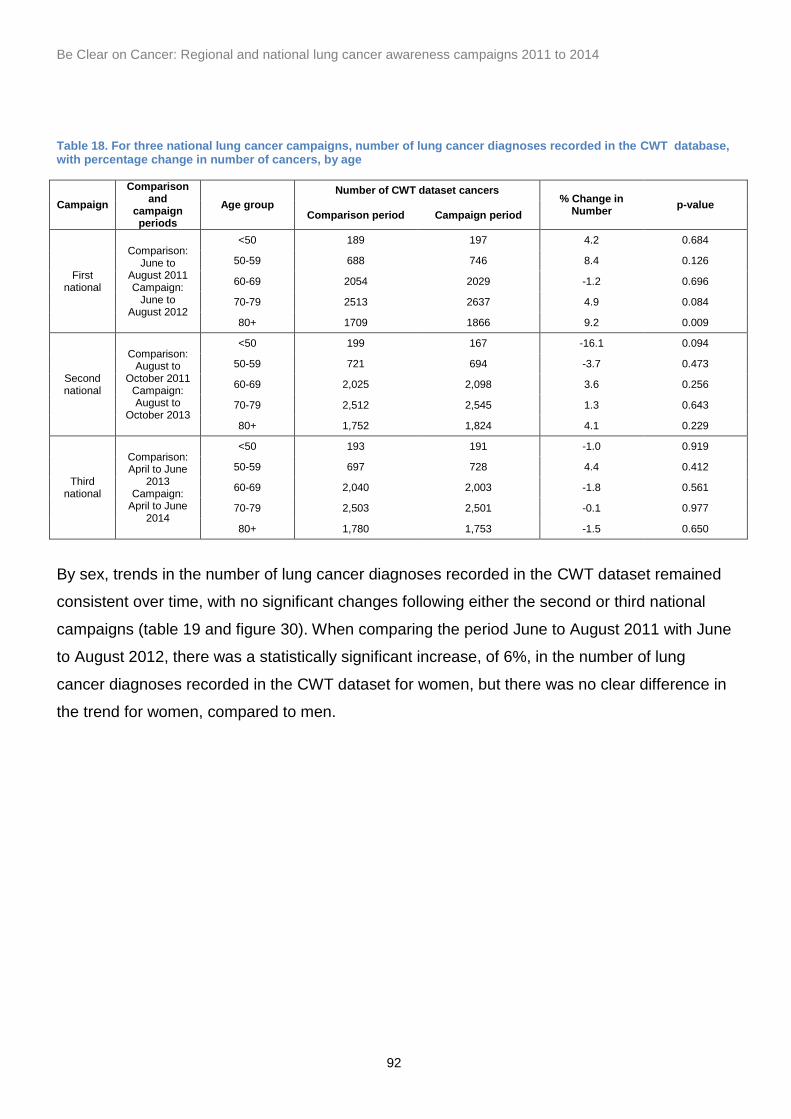
Be Clear on Cancer: Regional and national lung cancer awareness campaigns 2011 to 2014
92
Table 18. For three national lung cancer campaigns, number of lung cancer diagnoses recorded in the CWT database, with percentage change in number of cancers, by age
Campaign
Comparison and
campaign periods
Age group
Number of CWT dataset cancers % Change in
Number p-value
Comparison period Campaign period
First national
Comparison: June to
August 2011 Campaign:
June to August 2012
<50 189 197 4.2 0.684
50-59 688 746 8.4 0.126
60-69 2054 2029 -1.2 0.696
70-79 2513 2637 4.9 0.084
80+ 1709 1866 9.2 0.009
Second national
Comparison: August to
October 2011 Campaign: August to
October 2013
<50 199 167 -16.1 0.094
50-59 721 694 -3.7 0.473
60-69 2,025 2,098 3.6 0.256
70-79 2,512 2,545 1.3 0.643
80+ 1,752 1,824 4.1 0.229
Third national
Comparison: April to June
2013 Campaign:
April to June 2014
<50 193 191 -1.0 0.919
50-59 697 728 4.4 0.412
60-69 2,040 2,003 -1.8 0.561
70-79 2,503 2,501 -0.1 0.977
80+ 1,780 1,753 -1.5 0.650
By sex, trends in the number of lung cancer diagnoses recorded in the CWT dataset remained
consistent over time, with no significant changes following either the second or third national
campaigns (table 19 and figure 30). When comparing the period June to August 2011 with June
to August 2012, there was a statistically significant increase, of 6%, in the number of lung
cancer diagnoses recorded in the CWT dataset for women, but there was no clear difference in
the trend for women, compared to men.

Be Clear on Cancer: Regional and national lung cancer awareness campaigns 2011 to 2014
93
Figure 30. Number of lung cancer diagnoses recorded in the CWT dataset, January 2011 to June 2014, by sex
Table 19. For three national lung cancer campaigns, number of lung cancer diagnoses recorded in the CWT dataset, with percentage change in number of cancers, by sex
Please note Cancer Research UK analysed the data on the number of lung cancers diagnosed
as recorded in the NLCA for the regional and first national campaigns (see section 3.9.1 and
Ironmonger et al, 2015).
5.5.9 Detection rate
The lung cancer detection rate for England has remained stable from 2011 to 2014, at around
39% (figure 31). For the campaign and comparison periods considered, there were no
statistically significant changes in the detection rate for lung cancer diagnoses for any of the
1st n
atio
na
l lu
ng
ca
mpa
ign
2n
d n
atio
na
l lu
ng
ca
mp
aig
n
3rd
nation
al lu
ng
cam
pa
ign
0
200
400
600
800
1,000
1,200
1,400
1,600
Nu
mb
er
of C
WT
can
cers
Ja
n-2
011
Mar-
201
1
May-2
011
Ju
l-2
01
1
Sep
-201
1
No
v-2
01
1
Ja
n-2
012
Mar-
201
2
May-2
012
Ju
l-2
01
2
Sep
-201
2
No
v-2
01
2
Ja
n-2
013
Mar-
201
3
May-2
013
Ju
l-2
01
3
Sep
-201
3
No
v-2
01
3
Ja
n-2
014
Mar-
201
4
May-2
014
Month first treated
Men Women
Data source: National Cancer Waiting Times Monitoring Dataset, NHS England. Analysed by: NCRAS
Campaign Comparison and
campaign periods Sex
Number of CWT dataset cancers % Change in Number
p-value Comparison period Campaign period
First national
Comparison: June to August 2011
Campaign: June to August 2012
Men 4,035 4,169 3.3 0.139
Women 3,118 3,306 6.0 0.019
Second national
Comparison: August to October 2011
Campaign: August to October 2013
Men 4,027 4,110 2.1 0.358
Women 3,182 3,218 1.1 0.653
Third national
Comparison: April to June 2013
Campaign: April to June 2014
Men 3,962 3,913 -1.2 0.581
Women 3,251 3,263 0.4 0.882

Be Clear on Cancer: Regional and national lung cancer awareness campaigns 2011 to 2014
94
three national lung cancer campaigns (table 20). However, figure 31 appears to show a slight
increase in the detection rate, to about 42%, for August and September 2012, a little after the
first national campaign. This may suggest a slight impact of the campaign, delayed longer than
initially considered, possibly due to waits for chest X-rays prior to referral. There does not
appear to be a similar increase following the second national campaign.
Figure 31. Detection rates for lung cancer diagnoses, January 2011 to June 2014, England
Table 20. For three national lung cancer campaigns, detection rates for lung cancer diagnoses, with change, England
Campaign Comparison and
campaign periods Geography
Comparison period Campaign period Change in Det.
rate p-value
Det. Rate (%) LCL UCL Det. Rate (%) LCL UCL
First national
Comparison: June to August 2011
Campaign: June to August 2012
England 39.3 38.2 40.5 38.8 37.7 39.9 -0.4 0.553
Second national
Comparison: August to October 2011
Campaign: August to October 2013
England 39.0 37.9 40.2 37.9 36.8 39.0 -1.1 0.168
Third national
Comparison: April to June 2013
Campaign: April to June 2014
England 38.5 37.4 39.7 39.4 38.3 40.6 0.9 0.271
For most age groups, changes in detection rate following the three national campaigns were
not statistically significant and did not exhibit a pattern with age (table 21 and figure 32). More
specifically, there were no statistically significant changes following either the first national
1st na
tiona
l lu
ng c
am
pa
ign
2n
d n
ation
al lu
ng
cam
pa
ign
3rd
nation
al lu
ng
cam
pa
ign
0
5
10
15
20
25
30
35
40
45
50
De
tectio
n r
ate
(%
)
Ja
n-2
011
Mar-
201
1
May-2
011
Ju
l-2
01
1
Sep
-201
1
No
v-2
01
1
Ja
n-2
012
Mar-
201
2
May-2
012
Ju
l-2
01
2
Sep
-201
2
No
v-2
01
2
Ja
n-2
013
Mar-
201
3
May-2
013
Ju
l-2
01
3
Sep
-201
3
No
v-2
01
3
Ja
n-2
014
Mar-
201
4
May-2
014
Month first treated
Data source: National Cancer Waiting Times Monitoring Dataset, NHS England. Analysed by: NCRAS
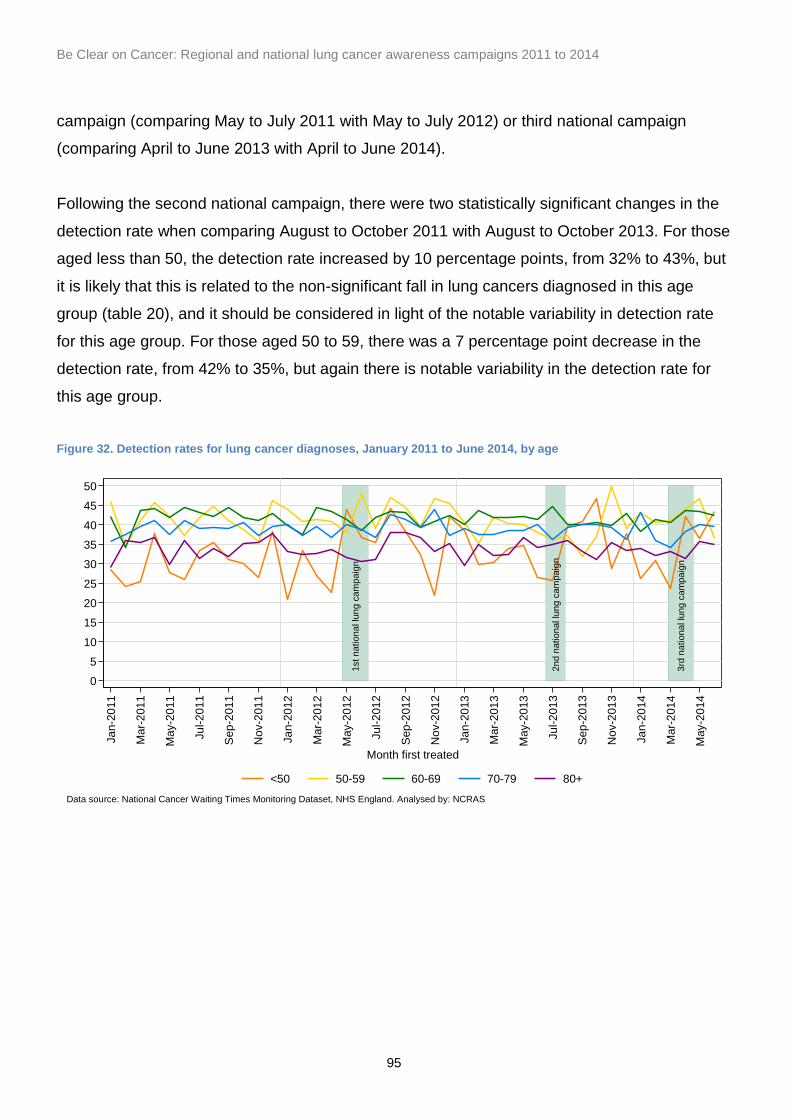
Be Clear on Cancer: Regional and national lung cancer awareness campaigns 2011 to 2014
95
campaign (comparing May to July 2011 with May to July 2012) or third national campaign
(comparing April to June 2013 with April to June 2014).
Following the second national campaign, there were two statistically significant changes in the
detection rate when comparing August to October 2011 with August to October 2013. For those
aged less than 50, the detection rate increased by 10 percentage points, from 32% to 43%, but
it is likely that this is related to the non-significant fall in lung cancers diagnosed in this age
group (table 20), and it should be considered in light of the notable variability in detection rate
for this age group. For those aged 50 to 59, there was a 7 percentage point decrease in the
detection rate, from 42% to 35%, but again there is notable variability in the detection rate for
this age group.
Figure 32. Detection rates for lung cancer diagnoses, January 2011 to June 2014, by age
1st
na
tio
na
l lu
ng
ca
mp
aig
n
2n
d n
atio
na
l lu
ng
cam
pa
ign
3rd
na
tio
na
l lu
ng
ca
mpa
ign
0
5
10
15
20
25
30
35
40
45
50
De
tectio
n r
ate
(%
)
Ja
n-2
011
Mar-
201
1
May-2
011
Ju
l-2
01
1
Sep
-201
1
No
v-2
01
1
Ja
n-2
012
Mar-
201
2
May-2
012
Ju
l-2
01
2
Sep
-201
2
No
v-2
01
2
Ja
n-2
013
Mar-
201
3
May-2
013
Ju
l-2
01
3
Sep
-201
3
No
v-2
01
3
Ja
n-2
014
Mar-
201
4
May-2
014
Month first treated
<50 50-59 60-69 70-79 80+
Data source: National Cancer Waiting Times Monitoring Dataset, NHS England. Analysed by: NCRAS

Be Clear on Cancer: Regional and national lung cancer awareness campaigns 2011 to 2014
96
Table 21. For three national lung cancer campaigns, detection rates for lung cancer diagnoses, with change, by age
Campaign Comparison
and campaign periods
Age group
Comparison period Campaign period Change in Det. rate
p-value Det. Rate (%) LCL UCL Det. Rate (%) LCL UCL
First national
Comparison: June to August
2011 Campaign:
June to August 2012
<50 31.7 25.5 38.7 38.6 32.1 45.5 6.8 0.160
50-59 41.4 37.8 45.1 44.4 40.8 48 2.9 0.260
60-69 43.3 41.2 45.4 41.4 39.3 43.6 -1.9 0.224
70-79 39.8 37.9 41.8 39.4 37.5 41.2 -0.5 0.730
80+ 33.8 31.6 36.1 33.3 31.2 35.5 -0.5 0.732
Second national
Comparison: August to
October 2011 Campaign: August to
October 2013
<50 32.2 26.1 38.9 42.5 35.3 50.1 10.4 0.041
50-59 41.6 38.1 45.2 35.3 31.8 38.9 -6.3 0.015
60-69 42.8 40.6 44.9 40.2 38.2 42.3 -2.5 0.098
70-79 39.6 37.7 41.5 39.8 37.9 41.7 0.2 0.888
80+ 33.6 31.4 35.9 33.2 31.1 35.4 -0.4 0.802
Third national
Comparison: April to June
2013 Campaign:
April to June 2014
<50 32.1 25.9 39.0 40.3 33.6 47.4 8.2 0.095
50-59 39.5 35.9 43.1 42.2 38.6 45.8 2.7 0.297
60-69 41.8 39.6 43.9 43.2 41.0 45.4 1.4 0.361
70-79 39.0 37.1 40.9 39.3 37.4 41.3 0.4 0.799
80+ 34.5 32.3 36.7 34.0 31.8 36.2 -0.5 0.756
By sex, there were no significant changes in the detection rate following any of the three
national campaigns (table 22 and figure 33).
Figure 33. Detection rates for lung cancer diagnoses, January 2011 to June 2014, by sex
1st
na
tio
na
l lu
ng
ca
mp
aig
n
2n
d n
atio
na
l lu
ng
cam
pa
ign
3rd
na
tio
na
l lu
ng
ca
mp
aig
n
0
5
10
15
20
25
30
35
40
45
De
tectio
n r
ate
(%
)
Ja
n-2
011
Mar-
201
1
May-2
011
Ju
l-2
01
1
Sep
-201
1
No
v-2
01
1
Ja
n-2
012
Mar-
201
2
May-2
012
Ju
l-2
01
2
Sep
-201
2
No
v-2
01
2
Ja
n-2
013
Mar-
201
3
May-2
013
Ju
l-2
01
3
Sep
-201
3
No
v-2
01
3
Ja
n-2
014
Mar-
201
4
May-2
014
Month first treated
Men Women
Data source: National Cancer Waiting Times Monitoring Dataset, NHS England. Analysed by: NCRAS

Be Clear on Cancer: Regional and national lung cancer awareness campaigns 2011 to 2014
97
Table 22. For three national lung cancer campaigns, detection rates for lung cancer diagnoses, with change, by sex
5.6 Emergency presentation
Data on routes to diagnosis for the regional and first national campaign were analysed by
Cancer Research UK using data from the NLCA. This data source depended on the route being
recorded by the (multi-disciplinary team (MDT) and is different from the way in which NCRAS
derive the route to diagnosis which is available in CAS and which was used for all the
subsequent campaigns.
5.6.1 Regional and first national campaigns
For the period of the first national campaign, there was an increase in the proportion of
patients diagnosed via GP referral (3.0 percentage point increase from 47.9% to 50.9%;
p<0.001) and a decrease in the proportion diagnosed after an emergency admission or
A&E attendance (1.9 percentage point decrease, from 21.5% to 19.6%; p=0.004), see
table 23.
Campaign Comparison
and campaign periods
Sex Comparison period Campaign period Change
in Det. rate
p-value Det. Rate (%) LCL UCL Det. Rate (%) LCL UCL
First national
Comparison: June to August
2011 Campaign:
June to August 2012
Men 39.6 38.1 41.1 39.8 38.3 41.3 0.2 0.849
Women 38.9 37.2 40.7 37.6 36.0 39.3 -1.3 0.273
Second national
Comparison: August to
October 2011 Campaign: August to
October 2013
Men 38.9 37.4 40.5 37.5 36.1 39.0 -1.4 0.188
Women 39.2 37.5 40.9 38.4 36.8 40.1 -0.7 0.556
Third national
Comparison: April to June
2013 Campaign:
April to June 2014
Men 39.5 38.0 41.1 39.8 38.3 41.3 0.3 0.810
Women 37.3 35.7 39.0 39.0 37.3 40.7 1.7 0.165

Be Clear on Cancer: Regional and national lung cancer awareness campaigns 2011 to 2014
98
Table 23 . First national campaign: source of referral of lung cancer for the campaign and control periods (derived from NLCA data) (Table S11 from Ironmonger et al, 2015)
Source of referral
Control period Campaign period
Cases (% of known)
Change in proportion
p-value
Cases (% of known)
Change in proportion
p-value February
to April 2011
February to April
2012
May to July 2011
May to July 2012
Following emergency admission
916 (12.8%)
959 (12.9%)
0.1 0.862 955
(12.9%) 983
(12.1%) -0.8 0.119
Following an A&E
attendance
575 (8.0%)
660 (8.8%)
0.8 0.068 633
(8.6%) 612
(7.5%) -1.0* 0.018
SUBTOTAL of above
(emergency admission and A&E
attendance)
1,491 (20.8%)
1,619 (21.7%)
0.9 0.167 1,588
(21.5%) 1,595
(19.6%) -1.9* 0.004
Referral from a GP
3,550 (49.4%)
3,655 (49.0%)
-0.5 0.583 3,540
(47.9%) 4,134
(50.9%) +3.0* <0.001
Referral from a
consultant, other than in
an A&E department
1,645 (22.9%)
1,774 (23.8%)
0.9 0.216 1,777
(24.1%) 1,991
(24.5%) 0.4 0.515
Other source of referral
496 (6.9%)
415 (5.6%)
-1.3* 0.001 481
(6.5%) 404
(5.0%) -1.5* <0.001
Total known 7,182
(100%) 7,463
(100%) - -
7,386 (100%)
8,124 (100%)
- -
Not recorded (%
of total)
222 (3.0%)
173 (2.3%)
-0.7* 0.005 253
(3.3%) 211
(2.5%) -0.8* 0.003
TOTAL 7,404 7,636 - - 7,639 8,335 - -
*Statistically significant difference between 2011 and 2012 (two-sample test of proportions; p<0.05)
Neither proportion significantly changed for the control period of February to April 2011
compared with February to April 2012 (p=0.583 and p=0.167). For the regional
campaign, changes in the above proportions did not reach significance in either area.

Be Clear on Cancer: Regional and national lung cancer awareness campaigns 2011 to 2014
99
5.6.2 Second and third national campaigns
Using the proxy emergency presentation methodology, there was a statistically
significant difference in the proportion of emergency presentations between 2011 and
2013 for April (42% in 2011 compared to 35% in 2013) before the second national
campaign (figure 34). Emergency presentations during the second national campaign
were 35% in July and 39% in August compared with 38% and 37% for the same months
in 2011.
Figure 34. Proportion of emergency presentations for lung cancer, second national campaign - England, 2011 versus 2013
Second national lung campaign 2 July to 11 August 2013
Source: NCRAS Cancer Analysis System and the PHE Admitted Patient Care HES database
There were no significant differences between 2013 and 2014 in the proportion of lung cancers
diagnosed via emergency presentation for England (figure 35). Emergency presentations
during the third national campaign period were 38% in March 2014 and 36% in April 2014
compared to 37% and 36% for the same months in 2013.

Be Clear on Cancer: Regional and national lung cancer awareness campaigns 2011 to 2014
100
Figure 35. Proportion of emergency presentations for lung cancer, third national campaign - England, 2013 versus 2014
Third national lung campaign 10 March to 30 April 2014
Source: NCRAS Cancer Analysis System and the PHE Admitted Patient Care HES database
The background level of patients being diagnosed as part of an emergency admission has
however been falling steadily over the last few years making interpretation of the above data
difficult.
5.6.3 Summary of impact on emergency presentation
For the period of the first national campaign, there was an increase in the proportion of patients
recorded in the NLCA database diagnosed via GP referral (3.0 percentage point increase from
47.9% to 50.9%; p<0.001) and a decrease in the proportion diagnosed after an emergency
admission or A&E attendance (1.9 percentage point decrease, from 21.5% to 19.6%; p=0.004).
For the second and third campaigns, emergency presentation was defined in line with the proxy
for emergency presentations methodology. There were no significant differences in the
proportions of lung cancers diagnosed through emergency presentation for the year the
campaign ran compared with the comparison periods. Over the time period of all the

Be Clear on Cancer: Regional and national lung cancer awareness campaigns 2011 to 2014
101
campaigns, however, there was a slow but consistent fall in the proportion of patients
diagnosed as part of an emergency admission in parallel with an increase in the proportion
referred electively from GPs, making interpretation of the specific impact of the campaigns
difficult. In particular, any impact on the numbers of patients diagnosed through an emergency
route may take many weeks or months to become apparent. Details can be found on the
NCRAS website.
5.7 Demographics of new cases diagnosed post campaign
There has been no evidence of a difference in the age or sex distribution of new cases of lung
cancer following any of the campaigns. The following example of findings (table 24) is from the
first national campaign:
Table 24. Lung cancers diagnosed during the first national campaign by age and sex
Under 50 years
Age 50 and over All ages
M F P M F P M F P
Lung cancers
diagnosed
All of 2013 464 440 904 18,596 15,710 34,306 19,060 16,150 35,210
2 July to 30
September 2013
113 99 212 4,769 3,887 8,656 4,882 3,986 8,868
Source: NCRAS
Carrying out chi-squared tests shows there is no strong evidence (all p-values >0.05) in support
of a statistically significant difference in the age profile or the sex profile of lung tumours
diagnosed in the campaign period (second national) and for the rest of 2013 (whether analysed
as the whole year or excluding the campaign period).
5.8 Stage at diagnosis
For NSCLC, stage at diagnosis (stage 1, 2, 3A, 3B and 4) was defined by TNM seventh edition
(Sobin et al, 2009). For SCLC (where analysed) the Veterans Association’s grouping in to
Limited and Extensive disease was used (Mountain,1986).
Analysis of stage for the regional and first national campaigns was carried out by the cancer
statistics team at Cancer Research UK, though an additional analysis of the first national

Be Clear on Cancer: Regional and national lung cancer awareness campaigns 2011 to 2014
102
campaign was carried out by NCRAS and is included here. The changes in proportions
diagnosed at each stage were tested with and without exclusion of cases with unknown stage
(uncertain or not recorded). For SCLC, proportions diagnosed with SCLC-limited stage and
SCLC-extensive were also tested with and without exclusion of those with unknown stage.
5.8.1 Stage - regional campaign
Analysis of stage at diagnosis for the regional campaign was based on data from the NLCA
database.
5.8.2 Stage of SCLC – regional campaign
Staging completeness of SCLCs increased in both pilot and control trusts when comparing the
period October to December 2010 with October to December 2011, although the improvement
was larger in the control trusts (88.3% to 91.1%, and 89.7% to 94.9% in the pilot and control
trusts respectively).
Table 25 shows that of the SCLCs that did have a recorded stage, there was a statistically
significant decrease in the percentage of SCLCs coded as having extensive disease when
comparing the period October to December 2010 with October to December 2011 (74.1% to
63.4%). The corresponding increase in the percentage of SCLCs coded as having limited’
disease therefore went up when comparing the period October to December 2010 with October
to December 2011, from 25.9% to 36.6%. A similar, but much smaller, non-significant trend
was found for the control trusts.
Table 25. Distribution of stage in SCLC patients between pilot and control trusts post the regional campaign 2012 compared with the same period 2011
Stage
Pilot Trusts Control Trusts
October to December 2010
October to December 2011
October to December 2010
October to December 2011
SCLC - Limited
43 (25.9%) 60 (36.6%) 141 (27.1%) 174 (29%)
SCLC - Extensive
123 (74.1%) 104 (63.4%) 380 (72.9%) 426 (71%)
Total 166 (100%) 164 (100%) 521 (100%) 600 (100%)
There was thus a favourable (statistically significant) shift towards earlier stage at diagnosis in
SCLC patients relating in time to the regional campaign.

Be Clear on Cancer: Regional and national lung cancer awareness campaigns 2011 to 2014
103
5.8.3 Stage of NSCLC – regional campaign
The analysis of stage at diagnosis for NSCLC relating to the regional campaign was also
carried out by Cancer Research UK, based on data from the NLCA.
Staging completeness of NSCLCs (including carcinoid tumours) increased similarly in both pilot
and control trusts when comparing the period October to December 2010 with October to
December 2011, although control trusts had a slightly higher percentage of cases with
certain/known stage. Of these tumours, there was a higher proportion diagnosed as stage 1
and 2 in October to December 2011 compared with the same period in 2010 in pilot trusts
(24.6% compared with 22.3%); and with stage 3A (12.6% compared to 10.3%; see table 26).
There was a correspondingly lower proportion diagnosed at stage 3B and 4 (62.8% compared
with 67.4%). However, this shift was not statistically significant, possibly a result of the small
numbers. There was no evidence of a difference in stage at diagnosis in the control trusts
between these two periods.
Table 26. Distribution of stage in NSCLC patients between pilot and control trusts post the regional campaign in 2011 compared with the same period 2010
Stage
Pilot trusts Control trusts
October to December 2010
October to December 2011
October to December 2010
October to December 2011
1 & 2 231 (22.3%) 318 (24.6%) 922 (23.2%) 1,038 (23.4%)
3A 107 (10.3%) 163 (12.6%) 539 (13.5%) 599 (13.5%)
3B and 4 698 (67.4%) 813 (62.8%) 2,521 (63.3%) 2,801 (63.1%)
Total (1 - 4) 1,036 (100%) 1,294 (100%) 3,982 (100%) 4,438 (100%)
There was thus a trend towards a favourable stage shift in NSCLC patients relating in time to
the regional campaign which did not reach statistical significance.
5.8.4 Stage - first national campaign
The analysis of stage at diagnosis for NSCLC and SCLC for the first national campaign was
also carried out by Cancer Research UK and based on data from the NLCA database. The
additional NCRAS analysis used CAS cancer registry data and is presented below, after the
Cancer Research UK analysis.

Be Clear on Cancer: Regional and national lung cancer awareness campaigns 2011 to 2014
104
The detailed changes as derived from the NLCA data are shown in table 27 and the key
findings of this Cancer Research UK analysis are summarised in figure 9 (Ironmonger et al,
2015).
Table 27. First national campaign: number and proportion of NSCLC and SCLC diagnosed at each stage for the campaign and control periods (Table 6, Ironmonger et al, 2015)
Type of lung
cancer Stage
Control period Campaign period
February to April
2011
February to April
2012
Change in proportion
p-value
May to July 2011
May to July 2012
Change in proportion
p-value
NSCLC
1
Number of cases
886 988 - - 862 1,180 - -
% Total known
15.2% 15.8% +0.6 0.404 14.1% 17.3% +3.1* <0.001
% Grand total
13.6% 14.6% +1.0 0.082 12.8% 16.0% +3.2* <0.001
2
Number of cases
509 593 - - 562 660 - -
% Total known
8.8% 9.5% +0.7 0.169 9.2% 9.7% +0.4 0.397
% Grand total
7.8% 8.8% +1.0* 0.041 8.3% 8.9% +0.6 0.222
3A
Number of cases
857 902 - - 859 921 - -
% Total known
14.7% 14.4% -0.3 0.614 14.1% 13.5% -0.6 0.309
% Grand total
13.1% 13.3% +0.2 0.707 12.8% 12.5% -0.3 0.587
3B
Number of cases
603 656 - - 608 720 - -
% Total known
10.4% 10.5% +0.1 0.840 10.0% 10.5% +0.6 0.295
% Grand total
9.2% 9.7% +0.5 0.354 9.0% 9.7% +0.7 0.151
4
Number of cases
2,958 3,117 - - 3,201 3,350 - -
% Total known
50.9% 49.8% -1.1 0.244 52.5% 49.0% -3.5* <0.001
% Grand total
45.3% 46.1% +0.8 0.344 47.5% 45.3% -2.2* 0.008
NK
Number of cases
59 46 - - 43 50 - -
% Grand total
0.9% 0.7% -0.2 0.147 0.6% 0.7% 0 0.783
NR
Number of cases
656 455 - - 597 513
% Grand total
10.0% 6.7% -3.3* <0.001 8.9% 6.9% -1.9* <0.001
Total known (stages
1-4)
Number of cases
5,813 6,256 - - 6,092 6,831 - -
% Grand total
89.0% 92.6% +3.5* <0.001 90.5% 92.4% +1.9* <0.001
Total unknown
Number of cases
715 501 - - 640 563 - -
% Grand 11.0% 7.4% -3.5* <0.001 9.5% 7.6% -1.9* <0.001

Be Clear on Cancer: Regional and national lung cancer awareness campaigns 2011 to 2014
105
total
Grand total 6,528 6,757 - - 6,732 7,394 - -
SCLC
SCLC - Limited
Number of cases
233 255 - - 246 286 - -
% Total known
28.7% 30.4% +1.7 0.440 28.8% 31.8% +3.0 0.166
% Grand total
26.6% 29.0% +2.4 0.260 27.1% 30.4% +3.3 0.121
SCLC - Extensive
Number of cases
580 584 - - 609 613 - -
% Total known
71.3% 69.6% -1.7 0.440 71.2% 68.2% -3.0 0.166
% Grand total
66.2% 66.4% +0.2 0.919 67.1% 65.1% -2.0 0.364
NK
Number of cases
10 5 - - 3 8 - -
% Grand total
1.1% 0.6% -0.6 0.193 0.3% 0.9% +0.5 0.147
NR
Number of cases
53 35 - - 49 34 - -
% Grand total
6.1% 4.0% -2.1* 0.047 5.4% 3.6% -1.8* 0.063
Total known
Number of cases
813 839 - - 855 899 - -
% Grand total
92.8% 95.4% +2.6* 0.019 94.3% 95.5% +1.3 0.214
Total unknown
Number of cases
63 40 - - 52 42 - -
% Grand total
7.2% 4.6% -2.6* 0.019 5.7% 4.5% -1.3 0.214
Grand total 876 879 - - 907 941 - -
In summary, during the period of the first national campaign and in the month following, there
was an increase in the proportion of NSCLC diagnosed at stage 1 (p<0.001) and a fall in the
proportion diagnosed at stage 4 (p<0.001), but no change for the control period (p=0.404 &
p=0.244). In contrast to the finding in the regional campaign there was no statistically significant
stage shift seen in SCLC case.
With regards to the NCRAS analysis of stage after the first national campaign it is noteworthy
that the staging data available within the CAS dataset is very incomplete prior to 2012, but for
the calendar year 2012 (the year of the first national campaign) the completeness is 84% for
lung cancer.
In this analysis, different campaign periods were examined; firstly the 10 weeks post campaign
(weeks 27 to37) and secondly incorporating the campaign period itself (weeks 19 to 37). Both
were compared to the rest of 2012 pre and post the 19 to 37 week window. Table 28 shows the

Be Clear on Cancer: Regional and national lung cancer awareness campaigns 2011 to 2014
106
proportion of lung cancers than are early stage (stage 1 or 2) and the percentage that are
staged at all for various periods in 2012. In the period 27 to 37 weeks there is a small increase
in the proportion of early stage cancers (from 19.3% to 20.5%) which is just statistically
significant (p=0.02) (table 28). The numbers staged overall is also higher (increase from 83.8%
to 85.5% with p=0.0002). For the longer period 19 to -37 weeks the difference in early stage is
no longer significant (p=0.12) but the percentage staged remains so (p=0.006).
Table 28. proportion of patients with early stage disease and total proportion with stage recorded at all for lung cancer in various periods in 2012
Period %early stage (1 and 2) Confidence Intervals % staged
2012 19.5% 19.1% to 20.0% 84.1%
2012, weeks 27 - 37 20.5% 19.6% to 21.4% 85.5%
2012, weeks 1 to 26 and 38 to 53
19.3% 18.8% to 19.7% 83.8%
2012, weeks 19 to 37 20.0% 19.4% to 20.6% 84.9%
2012, weeks 1 to18 and 38 to 53
19.5% 19.1% to 19.8% 84.0%
5.8.5 Stage, second national campaign
Data from the CAS database were used for the analysis of stage relating to the second national
campaign. For 2013, over 86% of cases had a valid stage recorded. As outlined in section 3.10
the proportion of staged cases diagnosed at stages 1, 2, 3 and 4 and those with unknown stage
were analysed by week and compared to the annual median for 2013. A significant result was
defined as 5 or more consecutive weeks with higher or lower proportions of cases staged 1 to
2, 3, 4 or unknown compared to the median. There were 8 consecutive weeks (weeks 42 to 49)
where the proportions of early staged 1 and 2 cases were above the median (figure 10). This
corresponded with 5 consecutive weeks (weeks 45 to 49) where the proportions of stage 3
cancers were below the median (figure 36). For those cases where stage was unknown, there
was a 5 week long period towards the end of 2013 (weeks 48 to 52) where the proportions of
unknown cases were higher than the median (figure 37).

Be Clear on Cancer: Regional and national lung cancer awareness campaigns 2011 to 2014
107
Figure 36. Proportion of staged cases diagnosed as stage 3 by week, 2013, England

Be Clear on Cancer: Regional and national lung cancer awareness campaigns 2011 to 2014
108
Figure 37. Proportion of total cases diagnosed as stage unknown by week, 2013, England
5.8.6 Stage, third national campaign
Stage for the third national campaign was analysed in comparison to the second national
campaign. In general there was an increase in the proportion of lung cancer diagnosed at stage
1 or 2 prior to, during and after this campaign, as illustrated in figure 38.

Be Clear on Cancer: Regional and national lung cancer awareness campaigns 2011 to 2014
109
Figure 38. Percentage of staged cases diagnosed with stage 1 or 2 by week, 2013 and 2014, lung C33-C34 cases England, all ages

Be Clear on Cancer: Regional and national lung cancer awareness campaigns 2011 to 2014
110
Figure 39. Percentage of staged cases diagnosed with stage 3 by week, 2013 and 2014, lung C33-C34 cases England, all ages

Be Clear on Cancer: Regional and national lung cancer awareness campaigns 2011 to 2014
111
Figure 40. Percentage of staged cases diagnosed with stage unknown by week, 2013 and 2014, lung C33-C34 cases England, all ages
5.8.7 Stage, summary
There is evidence of a shift in stage at diagnosis in the weeks following all three of the national
campaigns, despite the fact that different datasets were used for the first national campaign
(NLCA) and second and third national campaigns (CAS), as well as different analytical methods
including slight differences in how the stages were grouped and the fact that different time
periods were used. There was also a trend towards this positive stage shift following the
regional campaign, with statistical power likely to have been limited by the smaller numbers.
These results are almost entirely related to NSCLC. Stage in SCLC patients was only
specifically analysed for the regional and first national campaigns, for which the evidence was
mixed; a significant shift towards limited disease was observed in the regional campaign but
this was not significant for the first national campaign.

Be Clear on Cancer: Regional and national lung cancer awareness campaigns 2011 to 2014
112
5.9. Performance status
Performance status is a clinical assessment of the impact of the cancer on the patient’s ability
to carry out the normal activities of daily living. Performance status is recorded by NCRAS and
the NLCA using the World Health Organization (WHO) and Eastern Cooperative Oncology
Group (ECOG) grading system (details given in appendix 38). In this classification performance
status is split into three groups: 0 and 1; 2; 3 and 4, with 0 and 1 by convention being grouped
together as being the best prognostic groups. Many treatments, especially chemotherapy and
combination therapies, are limited to patients with a performance status of 0 or 1. Performance
status can deteriorate over time, so delays in reaching secondary care may well result in
patients becoming unfit for treatment, irrespective of the stage of disease. Performance status
data was well recorded in the NLCA and used in the analysis by Cancer Research UK of the
regional and first national campaigns. It was not analysed in the second and third national
campaigns because of a fall in data completeness.
5.9.1 Performance status in the regional campaign
For the regional campaign there was a slight increase (57.6% from 53.2%) in the proportion of
patients whose performance status was assessed as being 0 or 1 in pilot trusts during October
to December 2011, compared with the same period in 2010; with a consequent decline in those
assessed as 2, 3 or 4. However, this slight change in distribution of performance status was not
statistically significant. There was no difference between the time periods for the control trusts.
5.9.2 Performance status in the first national campaign
Table 29 shows the impact of the first national campaign on performance status distribution.
The proportion of patients diagnosed with lung cancer with performance status 0 or 1 did not
change for the campaign period (an increase of 1.5 percentage points which did not reach
statistical significance; p=0.075), whilst the proportion significantly decreased by 2.0
percentage points for the control period (p=0.019). The longer-term trends do not suggest a
clear pattern associated with the campaign period. For the first national campaign therefore,
there is no evidence of a major change in performance status at the time of presentation, but
there is a trend towards a better performance status in patients diagnosed in the period
following the campaign.

Be Clear on Cancer: Regional and national lung cancer awareness campaigns 2011 to 2014
113
Table 29. National campaign: performance status of lung cancer patients first seen during the campaign months and control months in 2011 and 2012 (Table 8, Ironmonger et al, 2015)
PS Group
Control period Campaign period
Cases
Change in proportion
p-value
Cases
Change in proportion
p-value
(% of known) (% of known)
February to April
2011
February to April
2012
May to July 2011
May to July 2012
0 and 1 3,576
(54.9%) 3,686
(52.9%) -2.0* 0.019
3,730 (54.8%)
4,283 (56.3%)
+1.5 0.075
2 1,342
(20.6%) 1,451
(20.8%) +0.2 0.758
1,339 (19.7%)
1,451 (19.1%)
-0.6 0.358
3 and 4 1,594
(24.5%) 1,831
(26.3%) +1.8* 0.017
1,739 (25.5%)
1,878 (24.7%)
-0.9 0.228
Total known
6,512 (100%)
6,968 (100%)
- - 6,808
(100%) 7,612
(100%) - -
Unknown 892
(12.0%) 667
(8.7%) -3.3* <0.001
831 (10.9%)
723 (8.7%)
-2.2* <0.001 (% of total)
TOTAL 7,404 7,636 - - 7,639 8,335 - -
*Statistically significant difference between 2011 and 2012 (two-sample test of proportions; <0.05)
5.9.3 Summary of performance status findings
Performance status was only analysed with respect to the regional and first national
campaigns. There was a non-statistically significant trend towards better performance status at
diagnosis after the regional campaign and no evidence of a change over the period of the first
national campaign. There was, however, a trend towards a better performance status in
patients diagnosed in the period following the first national campaign.
5.10 Diagnostic imaging
5.10.1 Methods
Data from treating organisations was obtained from the DID, on the NHS Digital‘s iView system
(formerly known as the Health and Social Care Information Centre (HSCIC)), for the pilot area
and for the whole of England. The DID only includes data from April 2012 onwards, making
comparisons with 2011 and assessing the impact of the regional campaign impossible.
5.10.2 Methods used in first national campaign
Assessment of the first national campaign was carried out by analysts from Cancer Research
UK and NHS Digital. For that campaign the number of chest X-rays and CT scans including the

Be Clear on Cancer: Regional and national lung cancer awareness campaigns 2011 to 2014
114
thorax from all referral pathways, and those following a GP referral specifically, in May to July
2012 were compared with April 2012, after adjustment for the number of organisations
submitting data. No age cut-off was used. GP-referred investigations were further adjusted for
working days under the assumption that GPs only work these days; data for all investigations
were adjusted for all days in the month, as these include referrals from pathways used on both
working and non-working days.
5.10.3 Methods used in the second and third national campaigns
This analysis was carried out by NCRAS analysts who extracted the DID data for patients for
each calendar month to cover the period July 2012 to December 2014. The analysis was split
into patients aged 50 years or more and below 50. As a control, comparisons were made
between the campaign period plus one month, compared to the rest of the year in question. In
the following analyses, the National Interim Clinical Imaging Procedure (NICIP) codes from the
DID that were used are listed in appendix 6.1 and 6.2.
All imaging procedures were classed as referrals made by a GP or consultant for ‘Early cancer
diagnosis – Suspected Lung Cancer’ in the DID. Only chest X-rays (plain), chest and
abdominal CT scans and CT scans of chest were included for GPs referrals, all measures were
included for consultant referrals.
5.10.4 Results of the first national campaign on the level of diagnostic imaging tests
The number of CXRs following GP-referral increased following the campaign launch (table 30).
Specifically, the number of GP-referred chest X-rays increased by 18.6% in May to July 2012
compared with April 2012 with adjustment for working days (p<0.001). For comparison, the
number of chest X-rays from all referrals increased by 7.3% comparing May to July with April
2012 when adjusting for total number of days (p<0.001). Also, as a control comparison, for the
same period in 2013, GP-referred chest X-rays per working day decreased by 16.7% for May to
July compared with April (p<0.001).

Be Clear on Cancer: Regional and national lung cancer awareness campaigns 2011 to 2014
115
Table 30. First national campaign: number of chest X-rays and chest and/or abdomen CT scans, May/June/July compared with April, 2012 and 2013 (table 8, Ironmonger et al, 2015)
Number of tests
Tests/ Organisation/Day
% change
from April
p-value
Tests/ Organisation/ Working day
% change
from April
p-value
GP-Referred Chest X-Rays
2012
April 144,140 25.6 N/A - 40.4 N/A -
May to
July 566,045 32.8 28.3% <0.001 47.9 +18.6%* <0.001
2013
April 160,865 32.3 N/A - 46.1 N/A -
May to
July 404,115 26.7 -17.3%* <0.001 38.4 -16.7%* <0.001
All Chest X-Rays
2012 April 606,840 107.6 N/A - 169.9 N/A -
2013
April 600,385 120.6 N/A - 172.2 N/A -
May to
July 1,624,980 107.5 -10.8%* <0.001 154.5 -10.3%* <0.001
GP-Referred Chest and/or Abdomen CT Scans
2012
April 2,145 0.4 N/A - 0.6 N/A -
May to
July 8,215 0.5 +25.1%* <0.001 0.7 +15.7%* <0.001
2013
April 2,940 0.6 N/A - 0.8 N/A -
May to
July 8,360 0.6 -6.3%* 0.014 0.8 -5.8%* 0.025
All Chest and/or Abdomen CT Scans
2012
April 28,650 5.1 N/A - 8.0 N/A -
May to
July 98,455 5.7 +12.3%* <0.001 8.3 +3.8%* <0.001
2013
April 31,515 6.3 N/A - 9.0 N/A -
May to
July 92,580 6.1 -3.2%* <0.001 8.8 -2.6%* <0.001
*Statistically significant difference to April (with adjustment for number of organisations submitting data and
days/working days) (likelihood ratio test p<0.05)
The number of GP-referred CT scans per working day also increased, with an increase of
15.7% comparing May to July 2012 with April (from 0.6 to 0.7 per organisation per working day;
p<0.001). For comparison to a control trend, in 2013 there was a 5.8% decrease for May to July
compared with April (p=0.025).
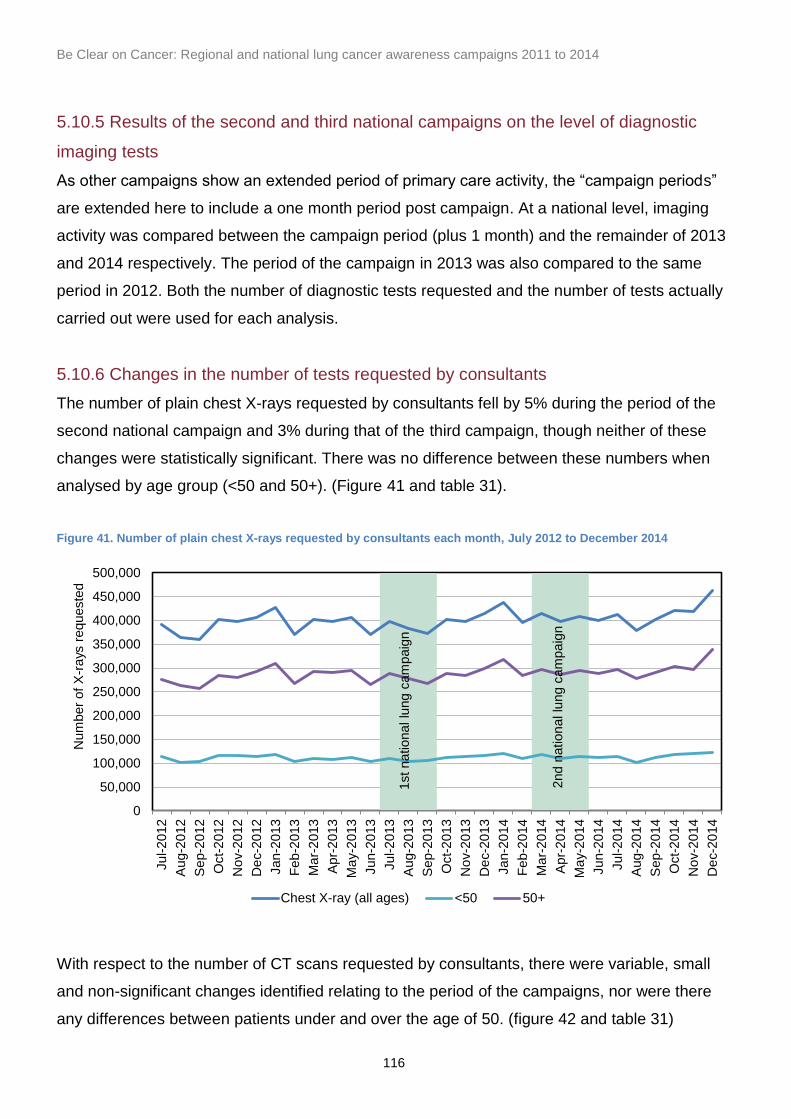
Be Clear on Cancer: Regional and national lung cancer awareness campaigns 2011 to 2014
116
5.10.5 Results of the second and third national campaigns on the level of diagnostic
imaging tests
As other campaigns show an extended period of primary care activity, the “campaign periods”
are extended here to include a one month period post campaign. At a national level, imaging
activity was compared between the campaign period (plus 1 month) and the remainder of 2013
and 2014 respectively. The period of the campaign in 2013 was also compared to the same
period in 2012. Both the number of diagnostic tests requested and the number of tests actually
carried out were used for each analysis.
5.10.6 Changes in the number of tests requested by consultants
The number of plain chest X-rays requested by consultants fell by 5% during the period of the
second national campaign and 3% during that of the third campaign, though neither of these
changes were statistically significant. There was no difference between these numbers when
analysed by age group (<50 and 50+). (Figure 41 and table 31).
Figure 41. Number of plain chest X-rays requested by consultants each month, July 2012 to December 2014
With respect to the number of CT scans requested by consultants, there were variable, small
and non-significant changes identified relating to the period of the campaigns, nor were there
any differences between patients under and over the age of 50. (figure 42 and table 31)
0
50,000
100,000
150,000
200,000
250,000
300,000
350,000
400,000
450,000
500,000
Jul-2
012
Aug-2
012
Sep-2
012
Oct-
2012
No
v-2
012
De
c-2
012
Jan-2
013
Feb
-2013
Ma
r-2
013
Apr-
2013
Ma
y-2
013
Jun-2
013
Jul-2
013
Aug-2
013
Sep-2
013
Oct-
2013
No
v-2
013
De
c-2
013
Jan-2
014
Feb
-2014
Ma
r-2
014
Apr-
2014
Ma
y-2
014
Jun-2
014
Jul-2
014
Aug-2
014
Sep-2
014
Oct-
2014
No
v-2
014
De
c-2
014
Num
ber
of
X-r
ays
requeste
d
Chest X-ray (all ages) <50 50+
1st national lu
ng c
am
paig
n
2nd n
ation
al lu
ng c
am
pa
ign

Be Clear on Cancer: Regional and national lung cancer awareness campaigns 2011 to 2014
117
Figure 42. Number of CT scans requested by consultants each month, July 2012 to December 2014
Table 31. Number of requests for chest X-rays and CT scans from consultants, for campaign periods and the remainder of the respective years
Test
Campaign period (July to
September 2013)
Rest of
2013
% change
2013
Campaign period
(March to April 2014)
Rest of
2014
% change
2014
Plain chest X-rays (<50) 3,468 3,654 -5% 3,736 3,788 -1%
Plain chest X-rays (50+) 9,072 9,493 -4% 9,541 9,881 -3%
Plain chest X-rays (all ages) 12,540 13,146 -5% 13,277 13,669 -3%
All CT scans (<50) 14 14 3% 16 18 -7%
All CT scans (50+) 58 54 9% 63 70 -10%
All CT scans (all ages) 145 135 7% 160 176 -9%
The number of CT scans requested by consultants was also analysed by whether they were
contrast or non-contrast-enhanced. The reason for this is that contrast-enhanced scans are
only done where there is a significant abnormality on the plain chest X-rays or non-contrast
scan, so the numbers would be more closely related to the numbers of definite new cases of
lung cancer than with non-contrast CTs. All but a very tiny minority of scans were contrast-
enhanced, as shown in Figure 43.
0
1,000
2,000
3,000
4,000
5,000
6,000
7,000Jul-2
012
Aug-2
012
Sep-2
012
Oct-
2012
No
v-2
012
De
c-2
012
Jan-2
013
Feb
-2013
Ma
r-2
013
Apr-
2013
Ma
y-2
013
Jun-2
013
Jul-2
013
Aug-2
013
Sep-2
013
Oct-
2013
No
v-2
013
De
c-2
013
Jan-2
014
Feb
-2014
Ma
r-2
014
Apr-
2014
Ma
y-2
014
Jun-2
014
Jul-2
014
Aug-2
014
Sep-2
014
Oct-
2014
No
v-2
014
De
c-2
014
Num
ber
of
CT
scans r
equeste
d
CT scans (all ages) <50 50+
1st nation
al lu
ng c
am
pa
ign
2nd n
ation
al lu
ng c
am
pa
ign

Be Clear on Cancer: Regional and national lung cancer awareness campaigns 2011 to 2014
118
Figure 43. Number of CT scans, with and without contrast enhancement requested by consultants each month, July 2012 to December 2014
5.10.7 Changes in the number of tests requested by GPs
For the second national campaign the number of chest X-rays carried out by GPs during the
campaign was compared with those requested in the same period a year earlier. The number
of plain chest X-rays fell by a monthly average of 11% between the campaign period in 2013
(n=7570) and its equivalent in 2012 (n=6730) but this is not a statistically significant decrease.
The monthly average of the number of chest X-rays requested by GPs over the period covering
the second and third national campaigns is shown in figure 44 and table 32.
0
1,000
2,000
3,000
4,000
5,000
6,000
7,000
Jul-2
012
Aug-2
012
Sep-2
012
Oct-
2012
No
v-2
012
De
c-2
012
Jan-2
013
Feb
-2013
Ma
r-2
013
Apr-
2013
Ma
y-2
013
Jun-2
013
Jul-2
013
Aug-2
013
Sep-2
013
Oct-
2013
No
v-2
013
De
c-2
013
Jan-2
014
Feb
-2014
Ma
r-2
014
Apr-
2014
Ma
y-2
014
Jun-2
014
Jul-2
014
Aug-2
014
Sep-2
014
Oct-
2014
No
v-2
014
De
c-2
014
Num
ber
of
CT
scans r
equeste
d
CT with contrast (all ages) CT without contrast (all ages)
2n
d n
ati
on
al lu
ng
cam
paig
n
1st
nati
on
al lu
ng
cam
paig
n

Be Clear on Cancer: Regional and national lung cancer awareness campaigns 2011 to 2014
119
Figure 44. Number of plain chest X-rays per working day requested by GPs each month, July 2012 to December 2014
Table 32. Average number of requests for chest X-rays from GPs for the periods of the second and third national campaigns (+ 1 month) compared with the remainder of the respective years
Test
Campaign period (July to
September 2013)
Rest of
2013
% change
2013
Campaign period
(March to April 2014)
Rest of
2014
% change
2014
Plain chest X-rays (<50) 1,641 1,969 -17% 2,416 2,027 19%
Plain chest X-rays (50+) 4,622 5,098 -9% 6,374 5,191 23%
Plain chest X-rays (all ages)
6,264 7,067 -11% 8,790 7,219 22%
The number of CT scans requested by GPs is very much smaller than those requested by
consultants (<2% of their rate) but there does appear to have been an increase in these
numbers over the period between mid 2012 to the end of 2014, though no clear evidence of a
positive relationship to the campaign periods. This is illustrated graphically in figure 45
0
1,000
2,000
3,000
4,000
5,000
6,000
7,000
8,000
9,000
10,000Jul-2
012
Aug-2
012
Sep-2
012
Oct-
2012
No
v-2
012
De
c-2
012
Jan-2
013
Feb
-2013
Ma
r-2
013
Apr-
2013
Ma
y-2
013
Jun-2
013
Jul-2
013
Aug-2
013
Sep-2
013
Oct-
2013
No
v-2
013
De
c-2
013
Jan-2
014
Fe
b-2
014
Ma
r-2
014
Apr-
2014
Ma
y-2
014
Jun-2
014
Jul-2
014
Aug-2
014
Sep-2
014
Oct-
2014
No
v-2
014
De
c-2
014
Num
ber
of
pla
in c
hest
X-r
ays
requeste
d
Chest X-ray (all ages) <50 50+
1st
nati
on
al lu
ng
cam
paig
n
2n
d n
ati
on
al lu
ng
cam
paig
n

Be Clear on Cancer: Regional and national lung cancer awareness campaigns 2011 to 2014
120
Figure 45. Total (unadjusted for working days) number of CT scans, with and without contrast enhancement requested by GPs per month, July 2012 to December 2014.
5.10.8 Summary of diagnostic imaging findings
Since the collection of the DID only began in 2012, no data is available to evaluate the impact
of the regional campaign on imaging and, the quality and completeness of the data is likely to
have changed over the period of analysis. To complicate things further, the analysis of the first,
second and third national campaigns were carried out by different groups and used slightly
different groups of CT scan codes, which makes direct comparison difficult; however it is
unlikely that a major change has gone undetected.
Following the first national campaign there were significant increases in requests for chest X-
rays and CT scans both by GPs and consultants, the most notable was an increase in the
number of GP requested chest X-rays of 18.6% (p<0.001) and an overall increase of 12.3% in
CT scan requests. Since CTs were mostly only carried out where there was an abnormality on
the chest X-rays, this implies a high detection rate of patients with clinically significant
problems, whether cancer or not.
Following the second or third national campaign there were no statistically significant changes
in any of the imaging test numbers that could be related directly to the campaign periods, either
those requested by GPs or by consultants. There was no difference in the impact on patients
0
20
40
60
80
100
120
140
160
Jul-2
012
Aug-2
012
Sep-2
012
Oct-
2012
No
v-2
012
De
c-2
012
Jan-2
013
Feb
-2013
Ma
r-2
013
Apr-
2013
Ma
y-2
013
Jun-2
013
Jul-2
013
Aug-2
013
Sep-2
013
Oct-
2013
No
v-2
013
De
c-2
013
Jan-2
014
Feb
-2014
Ma
r-2
014
Apr-
2014
Ma
y-2
014
Jun-2
014
Jul-2
014
Aug-2
014
Sep-2
014
Oct-
2014
No
v-2
014
De
c-2
014
Num
ber
of
CT
scans r
equeste
d
CT scans (all ages)
1st
nati
on
al lu
ng
cam
paig
n
2n
d n
ati
on
al lu
ng
cam
paig
n

Be Clear on Cancer: Regional and national lung cancer awareness campaigns 2011 to 2014
121
over or under the ages of 50. There was however a steady trend of an increasing number of CT
scans as requested both by consultants and by GPs over the period between mid 2012 and the
end of 2014. The absolute number of CT scans being requested by GPs was less than 2% of
those requested by consultants.
5.11 Treatment
5.11.1 Regional and first national campaigns
Cancer Research UK analysed first treatment following the regional and first national
campaigns and used data from the NLCA. This data set includes details of first treatment
modality as recorded by the MDT. This preceded the availability of data on radiotherapy and
systemic therapies as are now collected in the Radiotherapy dataset (RTDS) and Systemic
anti-cancer therapy (SACT) dataset respectively.
A greater proportion of lung cancer patients received surgical resection as a first definitive
treatment following the launch of both the regional and first national campaigns (tables 33 and
34). The proportion increased following the regional campaign by 3.6% and the first national
campaign by 2.3 percentage points for the campaign period (from 13.7% to 16.0%, p<0.001; a
proportional increase of 17.0%), with no evidence of a change for the control period (p=0.425).
There were no statistically significant changes in any other treatment rates following the
regional campaign. However after the first national campaign the proportion of patients
receiving any active anti-cancer treatment (surgery, chemotherapy, or radiotherapy) increased
by 1.9% and the proportion receiving only palliative care fell by the same proportion (p<0.001),
there were no significant changes in the control periods (table 5.31).

Be Clear on Cancer: Regional and national lung cancer awareness campaigns 2011 to 2014
122
Table 33. Regional campaign: first definitive treatment received for the campaign months of October to December 2011 and October to December 2010 for the pilot and control areas (Table S9, Ironmonger et al, 2015)
First Definitive
Treatment1
Control Area (n=141 trusts) Pilot Area (n=32 trusts)
Number of cases
Change in proportion
p-value
Number of cases
Change in proportion
p-value
(% of all cases) (% of all cases)
October to
December 2010
October to
December 2011
October to
December 2010
October to
December 2011
Surgery 618
(11.8%) 696
(12.7%) +0.9 0.160
180 (12.4%)
264 (16.0%)
+3.6* 0.005
Chemotherapy 1213
(23.2%) 1369
(25.0%) +1.8* 0.029
334 (23.1%)
384 (23.3%)
+0.2 0.901
Radiotherapy 944
(18.1%) 956
(17.5%) -0.6 0.420
291 (20.1%)
296 (18.0%)
-2.2 0.124
Palliative care/ active
monitoring
1,857 (35.5%)
1,912 (34.9%)
-0.6 0.517 526
(36.4%) 577
(35.0%) -1.4 0.422
Any Treatment2
4565 (87.4%)
4851 (88.6%)
+1.3* 0.041 1319
(91.2%) 1511
(91.6%) +0.4 0.681
No Treatment3 661
(12.6%) 622
(11.4%) -1. 3* 0.041
127 (8.8%)
138 (8.4%)
-0.4 0.681
Total 5226
(100%) 5473
(100%) - -
1446 (100%)
1649 (100%)
- -
1 Note that patients are counted more than once if they have multiple treatment types on the same earliest
treatment date 2 Number of patients receiving any treatment (surgery, chemotherapy, radiotherapy, palliative care or active
monitoring) 3 Patients with no treatment type recorded in the database. However, some patients may have had treatment that
has not been recorded *Statistically significant difference between 2010 and 2011 (two-sample test of proportions; p<0.05)

Be Clear on Cancer: Regional and national lung cancer awareness campaigns 2011 to 2014
123
Table 34. National campaign: first definitive treatment received for lung cancer for the campaign and control period (Table 7, Ironmonger et al, 2015)
First Definitive
Treatment1
Control period Campaign period
Number of cases
Change in proportion
p-value
Number of cases
Change in proportion
p-value
(% of all cases) (% of all cases)
February to April
2011
February to April
2012
May to July 2011
May to July 2012
Surgery 1,076 1,145
0.5 0.425 1,043 1,331
+2.3* <0.001 (14.5%) (15.0%) (13.7%) (16.0%)
Chemotherapy 1,909 1,930
-0.5 0.475 1,875 2,150
+1.2 0.069 (25.8%) (25.3%) (24.5%) (25.8%)
Radiotherapy 1,366 1,354
-0.7 0.253 1,410 1,462
-0.9 0.132 (18.4%) (17.7%) (18.5%) (17.5%)
Palliative care/ active
monitoring
2,469 2,709
+2.2* 0.006
2,661 2,817
-1 0.168 (33.3%) (35.5%) (34.8%) (33.8%)
Any 'Active Anti-Cancer Treatment2
6,752 7,014
0.7 0.146
6,890 7,675
+1.9* <0.001 (91.2%) (91.9%) (90.2%) (92.1%)
No Treatment3 652 622
-0.7 0.146 749 660
-1.9* <0.001 (8.8%) (8.1%) (9.8%) (7.9%)
Total 7,404 7,636
- - 7,639 8,335
- - (100%) (100%) (100%) (100%)
1 Patients are counted more than once if they have multiple treatment types on the same earliest treatment date.
2 Number of patients receiving any treatment (surgery, chemotherapy, radiotherapy, palliative care or active
monitoring). 3 Patients with no treatment type recorded in the database. However, some patients may have had treatment that
has not been recorded. *Statistically significant difference between 2011 and 2012 (two-sample test of proportions; p<0.05)
The proportion receiving surgical resection appeared to return to pre-campaign trends by
around September 2012 (figure 46).

Be Clear on Cancer: Regional and national lung cancer awareness campaigns 2011 to 2014
124
Figure 46. Monthly proportion of patients diagnosed with lung cancer receiving resection as a first definitive treatment, England Jan 2010 to Dec 2012 (by month first seen for lung cancer)
An independent analysis of HES records by DH came to similar conclusions (figure 47).
Figure 47. Number of surgical resections for lung cancer by month 2009 to 2013
Source: HES – David Hansell, DH.
0%
2%
4%
6%
8%
10%
12%
14%
16%
18%
Jan Feb Mar Apr May Jun Jul Aug Sep Oct Nov Dec
% r
eceiv
ing
re
sectio
n
Month first seen
2010 2011 2012
1st n
atio
na
l lu
ng
ca
mp
aig
n
0
100
200
300
400
500
600
Apr-
2009
Jun-2
009
Aug-2
009
Oct-
2009
De
c-2
009
Feb
-2010
Apr-
2010
Jun-2
010
Aug-2
010
Oct-
2010
De
c-2
010
Feb
-2011
Apr-
2011
Jun-2
011
Aug-2
011
Oct-
2011
De
c-2
011
Feb
-2012
Apr-
2012
Jun-2
012
Aug-2
012
Oct-
2012
De
c-2
012
Feb
-2013
No o
f re
sections
Month of resection
1st
nat
ion
al lu
ng
cam
pai
gn

Be Clear on Cancer: Regional and national lung cancer awareness campaigns 2011 to 2014
125
What is also interesting and important about this analysis is that the resection numbers did not
fall in the months after the post-campaign peak showing that the overall number of surgical
resections was higher that year.
5.11.2 Second and third national campaigns
NCRAS analysts examined the number of lung resections carried out by month in 2012 to 2014
from HES data using a list of OPCS 4 surgical codes relating to potentially curative procedures
in patients diagnosed with lung cancer. Resections were only counted if they were within one
month before or six months after diagnosis. Figure 48 shows the number of procedures by
month and year in relation to the timings of the three national campaigns. From this, there
appears to be an increase in resection in the periods following the first and third national
campaigns, but no obvious change after the second national campaign.
Figure 48. Number of potentially curative surgical operations in lung cancer patient recorded in HES by month 2012 to 2014 in relation to campaign periods
5.11.3 Summary of impact on treatment
There is good evidence of a statistically and clinically significant increase in surgical resection
rate associated with both the regional and first national campaigns. In absolute terms the
increase after the first national campaign was 2.3%, a relative increase of 17%. These analyses
0
100
200
300
400
500
600
Jan-2
012
Ma
r-2
012
Ma
y-2
012
Jul-2
012
Sep-2
012
No
v-2
012
Jan-2
013
Ma
r-2
013
Ma
y-2
013
Jul-2
013
Sep-2
013
No
v-2
013
Jan-2
014
Ma
r-2
014
Ma
y-2
014
Jul-2
014
Sep-2
014
No
v-2
014
No o
f re
sections
Month of resection
2n
d n
atio
nal
lun
g ca
mp
aign
3rd
nat
ion
al lu
ng
cam
pai
gn
1st
nat
ion
al lu
ng
cam
pai
gn

Be Clear on Cancer: Regional and national lung cancer awareness campaigns 2011 to 2014
126
were largely based on the NLCA data, but confirmatory evidence was seen using OPCS4
codes from HES analysed independently by DH. Further analysis using HES linked to cancer
registry data suggests that there was an increase in surgical resections after the first and third
national campaigns, but not after the second national campaign.
Treatments other than surgery were only examined after the regional and first national
campaigns and there is evidence that those campaigns were associated with statistically
significant increase in overall active treatment rates and a fall in the proportion of people
receiving only palliative treatments.
5.12 Survival
5.12.1 Regional campaign
Cancer Research UK examined 1-year survival rates relating to the regional campaign
(Ironmonger et al, 2015) based on data from the NLCA. They found that there were increases
in age-standardised 1-year crude survival rates over the period of the campaign. In the
intervention area there was a 4.0 percentage point increase (from 35.2% to 39.2%; p=0.024)
compared to a 2.0 percentage point increase (from 37.3% to 39.3%; p=0.034) in the control
area, but that there was no statistically significant difference (p=0.425) in these improvements
between the pilot and control areas (table 35).
Table 35. One year age-standardised survival rates by pilot vs ‘control’ trust for patients diagnosed during post the regional campaign (2011) compared with the previous year (2010)
Pilot area hospitals (n=32) ‘Control’ area Trusts (n=141)
October to December
2010
October to December
2011 Difference
p- value
October to
December 2010
October to December
2011 Difference
p- value
1-year survival
35.20% 39.20% 4% 0.02 37.30% 39.30% 2% 0.03
5.12.2 One year survival, first national campaign
Based on NCRAS data there was no difference in the 1-year survival rates of patients
diagnosed during the first national campaign and the month following it compared with patients
diagnosed in the rest of 2012 (Table 36).

Be Clear on Cancer: Regional and national lung cancer awareness campaigns 2011 to 2014
127
Table 36. Difference in age-standardised 1-year net survival rates in patients diagnosed during and in the month after the first national campaign 2012 compared with that of patients diagnosed in the rest of that year
Sex Standardisation Comparison of 1-year
survival estimates for May-July 2012 vs rest of year
Statistical significance
Male Age-Standardised +0.8% NSS
Female Age-Standardised -0.6% NSS
Persons Age-Standardised +0.24% NSS
5.12.3 One year survival, second national campaign
The 1-year net survival of patients diagnosed in the campaign period was numerically higher
(41.1%) than those diagnosed in the rest of the year (40.2%), but this did not reach statistical
significance. Females had a significantly higher 1-year net survival than males.
5.12.4 One year survival, third national campaign
The 1-year net survival of patients diagnosed in the campaign period was approximately the
same (41.0%) as those diagnosed in the rest of the year (41.2%). Females had a significantly
higher 1-year survival than males. One-year net survival for those aged 50 plus during the
campaign period was not significantly different to that outside of the campaign period.
As a control, the survival estimates were also compared to those diagnosed with lung cancer in
the previous year. This showed that the 1-year survival for lung cancer (2014) were not
significantly different than those diagnosed with lung cancer for the same time period in 2013.
5.12.5 Summary of impact on survival
No statistically significant increases in the proportions of patients surviving to 1 year post
diagnosis have been shown after the regional or any of the national campaigns. Women have a
significantly higher 1-year net survival compared to men, an observation that has been made in
many previous studies with regards to lung cancer.

Be Clear on Cancer: Regional and national lung cancer awareness campaigns 2011 to 2014
128
6. Appendices 2 – supplementary
information
Table 37. List of lung campaign related symptom Read codes
Read V2 Description Read
V3 Description
1712 Dry cough 171A. Chronic cough
1713 Productive cough -clear sputum H3101 Smokers' cough
1714 Productive cough -green sputum R062. [D]Cough
1715 Productive cough-yellow sputum X76I8 Dry cough
1716.11 Coughing up phlegm Xa2kc Persistent cough
1716 Productive cough NOS XaFwR Unexplained cough
1717 Night cough present XE0qn Cough
1719.11 Bronchial cough XM0Ch C/O - cough
1719 Chesty cough X76Hy Productive cough
171..12 Sputum - symptom X76I3 Sputum - symptom
171..11 C/O - cough X76IA Producing sputum
171..00 Cough 1719 Chesty cough
171A. Chronic cough 1719 Bronchial cough
171B.00 Persistent cough 171C. Morning cough
171C.00 Morning cough 171D. Evening cough
171D.00 Evening cough Xa4fN Barking cough
171E.00 Unexplained cough Xa7u8 Observation of cough
171F.00 Cough with fever Xa7u9 Brassy cough
171H.00 Difficulty in coughing up sputum Xa7uA Bovine cough
171J.00 Reflux cough Xa7uB Effective cough
171K.00 Barking cough Xa7uC Cough reflex
171Z.00 Cough symptom NOS XaIO1 Cough with fever
173B.00 Nocturnal cough / wheeze XaLCS Reflux cough
H3101 Smokers' cough XC07I Coughing - function
R062.00 [D]Cough
R0620 [D]Cough syncope
R0630 [D]Cough with haemorrhage
S120A00 Cough fracture
S127100 Cough fracture of ribs

Be Clear on Cancer: Regional and national lung cancer awareness campaigns 2011 to 2014
129
Table 38. Definition of performance status categories
Performance status N %
Fully active, able to carry on all pre-disease performance without restriction
0 8976 14.79
Restricted in physically strenuous activity but ambulatory and able to carry out work of a light or sedentary nature, eg, light house
work, office work
1 18026 29.70
Ambulatory and capable of all selfcare but unable to carry out any work activities. Up and about more than 50% of waking hours
2 12712 20.94
Capable of only limited selfcare, confined to bed or chair more than 50% of waking hours
3 12974 21.37
Completely disabled. Cannot carry out any selfcare. Totally confined to bed or chair
4 4435 7.31
Dead 5 3580 5.90
6.1 DID (NICIP) Imaging code list used in the analysis of the impact on
diagnostic imaging for the first national campaign
In the analyses of the impact on diagnostic imaging resulting from the first national campaign,
the following National Interim Clinical Imaging Procedure (NICIP) codes on the DID that were
used and grouped are as follows:
Chest X-ray plain (CXR plain): abdomen X-ray (XABDO), chest X-ray (XCHES), chest
and abdomen X-ray (XCHAB)
Chest and abdominal CT scan: CT abdomen (CABDO), CT chest high resolution
(CCHHR), CT chest high resolution (CHRC), CT chest with contrast (CCHEC)
CT scan of chest: CT chest high resolution (CCHHR), CT Chest high resolution (CHRC),
CT chest with contrast (CCHEC)
Chest and Abdominal CT scan with contrast: CT Abdomen with contrast (CABDOC), CT
chest/abdominal With Contrast (CCHEC)
Thorax and abdomen CT scan with contrast: CT Thorax (CCHES), CT thorax and
abdomen (CCABD), CT thorax and abdomen with contrast (CCABDC)
CT thorax with contrast: CT thorax with contrast (CCHESC)
All figures were classed as referrals made by a GP or consultant for ‘Early cancer diagnosis –
Suspected Lung Cancer’ in DID. Only CXR (plain), chest and abdominal CT scans and CT

Be Clear on Cancer: Regional and national lung cancer awareness campaigns 2011 to 2014
130
scan of chest were included for GPs referrals, all measures were included for consultant
referrals.
6.2 DID (NICIP) Imaging code list used in the analysis of the impact on
diagnostic imaging for the second and third national campaigns
CT scans without contrast enhancement
CHTA CT Head thorax and abdomen
CHTH CT Head and thorax
CHTAP CT Head thorax abdomen and pelvis
CHNTA CT Head neck thorax and abdomen
CLDTH CT Low dose thorax
CT scans with contrast enhancement
CHTAPC CT Head thorax abdominal pelvis with contrast
CHTHC CT Head and thorax with contrast
CHTHAC CT Head thorax abdomen with contrast
CNCAPC CT Neck thorax abdomen pelvis with contrast
CHNTAC CT Head neck thorax abdomen contrast
Plain X-rays:
XR Chest (XCHES)
XR Ribs Lt (XRIBL)
XR Ribs Rt (XRIBR)
XR Chest and abdomen ( XCHAB)
6.3 OPCS4 procedure code list (extracted from HES)
E391 Open excision of lesion of trachea
E398 Other specified partial excision of trachea
E399 Unspecified partial excision of trachea
E441 Excision of carina
E461 Sleeve resection of bronchus and anastomosis HFQ
E541 Total pneumonectomy, total removal of lung, Pneumonectomy NEC
E542 Bilobectomy of lung
E543 Lobectomy of lung
E544 Excision of segment of lung

Be Clear on Cancer: Regional and national lung cancer awareness campaigns 2011 to 2014
131
E545 Partial lobectomy of lung NEC
E548 Excision of lung, other specified
E549 Excision of lung, Unspecified
E552 Open excision of lesion of lung
E559 Open removal of lesion of lung, unspecified
T013 Excision of lesion of chest wall
T023 Insertion of prothesis into chest wall NEC
Table 39. List of campaign evaluation metrics and their descriptions
Metric Description
Campaign and cancer awareness tracking
Public awareness of the campaign messages
Cancer Waiting Times (CWT)
Two Week Wait referrals
Urgent GP referrals for suspected relevant cancers
Two week wait cancers
Relevant cancer diagnoses resulting from a two week wait referral (also known as 62 day
waits)
Conversion rates Percentage of two week wait
referrals resulting in a diagnosis of cancer
Detection rates Percentage of CWT recorded
cancer diagnoses which resulted from a two week wait referral
CWT cancers CWT recorded cancers (also
known as 31 day waits)
Emergency presentations Percentage of cancers diagnosed via an emergency presentation
route during campaign period compared with control period
Diagnostics in secondary care (DID)
• Chest X-ray (CXR plain) • CT scan (chest)
• CT scan (chest and abdomen)
Please see appendix 6.1 and 6.2
Cancers diagnosed (NCRAS) Number of relevant cancers diagnosed during campaign period
compared with control period
Stage at diagnosis Stage distribution of relevant cancers diagnosed during campaign
period compared with control period
One year survival One-year survival for patients with relevant cancers diagnosed during campaign year and previous years
Surgical resections Please see appendix 6.3
Specific Metrics - NLCA Please refer to Ironmonger et al, 2015