bc & upsilon at d0 - deutschlands größtes ... · c & upsilon at d0 leah welty-rieger ......
TRANSCRIPT

Bc & Upsilonat D0Leah Welty-RiegerIndiana UniversityQuarkonium Workshop 2007DESY, Hamburg

Outline• The Apparatus
• The Tevatron
• D0
• Upsilon physics and results• Polarization
• Bc physics & results• NEW! Lifetime
2

The Tevatron• ppbar collider• 1.96 TeV energy• 45 mi west of Chicago• Delivered > 3.0 fb-1
• Great location to train for a marathon, 6.5 miles around both rings
D0 Experiment
• The two analyses presented here cover 1.3 fb-1
3

The D0 Detector
~600 scientists~80 Institutions
20 countries
wear bright colors to show
up!
4

The D0 Detector
• 2 Tesla Solenoidal Magnetic Field
• Excellent coverage
• Muon system |η|<2
• Tracking system |η|<3
• Uranium liquid Argon calorimeter
• Robust muon triggers
5

Silicon Microvertex Tracker• 6 Central Barrels
– 8 Layers of Ladders
– Inner 4 barrels• All double-sided for 3D
reconstruction
– Outer 2 barrels• Half of the layers double-sided
• 12 Central ‘F’ Disks– Double-sided
– Radius : 2.6cm -10.0 cm
• 4 Forward ‘H’ Disks– Single-sided
– Radius : 9.5cm - 26 cm
– Tracking out to ~η=3
5 micron point resolution
6
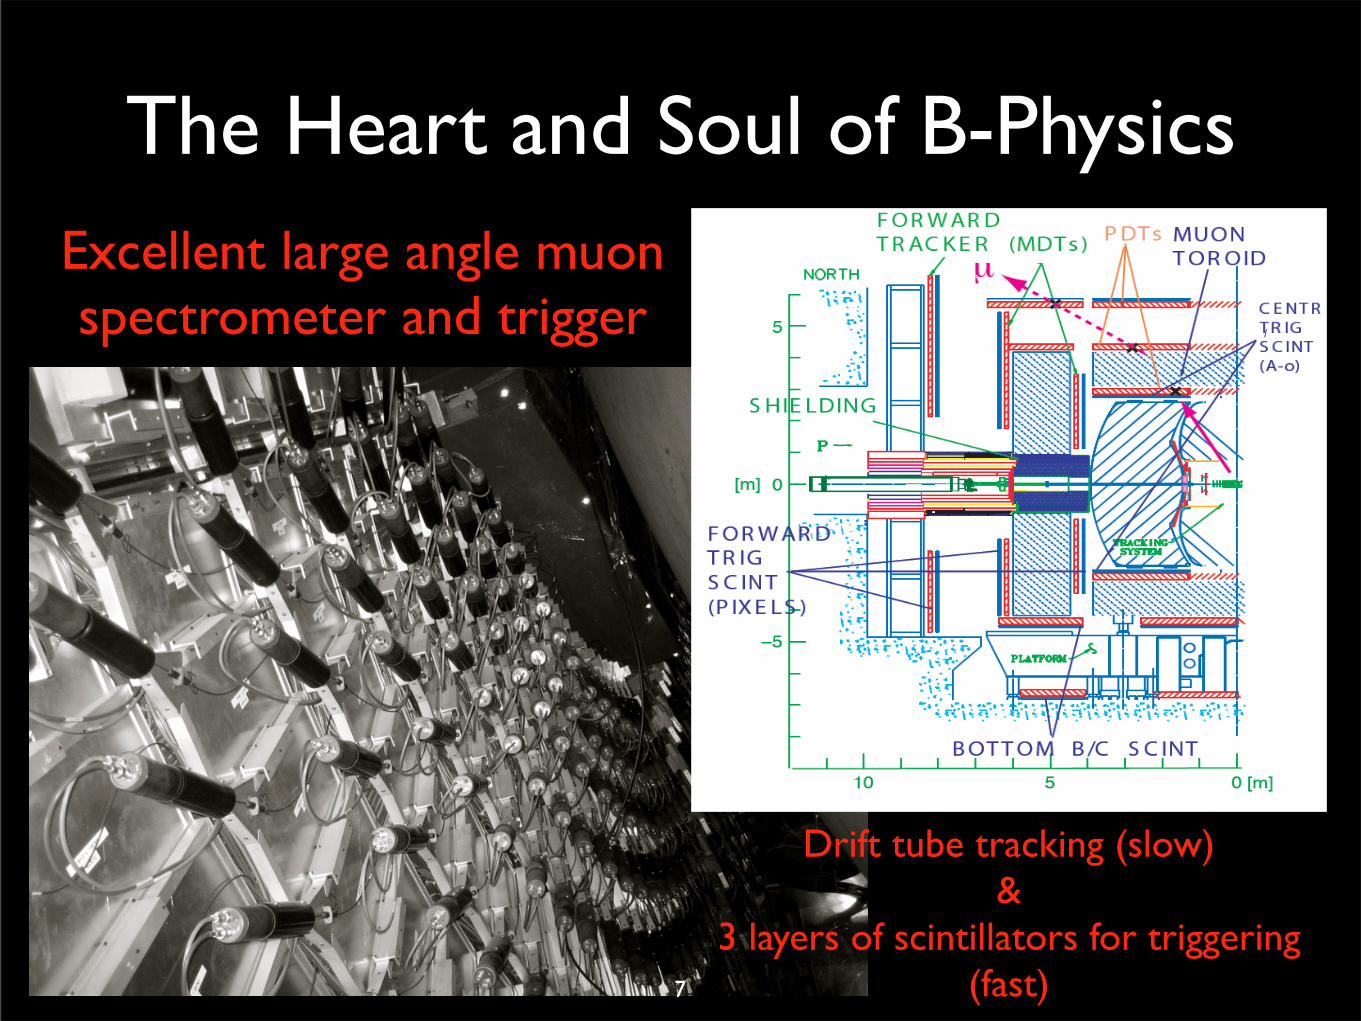
The Heart and Soul of B-PhysicsExcellent large angle muon spectrometer and trigger
Drift tube tracking (slow)&
3 layers of scintillators for triggering (fast)7

Upsilon Physics Outline• Motivation
• Data Selection
• Extraction of ϒsignal in cosθ* bins
• Polarization of ϒ(1S)
• Polarization of ϒ(2S)
• Conclusions
8

Motivation• NRQCD factorization developed to
describe inclusive quarkonium production and decay
• Prediction of NRQCD is S-Wave quarkonium produced in ppbar collisions should be transversely polarized at high pT
• Dominance of gluon fragmentation into quarkonium production at high pT
• Approximate heavy-quark symmetry of NRQCD
9

Motivation• Convenient measurement of polarization :
• σT : transverse polarized component of the cross section
• σL : longitudinal polarized component of the cross section
• When transverse polarization dominates, α→+1• When longitudinal polarization dominates, α→-1
10

Motivation• The variable ‘α’ fitted to the angular distribution of
the positive lepton in the center of mass frame w.r.t. the momentum of decaying particle in the lab system :
~1+αcos2(θ*)
ϒ(nS)
μ+μ- θ
11

J/ψ Polarization
CDF measurements of prompt J/ψ, disagrees with NRQCD predictions in the
high pT region
Run I
12

ϒ(nS) Polarization Predictions
Quantitative calculations of the polarization for inclusive ϒ(nS) mesons by NRQCD predictions for direct bottomonium production
(1)Transverse Polarization of ϒ(1S) should increase steadily for pT greater than 10GeV(2) The ϒ(2S) and ϒ(3S) should be even more strongly transversely polarized.
13
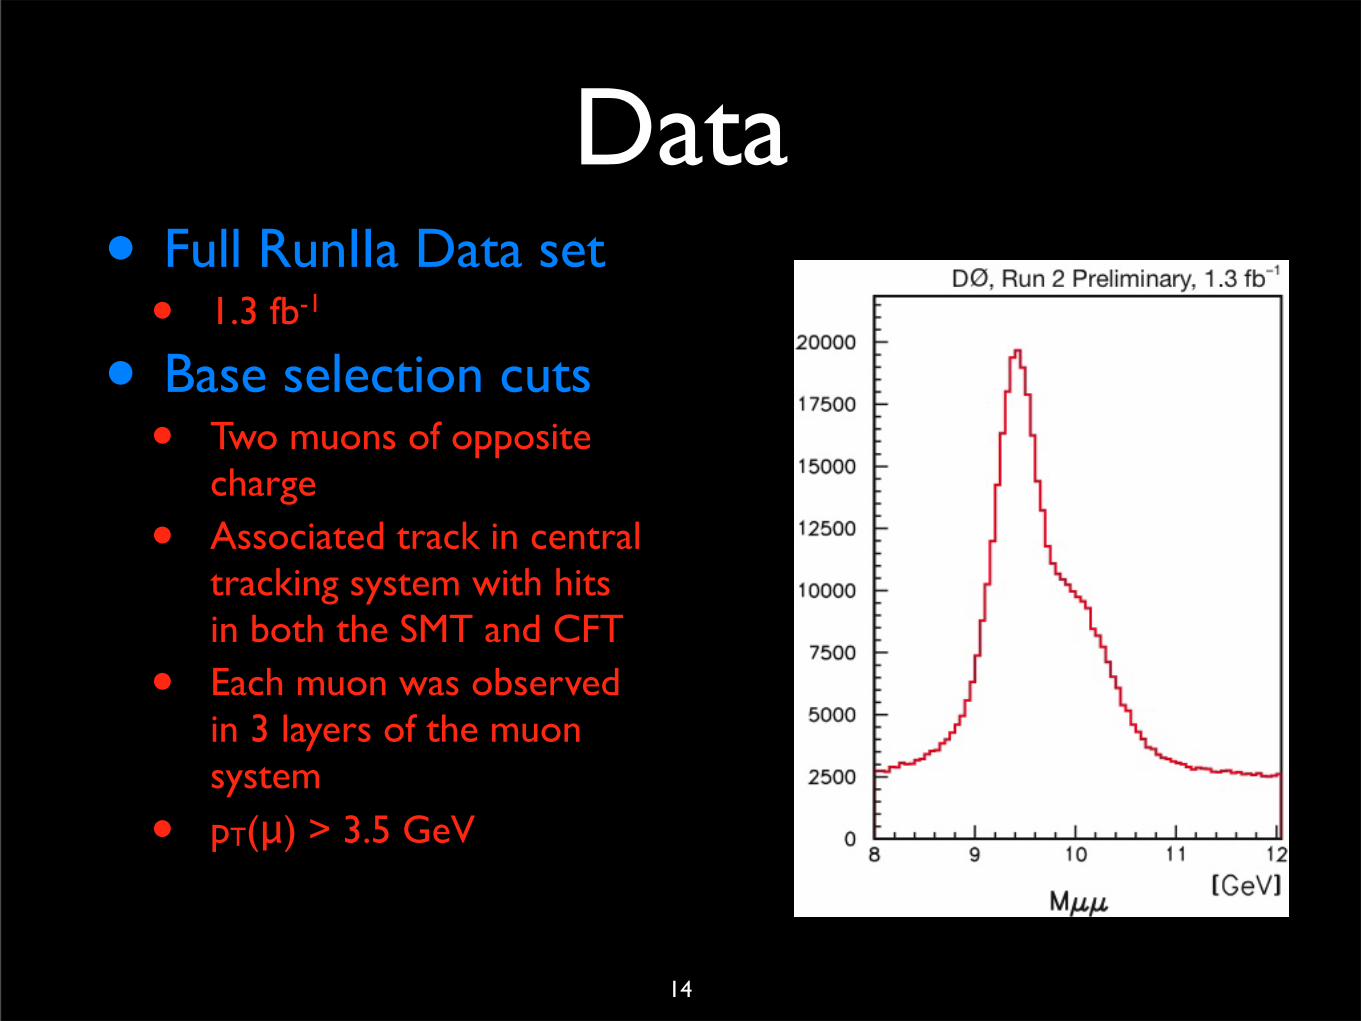
Data• Full RunIIa Data set
• 1.3 fb-1
• Base selection cuts• Two muons of opposite
charge
• Associated track in central tracking system with hits in both the SMT and CFT
• Each muon was observed in 3 layers of the muon system
• pT(μ) > 3.5 GeV
260000 events under the peak
14

Extraction of ϒ signal
• Mass differences, ΔMϒ(nS), were fixed and taken from PDG.
• Background model is convolution of an exponential and a polynomial function.
•Degree of the polynomial was chosen between 1 to 6 depending on the complexity of the background shape.
• δN2 = N2/N N2 Υ
• δ!2 = σ2/σ1 σ2
• ∆lrd
st nd
Υ rd 0.25Nσ3 = 2.2σ1
pT | cos θ∗ |
Υ(1S) Υ(2S) Υ(3S)
DØ, Run2 Preliminary , 1.3 fb!1
1
Υ 0.4 < | cos θ∗| < 0.5 10 < pΥT < 15 Υ(1S)!Υ(3S)
pΥT | cos θ∗|
Υ(1S) Υ(2S)pΥ
T Υ(3S)
ϒ(1S) ϒ(2S)
ϒ(3S)
10<pT(ϒ)<15 GeV0.4<cosθ*<0.5
15

Extraction of ϒ Signal
0<pT(ϒ)<1
1<pT(ϒ)<2
10<pT(ϒ)<15 Each bin of histogram is
separate fit in the data.
Binned in pT(ϒ)
pT(ϒ)>15
16
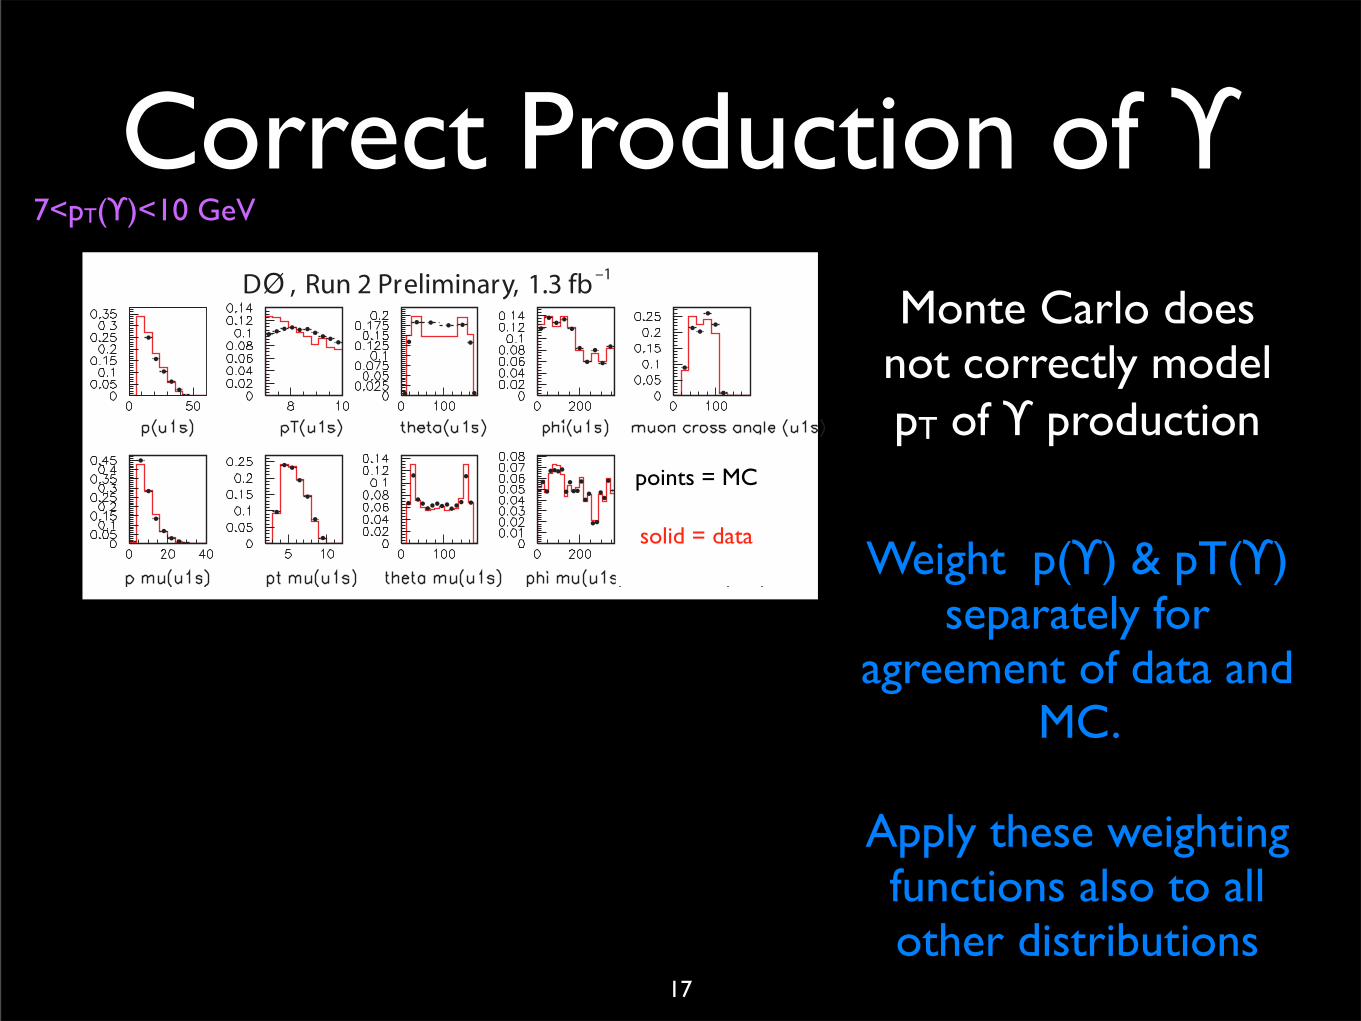
Correct Production of ϒ7<pT(ϒ)<10 GeV
Weight p(ϒ) & pT(ϒ) separately for
agreement of data and MC.
Apply these weighting functions also to all other distributions
Monte Carlo does not correctly model pT of ϒ production
D , Run 2 Preliminary, 1.3 fb –1
solid = data
points = MC
17

Correct Production of ϒ7<pT(ϒ)<10 GeV
Weight p(ϒ) & pT(ϒ) separately for
agreement of data and MC.
Apply these weighting functions also to all other distributions
Monte Carlo does not correctly model pT of ϒ production
D , Run 2 Preliminary, 1.3 fb –1
D , Run 2 Preliminary, 1.3 fb –1
solid = data
points = MC
17

Determining αAfter kinematic reweighting, scan
different values of α in MC (original α=0) and
minimize the χ2 between the data and MC to
obtain best value of α.
In this specific pT bin, α = -0.42
7<pT(ϒ)<10 GeV
D , Run 2 Preliminary, 1.3 fb –1
D , Run 2 Preliminary, 1.3 fb –1solid = data points = MC
18
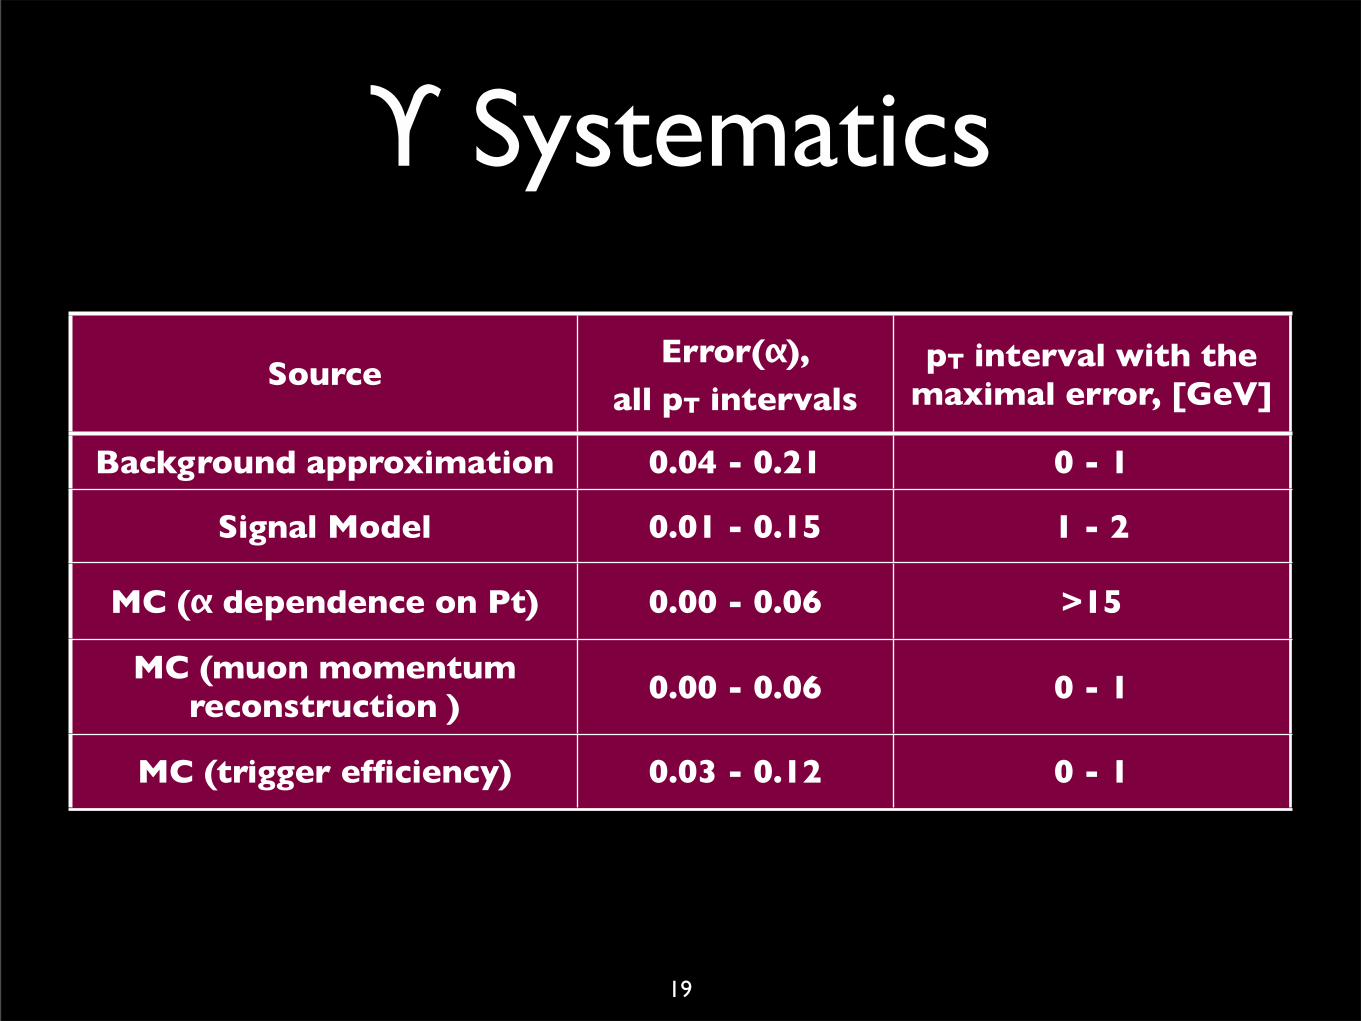
ϒ Systematics
SourceError(α),
all pT intervalspT interval with the
maximal error, [GeV]
Background approximation 0.04 - 0.21 0 - 1
Signal Model 0.01 - 0.15 1 - 2
MC (α dependence on Pt) 0.00 - 0.06 >15
MC (muon momentum reconstruction ) 0.00 - 0.06 0 - 1
MC (trigger efficiency) 0.03 - 0.12 0 - 1
19

| y |< 0.4 pT
pT
D , Run 2 Preliminary, 1.3 fb—1
α p!T !(1S)
kt
!(2S)
D , Run 2 Preliminary, 1.3 fb—1
| y |< 0.4 pT
pT
D , Run 2 Preliminary, 1.3 fb—1
! p!T !(1S)
kt
!(2S)
D , Run 2 Preliminary, 1.3 fb—1
Results
Yellow band is NRQCD prediction
Points : D0 DataGreen Triangles :
CDF Results
As pT increases, α increases, but not up
to the NRQCD Predictions
Strong longtudinal polarization at low pT.
20
ϒ(1S) ϒ(2S)

Results
Magenta Curves : Two limit cases of kt-factorization model
| y |< 0.4 pT
pT
D , Run 2 Preliminary, 1.3 fb—1
α p!T !(1S)
kt
!(2S)
D , Run 2 Preliminary, 1.3 fb—1
| y |< 0.4 pT
pT
D , Run 2 Preliminary, 1.3 fb—1
! p!T !(1S)
kt
!(2S)
D , Run 2 Preliminary, 1.3 fb—1
Points : D0 DataGreen Triangles :
CDF Results
quark-spin conservation hypothesis
full quark-spin depolarization
hypothesis
ϒ(1S) ϒ(2S)
21
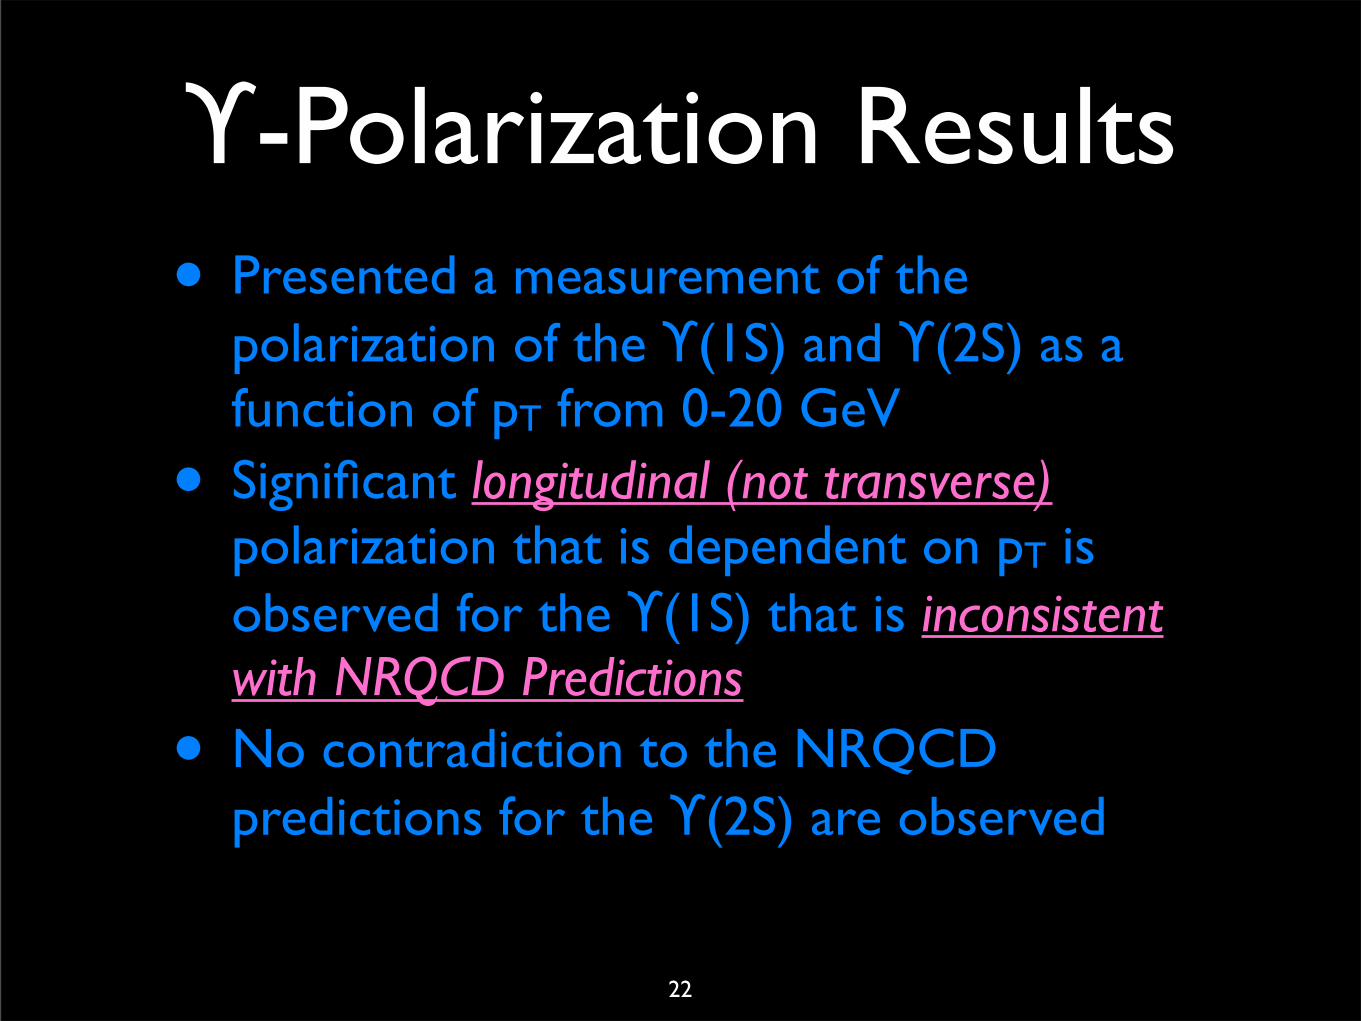
ϒ-Polarization Results• Presented a measurement of the
polarization of the ϒ(1S) and ϒ(2S) as a function of pT from 0-20 GeV
• Significant longitudinal (not transverse) polarization that is dependent on pT is observed for the ϒ(1S) that is inconsistent with NRQCD Predictions
• No contradiction to the NRQCD predictions for the ϒ(2S) are observed
22

Bc Physics• The Bc meson is the ground state of the bc system
• Unique in that it carries two heavy quarks
• Each can decay quickly
• Interesting System for HQET predictions
• Charmonium & Upsilon have two of the same, where as Bc has one of each
• Flavor carrying particle → Study Heavy Quark Dynamics
• Predicted to have a shorter lifetime than other B hadrons
PRL 97, 012002 2006
Preliminary OnlyD0 Note 4483
Theory, e.g., 0.48 +/- 0.05 ps (QCD Sum Rules)23

b quark spectatesb
c
b
sνl+
d
uorW+
π+
Bc+ Bs
νl+
c quark spectates
b
c
c
c
d
u
s
cor or
W+
π+ Ds+
Bc+ J/ψ
annihilation
b
cBc+
νl+
How does Bc Decay?

Bc Meson Lifetime• Lifetime measurement in the J/ψ+μ channel :
νl+
c quark spectates
b
c
c
c
d
u
s
cor or
W+
π+ Ds+
Bc+ J/ψ
μ+
μ- Specifically, look for μ+ here
25

Lifetime Analysis Outline• Data
• Sample
• Event Selection
• Contributions to the Data sample
• Demonstration of the Bc Signal• Presence of Bc
• Demonstration of short signal lifetime
• Lifetime Analysis• Process
• Results
• Conclusions26

Data Sample• Use all of the RunIIa data set taken
between 2002-2006• Corresponds to ~1.3 fb-1 of data
• General Idea - Two Sets of Data pulled out• J/ψ associated with any other track
• J/ψ associated with a muon• Notice that this is a subset
• Then apply more stringent cuts on each sample
Bcmu3
mu1
mu2
J/ψ
27

Event SelectionPreselection
• p(J/ψ) > 4
• Each muon must have 1 hit in the SMT• μ3 must have two
• pT(μ3)>2GeV
• SV(χ2)<100
• J/ψ + μ χ2 <49
Selection• pT(μ3) > 3 GeV
• p(μ3)>4 GeV
• pT(J/ψμ) > 5 GeV
• χ2 <16
• nseg(μ3)=3
• Cos(θ) btwn any two muons <0.99
• |sctime(A)|<10ns
• IP Biased Removed
• Angle btwn J/ψ & μ < 1 rad
Bcmu3
mu1
mu2
J/ψ
28

Contributions• Real J/ψ + Fake μ
• J/ψ + Track Data
• Fake J/ψ + Real μ• J/ψ Sideband Data
• Real J/ψ + Real μ• But each coming
from different particle decays
• J/ψ QCD Monte Carlo
• Prompt (i.e. J/ψ from cc(bar))• Negative Decay
length J/ψ + μ Data
• B+• B+→J/ψ+K+
• (K+→μ+ν)
• Signal• Bc Signal Monte
Carlo
decay in flight
29

Demonstration of SignalCutting on Decay Length Significance
mass3 4 5 6 7 8 9 10
Even
ts /
( 0.2
3333
3 )
0
20
40
60
80
100
120
140
160
180
mass3 4 5 6 7 8 9 10
Even
ts /
( 0.2
3333
3 )
0
20
40
60
80
100
120
140
160
180 Signal MC!J/
Prompt + Track!J/
M(JpsiMu) DLS>4
Prob of sig. to fluctuate down to bkg = 6.4σ
Prob. of bkg to fluctuate up to signal or more > 5σ
30
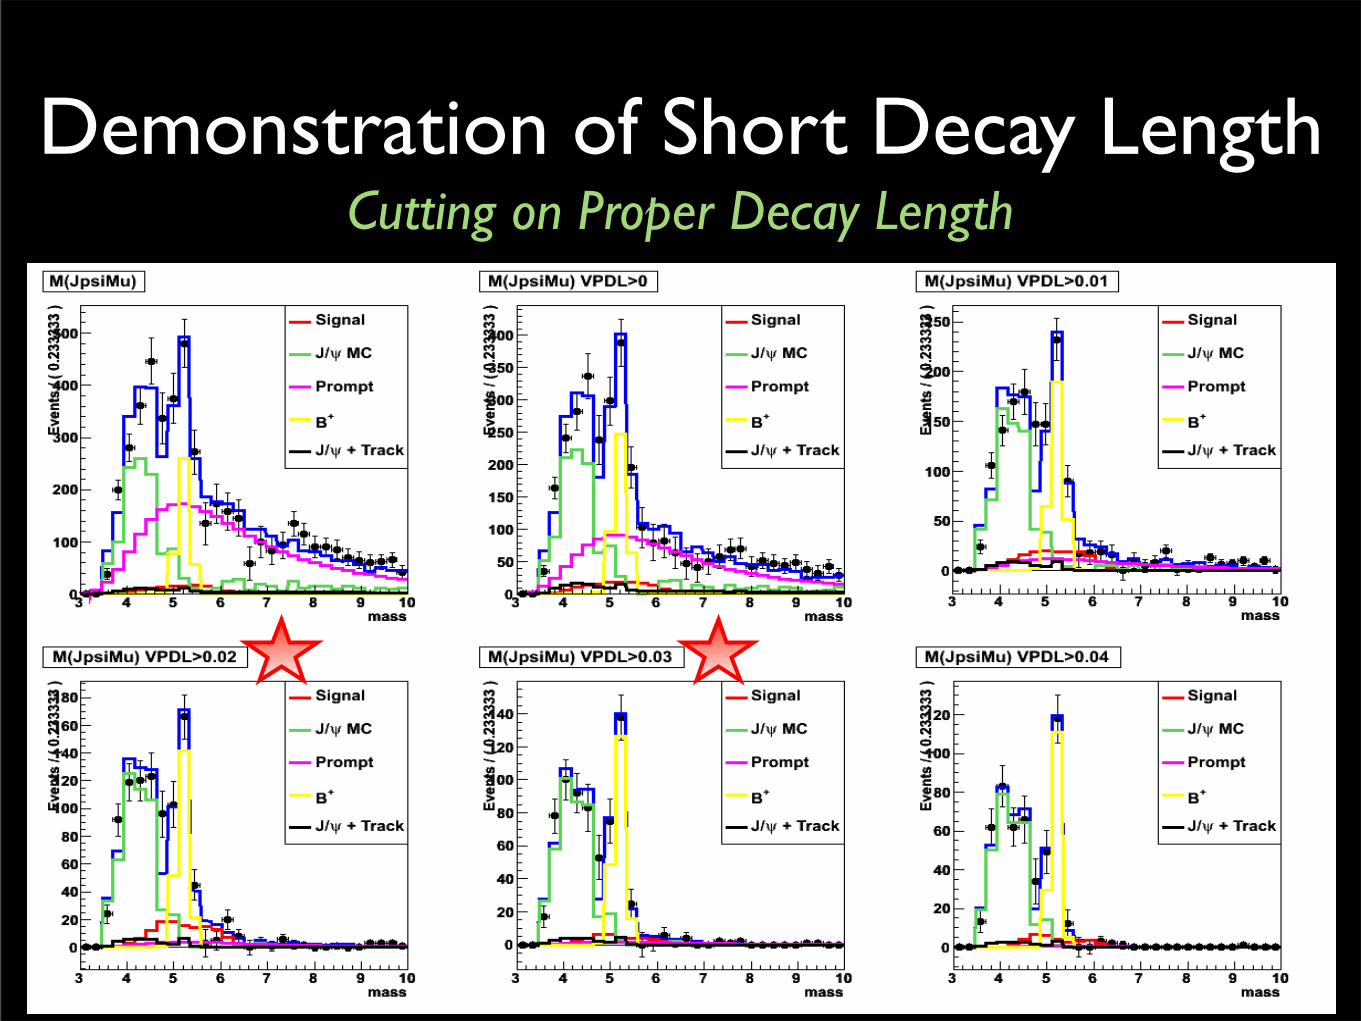
Demonstration of Short Decay LengthCutting on Proper Decay Length
31

Lifetime Analysis
€
L = f jtrkFJtrki + (1− f jtrk )FJmu
i( )i∏
Minimize the Log-Likelihood!
Each component consists of a normalized PDF of lifetime and mass multiplied together and the total is minimized
€
FJmui = fSBFSB
i +
(1− fSB )( f sigFsigi + fJMC
i FJMCi + fBpFBp
i +
(1− fsig − fJMC − fBp )FPRi )

Lifetime Analysis
N(Signal Events) = 856 ± 85 (stat)
Previous D0 Result
Current CDF Result
Total Fitµ SB + !J/
Prompt MCµ!J/
Signal + Trk!J/
B+
PPDL (cm)-0.1 -0.05 0 0.05 0.1 0.15 0.2 0.25 0.3-110
1
10
210
310
410
PPDL in JpsiMu Data
M(J/ψμ)33

Systematics• Decay model of Signal
• Phase space instead of Isgur-Wise (ISGW2)• Changes signal mass model & K factor
• MC weighting• Changes signal, ψ(2S), J/ψ MC mass model & K factor• Vary pT(Bc) within theoretical uncertainties (vary scale μ)
• Alignment• Reconstruct the MC using a new geometry file where silicon
sensors are moved around within alignment uncertainty (as in the Bs lifetime)
• Measure the lifetime in each sample and find the difference between the two.
• J/ψ MC mass distribution• Use only events which originated from a B0 or B+
• i.e. rough equivalent of large composition variations• Also covers uncertainty in g→bb(bar) measured by CDF
• B+ Mass distribution• Vary the background fit in the B+ fit
34
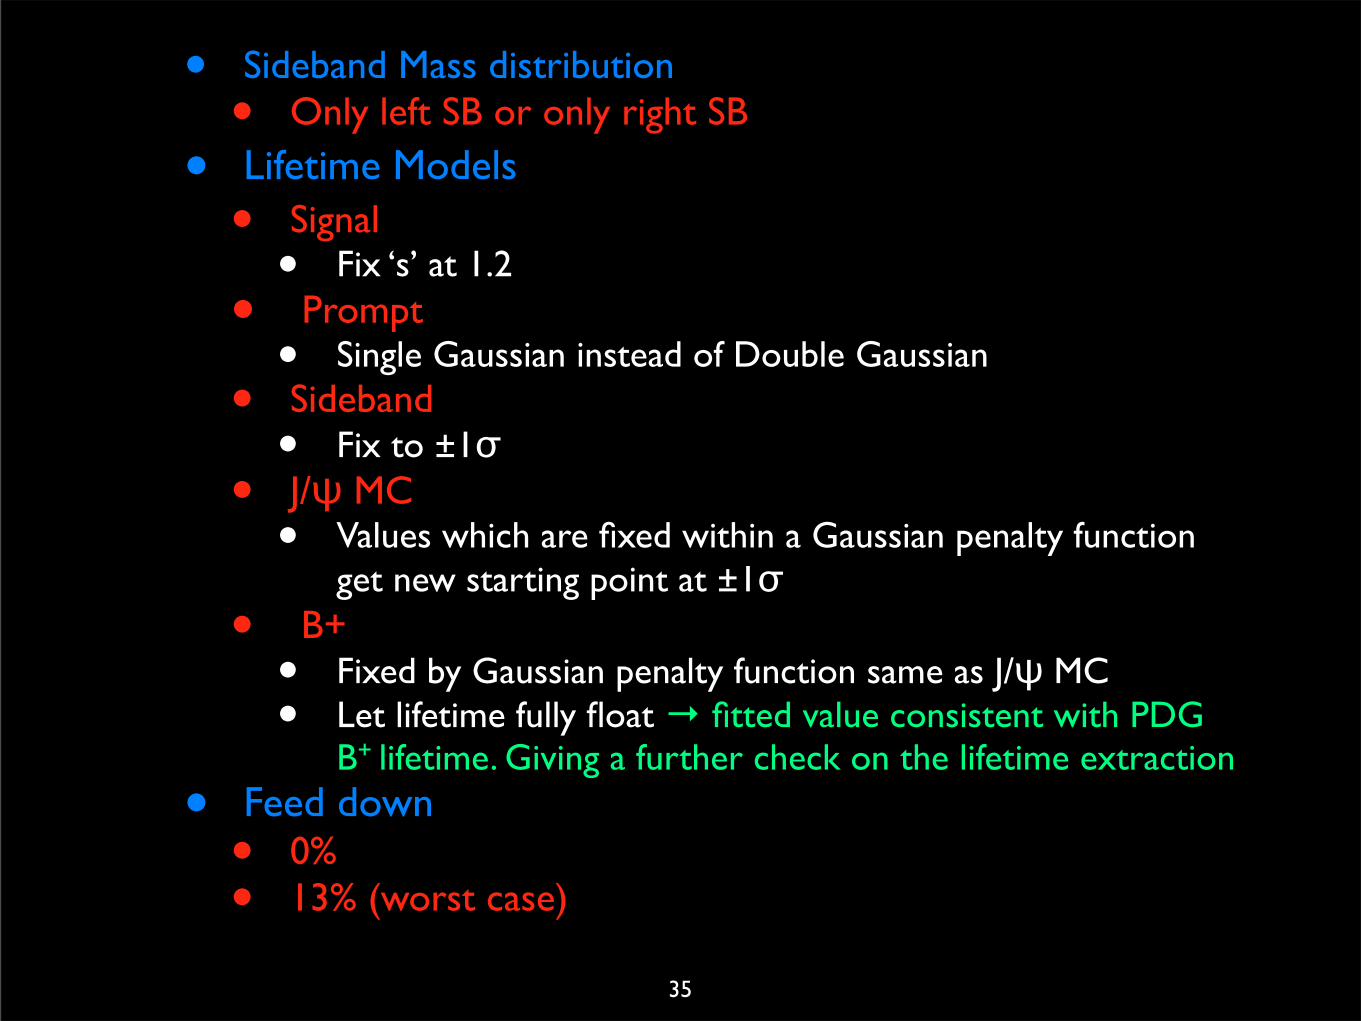
• Sideband Mass distribution• Only left SB or only right SB
• Lifetime Models
• Signal• Fix ‘s’ at 1.2
• Prompt• Single Gaussian instead of Double Gaussian
• Sideband• Fix to ±1σ
• J/ψ MC• Values which are fixed within a Gaussian penalty function
get new starting point at ±1σ• B+
• Fixed by Gaussian penalty function same as J/ψ MC• Let lifetime fully float → fitted value consistent with PDG
B+ lifetime. Giving a further check on the lifetime extraction
• Feed down• 0% • 13% (worst case)
35

Full List of SystematicsTest +Δ(τ) ps -Δ(τ) ps
Central Value Phase Space
s=1.2Single Gaussian Prompt
J/ψ SB +1σJ/ψ SB -1σJ/ψ MC +1σJ/ψ MC -1σ
B+ Lifetime +1σB+ Lifetime -1σ
B+ Lifetime FloatB+ Mass Distribution
J/ψ MC Mass DistributionPrompt Mass +1σPrompt Mass -1σ
Remove WeightingAlignmentBc pT 2*μBc pT μ/2
J/ψ SB Left MassJ/ψ SB Right Mass
0% Feed Down13% Feed Down
TOTAL
0.0104 0.01040.0060 0.00600.0069 0.00690.0096
0.01140.0036
0.00420.0002
0.00020.0067 0.00670.0040 0.00400.0197 0.01970.0050
0.00480.0086 0.00860.0059 0.00590.0219
0.00250.0131
0.01440.0032
0.00370.0392 0.0338

Bc Lifetime Conclusions• Using 1.3 fb-1 of data, a measurement on the Bc
lifetime has been made in the semileptonic channel : Bc→J/ψ + μ +X
• An unbinned likelihood simultaneous fit to the J/ψ+μ invariant mass and lifetime distributions giving 856 ± 85 signal events and a lifetime of :
•World’s most precise measurement
• Consistent with previous measurements and theoretical predictions
‣QCD Sum Rules : 0.48 +/- 0.05 ps37
%d0%9d%d0%b0%d0%b2%d1%87%d0%b0%d0%bb%d1%8c%d0%bd%d0%be %d0%bc%d0%b5%d1%82%d0%be%d0%b4%d0%b8%d1%87%d0
1060204 %d0%bb%d0%b8%d1%81%d1%82%d0%be%d0%b2%d0%ba%d0%b0 %d0%bf%d0%be %d1%82%d0%b5%d0%bf%d0%bb%d0%be
%d0%92%d1%96%d0%b4%d0%bf%d0%be%d0%b2%d1%96%d0%b4%d1%8c %d0%9e%d0%b1%d1%83%d1%85%d1%96%d0%b2 %d0%bf%d