bc budget...honourable speaker, this budget introduces new initiatives to help ordinary people,...
TRANSCRIPT

BC Budget
Delivered in the Legislative AssemblyMarch 22, 1994
by Honourable Elizabeth CullMinister of Finance and Corporate Relations

Introduction ..................................................................................................... 1
Economic Review and Outlook ......................................................................3
Managing British Columbia’s Finances ........................................................... 4
A Commitment to Eliminate the Deficit .................................................. 4
Progress to Date .......................................................................................4
Reducing the Deficit in 1994/95 .............................................................. 5
The Debt Management Plan ....................................................................5
Increasing the Fairness of British Columbia’s Tax System .................... 7
Controlling Costs and Cutting Waste ...................................................... 8
Achieving Fairness in Federal-Provincial Cost-Sharing ........................ 11
Investing in Long-Term Economic Growth .................................................. 13
BC 21: Building BC for the 21st Century................................................ 14
Protecting Health and Education .......................................................... 15
New Skills For a Changing Economy ................................................... 16
Revitalizing our Forest Sector ................................................................ 17
Encouraging Private Sector Investment ................................................ 18
Conclusion......................................................................................................20
Appendices .................................................................................23
TABLE OF CONTENTS
Budget Speech
BC Budget
94 Speech layout w/slides 3/17/94, 6:42 PM22

BUDGET SPEECH
BC Budget
INTRODUCTIONI am pleased to present the third budget of this New Democrat administration — abudget that builds a prosperous and secure British Columbia.
In our first two budgets, we had to respond to some serious problems — we hadto cut spending growth and reduce the deficit.
We met these challenges, and British Columbia now has a firm fiscal foundation.
Thanks to the efforts of all British Columbians, our economy has turned around.
We now have one of the strongest economies and best job creation records inNorth America.
We have one of the best deficit reduction records in Canada.
We have the second-lowest overall taxes in Canada.
We have the lowest debt, in relation to the size of our economy, of any province.
And we have the highest credit rating of any province.
In preparing this 1994 Budget, I consulted extensively with groups and individualsacross British Columbia.
In these meetings, British Columbians clearly told me their concerns.
They want us to hold the line on taxes, to be tough on spending, and to eliminatethe deficit as quickly as possible.
They are concerned about their own job security and about their children’s futurein a rapidly changing economy.
And they want us to focus on building the future — investing in people andensuring that British Columbians have the skills they need to prosper in the neweconomy.
Honourable Speaker, this budget responds to these concerns and puts forward ourplan for British Columbia’s economic future.

2
We recognize that government alone cannot build our economy and createstable long-term jobs.
This is a challenge which requires the initiative of many groups andindividuals — in the private sector as well as the public sector.
But it is government’s job to focus on the future — to make sure prosperitytoday leads to economic security tomorrow — with new jobs and newbusiness opportunities everywhere in British Columbia.
We as a government have two key goals.
One is to eliminate the deficit and ensure that British Columbia remains ona sound financial footing.
The other is to build British Columbia’s economic foundations for the21st century.
Over the last two years, we have made substantial progress in gettingBritish Columbia’s fiscal house in order — cutting spending growth in halfand reducing the deficit by over $1 billion.
But, equally important, we have done it while protecting the health of ourfamilies and the education of our children.
And we have avoided the economic nose dive that would have occurredhad we repeated the radical restraint of a decade ago.
Honourable Speaker, this 1994 budget builds on the progress we havealready achieved.
• It reduces the deficit significantly for the third year in a row.
• It puts forward a plan to achieve a balanced budget by 1996/97.
• It continues to reduce the rate of spending growth by cutting wasteand finding new efficiencies.
• It continues to make the tax system fairer for ordinary people andbusiness.
• And it puts the lid on taxes for three years.
Honourable Speaker, our most important goal is to build British Columbia’seconomic foundations for the 21st century.
That means:
• Making the new public investments required for private sector growth.
• Maintaining quality health care and education for B.C.’s families andchildren.
• Putting new skills in the hands of British Columbians.
Fiscal housein order
Building for thefuture

3
• Ensuring a long-term future for forest workers and their communities.
• And providing support for small- and medium-sized businesses in theforefront of B.C.’s transition to a new economy.
In our first two budgets, we began moving towards these goals.
Our economy performed well last year, but it would be irresponsible to sitback now and take our long-term future for granted.
Unless we continue to lay the foundations for longer-term progress, wewill not be able to pass on a prosperous and sustainable economy to ourchildren.
Honourable Speaker, this budget introduces new initiatives to helpordinary people, communities and business all over British Columbia —initiatives to increase skills training, build roads and public facilities, andrevitalize forest communities.
ECONOMIC REVIEW AND OUTLOOKLet me now review our economic performance and prospects in a bit moredetail.
British Columbia’s economy grew by 3.2 per cent in 1993 — our strongestperformance in four years.
As a result, Honourable Speaker, we now have one of the healthiesteconomies in North America.
In 1993:
• Exports grew by over 16 per cent.
• Retail sales were up by 8 per cent.
• Capital investment was up by over 8 per cent.
• Housing starts reached 42,800 units, an all-time record.
• And business bankruptcies fell by 20 per cent.
Over the last 12 months, 76,000 new jobs have been created inBritish Columbia — almost half the jobs created in all of Canada.
That’s more than 200 new jobs every day.
And, in 1993, 63 new businesses were incorporated every day.
British Columbia’s strong performance is expected to continue next year asthe global economy recovers. Overall, our economy is forecast to grow by3.4 per cent in 1994.
Canada’sstrongesteconomy

4
MANAGING BRITISH COLUMBIA’S FINANCES
A Commitment to Eliminate the DeficitHowever, sustaining economic growth over the longer term requirescontinued strong management of the province’s finances.
Unless we can reduce and eliminate the deficit, we will not be able tocontinue providing first-rate education for our children or quality healthcare for all of us.
In 1991 we inherited a financial mess.
We faced government spending that was growing at a rate of 12 per centeach year — far in excess of growth in the economy.
And we faced a federal government refusing to honour its fundingcommitments to our hospitals, colleges and universities.
Spending exceeded revenue by $2.4 billion, and an independent auditshowed the deficit soaring to $3.4 billion by this year if no action wastaken.
When this government took office, the Premier pledged to cut the deficiteach and every year — until finally eliminated.
Honourable Speaker, our first two budgets recorded steady progress.
This budget continues that progress and lays out a plan to achieve abalanced budget by 1996/97.
Progress to DateLet me first summarize the financial results for fiscal 1993/94, the year justending.
I am pleased to announce that this government’s spending will be right onbudget — at just under $19 billion.
And, because our economy is prospering, revenue will be almost$17.7 billion.
That is $220 million higher than projected in last year’s budget.
Every penny of this new revenue has been used to cut the deficit and holddown debt.
Therefore, the 1993/94 deficit will be $1.28 billion — well below ourbudget target of $1.54 billion.
That’s a cut of over $1 billion in our first two budgets.

5
Reducing the Deficit in 1994/95In this budget, Honourable Speaker, we are building on our record ofsound financial management.
British Columbia’s continued strong economic growth means thatprovincial government revenues for 1994/95 will total $18.73 billion — anincrease of 5.9 per cent.
Spending will total $19.63 billion.
That represents an increase of 3.5 per cent — the smallest increase in nineyears.
In three budgets, we have cut the rate of spending growth by almostthree-quarters.
Honourable Speaker, in this budgetBritish Columbia is taking anothermajor step forward — bringing thedeficit well under the $1 billion mark.
The deficit for 1994/95 will be$898 million — the third significantdrop in three years.
By the end of the coming fiscal year,we will have cut the deficit by$1.5 billion — a reduction of over60 per cent since we took office.
The Debt Management PlanHonourable Speaker, I am also putting forward this government’s debtmanagement plan.
In recent years, Canadians have become increasingly concerned about thegrowth of government debt.
British Columbia is fortunate to have the lowest debt in relation to the sizeof its economy of any jurisdiction in Canada.
However, the accumulation of debt — if not controlled — raises theamount we must spend on interest payments, and reduces our longer-termability to fund key programs for people.
A workable debt plan must recognize that the debt supported by B.C.taxpayers has two major components.
One component is the accumulation of government operating deficits —called the direct debt.
That’s the equivalent of buying the groceries with your credit card.
When the government spends more than it takes in, this type of debtincreases.
0
0.5
1
1.5
2
2.5
1991/92 1992/93 1993/94 1994/95
Deficit down60 per centin three years
Addressingthe debt
Deficit Down
$ b
illi
on
s

6
Halting the growth of direct debt requires a balanced budget.
The second major component of British Columbia’s debt is the amount theprovince borrows to build key assets like schools, hospitals and roads.
Unlike the direct debt, this debt generates real economic returns over time— for example, an efficient transportation system and a healthy, well-educated population.
This is similar to taking out a mortgage to buy a house.
Money is borrowed to buy a valuable asset and the debt is gradually repaidon a fixed schedule.
A high level of in-migration to British Columbia in recent years hasincreased the need for public assets of all kinds.
And the radical restraint of a decade ago created a backlog of unfilledneeds for new schools, justice facilities, colleges, universities, and hospitals.
The debt incurred to build these facilities is backed by the value of theassets.
The total replacement value of British Columbia’s public assets is$60 billion, more than double the level of outstanding public sector debt.
Honourable Speaker, our debt management plan has two goals.
One is to eliminate the province’s deficit.
The other is to ensure that the level of total tax-supported debt reflects theprovince’s ability to repay through increased economic growth andrevenues.
The progress we have made in reducing the deficit in this and previousbudgets has slowed the growth of British Columbia’s direct debt.
And we will build on this progress by eliminating the deficit by 1996/97.
In preparing this budget and the longer-term plan to eliminate the deficit,the Premier directed that further progress be made by reducing spendinggrowth — not by increasing taxes.
Like most other provinces, this government’s deficit reduction over the lasttwo years relied on a combination of expenditure controls and taxincreases.
But taxpayers have done enough to help the government put ourprovince’s fiscal house in order.
Therefore, for the next three years, there will be no new taxes and noincrease in existing tax rates.
• No increase in personal income tax rates.
• No increase in sales tax rates.
Building assetsfor today and
tomorrow
A balancedbudget by
1996/97
Taxes frozen

7
• No increase in fuel tax rates.
• No increase in corporation income and capital tax rates.
• No increase in Medical Services Plan premiums.
• No increase in average school and rural property tax levels.
• No increase in property transfer tax rates.
Reaching our balanced budget goal without tax increases requires a furtherreduction of spending growth to the two-per-cent level in the next twobudgets — well below inflation and population growth.
And in this budget, we are taking a further step to help cap and reduce thegrowth in debt.
Honourable Speaker, the British Columbia Endowment Fund will bewound up, and most of its assets sold to pay down government debt.
This action will generate approximately $600 million for debt reduction.
Increasing the Fairness of British Columbia’sTax SystemHonourable Speaker, in addition to freezing taxes we are introducing anumber of tax cuts to increase the fairness of British Columbia’s tax system.
Together, these tax cuts total $112 million: half to improve fairness forindividuals and half for B.C. business.
FIRST, we are fulfilling a promise made during the last election campaignand eliminating the property transfer tax for first-time home buyers.
British Columbia’s housing prices are the highest in Canada, and thismeasure will help to make the dream of home ownership a reality forthousands of young families.
The first-time home buyers’ exemption will replace the existing high-ratiotax relief program, and will be available to qualifying home buyers whohave resided in British Columbia for at least one year.
The maximum qualifying purchase price will be $250,000 in the LowerMainland and Capital regions, and $200,000 elsewhere in the province.
SECOND, we are increasing the home owner grant phase-out threshold by$50,000 — now the grant will be phased out only for properties valuedabove $450,000.
This adjustment will ensure that 95 per cent of B.C. homeowners are notaffected by the phase-out of the home owner grant.
THIRD, we are restoring the trade-in allowance on purchases ofautomobiles.
Tax breakfor first-timehome buyers
8
Consultations over the last year have shown that this measure has hadunintended effects for both buyers and sellers.
We are also raising the threshold for the tax on luxury vehicles to $32,000.
This change reflects both price increases and concerns that higher-pricedvehicles needed to live and work in many northern and rural parts of theprovince are not luxuries.
Honourable Speaker, this budget also ensures tax fairness formunicipalities.
During my pre-budget consultations, municipal governments expressedconcern over the level of municipal grants as well as grants paid tomunicipalities in lieu of property taxes.
I am pleased to announce that this budget maintains the level ofunconditional grants to municipalities.
In addition, we will implement a new approach to determiningunconditional grants in future years which provides greater predictability.
We will also undertake a thorough review of grants in lieu of propertytaxes for provincial institutions such as universities, hospitals and Crowncorporations.
And we will take steps to improve fairness for communities which bearthe burden of providing services to these institutions.
This budget also introduces a package of measures to increase fairness forbusiness and help the private sector create jobs.
I will outline the details of these initiatives later on in this budget address.
Controlling Costs and Cutting WasteHonourable Speaker, bringing down the spending growth rate over thelast two years has challenged the public sector.
Adjusting for population and inflation, real government spending perperson declined last year.
This government’s decision to rely solely on spending controls to continuereducing the deficit creates an even greater challenge to the public sector.
This year’s spending growth of 3.5 per cent is well below last year’sgrowth, and only a fraction of the 12-per-cent growth rate inherited fromthe previous administration.
And it represents another cut in real spending per person of 1.3 per cent.
Honourable Speaker, cutting waste and duplication means ensuring that allgovernment agencies are fulfilling a valid public purpose.
In 1992, we launched an initiative to reduce the large number ofgovernment boards, agencies and commissions.

9
This year, we continued to review each government body — asking somebasic questions.
We asked if the public body was still performing a useful function.
Or whether the service was performed more appropriately by the privatesector.
We asked whether there were other ways of providing the service moreefficiently, and at less cost to the taxpayer.
And we asked whether the public body was duplicating a service providedelsewhere.
Honourable Speaker, as a result of this review, I am announcing today theelimination of five major government entities.
• FIRST, as I have already announced, the British Columbia EndowmentFund will be wound up with the proceeds used to reduce theprovince’s debt.
• SECOND, the Round Table on the Environment and the Economy willbe eliminated. This advisory body has undertaken valuable work, butother government initiatives in environmental protection and economicdevelopment have made its role redundant.
• THIRD, the British Columbia Petroleum Corporation will be wound up.The deregulation of the natural gas industry has eliminated the needfor this body, and its remaining functions can be more efficientlyperformed by the Ministry of Energy, Mines and Petroleum Resources.
• FOURTH, the British Columbia Energy Council will be wound upduring the coming year. Its remaining consultative and policy advisoryfunctions can now be performed within the existing mandates of theB.C. Utilities Commission and the Ministry of Energy, Mines andPetroleum Resources.
• FIFTH, Government Air Services will be wound up. Its air fleet will besold and the government will contract with the private sector foremergency response, air ambulance, and other air travel requirements.An evaluation has shown that contracting these services to the privatesector can achieve cost-savings.
Over the coming months, I am looking forward to receiving the support ofMembers for additional steps to eliminate waste and duplication.
Honourable Speaker, both elected and non-elected officials must continueto do their part to hold down the cost of government.
We are continuing the salary freeze for MLAs and senior public servants, aswell as the five-per-cent cabinet pay cut announced last year for thePremier and ministers.
Eliminating wasteand duplicationin government

10
We are also moving to ensure greater control and accountability for salarycosts in the broader public sector.
These costs account for about 50 cents of every dollar spent by theprovincial government.
But, until now, the government has had limited responsibility for collectivebargaining and executive compensation in schools, hospitals, universities,and colleges.
Last year we established the Public Sector Employers’ Council to increasethe effectiveness of public sector labour management relations.
And we have instructed the new council to undertake a comprehensivereview of management compensation in the broader public sector.
We have also taken specific measures to control costs and improveefficiency in the provision of education and health services.
This year, additional funding for public schools will be dedicated directlyto children in classrooms.
These grants provide no new funds for salary increases, and put a cap onschool district administrative costs.
And over the coming year, we will implement a province-wide teacherbargaining system to improve cost-effectiveness for B.C. taxpayers andprovide greater stability for students.
Health care is our largest single budget item, accounting for one-third ofgovernment program spending.
A key goal of our New Directions initiative is to find more cost-effectiveways of providing high-quality health care.
As part of a new regional management structure for health care, we aredeveloping a series of new management arrangements to achieve greaterefficiency in purchasing, administration, payroll, and executivecompensation.
A recent audit identified potential savings of up to $50 million from betterhospital purchasing practices alone.
Honourable Speaker, taxpayers expect that income assistance will betargeted to those in need, without fraud and abuse.
In January of this year, we announced a series of new measures to combatwelfare fraud and improve accountability.
These initiatives are expected to save $20 million annually, and we willstrengthen them in the coming year.
Honourable Speaker, we are also taking measures to improve taxenforcement, minimize fraud, and ensure that everyone pays their fairshare.
Greateraccountability
in thepublic sector

11
We will increase our auditing and collection efforts, and there will behigher penalties for tax evaders.
To help businesses comply, effective midnight tonight we are introducingan amnesty period during which they can remit overdue consumer taxeswithout penalty.
It will end on June 30th, 1994.
After the amnesty period, we will step up tax enforcement and collection.
Honourable Speaker, some would like us to go further than the measures Ihave just outlined.
They would like us to slash spending, eliminate the deficit this year, andfreeze our debt immediately.
However, eliminating the deficit immediately would mean:
• long waiting lists for health care;
• crowded classrooms;
• a lower level of law enforcement; and
• more young people turned away from universities and colleges.
Freezing our debt would mean an immediate halt to construction of badlyneeded schools, hospitals, colleges, roads and other vital infrastructure.
The experience of radical restraint right here in B.C. during the early 1980sshows it doesn’t work.
Not only would it make us less healthy, less well-educated and less welloff — it would also reduce our ability as a province to compete in a globaleconomy.
Achieving Fairness in Federal-ProvincialCost-SharingHonourable Speaker, although we are well on our way to eliminating thedeficit and stabilizing our debt, a major source of uncertainty remains.
This uncertainty relates to essential programs for people, cost-sharedbetween our province and the new federal government in Ottawa —health care, post-secondary education, and income support.
The previous federal government attempted to deal with its deficits byoffloading its financial responsibilities for these programs onto theprovinces.
The result has been a steady decline in the federal share of funding foressential services in our province.
That means British Columbia taxpayers have had to pay more and moreeach year just to keep our essential programs from deteriorating.
Tax amnestyperiod for smallbusiness

12
The impact on our deficit has been dramatic.
In the absence of federal offloading we would have recorded a budgetsurplus of almost $900 million last year and a surplus of almost$1.6 billion for this coming year.
That’s $2.5 billion wecould have used toreduce B.C.’saccumulated debt.
Let me repeat — BritishColumbia would havebeen in the black lastyear and in the blackthis year, with nobudget deficit, if thefederal government hadlived up to itsresponsibilities.
The new Liberalgovernment in Ottawahas stated that federal-provincial cost-shared programs will be included in its major review ofsocial programs over the coming year.
However, even before undertaking this review, it has announced itsintention to continue offloading costs onto the provinces.
In its recent budget, the Liberal government announced that by 1996 it willreduce its payments for income support and post-secondary education to1993 levels.
If this happens, the provinces will have to assume even more of the costsof providing these programs.
The funding problem for Canada’s key social programs cannot be resolvedby a continuation of unilateral federal offloading.
A lasting solution requires a new, cooperative approach with the provinces— one which ensures that provincial responsibility to provide key servicesis matched by access to adequate revenue sources.
British Columbia has offered to play a positive and constructive role inrebuilding a federal-provincial partnership that will preserve our nationalsocial programs for the 21st century.
$ b
illi
on
s
0
0.2
0.4
0.6
0.8
1
1.2
1.4
1.6
1992/93 1993/94 1994/95
B.C.’s Budget SurplusWithout Federal
Offloading
New cooperativeapproachrequired
The burden offederal offloading

13
INVESTING IN LONG-TERM ECONOMIC GROWTHHonourable Speaker, British Columbia’s economy must create jobs with afuture.
Our economy is changing.
In the old economy we relied on a small number of well-establishedmarkets for our products.
In the new economy, we must learn to compete in a wide range ofspecialized global markets.
In the old economy, our competitive advantage lay in the high quality ofour natural resources.
In the new economy, it will be based on the quality and skills of ourworkforce.
Honourable Speaker, we face challenges in building the new economy.
• The challenge of reconciling competing demands while getting thegreatest social and economic value from a limited natural resourcebase.
• The challenge of helping workers and their communities adapt to achanging economy.
• And the challenge of creating a climate that encourages new privatesector investment and growth.
Unless we take action now to meet these challenges, we will not realizeour full economic potential.
Our plan for long-term economic growth and job creation has five keyelements:
• FIRST, providing the new public investments in infrastructure requiredto support private sector growth.
• SECOND, making investments in people. That means giving priority tothe health of our families and the education of our children.
• THIRD, putting new skills in the hands of British Columbia’s workersand young people.
• FOURTH, ensuring a long-term future for British Columbia’s forestworkers and their communities.
• And FIFTH, encouraging the growth of small- and medium-sizedbusinesses to lead the transition to a new economy.
Investing inpeople, investingin our future

14
BC 21: Building BC for the 21st CenturyHonourable Speaker, a strong, diversified private sector requires aneffective public sector investment strategy.
A strategy that will meet the needs of communities across the province forkey investments like roads, communications networks, water and sewersystems, and educational facilities.
Public investment creates jobs in the short term and tangible economicbenefits in the long term.
Last year this government introduced BC 21, a major initiative to increasethe effectiveness of public investment and job creation activities.
• BC 21 meets vital needs for new public facilities — in health care,education, child care, research and development, transit and ferries.
• It ensures the maximum level of regional benefits from all public sectorinvestment — jobs, opportunities for private sector suppliers, andtraining for workers.
• BC 21 plans and builds important transportation links using theB.C. Transportation Financing Authority.
• It funds innovative regionally-based job creation and trainingopportunities.
• And it supports community initiatives to build or improveneighbourhood facilities.
Honourable Speaker, we will continue to build on the success of BC 21during the coming year.
Public investment in schools, health care facilities, post-secondaryinstitutions, and justice facilities will total $1 billion in 1994/95.
To enable working families to take full advantage of education and jobopportunities, we will continue our three-year initiative to create 7,500 newchild care spaces.
And we will be introducing new initiatives to support quality child carethat meets the needs of families at a cost they can afford.
A new consolidated capital planning process, put in place this year, willensure that major capital investments are made in the most cost-effectiveway.
It will also ensure that British Columbians obtain the greatest possiblebenefit from capital expenditures in terms of job creation, training, skillsdevelopment and regional economic impact.
The B.C. Transportation Financing Authority will invest $300 million in1994/95.
This investment will keep the Vancouver Island Highway on schedule andallow us to make a start on other long-overdue transportation projectsduring the coming months.
Providing jobopportunitiesfor all BritishColumbians
Buildinghighways

15
The Build BC Special Account will be continued with a budgetaryallocation of $100 million.
Priorities for the fund will include:
• a continuation of the Community Grants Program;
• new initiatives to support affordable housing; and
• new partnerships with the private sector to help expand science andtechnology industries.
Honourable Speaker, the BC 21 initiative will be supplemented in 1994/95by a new Canada-British Columbia infrastructure program.
This new federal-provincial-municipal program provides for a totalinvestment of $675 million over two years.
The provincial contribution will be $225 million over two years.
Funding will be targeted mainly to priorities set by local government, withan emphasis on water, sewer, and local transportation projects.
Protecting Health and EducationOur investment in people is even more important than our investment inphysical assets.
A healthy, well-educated population enhances both our quality of life andour long-term economic performance.
In our first two budgets we gave the highest priority to maintaining thequality of health and education services in the face of a growingpopulation and serious fiscal constraints.
This budget continues to reflect that priority.
Expenditures on health care for 1994/95 will be $6.4 billion.
That represents an increase of $200 million or 3.3 per cent over theprevious year.
While this increase is below those of the last few years, it is significantlyhigher than those in other provinces.
For example, Alberta’s budget contains a 10-per-cent cut in healthexpenditures.
While British Columbians give the highest priority to maintaining a first-ratehealth care system, they also know that rising costs cannot simply bepassed on to the taxpayer.
We must find better ways of providing first-class care.
Last year we introduced the New Directions initiative — to develop morecost-effective ways of ensuring a healthy population.
Health fundingincreased

16
We also introduced a landmark labour-management accord that allows thenecessary transition from expensive acute care to more effectivecommunity-based care.
And we negotiated a settlement with British Columbia’s doctors thatprotects universal access to care within the means of taxpayers.
This year, we are taking a number of measures to protect those healthprograms experiencing the most serious cost pressures.
The cost of the Pharmacare program has grown from $215 million fiveyears ago to $365 million today.
To protect the viability of this important program we have launched a newTherapeutics Initiative.
It will provide an independent scientific evaluation of new and existingprescription drugs, and make recommendations on coverage and use.
And the Minister of Health will be announcing a number of additionalmeasures to ensure the continued viability of the Pharmacare program.
Honourable Speaker, during the coming fiscal year, we will spend$3.38 billion on operating grants to elementary and secondary schools.
That represents an increase of $130 million or four per cent over last year’sgrant.
This increase provides full funding for enrolment increases, an additionalone per cent for operating cost pressures, and $30 million for children withspecial needs.
Operating grants for universities and colleges will be $1.06 billion — up3.4 per cent.
New Skills For a Changing EconomyHonourable Speaker, over the coming decades British Columbia’seconomic success will depend on the skills of its workforce.
High skill levels are a critical factor in our ability to provide knowledge-based industries and jobs with a future for ordinary British Columbians.
We are at a crossroads where failure to move ahead decisively wouldcreate a widening gap between the skills of our workforce and thoseneeded in the changing economy.
And the result of this failure would be increasing unemployment and risingcosts for social assistance.
Last summer, the Premier’s Summit on Skills Development broughttogether British Columbians from all walks of life to help chart a plan ofaction.
Educationfunding
increased

17
In the coming days we will announce a comprehensive new skills andtraining initiative.
This initiative will provide young people and working British Columbianswith the skills they need for jobs in a changing economy.
We are making skills training programs more accessible.
And we are making improvements to high school and post-secondaryeducation to meet the needs of the real world.
In addition to the $34-million-grant increase for post-secondary education,we are providing $90 million in new expenditures to implement the newskills initiative in 1994/95.
Over the next two years, we are committing $200 million to this importantnew initiative.
Together with the grant increase for post-secondary institutions, thisfunding will create over 8,100 additional full-time post-secondary spaces in1994/95.
Revitalizing our Forest SectorHonourable Speaker, the health of our forest industry is critical for thesurvival of communities across British Columbia.
Yet our forests and the communities that depend on them are facingserious problems.
Years of overcutting and poor management practices have led to a declinein both the quantity and quality of the remaining resource.
Employment in the forest industry has been declining for over a decade,due to both mechanization and resource limits.
And the disputes over the use of our forest land base are intense.
Taking action to overcome these problems and revitalize our forest sectoris one of this government’s highest priorities.
In 1992, we launched the CORE process — appointing an independentcommissioner to develop regional land-use plans on the basis ofcommunity participation.
We initiated a province-wide Timber Supply Review to address the legacyof overcutting and set harvest levels that are sustainable.
We launched a $40-million Forest Worker Development initiative underBC 21 to increase the level of silviculture in forest communities whilecreating jobs and improving worker skills.
And we provided new funding through BC 21 to increase the SmallBusiness Forest Enterprise Program.
Skills andtraining for the21st century
Sustaining ourforest communities

18
Honourable Speaker, we will continue to give priority to renewing ourforests over the coming year.
Despite the budgetary pressures we face, we are maintaining our totalsilviculture spending at $275 million to ensure the long-term viability of ourwood supply.
We are increasing our funding for the Small Business Forest EnterpriseProgram from $109 million to $140 million.
This new funding will increase the wood supply to smaller manufacturersof high value-added products, and the cost will be offset by new forestrevenues.
Honourable Speaker, during this legislative session, we will introduce thenew Forest Practices Code.
And we are providing new funding of $20 million to ensureimplementation of this vital initiative.
Finally, over the coming months, we will be announcing a comprehensivepackage of initiatives to ensure future jobs and the sustainability of forestcommunities.
It will focus on investing in forest lands, protecting the forest environment,ensuring higher levels of value-added manufacturing, and assisting forest-based communities and workers in the face of change.
Encouraging Private Sector InvestmentWhile the public sector can provide essential support through itsinvestment in areas such as infrastructure, natural resource managementand skills, most job creation occurs in the private sector.
It is the private sector, particularly small- and medium-sized businesses,that is playing the lead role in British Columbia’s transition from the old tothe new economy.
During my pre-budget consultations across the province, business groupsmade it clear they were not looking for handouts.
They want better access to investment capital, less government red tape,and a fair tax system.
Over the last two years we have already taken a number of initiatives tohelp the private sector grow and create jobs.
• We opened the B.C. Investment Office to match private sectorinvestment with new opportunities and cut the red tape sometimesfaced by new businesses.
• We introduced the BC Focus program to assist new, innovative B.C.businesses.
Support forsmall- and
medium-sizedbusinesses

19
• We launched a BC Buy Smart program to help more B.C. businessesget government contracts.
• And last year we lowered or eliminated corporation capital taxes for3,500 small businesses.
In this budget, I am pleased to introduce a number of measures to helpsmall business grow and create jobs.
FIRST, we are increasing the threshold for the corporation capital tax to$1.5 million of paid-up capital and the tax will now be phased-in between$1.5 million and $1.75 million of paid-up capital.
This change will eliminate or reduce the tax for another 2,000 smallbusinesses.
SECOND, we are exempting cooperatives and incorporated family farmsfrom the corporation capital tax.
This change will reduce taxes by approximately $4 million and helpanother 500 businesses.
THIRD, we are introducing measures to reduce the costs that smallbusinesses face in collecting and remitting taxes to government.
The required frequency for remitting sales and hotel room taxes will bereduced, and the commissions paid to businesses for collecting these taxeswill be increased.
FOURTH, we are allocating another $10 million to the successful BC Focusprogram.
This new funding will help innovative B.C. businesses raise the equitycapital they need to start up or expand.
Honourable Speaker, we are also introducing a package of tax reductionsand other measures to support the growth of key sectors of BritishColumbia’s economy.
FIRST, we are introducing an $18-million package to improve thecompetitiveness of the mining industry.
British Columbia’s mining industry is a vital part of our overall economyand a major economic base for many communities.
It accounts for 16 per cent of our exports and many thousands of skilledjobs.
Specific measures I am announcing today include a reduction of themineral tax rate for coal mines, an enhanced allowance for capitalexpenditures on new or expanded mines, a new exploration program, andfunding to continue the Canada/BC Mineral Development Agreement.
SECOND, we are spending $5 million more to help make tourismmarketing more effective. Programs will be cost-shared with the privatesector, and will provide an important boost to this key regional industry.
Corporationcapital taxcuts to supportsmall business

20
THIRD, we are increasing support for British Columbia’s cultural sector by$1.8 million.
Part of this expenditure will be allocated to creating a new fundingpartnership with the federal government and the private sector.
FOURTH, we are reducing the jet fuel tax by one cent per litre forinternational flights to advance the Vancouver International Airport as amajor North American gateway to the Pacific Rim.
Additional tax reduction measures are outlined in the budget appendix.
CONCLUSIONHonourable Speaker, British Columbians have reason to feel good aboutour province and its future.
British Columbia has come through a challenging economic period, andwe have emerged as Canada’s strongest economy.
We have created more jobs than any other province.
We have the second lowesttaxes of all Canadianprovinces.
This government has thehighest credit rating.
And we have the lowestgovernment debt as a per centof our economy of allCanadian provinces.
This budget builds on thatstrength.
It is a practical and pragmaticbudget with clear goals.
It focuses on areas where government can make a real difference, and itrecognizes that our economic future depends on the initiative and talent ofthe private sector, the public sector, and all British Columbians.
Honourable Speaker, this budget shows that our fiscal plan is on track, andthe sound fiscal management of the last two-and-a-half years is starting topay off.
Jobs up
0
5,000
10,000
15,000
20,000
25,000
30,000
35,000
40,000
45,000
1991 1992 1993
Jobs Up

21
It cuts the deficit for the third year in a row.
It puts forward our plan to balance the budget in two years.
It freezes taxes for the next three years.
And it includes $112 million in tax cuts to make the tax system more fairand to encourage private sector growth.
But there is much more to be done if British Columbia is going to maintainits position as the best place in Canada to live, work, and do business.
This budget is focused on the tasks ahead.
It places a high priority on skills training, job creation and the long-termhealth of our forest sector.
It recognizes the challenges we face as our province makes the transitionto a diversified value-added economy.
And it protects vital health and education services.
With this budget, we are taking concrete action to invest in the future andmake sure all British Columbians have a fair chance to participate in thenew economy.
Honourable Speaker, this budget proves that we’ve been listening toBritish Columbians.
And we will continue listening and working with people all over thisprovince to build a healthy economy and a secure future for everyone.
Thank you.
Deficit down
Taxes frozen
94 Speech layout w/slides 3/17/94, 6:41 PM21

BC Budget
Appendices
A. Economic Review and Outlook .............................................................. 25
B. Fiscal Review and Outlook...................................................................... 39
C. Revenue Measures ...................................................................................49
D. Provincial Government and Crown Corporation Financing Plan ......... 59
E. Fiscal Strategy and Debt Management Plan ........................................... 65
F. BC 21 — Building B.C. for the 21st Century .......................................... 75
G. Supplementary Tables
G1 General Economic Indicators ........................................................... 79
G2 Interprovincial Comparisons of Tax Rates ....................................... 81
G3 Comparisons of Provincial and Federal Taxby Province — 1994 ..........................................................................82
G4 Summary of Operating and Financing TransactionsConsolidated Revenue Fund ........................................................... 84
G5 Revenue by Source............................................................................85
G6 Expenditure by Function .................................................................. 87
G7 Net Debt Summary ............................................................................88
APPENDICES
94 Speech layout w/slides 3/17/94, 6:42 PM23

25
APPENDIX A
Economic Review and Outlook
Overview and Summary
The British Columbia economy grew an estimated 3.2 per cent in 1993. Growth was broadlybased compared to recent years. The main sources of growth were consumer spending,machinery and equipment and residential investment. Exports also rebounded sharply from 1992levels, which were depressed by shutdowns in the pulp, paper and coal mining industries.However, import volumes grew faster than exports due to the strength of domestic demand.
The labour market also improved in 1993 and was quite robust compared to the rest of Canada.Employment rose 2.9 per cent, compared to 0.9 per cent in the rest of the country (see ChartA1). In British Columbia, 44,000 new jobs were created, 38,000 of them full-time positions. Muchof the private-sector job growth was in self-employment rather than paid employment.Employment declined 0.6 per cent in Vancouver, but rose 3.2 per cent in Victoria and7.9 per cent in the rest of the province.
98
100
102
104
106
108
| 1992 | 1993 |
CHART A1EMPLOYMENT:B.C. AND THE REST OF CANADA
January 1992 = 100; seasonally-adjusted
Source: Statistics Canada
British Columbia
Rest of Canada

26
During the first half of 1993, the number of people available for work grew more slowly thanemployment, causing the unemployment rate to dip to 8.6 per cent in October. However, by thebeginning of 1994, growth in employment and the labour force were running neck and neck,and the unemployment rate rose to about 10 per cent in January and February. The rapidgrowth in the labour force was due, in part, to record levels of in-migration. In 1993, there wasa net inflow of 80,435 people to British Columbia from other countries and the rest of Canada,up nearly 11,000 from the previous record in 1992.
Looking ahead to 1994 and 1995, conditions in the world economy should improve asrecessions come to an end in Europe and Japan. Despite recent interest rate increases due tofears of renewed inflation in the United States, monetary conditions should remain conducive toeconomic expansion, given the large amount of excess capacity in the Canadian economy.
British Columbia’s exports should continue to expand with recovery overseas, and the NorthAmerican economy still in the early to middle stages of an expansion. In-migration toBritish Columbia is likely to slow over the next few years as economic conditions improve inthe rest of Canada. This will reduce housing pressures in areas that are popular destinations fornew residents. Nevertheless, annual population and employment growth in excess of 2 per centshould keep consumer markets expanding. Several major investments in the province that havebeen announced recently will also provide a solid foundation for economic growth.
The provincial economy is expected to grow 3.4 per cent in 1994 and just under 3 per cent overthe 1994-98 period.
The External Environment
The International Economy
The North American economy grew rapidly in the fourth quarter of 1993, but the Japanese andGerman economies remained in a slump. The Canadian and United States economies areexpected to lead the major industrial countries in economic growth in 1994. Conditions in Japanand most of Europe are not expected to improve much until well into 1994.
A broadly-based pickup in domestic demand helped to strengthen economic activity in theUnited States in 1993. Growth was dampened by slow growth in exports, surging imports andfalling government spending caused largely by defence cutbacks. Residential repair andconstruction, a key market for British Columbia wood products, was spurred by declininginterest rates and rebuilding following extensive flooding in the Midwest. Housing starts rose7.2 per cent to 1.29 million units in 1993 and are expected to total 1.37 million in 1994 and1.42 million in 1995. The strength of the United States economy resulted in the value ofBritish Columbia’s exports south of the border growing 26 per cent in 1993. The U.S. economyis expected to grow 3.0 per cent in 1994 and 2.8 per cent in 1995 (see Chart A2).
In Japan, both domestic and external demand were weak in 1993. Japanese real gross domesticproduct (GDP) shrank in the fourth quarter and was unchanged for the year. Consumerspending was sluggish due to weak growth in employment and income. The higher value of theyen adversely affected export growth and investment spending, but excess industrial capacityand office space, and depressed profits also took their toll. The only bright spot in the Japaneseeconomy has been housing starts, an important market for British Columbia lumber. Starts roseabout 5.9 per cent, partly due to government loan programs. The value of the province’s woodexports to Japan rose over 60 per cent in 1993 due to consumption and price increases. Totalexports to Japan increased 19 per cent.

27
0
2
4
-2
2.4
3
-0.1
-1.9
3.53
0
1
3.5
2.8
2 2
1993 1994 1995
Canada U.S. Japan WesternGermany
CHART A2ECONOMIC GROWTH
Source: Ministry of Finance & Corporate Relations
Percentage change in real GDP/GNP
Forecast Forecast
Japan’s coalition government faces three major economic policy problems: implementing itsfiscal stimulus program, finding a way for the over-valued yen to depreciate against majorcurrencies and at the same time satisfying U.S. demands for reduced trade barriers. Withdomestic demand likely to decline (even with the fiscal stimulus program) and the high value ofthe yen dampening exports, no growth is expected in the Japanese economy in 1994. In 1995,growth is expected to be 2.0 per cent, weak by historical standards.
Other countries in the Asia-Pacific region currently form small, but rapidly-growing potentialmarkets for British Columbia and Canada. Most countries in the region expanded rapidly in1993. Hong Kong, South Korea, Thailand and Singapore grew at rates of between 5 and10 per cent. China recorded another year of 13 per cent growth and the government is trying toreduce growth to a more sustainable rate of 9 per cent in 1994. Rapid growth is expected tocontinue in the other countries.
Europe is in recession. The European economy shrank 0.6 per cent in 1993, mainly due torecessions in Germany and France. Domestic demand declined in most countries but the UnitedKingdom. The west German economy shrank 1.9 per cent, which was partly offset by growth ineast Germany. Consumer demand stagnated as a result of lower real incomes and loweremployment. As a result of the recession, British Columbia’s exports to Europe declined in 1993.
The west German economy is expected to grow 1.0 per cent in 1994 and 2.0 per cent next year.Despite the expansion in the United Kingdom, weak performances by Germany and France willhold economic growth in Europe to just 1.2 per cent in 1994 and 2.1 per cent in 1995.

28
The Canadian Economy
The performance of the Canadian economy improved significantly in 1993, with real grossdomestic product growing 2.4 per cent, more than three times the 0.7 per cent growth rate in1992. The major contributor to Canadian economic growth was the expansion in exports ofgoods and services, reflecting continued strong demand from the United States and thedepreciation of the Canadian dollar against its U.S. counterpart.
Although economic growth has picked up, the economy continues to operate well belowpotential. In the fourth quarter of 1993, the industrial capacity utilization rate was 79.7 per cent,well below its most recent peak of 86.9 per cent in the fourth quarter of 1987. It is estimatedthat the Canadian economy is running between 6 and 9 per cent below potential. This comparesto an ‘‘output gap’’ of 1 to 1.5 per cent in the United States.
Employment growth has barely kept up with labour force growth in 1993, keeping the nationalunemployment rate near 11 per cent. Concerns about job security were reflected in the modest1.6 per cent increase in the volume of consumer spending. The housing market remained weakeast of the Rockies, with Canadian housing starts falling to an eight-year low of 155,000 units.As a result, residential investment fell 3.8 per cent. Plant closures and corporate downsizingcontributed to a 9.2 per cent drop in the volume of non-residential construction. The one brightspot in the economy, in addition to exports, was machinery and equipment investment, whichrose 8.5 per cent.
The weak economy pushed Canada’s inflation rate down last year. Consumer prices rose1.8 per cent and average hourly earnings were up 1.5 per cent. Wage settlements averaged0.7 per cent in 1993, the second consecutive year that a record low was reached. The rate ofinflation slowed further as 1994 began, falling to 1.3 per cent in January. Inflation in Canada isexpected to decline further in 1994, with the one-time effect of federal and provincial tobaccotax reductions lowering inflation to about 0.8 per cent. Also, there is considerable slack in theeconomy so that even with stronger growth, inflation is unlikely to rise significantly.
The Canadian economy is expected to grow 3.5 per cent in 1994 and 1995. Economic growthshould accelerate due to stronger domestic and external demand. Faster employment growthwill result in increased consumer spending. The recovery in Europe and Japan in the secondhalf of the year, and higher commodity prices will boost exports and contribute to highergrowth. Capital investment will remain relatively weak due to excess capacity in several sectors.
Financial Markets
Over the past year, the spread between Canadian and U.S. short-term interest rates hasnarrowed to its current 0.3 per cent in mid-March. Less than four years ago, the spread wasmore than 5 percentage points. Combined with the depreciation of the Canadian dollar, thedrop in short-term interest rates and the narrowing spread represent a significant easing ofmonetary conditions in Canada. This has been possible because inflation stayed in the lowerpart of the target band set by the Bank of Canada. In December, the federal government andthe Bank of Canada announced that monetary policy will aim at maintaining inflation in the 1 to3 per cent range through 1998.
Monetary conditions in Canada continued to ease in the fourth quarter of 1993 and early in 1994as the result of a lower currency and declining short-term interest rates (see Chart A3). InFebruary and March, interest rates rose in the United States after the U.S. Federal Reserve raisedits interest-rate target for overnight loans from 3.0 to 3.25 per cent and signalled that furtherincreases were likely. The subsequent rise in market-determined U.S. interest rates appears to bethe result of rising inflation expectations. Canadian interest rates rose in response to the U.S.increases, despite lower inflation in Canada.

29
0
2
4
6
8
10
12
0.72
0.74
0.76
0.78
0.80
0.82
0.84
0.86
0.88
0.90
0.92
0.94
0.96
0.98
1.00
90-day Commercial Exchange Rate
| 1991 | 1992 | 1993 |
CHART A3MONETARY CONDITIONS
Per cent U.S.$/Can $
Source: Bank of Canada
Paper Rate
Because the Canadian economy continues to operate well below potential and inflation pressureis virtually non-existent, the outlook is for short-term interest rates to average about 4 per centfor the year. The favourable inflation outlook should allow long-term interest rates to continuethe slow decline that was interrupted in February and March as rates rose about 0.7 percentagepoints. Rates on 10-year-and-over government bonds should average 6.8 per cent this year and6.7 per cent in 1995. Even with these declines, real long-term interest rates would remain near5 per cent next year.
The Canadian dollar started 1993 at 78 U.S. cents and finished the year at 75 cents. A number offactors contributed to the depreciation of the dollar.
● In August, turmoil in the European monetary system spilled over to North America.
● The October federal election caused some volatility, although less than many expected.
● The increase in trade tensions between the United States and Japan and the resulting currencyswings side-swiped the Canadian dollar.
● Public discussion of government deficits and debt and Canada’s growing externalindebtedness created nervousness among foreign investors.
● Canada-U.S. interest rate differentials narrowed.
The Canadian dollar is expected to average about 75 cents U.S. this year and next. The effect ofnarrower Canada-U.S. interest rate spreads and foreign concerns about Canada’s fiscal problemsshould be offset by the country’s favourable inflation performance. Rising commodity prices andexports would also lend support to the currency.

30
British Columbia: 1993 Performance and 1994-95 Outlook
The British Columbia economy continued to outpace growth in the rest of Canada during 1993.Most indicators suggest the province remained the country’s growth leader into 1994. Theprovincial economy grew an estimated 3.2 per cent in 1993 compared to 2.4 per cent forCanada as a whole. (See Table A1 for forecast details and Table G1 for general economicindicators.)
The Domestic Economy
Economic activity in 1993 was driven by strong population growth, which boosted consumerspending and residential investment, and growth in machinery and equipment investment.A record level of net in-migration to British Columbia in 1993, totalling 80,435 persons,supported growth in domestic demand. As well, the depreciation of the Canadian dollar helpedBritish Columbia merchants as cross-border shopping trips dropped 15 to 20 per cent last year.Real consumer spending (i.e. adjusted for inflation), which accounts for about two-thirds oftotal GDP, rose an estimated 2.9 per cent in 1993, following growth of 2.3 per cent in 1992. Realconsumer spending is expected to grow 3.7 per cent in 1994 and 3.4 per cent in 1995. Thepickup in 1994 is the result of faster growth in spending on consumer services.
Capital investment increased 8.4 per cent in nominal terms in 1993, according to StatisticsCanada. This represents an inflation-adjusted increase of approximately 5.5 per cent. In 1994,the focus of investment growth is expected to shift away from residential construction. Totalcapital investment is forecast to rise 1.5 per cent in real terms in 1994 and 3.9 per cent in 1995.
Residential construction investment rose 3.7 per cent in real terms in 1993, reflecting theincrease in housing starts to a record 42,807 units. Housing starts are forecast to fall to 39,500units in 1994, as in-migration slows and the market pauses to absorb large numbers of multiple-unit projects started recently. (Chart A4 shows growth in housing starts in the province’s majorcities.)
The introduction of a first-time home buyers’ exemption from the provincial property transfertax will add support to the market for new and existing homes. Housing supply has not keptpace with demand in recent years and prices in many areas of British Columbia have risen wellabove levels in other parts of Canada. Based on Multiple Listing Service data, recent sales pricesfor existing homes in Victoria and Vancouver are the highest in Canada. Not surprisingly,British Columbia housing is the least affordable in Canada; according to the Royal Bank, atypical starter home will absorb 50 per cent of the purchaser’s monthly pre-tax income inmortgage, tax and utility payments, compared to under 35 per cent in the rest of the country.
Non-residential construction investment rose 1.5 per cent in real terms last year and is expectedto increase 6.9 per cent in 1994 and 4.5 per cent in 1995. The slowdown in new officeconstruction helped reduce the Greater Vancouver vacancy rate by 0.9 percentage points in1993 to 12.2 per cent. Meanwhile, Victoria continued to have one of the lowest office vacancyrates in North America at 2.9 per cent. The provincial government is hoping to reach agreementwith the city on its proposal to develop new office, residential and commercial space onprovincially-owned land in and around the Legislative precinct. This would help improve thequality of service to the public and bring greater efficiency to government ministries’ operations,many of which are scattered around the Capital.

31
0
10
20
-10
-20
-30
14
9 9
-25
16
-7
10
5.4
GreaterVancouver
GreaterVictoria
Kamloops Kelowna Nanaimo PrinceGeorge
All UrbanAreas
All Areas
CHART A4HOUSING STARTS – 1993
Annual percentage change
Source: Canada Mortgage and Housing Corporation
Significant new investments in the province are underway or were announced recently:
— MacMillan Bloedel will spend $200 million at Port Alberni to build a facility that will producelight-weight coated magazine paper.
— Cominco will spend $145 million to upgrade its lead smelter at Trail.
— Vancouver appears close to winning a National Basketball Association (NBA) franchise.A new $145-million arena to house both the Vancouver Canucks of the National HockeyLeague and the NBA team is under construction and will be completed next year.
— At Prince Rupert, the Port Corporation is expanding its facilities to handle recent largeincreases in pulp shipments. North Coast Timber is spending $24 million to re-construct asawmill that has been inactive since 1990.
— Doman Industries is building an $11-million wood re-manufacturing plant at Chemainus onVancouver Island.
Government spending — federal, provincial, local and hospital — in British Columbia rose anestimated 1.9 per cent in real terms in 1993. Most of the increase was at the local governmentlevel, where employment was up from 27,000 in 1992 to 34,000 in 1993, according to StatisticsCanada. In contrast, federal employment in British Columbia was up 1,000 while provincialgovernment employment was unchanged. Ongoing federal and provincial spending restraint isexpected to hold growth in total government spending to 0.8 per cent in 1994 and result in adecline in 1995.

32
External Trade
— Overview
The pickup in the U.S. economy and the depreciation of the Canadian dollar helped generate alarge increase in British Columbia exports in 1993. The value of foreign exports rose16.2 per cent while exports to the rest of Canada grew slowly. Foreign exports benefited fromthe rise in lumber prices during 1993. Judging by the experience of Canada as a whole, whereexports and imports grew over 10 per cent in real terms, strong import growth likely offset theprovince’s export gains. The volume of exports is estimated to have grown 5.5 per cent in 1993while imports grew an estimated 6.8 per cent. An anticipated acceleration of export volumesand slower import growth in 1994 will result in an improvement in the province’s trade positionin 1994. Both imports and exports are forecast to rise 3.5 per cent in 1995.
Excess capacity and inventories held down prices for many of British Columbia’s exports in1993. Prices for pulp and paper and metals such as copper, zinc and lead probably hit bottomlate in 1993 and should rise during 1994. Recent upturns in various commodity price indexessuggest that demand for industrial commodities will rise through 1994.
— Forest Products
Wood products remain the star performer on the commodity front. Prices were high on averagebut very volatile during 1993. Just-in-time inventory management, summer floods in the U.S.Midwest, unusually bad winter weather east of the Rocky Mountains and the earthquake in LosAngeles whipsawed the lumber market. Lumber prices started 1993 at $304 U.S. per thousandboard feet, peaked at $470 in March, fell to a low of $235 in May and finished the year at $448.Timber supply shortages combined with rising housing starts and lumber consumption in theUnited States are supporting the high level of lumber prices. In early March, lumber was sellingfor $438, compared to last year’s average of $337.
The prolonged slump in pulp and newsprint prices has taken a toll on forest company earnings.In January 1993, pulp was selling for $535 U.S. per tonne. By the end of the year, the price hadfallen to $400 per tonne. However, Canadian pulp producers succeeded in raising prices bybetween $30 and $50 per tonne for northern bleached softwood kraft in February. This puts theprice at around $440 per tonne in both North America and northern Europe.
— Mining
Metal prices were weak during most of 1993 but picked up toward year end and early in 1994.Demand for metals should increase in North America this year, but will be offset by weakness inEurope and Japan. Exports of zinc, aluminum and nickel from the former Soviet republics arelevelling off, but it will take some time to absorb high inventories. Copper prices have beenrising due to stronger demand from the housing and automotive industries in North America.
After a difficult 1992, coal mines in the southeast returned to production and regained somefinancial stability. However, contract prices for southeast coal were reduced late in 1993. Thelonger-term outlook for coal prices is not much different than it has been for the past few years.Prices will remain under pressure due to more-than-ample supplies and the adoption of newsteel-making technologies that use less coal.
In recent years, the focus of mining exploration and development activity has shifted from Northto South America, due partly to the presence of much richer ore bodies. The mining tax reliefinitiatives announced in the budget will help British Columbia’s mining industries compete withlower-cost operations in other parts of the world.

33
— Energy
British Columbia’s two largest energy exports, after coal, are natural gas and electricity.
The posted minimum price for British Columbia natural gas price rose from $1.19 per gigajoulein January 1993 to $1.50 at the end of the year, while oil prices fell from $19 U.S. per barrel inJanuary to a low of $14.35 in December 1993. Growth in natural gas exports and prices createdconsiderable interest in exploration in British Columbia as shown by the 233 per cent jump insales of Crown land drilling rights in 1993/94.
World energy demand continues to grow slowly while the potential supply remains large. OPECcontinues to have difficulty setting and enforcing production quotas. Consequently, priceincreases will be limited in 1994.
Electricity exports from the province fell by over 50 per cent in 1993 because low levels ofprecipitation reduced generating capacity. Heavy snowfalls in late February 1994 boosted thesnowpack to over 90 per cent of normal levels in some areas of the province. This will help toraise electricity production capacity this year.
— Fishing
British Columbia’s fishing industry accounted for about $600 million or about 4 per cent of theprovince’s merchandise exports in 1993, an 8 per cent increase from 1992. The salmon harvestrose significantly from 1992 as it approached the peak in its natural cycle. However, prices wereheld down by the size of the catch and a glut of farmed salmon on world markets. The herringcatch also increased from 1992 levels. Both the salmon and herring harvest are expected to belarge in 1994 as well. However, a dispute over a new West Coast salmon treaty is brewingbetween Canada and the United States. The treaty would renew a 1985 agreement that set catchlevels for Canadian and U.S. boats.
— Secondary Manufacturing
Activities in this diverse group of industries include printing, publishing, food and beverageprocessing, and manufacturing of transportation, communications and other high-technologyequipment. The value of secondary manufacturing exports totalled over $1 billion in the first10 months of 1993, a 45 per cent increase from 1992. Secondary manufacturing employed over100,000 people in 1993, accounted for about half the province’s total manufacturing activity andrepresented nearly 7 per cent of the province’s GDP.
— Tourism
Tourism generates ‘‘exports’’ of retail trade, food and accommodation services. It accounts for anestimated 3.6 per cent of British Columbia’s GDP and is responsible for over 100,000 jobs in theprovince. The depreciation of the Canadian dollar helped boost the number of internationalvisitors to British Columbia by 3.1 per cent in 1993. Hotel occupancy rates averaged62.6 per cent in 1993, down slightly from 1992. Accommodation and food service employmentdeclined in 1993. Tourism activity and employment should get a significant boost from theCommonwealth Games in the summer of 1994 and the return of ferry service between Victoriaand Seattle.
The Labour Market
Labour market indicators reflect the province’s relatively good economic performance in 1993and early 1994. British Columbia employment grew 2.9 per cent in 1993 compared to a0.9 per cent increase in the rest of Canada. About four out of five of the new jobs created in1993 were full-time positions. In January and February 1994, employment was 4.4 per centhigher than in the same period last year.

34
Two notable job market developments in 1993 were the rapid growth in self-employment andemployment outside Vancouver and Victoria:
● Self-employment grew 7.3 per cent compared to a 0.5 per cent rise in private-sector paidemployment.
● Employment fell 0.6 per cent in Vancouver (5,000 jobs), but rose 3.2 per cent in Victoria(4,000 jobs) and 7.9 per cent in the rest of the province (45,000 jobs — see Chart A5).Unemployment rates are still higher outside the two largest cities, but the gap has narrowed(see Table G1).
90
95
100
105
110
115
120
Vancouver Victoria Rest of B.C.
1992 1993
CHART A5BRITISH COLUMBIA EMPLOYMENT
January 1992 = 100; seasonally adjusted
Source: Statistics Canada
3-Month Moving Average
The growth in self-employment may be a ‘‘push-pull’’ phenomenon. Corporate downsizingduring the recent recession and the trend toward out-sourcing of legal, accounting and otherservices by larger corporations has resulted in many professionals setting up their ownbusinesses to serve former employers. The ‘‘pull’’ factor is the strength of the British Columbiaeconomy and the appeal of setting up a business to take advantage of the province’s rapidly-growing population and market for consumer and business services.
A 2.1 per cent rise in the province’s labour force limited the fall in the unemployment rate to9.7 per cent in 1993, compared to 10.4 per cent in 1992. In-migration increased significantly in

35
the second half of 1993, resulting in a net inflow of 80,435 people for the full year. As a result,the provincial labour force grew rapidly in the last quarter of 1993 and early in 1994. In Januaryand February, the labour force was 4.7 per cent larger than a year earlier. While in-migration isexpected to decline to 67,600 people in 1994, rapid labour force growth will continue throughmost of the year. As a result, a projected 3 per cent rise in employment is expected to be offsetby a 3 per cent increase in the labour force, leaving the unemployment rate unchanged. In1995, both employment and the labour force are forecast to rise 2.3 per cent, leaving theunemployment rate at 9.7 per cent.
Wages and Prices
Inflation rose from 2.7 per cent in 1992 to 3.5 per cent in 1993, but the monthly year-over-yearinflation rate fell from 4.0 per cent at the beginning of 1993 to 3.0 per cent in December (seeChart A6). In January 1994, the inflation rate fell to 2.5 per cent. Low inflation held down wagesettlements in 1993 as increases averaged 2.3 per cent. Statistics Canada’s fixed-weighted hourlyearnings index, which covers both union and non-union workers, rose 2.4 per cent in 1993.Further declines in inflation are likely in 1994 due to the recent decline in federal tobacco taxesand smaller increases in government-regulated prices this year. Inflation is forecast at 2 per centin 1994 and 1.8 per cent in 1995. Wage settlements are expected to remain low over the nexttwo years and unit labour cost increases should fall in line with inflation.
0
1
2
3
4
5
6
Wage Settlements* CPI Average Hourly
| 1992 | 1993 |
CHART A6B.C. WAGES AND PRICES
Year-over-year percentage change
Sources: Ministry of Skills, Training and Labour*Wage settlements are averages over the life of contractssettled in each quarter
Earnings
& Statistics Canada
Q1 Q2 Q3 Q4 Q1 Q2 Q3 Q4

36
While the number of work-stoppages due to labour disputes rose from 52 in 1992 to 73 in 1993,days not worked due to disputes fell 55 per cent to 345,850. This represented only 0.1 per centof the total time worked by paid employees, down from 0.2 per cent in 1992.
The collective bargaining calendar is heavier in 1994, with 536 major collective agreementsexpiring. The agreements cover 209,000 employees, representing about 40 per cent of theprovince’s unionized workforce. Agreements up for negotiation in 1994 include contractscovering provincial government employees, forest workers and teachers.
Medium-Term Outlook
Chart A7 compares the Ministry of Finance and Corporate Relations 1994 economic growthforecast to projections by the major financial institutions and economic forecasting firms.
Growth in the British Columbia economy is expected to slow over the medium term with realGDP increasing at an annual average rate of 2.7 per cent between 1994 and 1998. A recovery inthe central Canadian economy is expected to reduce net in-migration to British Columbia fromrecent record levels, causing slightly slower growth in consumer spending and housinginvestment. However, steady growth in the United States economy, together with an anticipatedrecovery in Japan and Europe in 1995, should help boost provincial exports.
0
1
2
3
4
5
3.13.4 3.5 3.5
3.7 3.84.1 4.2 4.3
CIBC Ministry ofFinance
B.C.Central
TorontoDominion
ConferenceBoard
ScotiaBank
RoyalBank
WEFACanada
Bank ofMontreal
CHART A7FORECASTS OF B.C. ECONOMIC GROWTH – 1994
Percentage change in real GDP
Credit UnionandCorporateRelations
Bank

37
Risks to the Outlook
The forecast is based on several assumptions about future Canadian and international economicdevelopments. Errors in these external assumptions could affect the economic outlook. Forexample:
● While net in-migration to British Columbia is projected to slow from recent high levels, astronger-than-expected economic recovery in central Canada could cause a larger decline innet in-migration than is currently forecast. This would translate into slower growth inconsumer spending and housing starts. In-migration could be higher than forecast if Albertaor central Canada grow slowly. This would boost the consumer sector but might also pushthe unemployment rate higher.
● Growth in the United States economy could be much stronger than forecast. Similarly,Germany and Japan could pull out of their economic slumps sooner and with greater strengththan expected. In either case, growth in provincial exports would be stronger than currentlyforecast.
● Canadian interest rates may defy economic fundamentals of low inflation and slow growthand continue to rise, either as a result of larger-than-expected increases in U.S. interest rates,or in response to financial market perceptions about Canada’s political and fiscal situation.
● Labour disruptions in some industries that are negotiating new collective agreements in 1994could have a negative impact on the economy.

38
TABLE A1
BRITISH COLUMBIA ECONOMIC OUTLOOK
Budget Actual/Forecast Estimate* Forecast
1993 1994 1995
Gross Domestic Product (percentage change incurrent dollars).............................................................................. 7.1 6.3 6.5 5.5
Real Gross Domestic Product (percentagechange in 1986 dollars)....................................................... 3.2 3.2 3.4 2.8Consumer Expenditure......................................................... 3.0 2.9 3.7 3.4Government Expenditure ................................................... 1.2 1.9 0.8 20.5Capital Investment .................................................................... 2.9 5.5 1.5 3.9Exports.................................................................................................. 2.8 5.5 4.3 3.5Imports .................................................................................................. 1.7 6.8 2.8 3.5
Population (percentage change) ............................................ 2.8 2.4 2.9 2.5
Net In-migration ....................................................................................... 62,400 80,435 67,600 64,500Interprovincial................................................................................. 32,300 42,001 36,000 34,100International ..................................................................................... 30,100 38,434 31,600 30,400
Labour Force (thousands)............................................................. 1,733 1,729 1,781 1,822(percentage change)............................................................... 2.4 2.1 3.0 2.3
Employment (thousands) ............................................................... 1,552 1,561 1,608 1,645(percentage change)............................................................... 2.3 2.9 3.0 2.3
Unemployment Rate (per cent) ............................................... 10.4 9.7 9.7 9.7
Retail Sales (millions of current dollars)......................... 25,878 26,350 27,925 29,460(percentage change)............................................................... 6.1 7.8 6.0 5.5
Housing Starts (units)........................................................................ 43,700 42,807 39,500 40,500(percentage change)............................................................... 7.6 5.4 27.7 2.5
Consumer Price Index (19865100).................................... 131.9 131.6 134.2 136.6(percentage change)............................................................... 3.7 3.5 2.0 1.8
Key Assumptions:
Economic Growth (per cent)Canada ..................................................................................... 2.7 2.4 3.5 3.5United States...................................................................... 3.0 3.0 3.0 2.8Japan.......................................................................................... 2.0 20.1 0.0 2.0Europe....................................................................................... 0.5 20.6 1.2 2.1
Canadian Interest Rates (per cent;annual average)3-month .................................................................................... 5.9 5.0 4.0 3.910-year and over ............................................................ 8.0 7.9 6.8 6.7
U.S.¢/Canadian$......................................................................... 79.0 77.6 75.2 75.4* British Columbia GDP data for 1993 are Ministry of Finance and Corporate Relations estimates.

39
APPENDIX B
Fiscal Review and Outlook
Review of 1993/94
In 1993/94, the deficit was $251 million below budget, and down $477 million from 1992/93.Revenue in 1993/94 was $221 million higher than budget, due to stronger-than-expected growthin natural resource revenue and corporate income taxes. Spending was $30 million belowbudget as savings in income assistance and debt interest costs more than offset pressures inother programs (see Table B1).
TABLE B1
BUDGETARY TRANSACTIONSCONSOLIDATED REVENUE FUND
Budget Revised BudgetEstimate Forecast Estimate1993/94 1993/94 1994/95
($ millions)
Revenue ........................................................................................................................ 17,460.0 17,681.0 18,732.0Program Expenditure ....................................................................................... 18,007.0 18,052.0 18,649.0
Program Surplus (Deficit) ............................................................................ (547.0) (371.0) 83.0Management of Public Funds and Debt ...................................... 988.0 913.0 981.0
Surplus (Deficit) ..................................................................................................... (1,535.0) (1,284.0) (898.0)
The provincial government’s financial requirements totalled $1,020 million in 1993/94. Thisincluded the Consolidated Revenue Fund deficit less net receipts from financing and workingcapital transactions which totalled $264 million (see Table B4).
Financial requirements were $559 million lower than the budget estimate due to the lowerdeficit and to additional net receipts because personal income tax cash instalments from thefederal government were $200 million higher than the estimated tax due to the province.
Because of the lower financial requirements, the increase in provincial government direct debtwas $484 million lower than budget and cash balances were $75 million higher.
Revenue
Revenue totalled $17,681 million in 1993/94, 1.3 per cent higher than the 1993/94 budgetestimate and up 9.4 per cent from the comparable figure for 1992/93. Table B2 shows the majorchanges from budget.
Petroleum and natural gas revenue was $169 million above budget due to higher sales of Crownland drilling rights as a result of a pickup in natural gas prices and the favourable outlook fornatural gas demand over the longer term.

40
TABLE B2
REVENUE CHANGES FROM BUDGET, 1993/94
Higher (Lower)$ millions
Higher petroleum and natural gas revenue ..................................................................................... 169Higher corporation income tax ...................................................................................................................... 102Lower Established Programs Financing revenue ...................................................................... (75)Higher forests revenue .......................................................................................................................................... 66Lower personal income tax .............................................................................................................................. (55)Lower British Columbia Hydro dividends ........................................................................................... (50)Higher revenue from the British Columbia Endowment Fund and
investment earnings ........................................................................................................................................... 48Higher corporation capital tax ........................................................................................................................ 47Lower other sources ................................................................................................................................................ (31)
Total revenue ................................................................................................................................................................ 221
Corporation income tax revenue was $102 million or 16.8 per cent above budget, mainly as aresult of a higher federal forecast of national corporate profits and a larger-than-expectedpositive prior-year adjustment for the 1992 tax year.
Established Programs Financing revenue was $75 million or 5.6 per cent below budget becauseof the reimbursement to the federal government of an overpayment in 1992/93.
The $66-million increase in forests revenue was due to timber sales under the Small BusinessForest Enterprise Program being $52 million above budget and logging tax revenue increasing$17 million. Strong lumber prices were the major contributor to the increase from budget.
Personal income tax revenue was down $55 million or 1.2 per cent from budget. While theestimate of 1993 national basic federal tax (BFT) declined 2.8 per cent, this was partly offset byan increase in British Columbia’s share of BFT. The revised forecast incorporates an accountingchange to record personal income tax on an accrual basis as recommended by the AuditorGeneral. As a result, current-year revenue is the estimated tax due to the province for the fiscalyear regardless of the timing of actual cash receipts from the federal government.
The dividend from British Columbia Hydro and Power Authority was down $50 million frombudget as low water levels in 1993 caused a reduction in net income due to lower electricityexports and increased energy purchases.
Revenue from the B.C. Endowment Fund and investment earnings increased $48 million frombudget due to higher-than-expected returns on investments.
Corporation capital tax revenue was 16.3 per cent above budget due to a higher-than-expectednumber of companies paying the tax. Currently, there are about 25,000 companies registered forthe tax.
Revenue from other sources was $31 million below budget.
● Property tax revenue was $40 million lower than budget because of the government’sdecision to cancel the property tax surtax that was announced in the 1993 budget.
● Liquor Distribution Branch net income was $25 million or 4.8 per cent higher than budgetmainly due to higher volumes sold. The lower Canadian dollar and the federal collection ofprovincial liquor markups at the border caused an increase in domestic liquor purchases.

41
● Fuel tax revenue was $20 million or 3.3 per cent higher than budget due to higherconsumption volumes, partly reflecting the decline in cross-border fuel purchases.
● Tobacco tax revenue was down $20 million or 4 per cent from budget due to a larger-than-expected decline in consumption volumes. Consumption volumes declined about 7 per centin 1993/94, compared to the budget assumption of a 4 per cent decline.
● Social service tax was slightly above budget. Higher-than-expected growth in retail sales andbusiness investment spending offset the impact of the government’s decision to only partiallyimplement the 1993 budget measures.
Expenditure
Expenditure of $18,965 million in 1993/94 was down $30 million from budget and 5.8 per centhigher than comparable spending in the previous year. Table B3 shows that expenditurepressures in some ministries were offset by savings in other programs.
TABLE B3
EXPENDITURE CHANGES FROM BUDGET, 1993/94
Over (Under)$ millions
Ministry of Social Services ................................................................................................................................ (87)Debt interest ..................................................................................................................................................................... (75)Ministry of Health ........................................................................................................................................................ 63Ministry of Attorney General ............................................................................................................................ 60Ministry of Skills, Training and Labour .................................................................................................. 38Ministry of Environment, Lands and Parks ...................................................................................... 32Other programs ............................................................................................................................................................. (61)
Total expenditure ..................................................................................................................................................... (30)
Expenditure by the Ministry of Social Services was $87 million below budget because of alower-than-expected income-assistance caseload. The number of income-assistance casesincreased an estimated 10.9 per cent in 1993/94. In 1992/93, the caseload increased17.1 per cent.
Debt interest costs were $75 million below budget as borrowing and interest rates were lowerthan forecast.
Ministry of Health expenditure was $63 million above budget mainly because of higherspending on the Medical Services Plan and Pharmacare.
Spending by the Ministry of Attorney General was $60 million above budget, mainly due toincreased expenditures for provincial correctional services and higher criminal injurycompensation payments.
Ministry of Skills, Training and Labour expenditure was $38 million above budget mainly due toincreased provisions for doubtful student loans.
Expenditures by the Ministry of Environment, Lands and Parks were $32 million above budgetmainly because of increased land purchases related to the Protected Areas Strategy.
Changes in other programs resulted in net savings of $61 million:
42
● Ministry of Forests expenditure was $22 million below budget because of underspending insilviculture and other activities. Due to cool, wet weather last summer, forest fire suppressioncosts were down 42 per cent from 1992/93.
● The Ministry of Energy, Mines and Petroleum Resources was $13 million below budgetbecause of lower expenditures for Vancouver Island natural gas pipeline assistance.
● The Ministry of Transportation and Highways was $12 million above budget because ofincreased land acquisition costs.
● Ministry of Women’s Equality spending was $10 million higher than budget, mainly becauseof increased demand for day-care subsidies.
● There was a negative adjustment of $25 million to reflect the amortization of the reduction inthe unfunded pension liability of the Public Service Superannuation Fund. The latest actuarialvaluation shows a liability of $140 million, down from $438 million.
1994/95 Fiscal Plan
Table B1 summarizes the budgetary transactions of the Consolidated Revenue Fund.
Revenue for 1994/95 is estimated at $18.7 billion, an increase of 5.9 per cent from the 1993/94revised forecast. This includes a net reduction of $92 million due to revenue measuresintroduced in the 1994 budget (see Appendix C).
Expenditure will total $19.6 billion in 1994/95, up 3.5 per cent from the 1993/94 revised forecastand the lowest rate of spending growth since 1985/86. The Consolidated Revenue Fund deficit isestimated at $898 million in 1994/95. This is $386 million or 30 per cent lower than the revisedforecast for 1993/94.
Program expenditure, which excludes spending on debt interest costs (management of publicfunds and debt), is estimated at $18.6 billion, an increase of 3.3 per cent from the 1993/94revised forecast.
As a result, there will be a program surplus of $83 million in 1994/95, compared to a programdeficit of $371 million for 1993/94. This is the first program surplus since 1989/90. A programsurplus means that revenue exceeds spending on government programs and that debt interestaccounts for the entire deficit in 1994/95.
The government’s financial requirements, consisting of the deficit and net disbursements fromfinancing and working capital transactions, will total $1,098 million in 1994/95. Netdisbursements from financing and working capital transactions include disbursements relating toan overpayment of personal income tax in 1993/94.
The government is winding up the British Columbia Endowment Fund and using the proceedsto pay down debt (see Appendix E). Financial requirements in 1994/95 will be met by reducingcash and short-term investments by $160 million, by using $300 million obtained from the saleof endowment fund assets, and by increasing government direct debt by $638 million (seeTable B4).
1994/95 Revenue
Revenue of the Consolidated Revenue Fund for 1994/95 is estimated at $18,732 million, anincrease of 5.9 per cent from the revised forecast for 1993/94. This includes the impact ofrevenue measures introduced in the 1994 budget, which reduce revenue by $92 million.

43
TABLE B4
SUMMARY OF TRANSACTIONSCONSOLIDATED REVENUE FUND
Budget Revised BudgetEstimate Forecast Estimate1993/94 1993/94 1994/95
($ millions)
Consolidated Revenue Fund Surplus (Deficit) ...................... (1,535.0) (1,284.0) (898.0)Net Receipts (Disbursements) from Financing and
Working Capital Transactions1.......................................................... (44.0) 264.3 (200.3)Decrease (Increase) in Cash and Short-Term
Investments ........................................................................................................... 5.0 (70.0) 160.0British Columbia Endowment Fund Proceeds......................... — — 300.0
Net (Increase) Decrease in Provincial GovernmentDirect Debt2 ........................................................................................................ (1,574.0) (1,089.7) (638.3)
1 Financing and working capital transactions represent either a source or use of funds, such as the payment or collection of loans andaccounts payable/receivable, or non-cash transactions including allowances for doubtful accounts. They do not cause a change in theannual surplus (deficit) but only a change in the composition of the provincial government’s assets and liabilities.
2 Includes direct debt incurred for government operating purposes and does not include debt incurred by, or on behalf of, Crowncorporations and agencies.
Taxation revenue, the largest source of provincial government revenue, is expected to total$11,720 million in 1994/95, up 7.2 per cent from the 1993/94 revised forecast (see Table B5).
Personal income tax revenue is expected to increase 8.3 per cent to $4,767 million. This reflectsgrowth in personal incomes, the increase to the high income surtax rate in 1994 as announcedin the 1993 budget, and the impact of 1994 federal budget measures, which broadened the taxbase. Because personal income tax revenue is now recorded on an accrual basis, current-yearrevenue is the estimated tax due to the province for the fiscal year regardless of the timing ofactual cash receipts from the federal government.
Corporation income tax revenue is estimated at $873 million, an increase of 23.1 per cent,mainly due to growth in corporate profits.
Social service tax revenue, estimated at $2,811 million, will increase 7.5 per cent, due to growthin retail sales and investment and the full-year impact of 1993 budget measures, which extendedthe tax to certain labour services. The forecast includes a revenue loss of $32 million from the1994 budget measures, which introduce a vehicle trade-in allowance and raise the threshold forthe tax on luxury vehicles.
Property tax revenue is expected to increase 3.1 per cent in 1994/95, due to increasedassessments from new construction, partly offset by the impact of increasing the threshold forthe phase out of the home owner grant. Property transfer tax revenues will increase 1 per centas the effect of continued strength in real estate markets will be partly offset by the introductionof a tax exemption for first-time home buyers.
Fuel tax revenue will rise 1.9 per cent in 1994/95 due to increased consumption volumes, partlyoffset by the impact of reducing the tax rate on jet fuel used on international flights. Tobaccotax revenue will decline 6 per cent, reflecting lower volumes subject to tax.
Corporation capital tax revenue will rise 8.7 per cent because of growth in the tax base, partlyoffset by an $18 million revenue loss from budget measures. Revenue from insurance premium

44
TABLE B5
REVENUE BY SOURCECONSOLIDATED REVENUE FUND
Budget Revised BudgetEstimate Forecast Estimate Increase1993/941 1993/94 1994/95 (Decrease)2
($ millions) (per cent)Taxation Revenue:Personal income............................................................................ 4,458.0 4,403.0 4,767.0 8.3Corporation income.................................................................... 607.0 709.0 873.0 23.1Social service ................................................................................... 2,605.0 2,615.0 2,811.0 7.5Property ................................................................................................. 1,216.0 1,176.0 1,212.0 3.1Fuel............................................................................................................. 604.0 624.0 636.0 1.9Other.......................................................................................................... 1,372.0 1,405.0 1,421.0 1.1
10,862.0 10,932.0 11,720.0 7.2
Natural Resource Revenue:Petroleum, natural gas and minerals....................... 263.0 431.0 389.0 (9.7)Forests..................................................................................................... 913.0 979.0 1,153.0 17.8Water and other ............................................................................. 305.0 301.0 277.0 (8.0)
1,481.0 1,711.0 1,819.0 6.3
Other Revenue ................................................................................... 1,673.0 1,731.0 1,792.0 3.5
Contributions from Government Enterprises 1,079.0 1,026.0 1,051.0 2.4
Contributions from the FederalGovernment:
Established Programs Financing.................................. 1,350.0 1,275.0 1,295.0 1.6Canada Assistance Plan and other........................... 1,015.0 1,006.0 1,055.0 4.9
2,365.0 2,281.0 2,350.0 3.0
TOTAL REVENUE ............................................................................ 17,460.0 17,681.0 18,732.0 5.9
1 Restated to conform to the 1994/95 budget estimates.2 Percentage change between the 1993/94 revised forecast and the 1994/95 budget estimate.
tax is expected to rise 6.3 per cent, due to higher motor vehicle insurance rates and peoplebuying more insurance.
Natural resource revenue is expected to increase 6.3 per cent to $1,819 million due to higherforests revenue.
Revenue from petroleum, natural gas and minerals will decline by $42 million. An anticipated$50-million decline in sales of Crown land drilling rights from the record levels in 1993/94, andthe $12 million in mineral tax relief measures announced in the budget are partly offset by a$22 million increase in natural gas royalties due to higher natural gas prices and production.
Water rental revenue is based on the previous year’s water use. In 1994/95, this will decline9.5 per cent mainly due to reduced electricity generation in 1993/94 and the effect of the budgetmeasure to reduce water rental charges for companies generating power for their own use.

45
Other revenue is expected to rise 3.5 per cent to $1,792 million. Medical Services Plan premiumrevenue will increase 2.5 per cent, reflecting increased subscription levels due to continuedin-migration. Revenue from other fees and licences, including motor vehicle licences and fees,will rise 7.3 per cent. Just over half of the increase is due to volume increases, with the restfrom rate adjustments to be introduced during the year. British Columbia Endowment Fundrevenue will increase 12.3 per cent. The fund is being wound up with the proceeds used to paydown debt.
Contributions from government enterprises will total $1,051 million, up 2.4 per cent from the1993/94 revised forecast. Liquor Distribution Branch profits are expected to increase1.8 per cent, reflecting continued growth in sales volumes. Dividends from British ColumbiaHydro and Power Authority are forecast at $235 million, down slightly from 1993/94.
Contributions from the federal government are estimated at $2,350 million, an increase of3.0 per cent. Revenue from Established Programs Financing (EPF) is expected to grow1.6 per cent from the 1993/94 level, which was artificially low due to the effect of a repaymentmade in that year. EPF revenue declines 2.3 per cent, excluding this payment. Recoveries underthe Canada Assistance Plan (CAP) will rise to $880 million, reflecting the federal government’s5-per-cent growth limit on contributions.
1994/95 Expenditure
Expenditure of the Consolidated Revenue Fund is estimated at $19,630 million in 1994/95, anincrease of $665 million or 3.5 per cent from the revised forecast for 1993/94 (see Table B6).This compares to expenditure growth of 5.8 per cent in 1992/93.
Ministry of Social Services expenditure is estimated at $2,736 million, an increase of $173 millionor 6.7 per cent from the 1993/94 revised forecast. Income-assistance spending will increase$113 million or 6.6 per cent, due to a slowing in the growth of caseloads.
Ministry of Health spending is estimated to increase to $6,414 million, up $141 million or2.3 per cent from the revised forecast for 1993/94. Significant spending increases include$86 million for community support programs and $45 million for the Medical Services Plan.
Ministry of Education expenditure shows an increase of 3.6 per cent from the 1993/94 revisedforecast. In 1994/95, operating contributions to elementary and secondary schools will increase$130 million or 4 per cent.
Spending by the Ministry of Skills, Training and Labour is projected to total $1,557 million, anincrease of $127 million or 8.9 per cent from the 1993/94 revised forecast. The increase includes$84 million for new initiatives to strengthen skills training. Spending for the educationalinstitutions and organizations program will increase $34 million in 1994/95.
Ministry of Forests expenditure is estimated to increase $76 million or 11.9 per cent to$712 million. Most of the increase results from changes that will be required to implement thenew Forest Practices Code, and increased spending in the Small Business Forest EnterpriseAccount.
Ministry of Aboriginal Affairs expenditure is estimated at $32 million, an increase of $13 millionmainly because of increased expenditures for treaty negotiations.

46
TABLE B6
EXPENDITURE BY MINISTRYCONSOLIDATED REVENUE FUND
Budget Revised BudgetEstimate Forecast Estimate Increase1993/941 1993/941 1994/95 (Decrease)2
($ millions) (per cent)
Legislation ......................................................................................... 24.0 25.0 24.4 (2.4)Auditor General............................................................................ 6.9 6.9 7.6 10.1Commission on Resources and
Environment .............................................................................. 4.2 4.2 4.2 —Conflict of Interest Commissioner............................. 0.2 0.2 0.2 —Information and Privacy Commissioner.............. 1.2 1.2 2.2 83.3Ombudsman.................................................................................... 4.4 4.4 4.6 4.5Office of the Premier and Cabinet Office.......... 22.2 22.1 22.3 0.9Aboriginal Affairs ........................................................................ 17.9 19.3 32.2 66.8Agriculture, Fisheries and Food.................................. 89.0 87.5 80.1 (8.5)Attorney General ........................................................................ 766.7 826.4 793.4 (4.0)Education ........................................................................................... 3,650.1 3,649.4 3,782.0 3.6Employment and Investment ......................................... 429.8 432.1 447.5 3.6Energy, Mines and Petroleum Resources ....... 69.0 55.7 66.7 19.7Environment, Lands and Parks................................... 250.1 281.9 264.3 (6.2)Finance and Corporate Relations............................. 98.3 99.4 101.0 1.6Forests.................................................................................................. 657.8 636.3 711.8 11.9Government Services............................................................ 112.6 112.1 85.9 (23.4)Health..................................................................................................... 6,210.1 6,272.6 6,414.0 2.3Housing, Recreation and Consumer
Services......................................................................................... 98.0 98.2 102.4 4.3Municipal Affairs.......................................................................... 355.5 353.6 360.4 1.9Skills, Training and Labour .............................................. 1,392.2 1,429.7 1,557.1 8.9Small Business, Tourism and Culture................... 104.9 103.6 112.1 8.2Social Services............................................................................. 2,650.6 2,563.5 2,736.0 6.7Transportation and Highways ....................................... 776.2 788.3 684.0 (13.2)Women’s Equality...................................................................... 160.2 170.2 203.7 19.7Other Appropriations:
Management of Public Funds and Debt ...... 988.0 913.0 981.0 7.4Contingencies and New Programs.................... 30.0 3.3 45.0 —Other3,4.......................................................................................... 24.9 4.9 3.9 (20.4)
TOTAL EXPENDITURE...................................................... 18,995.0 18,965.0 19,630.0 3.51 Restated to conform to the 1994/95 budget estimates.2 Percentage change between the 1993/94 revised forecast and the 1994/95 budget estimate.3 Other includes the Corporate Accounting System Vote, the Public Sector and Public Service Human Resource Management Vote, the
Insurance and Risk Management Special Account, the South Moresby Implementation — Forestry Compensation Special Account andother appropriations.
4 The revised forecast and the budget estimate each include a $24.8 million negative adjustment to reflect the amortization of a reductionin the unfunded pension liability of the Public Service Superannuation Fund.
Ministry of Government Services expenditure is estimated at $86 million, a decrease of$26 million or 23.4 per cent mainly because of decreased requirements for GO BC communitygrants and lower payments to the Victoria Commonwealth Games. The Build BC SpecialAccount in the Ministry of Employment and Investment will fund the community grantsprogram.
Ministry of Women’s Equality expenditure of $204 million is expected to increase $34 million or19.7 per cent from the 1993/94 revised forecast mainly because of increased demand forday-care subsidies.

47
Ministry of Transportation and Highways spending, estimated at $684 million, will decrease$104 million due to reduced capital spending. The BC Transportation Financing Authority isnow responsible for highway capital construction in British Columbia.
Expenditure on Management of Public Funds and Debt is estimated to rise to $981 million, up7.4 per cent from the 1993/94 revised forecast due to higher debt outstanding.
1994/95 Financing Plan
Gross borrowing for government purposes is estimated at $1,659 million in 1994/95. Grossborrowing will be partly offset by debt maturities and sinking fund contributions and earningstotalling $1,021 million. As a result, net government direct debt is expected to increase$638 million to $10.7 billion at March 31, 1995 (see Tables B4 and D1).
Gross borrowing requirements for Crown corporations and agencies are estimated at $2,451million. This increase will be partially offset by repayment provisions of $1,021 million, resultingin net borrowing of $1,430 million in 1994/95. Other guarantees are expected to decrease$44 million. See Appendix D for details.
Accumulated Deficit
At March 31, 1995, the accumulated deficit of the Consolidated Revenue Fund is expected tototal $10,573 million, up $898 million from March 31, 1994.

This page has
intentionally been
left blank

49
APPENDIX C
Revenue Measures
C1: Summary of Revenue Measures
Revenue EffectsEffective Date 1994/95 Full Year
($ millions)Corporation Capital Tax Act● Exemption threshold increased to $1.5 million
from $1.25 million of paid-up capital, andincorporated family farms and cooperativesexempted from the tax ......................................................................... April 1, 1994 (10) (10)
● Threshold at which large financial institutions startto pay the 3 per cent rate raised to $750 millionfrom $500 million of worldwide paid-up capital .......... April 1, 1994 (8) (8)
Property Transfer Tax Act● Targeted first-time home buyers’ exemption
introduced and existing high-ratio tax reliefprogram phased out ............................................................................... March 23, 1994 (20) (20)
Social Service Tax Act● Luxury tax threshold for passenger vehicles
increased to $32,000 from $30,000 ....................................... March 23, 1994 (2) (2)
● Trade-in allowance restored on purchase ofpassenger vehicles .................................................................................. March 23, 1994 (30) (30)
● Exemption introduced for certain solar, wind andmicro-hydro power generating equipment ....................... March 23, 1994 — —
Motor Fuel Tax Act● Tax rate on jet fuel used on international flights
reduced to 4 cents per litre from 5 cents per litreand exemption for international cargo flightsexpanded ........................................................................................................... July 1, 1994 (8) (11)
● Fuel tax rebate limit increased to $400 from $300annually for eligible persons with disabilities ................ August 1, 1993 — —
Home Owner Grant Act● Home owner grant phase-out threshold increased
to $450,000 from $400,000 ............................................................. 1994 tax year (10) (10)
School Act● School property tax rates for residential and some
non-residential properties reduced in response toincreases in assessed values. Rate reductions willresult in average gross school taxes equal to1993 levels ....................................................................................................... 1994 tax year — —

50
C1: Summary of Revenue Measures — Continued
Revenue EffectsEffective Date 1994/95 Full Year
($ millions)Taxation (Rural Area) Act● General-purpose rural area tax rates reduced in
response to increases in assessed values. Ratereductions will result in average general-purposerural area taxes equal to 1993 levels ................................... 1994 tax year — —
Water Act● Companies generating power for their own
industrial use moved to commercial category ............. March 23, 1994 (9) (9)
Other Revenue● Various fees and licences adjusted ........................................ various 20 25
Fairness Package● Measures introduced to assist small business,
improve enforcement and improve fairness ................... March 23, 1994 (2) (2)
Assistance for the Mining Industry
Income Tax Act● Mineral tax made deductible against provincial
corporate income tax ............................................................................. January 1, 1995 (1) (2)
Mineral Tax Act● Mineral tax rates reduced for coal mines and
pooling of exploration costs allowed ...................................... March 23, 1994 (12) (12)
● A premium allowance is introduced for neweligible capital expenditures ........................................................... January 1, 1995 — —
Total .............................................................................................................................................................. (92) (91)
Revenue Measures: Supplementary Information
CORPORATION CAPITAL TAX ACT
EXEMPTION THRESHOLD INCREASED AND FAMILY FARMS ANDCOOPERATIVES EXEMPTED
Effective April 1, 1994, the exemption threshold is increased to $1.5 million from $1.25 millionof paid-up capital, and the tax will now be phased in between $1.5 million and $1.75 million ofpaid-up capital. This change eliminates the corporation capital tax liability for approximately1,000 corporations and reduces the tax liabilities for a further 1,000 corporations.
Cooperatives and incorporated family farms are exempt from corporation capital tax effectiveApril 1, 1994. This change eliminates the tax for about 500 corporations.

51
THRESHOLD FOR 3 PER CENT TAX RATE APPLICABLE TO FINANCIALINSTITUTIONS INCREASED
The threshold at which large financial institutions start to pay the 3 per cent rate is raised to$750 million from $500 million of worldwide paid-up capital, effective April 1, 1994.
PROPERTY TRANSFER TAX ACT
TARGETED FIRST-TIME HOME BUYERS’ EXEMPTION INTRODUCED
Eligible first-time home buyers are exempted from property transfer tax effective March 23, 1994on the purchase of eligible residential property.
Application to register the purchase of the eligible residential property in the land title systemmust be made on or after March 23, 1994 to qualify for the exemption. Refunds will be providedwhere first-time buyers pay tax in error on transfers registered on or after March 23, 1994.
Eligible first-time home buyers are individuals who:
● have not previously held a registered interest in a residence in which they lived;
● have resided in British Columbia for at least one year prior to applying for the exemption;
● are Canadian citizens or lawfully admitted to Canada for permanent residence; and
● have registered financing for an amount equal to 70 per cent or more of the fair marketvalue of the property.
Eligible residential properties are:
● properties acquired for and used as the purchaser’s principal residence for at least one yearfollowing the application for exemption;
● properties with a fair market value not exceeding $250,000 in the Greater VancouverRegional District, the Central Fraser Valley Regional District, the Dewdney-Alouette RegionalDistrict, the Fraser-Cheam Regional District and the Capital Regional District; and
● properties with a fair market value not exceeding $200,000 in the rest of the province.
Applicants will be required to sign a declaration that they meet all eligibility requirements andprovide access to certain personal information for verification purposes.
The current high-ratio financing tax relief program will be phased out. Applications for tax reliefunder this program will be accepted for registrations made before July 1, 1994.
SOCIAL SERVICE TAX ACT
LUXURY SALES TAX THRESHOLD INCREASED
The threshold for the luxury tax on the purchase, lease or rental of expensive passengervehicles is increased to $32,000 from $30,000, effective March 23, 1994. As of that date, the taxrates applicable to passenger vehicles are as follows:
● 7 per cent on passenger vehicles valued at less than $32,000;
● 8 per cent on passenger vehicles valued at $32,000 or more but less than $33,000;
● 9 per cent on passenger vehicles valued at $33,000 or more but less than $34,000; and
● 10 per cent on passenger vehicles valued at $34,000 or more.
‘‘Passenger vehicles’’ are motor vehicles designed primarily for the transportation of individualsand include trucks and vans up to and including three-quarter ton. Excluded from the definition

52
are trucks and vans larger than three-quarter ton, motorhomes, trailers, buses, ambulances andcamperized vans designed primarily for accommodation during travel or recreation.
The tax rate on vehicles for which lease agreements were entered into prior to March 31, 1993,is based on the value of the vehicle on March 31, 1993. For all other leased and rented vehicles,the tax rate is based on the value of the vehicle on the date the lessor first leases the vehicle toa lessee.
The new luxury tax threshold applies to all passenger vehicles purchased on or after March 23,1994. For leased vehicles, the new luxury tax threshold applies to payments for lease periodsthat begin on or after March 23, 1994.
TRADE-IN ALLOWANCE RESTORED ON PURCHASES OFPASSENGER VEHICLES
Effective March 23, 1994, the trade-in allowance on the purchase of a passenger vehicle isrestored. Social service tax is only payable on the purchase price of a passenger vehicle less thevalue of tangible personal property taken in trade as partial payment for the vehicle.
Purchasers of passenger vehicles that are subject to the luxury tax are required to pay theapplicable luxury tax rate on the difference between the purchase price of the luxury vehicleand the value of tangible personal property accepted in trade by the seller as partial paymentfor the vehicle.
The trade-in allowance applies to all passenger vehicles purchased on or after March 23, 1994,regardless of when an agreement to purchase was entered into.
As a partial offset to these changes, the motor vehicle transfer fee will be increased to $28 from$18 on July 1, 1994. This fee increase is expected to raise $6 million in 1994/95 and $8 millionin a full year.
EXEMPTION INTRODUCED FOR SOLAR, WIND, ANDMICRO-HYDRO POWER GENERATING EQUIPMENT
Effective March 23, 1994, purchases and leases of eligible wind, solar, and micro-hydro powergenerating equipment are exempt from social service tax.
Purchases of services to install, assemble, dismantle, repair, adjust, restore, recondition, refinish,or maintain such equipment are also exempt.
MOTOR FUEL TAX ACT
TAX RATE ON JET FUEL USED ON INTERNATIONAL FLIGHTS REDUCED
Effective July 1, 1994, the tax rate on jet fuel used on international flights is reduced to4 cents per litre from 5 cents per litre. The reduction is designed to help advance the VancouverInternational Airport as a major North American gateway to the Pacific.
Also effective July 1, 1994, the jet fuel tax exemption for dedicated international freighters isexpanded to include all eligible international flights carrying cargo on a pro-rated basis. As aresult, for passenger flights carrying cargo, the fuel tax rebate will be based on the ratio of cargoweight to the total payload weight of the aircraft.
FUEL TAX REBATE LIMIT INCREASED FORELIGIBLE PERSONS WITH DISABILITIES
The annual maximum fuel tax rebate available to eligible persons with disabilities who own orlease vehicles is raised to $400 from $300. The new maximum is effective for the current benefityear which began August 1, 1993 and in subsequent years.

53
HOME OWNER GRANT ACT
Effective for the 1994 taxation year, the home owner grant phase-out threshold is increased to$450,000 from $400,000. This change is in response to increases in assessed values of residentialproperties. The grant is phased out at the rate of $10 of grant for each $1,000 of assessed valuein excess of $450,000. As a result, the grant is eliminated for most homeowners having a homeassessed at more than $497,000. For homeowners who are seniors, handicapped or recipients ofwar veterans allowances, the grant is eliminated for homes assessed in excess of $524,500.Setting the threshold at $450,000 means that, as was the case in 1993, roughly 95 per cent ofhomeowners are unaffected by the phase-out of the home owner grant.
SCHOOL ACT
School property tax rates for residential and some non-residential property classes will bereduced in response to increased assessed values. The rates for the 1994 tax year will beadjusted such that average gross school property taxes for residential and non-residentialproperties will be the same as 1993 levels.
Even with the freeze on average tax levels, there will be some changes to individual tax bills.For example, homeowners who had a below-average increase in assessed value can expect areduction in school property tax. Correspondingly, the school levy will likely rise forhomeowners whose property has increased in value by more than the average. Similar shifts willoccur within the non-residential property classes.
TAXATION (RURAL AREA) ACT
The general-purpose rural area property tax rates will be adjusted to compensate for higherassessed values in 1994. The rate for residential properties will be reduced by almost14 per cent from the 1993 level of $1.45 per $1,000 of assessed value. The rates for other classesof property will be adjusted appropriately. Rates will be set in April 1994. The rate changesensure that average rural area taxes levied by the province will be the same as in 1993.Nevertheless, due to relative assessment changes, some property owners will experience anincrease in their rural area levy, while others will face a corresponding reduction in their levy.
WATER ACT
Companies currently in the general water rental category will move to the commercial categoryfor that portion of power which is generated for their own industrial use. Water rental paymentsmade in September 1994 and subsequent payments are affected.
OTHER REVENUE
A number of changes to fees and licences will be introduced during the fiscal year. Thesechanges help cover the government’s additional cost of providing existing or new services.Changes to fees and licences include:
● increasing licence fees for companies and their employees providing security services;
● raising hunting and angling licence fees (angling fee increases will be dedicated to theHabitat Conservation Fund);
● reducing lease fees for specified commercial and recreational docks on Crown land;
● increasing vital statistics fees;
● amending fees of the British Columbia Securities Commission;
● increasing safety inspection fees for electrical and gas installations, elevators and boilers;

54
● introducing direct sellers licences, manufactured homes and residential tenancy mediationand review fees, and changing other fees of the Ministry of Housing, Recreation andConsumer Services;
● increasing Motor Carrier Commission fees; and
● as noted earlier, raising the motor vehicle transfer fee.
FAIRNESS PACKAGE
The following measures are introduced to assist small business, enhance the fairness of the taxsystem, and improve enforcement.
Assistance to Small Business
● Tax Remittance Frequencies
Businesses collecting an average of $50 or more in provincial sales tax or hotel room tax eachmonth are currently required to file monthly tax returns. Effective April 1, 1994, businessescollecting between $50 and $200 of tax each month will have the option of filing tax returnsquarterly, semi-annually, or on some other basis that is more compatible with the nature of theirbusiness.
The change in filing frequency will reduce compliance costs for about 8,500 small businesses.All businesses affected by the change will be contacted to determine the filing frequency mostcompatible with their business.
● Commissions
Businesses that collect provincial sales tax and hotel room tax receive a commission to helpoffset collection costs. The maximum commission is currently $90 per reporting period, or$1,080 annually.
Effective with tax returns filed for sales made in April 1994, the commission rate is increased by10 per cent to a maximum of $99 per reporting period or $1,188 annually.
Approximately 90,000 businesses will benefit from the increased commission.
● Boats Purchased by Aquaculturists
Bona fide aquaculturists are currently eligible for a refund of tax paid on purchases of boats upto 11 metres in length, motors, and related parts acquired for use in their aquaculture business.Effective March 23, 1994, bona fide aquaculturists may purchase qualifying boats, motors andcomponent parts exempt from the tax at the point of sale.
Improved Enforcement
● Amnesty Program
Effective March 23, 1994 to June 30, 1994, businesses that voluntarily disclose tax liabilities andpay, or make arrangements to pay, these tax liabilities plus interest will not be subject topenalties or prosecution. Penalties range from 10 per cent to 100 per cent of tax due.
● Enforcement of Current Penalties
After the expiration of the amnesty program, a 10 per cent penalty will be applied to all secondand subsequent errors in tax payments and remittances.
55
Currently, the 10 per cent penalty is only applied where tax is collected and not remitted or isremitted late. Effective July 1, 1994, the penalty will also be applied to all second-time errors,including tax due on purchases and the calculation of tax collected.
Penalties of 25 per cent and 100 per cent of the tax due will continue to apply where there isevidence of willful failure to pay the tax due or willful non-remittance of tax collected.
● Expanded Audit Coverage
Additional auditors will be hired to increase the number of businesses that can be audited eachyear. The expanded audit coverage will reduce inequities that occur when some businesses donot comply with tax legislation.
● Sellers of Motor Vehicles — Licensing Requirement
Effective March 23, 1994, persons who intend to regularly sell motor vehicles at retail must beregistered as dealers under the Motor Dealer Act before registration under the Social Service TaxAct. This requirement will prevent persons who are not licensed motor dealers from purchasingvehicles for resale exempt from the provincial sales tax.
Improved Fairness
● Appeal Period Extended
Effective for assessments issued on or after March 23, 1994, the appeal periods under the SocialService Tax Act, Hotel Room Tax Act, Motor Fuel Tax Act, and Tobacco Tax Act are extendedfrom 60 to 90 days.
● Proportional Refund for Bad Debts
Effective March 23, 1994, sellers are eligible for a proportional refund of tax remitted on all baddebt accounts. For example, where $14 of social service tax is remitted on a $200 credit sale andthe seller subsequently receives only $20 before writing it off as a bad debt, the province willretain only $1.31 — 7/107 of the $20 payment received by the seller — and the seller willreceive a refund of $12.69.
This change in bad debt refunds applies to the Social Service Tax Act, Hotel Room Tax Act,Motor Fuel Tax Act, and Tobacco Tax Act. It is fairer to businesses and is consistent with baddebt provisions of most other provinces and the federal government.
● Deemed Purchase Provision Repealed
Currently, where a lease agreement contains an option-to-purchase for an amount less than10 per cent of the item’s fair market value, the lease is deemed to be a purchase.
Effective March 23, 1994, this provision is repealed and tax applies to such leases in the samemanner as to other leases.
ASSISTANCE FOR THE MINING INDUSTRY
INCOME TAX ACT
● Effective January 1, 1995, mineral tax payments will be deductible in calculating a miningcompany’s provincial corporate income tax.

56
MINERAL TAX ACT
MINERAL TAX RATES REDUCED FOR COAL MINES ANDPOOLING OF EXPLORATION COSTS ALLOWED
● Effective March 23, 1994, mineral tax rates for coal mines are reduced from the current7.5 per cent (net current proceeds tax) and 17.5 per cent (net revenue tax) to 2 per cent and13 per cent to match the rates paid by other mines. All coal mines in the province will benefitfrom this change.
● Effective March 23, 1994, mining companies are allowed to pool exploration costs rather thanhaving to assign these costs to an existing mine.
PREMIUM ALLOWANCE IS INTRODUCED FORELIGIBLE NEW CAPITAL EXPENDITURES
● Capital expenditure on new, reopened or expanded mines after December 31, 1994, andbefore January 1, 2000, will be grossed up by one-third for purposes of calculating mineraltax. This will provide a significant benefit for new mines developed during the next fiveyears.
C2: Summary of Administrative Measures
Effective Date
Social Service Tax Act● Exemption provided for certain items purchased by interprovincial
and international airlines ..................................................................................................................... March 23, 1994
● Refund provisions for goods purchased and stored, but not used, inBritish Columbia clarified .................................................................................................................... March 23, 1994
● Definition of ‘‘purchase price’’ clarified ................................................................................. March 23, 1994
● Definition of ‘‘use’’ clarified ............................................................................................................... March 23, 1994
● Refund provided for tax paid on materials to construct portablebuildings for export .................................................................................................................................... March 23, 1994
● List of items that can be purchased tax exempt by bona fide farmersexpanded ............................................................................................................................................................. March 23, 1994
Tobacco Tax Act● Tobacco tax commission increased ......................................................................................... 1994 tax collection
yearHotel Room Tax Act● Exemption provided for purchase of accommodation by Indians and
Indian Bands on reserve ..................................................................................................................... March 23, 1994
Corporation Capital Tax● Various technical changes made to clarify the application of the tax ... April 1, 1992, 1993
and 1994Property Transfer Tax● Tax imposed on consecutive leases to prevent tax avoidance ................... January 31, 1994

57
Administrative Measures: Supplementary Information
SOCIAL SERVICE TAX ACT
EXEMPTION PROVIDED FOR CERTAIN ITEMS PURCHASED BYINTERPROVINCIAL AND INTERNATIONAL AIRLINES
Effective March 23, 1994, liquor and certain other tangible personal property purchased orleased by commercial airlines for use or consumption in serving their passengers oninternational or interprovincial flights are exempt from tax. Examples include cutlery, dishes,trays, towels and headphones.
REFUND FOR GOODS PURCHASED AND STORED, BUT NOT USED, INBRITISH COLUMBIA
Effective March 23, 1994, the legislation is clarified to ensure that businesses operating bothinside and outside of British Columbia are eligible for a refund of tax paid on goods purchasedand stored in the province, but not otherwise used in the province before being sent out of theprovince.
DEFINITION OF PURCHASE PRICE CLARIFIED
Effective March 23, 1994, the definition of ‘‘purchase price’’ on which tax is payable is amended.The amendment clarifies that, for purchases in the province, charges for installation,transportation, interest, finance, service, customs and excise are only subject to tax if suchcharges are incurred before title to the goods passes to the purchaser.
DEFINITION OF USE CLARIFIED
Effective March 23, 1994, the definition of ‘‘use’’ is amended to clarify that the purchase ofgoods for resale by both retailers and wholesalers is exempt from the social service tax.
REFUND OF TAX PAID ON MATERIALS USED TO CONSTRUCTPORTABLE BUILDINGS FOR EXPORT
Effective March 23, 1994, a refund is provided for the sales tax paid on materials used toconstruct portable buildings that are subsequently exported.
Portable buildings are buildings designed to be moved from location to location (e.g., portableclassrooms, portable bunkhouses) but do not include manufactured homes used for residentialpurposes or buildings designed for use on residential property.
ADDITIONAL EXEMPTIONS FOR FARMERS
Effective March 23, 1994, the following are added to the list of items that bona fide farmers maypurchase exempt from provincial sales tax provided that they are used for a farm purpose.
● Soil anchors;
● Sanitizing products and chemicals; and
● Automatic gate openers.

58
TOBACCO TAX ACT
TOBACCO TAX COMMISSION INCREASED
Tobacco wholesalers collect the provincial tobacco tax and remit the tax to the government.Effective for the 1994 tax collection year, the maximum commission payable is increased to$10,000 from $5,000 per year.
HOTEL ROOM TAX ACT
TAX EXEMPTION FOR STATUS INDIANS
Effective March 23, 1994, Indians and Indian Bands buying hotel accommodation on reserveland are exempt from paying the hotel room tax.
CORPORATION CAPITAL TAX ACT
TECHNICAL CHANGES
Various technical changes will clarify the application of the tax. Some of these changes areretroactive to April 1, 1992 or April 1, 1993. The remainder are effective April 1, 1994.
PROPERTY TRANSFER TAX ACT
TAX IMPOSED ON CONSECUTIVE LEASES TO PREVENT TAX AVOIDANCE
As announced on January 28, 1994, amendments are introduced retroactive to January 31, 1994to prevent tax avoidance through the inappropriate use of the exemption for leases of 30 yearsor less.
The Act is amended to aggregate the terms of all leases registered against a property within asix-month period for purposes of calculating the tax payable.

59
APPENDIX D
Provincial Government and Crown CorporationFinancing PlanOverview
The provincial government and its Crown corporations and agencies incur debt to financeoperations and capital projects. The provincial government also provides some financing toother organizations, including local government agencies. Total borrowing requirements in1994/95 for the government and its Crown corporations and agencies are estimated at$4.1 billion. This compares to total borrowing of $4.8 billion in 1993/94.
In the early 1990s, large deficits and borrowing to fund schools, hospitals and other socialcapital investment caused both tax-supported debt and total debt to rise relative to GDP.The government’s efforts to reduce the deficit have moderated this increase (see Chart D1).The government’s debt management strategy will slow the growth in debt relative to GDP(see Appendix E).
At March 31, 1995, total provincial direct and guaranteed net debt is expected to total$27.4 billion, equal to 28.1 per cent of gross domestic product (GDP). Tax-supported debt,which excludes the self-supporting debt of the British Columbia Hydro and Power Authority andBritish Columbia Railway Company, is expected to total $19.5 billion or 20 per cent of GDP.
0
5
10
15
20
25
30
35
Tax-supported Self-supporting
1985 1986 1987 1988 1989 1990 1991 1992 1993 1994 1995
CHART D1DIRECT AND GUARANTEED NET DEBTAS A PER CENT OF GDP
Per cent
Year Ending March 31

60
Financing Process
The provincial government and its Crown corporations and agencies incur debt by one of threefinancing methods:
● debt issued by the government for its own purposes;
● fiscal agency debt borrowed directly by the government with proceeds re-lent to Crowncorporations and agencies; and
● debt incurred by Crown corporations and others with a provincial government guarantee as tothe payment of principal and interest.
Under its fiscal agency program, the provincial government acts as a fiscal agent by borrowingdirectly in the financial markets and relending the funds to Crown corporations and agencies.This program provides lower cost financing to Crown corporations due to the province’s strongcredit rating and its ability to borrow at lower interest rates. All Crown corporation and agencyborrowing is now done through the fiscal agency program. Borrowing and financing costsremain the responsibility of the Crown corporation or agency, except in certain cases where theprovincial government provides a contribution to pay for all or part of the debt service costs.
TABLE D1
GOVERNMENT, CROWN CORPORATION AND AGENCY FINANCING PLAN
Forecast 1994/95 ForecastNet Debt Transactions Net Debt
Outstanding Outstandingat March 31, New Retirement Net at March 31,
1994 Borrowing1 Provision2 Change 1995
($ millions) PURPOSES:
Provincial Government Direct ............................. 10,059.2 1,659.3 1,021.0 638.3 10,697.5
Crown Corporations and Agencies:Commercial ....................................................................... 7,649.8 711.0 456.8 254.2 7,904.0Economic Development........................................... 1,879.4 493.3 41.1 452.2 2,331.6Social and Government Service ....................... 4,854.1 1,083.0 458.7 624.3 5,478.4
14,383.3 2,287.3 956.6 1,330.7 15,714.0Other Fiscal Agency Loans ................................... 478.6 164.0 64.5 99.5 578.1
14,861.9 2,451.3 1,021.1 1,430.2 16,292.1
Less Amounts Held as Investments/Cashfor Relending by the ConsolidatedRevenue Fund ................................................................ 7.1 — 2.2 (2.2) 4.9
GOVERNMENT, CROWN CORPORATIONAND AGENCY DEBT TOTAL ................................. 24,914.0 4,110.6 2,039.9 2,070.7 26,984.7Other Guarantees3 ......................................................... 481.9 — 44.24 (44.2) 437.7
TOTAL DIRECT AND GUARANTEED DEBT.. 25,395.9 4,110.6 2,084.1 2,026.5 27,422.4
1 Gross new long-term borrowing plus net change in short-term debt.2 Sinking fund contributions, sinking fund interest earnings and net maturities of long-term debt (after deduction of sinking fund balances
for maturing issues).3 Includes student assistance loans, loan guarantees to agricultural producers and guarantees issued under economic development
assistance programs and the British Columbia Mortgage Assistance Program. Includes loan guarantee provisions.4 Guarantees do not represent direct obligations of the government except in the event of default by the borrowers who received the
guarantee. There is no actual borrowing requirement until a default occurs. A net reduction in the government’s potential liability isexpected because new guarantees will be more than offset by expiring ones.

61
In order to provide for the orderly repayment of debt, the provincial government and Crowncorporations establish sinking funds for virtually all debt with a term of five or more years.At March 31, 1994, sinking fund investments are expected to total $4.3 billion. Debt with a termof one year or longer will be 60 per cent covered by sinking funds at maturity.
1994/95 Financing Plan
Table D1 outlines the 1994/95 financing plan for the government and its Crown corporationsand agencies. Further details on net direct and guaranteed debt are provided in Table G7.
The government issues debt for the following purposes:
● Provincial government direct debt to fund government operations and capital spending,including the refinancing of maturing debt and other financing transactions. The governmentexpects that its own gross borrowing requirements will total $1.7 billion in 1994/95, of which$828 million will be used to refinance maturing debt.
● Commercial Crown corporations, including British Columbia Hydro and Power Authorityand British Columbia Railway Company. These corporations are self-supporting as theygenerate revenue from the sale of services at commercial rates and pay their own operatingexpenses, including debt service charges. Gross borrowing requirements for commercialCrown corporations are expected to total $711 million in 1994/95, of which $309 million willbe used to refinance maturing debt.
● Economic development Crown corporations and agencies, including the BCTransportation Financing Authority, British Columbia Ferry Corporation and British ColumbiaTransit. These corporations and agencies sell services directly to the public, but their revenuesmay not cover their operating expenses. Because these corporations provide economicbenefits to the province, the government provides grants or other forms of assistance to them.Total borrowing requirements for the economic development Crown corporations andagencies are expected to be $493 million in 1994/95, including $290 million for the BCTransportation Financing Authority, $129 million for British Columbia Transit and $66 millionfor British Columbia Ferry Corporation.
● Social and government service Crown corporations and agencies incur debt largely tofinance construction of hospitals, schools and post-secondary educational institutions. Debtservice requirements are met through provincial grants or rental payments and, for hospitals,partly through local property taxes. Gross borrowing requirements for these entities areexpected to total $1.1 billion in 1994/95, including $469 million for the British ColumbiaSchool Districts Capital Financing Authority, $227 million for the British Columbia RegionalHospital Districts Financing Authority and $226 million for the British Columbia EducationalInstitutions Capital Financing Authority.
● Other fiscal agency loans include loans made by the provincial government to other publicbodies including universities, colleges and various local governments and improvementdistricts. Borrowing requirements for these entities are expected to total $164 million in1994/95, including $117 million for the Greater Vancouver Sewerage and Drainage Districtand Greater Vancouver Water District. Debt service requirements are met through localproperty taxes and, for universities and colleges, through revenue raised from residence andparking fees.
Direct and fiscal agency borrowing in 1994/95 will be partly offset by debt maturities and otherretirement provisions, resulting in an increase of $2.1 billion in the net debt of the government,Crown corporations and agencies. Table D1 provides a breakdown of the increase in net debtby category.

62
The provincial government also provides loan guarantees to private sector firms and individualsthrough various programs. These include student financial assistance, loan guarantees toagricultural producers and guarantees issued under economic development assistance programs.These guarantees do not represent direct obligations of the government except in the event ofdefault by the borrowers who received the guarantee. In 1994/95, guarantees are expected todecline by $44 million, as potential new guarantees of $97 million are more than offset byexpiring ones.
Chart D2 gives a breakdown by category of estimated provincial direct and guaranteed net debtat March 31, 1995.
CHART D2DIRECT AND GUARANTEED NET DEBT*AT MARCH 31, 1995
GovernmentDirect39.0%
Commercial28.8%
EconomicDevelopment
8.5%
Other Fiscal
Social and
Other
*Net of sinking funds and unamortized discounts
TOTAL: $27.4 Billion
Government Services20.0%
Agency Loans2.1%
Guarantees1.6%
Source of Funds
Funds borrowed by the British Columbia public sector have come from a variety of sources,including public financial markets, the Canada Pension Plan Investment Fund (CPP), privateinstitutional lenders and provincial trusteed funds. Chart D3 shows that since 1984, borrowingsources have shifted toward public bond issues.

63
CHART D3OUTSTANDING DEBT BY SOURCE
CanadianPublic Markets
United States21%
CPP26%
Private(1)33%
Europe7%
CanadianPublic Markets
UnitedStates11%
CPP18% Private(1)
9%
Europe12%
Global(2)4%
at March 31, 1984 at March 31, 1994
13%
46%
(1) Includes borrowings from provincial trusteed funds.(2) A global debt security is offered simultaneously to investors in Canada, the United States, Europe and Asia.
Most of the province’s funds have been obtained through medium and long-term debt issues inpublic markets in Canada, the United States and Europe. To a lesser extent, private placementsin North America, Europe and Japan have also been a source of funds. In all cases the debt ispayable in either Canadian or U.S. dollars.
The province actively diversifies its borrowing sources to cultivate strong domestic andinternational investor demand for British Columbia debt securities; strong demand helpsminimize financing costs for the province. A broad investor base is also important when othergovernments are competing for domestic funds.
Measures have also been taken to diversify the province’s borrowing sources within thedomestic market. In 1992, the province introduced a domestic medium-term note program and aBritish Columbia Savings Bond Program:
● The medium-term note program was the first for a Canadian province and raises fundsprimarily in one to ten-year terms. To date, about $600 million has been borrowed under thisprogram.
● The savings bond program is restricted to residents of British Columbia and ensures that theyhave an opportunity to participate in the provincial government’s financing program. In total,the two savings bond campaigns in 1992 and 1993 have raised over $1 billion.

64
Ongoing Debt Management Initiatives
The government is taking measures to ensure the best possible management of new andexisting debt. These initiatives include:
● refining debt management parameters and performance benchmarks;
● working with major international investment firms to establish appropriate debt strategies forthe province and the major Crown corporations to balance interest rate costs and risk;
● increasing use of sophisticated financial products to improve management of debt andassociated risks; and
● continuing diversification of the borrowing program to markets in Canada, the United States,Europe and Asia to search out the lowest-cost sources of financing.
The province continues to focus on the global capital market, including North America, Europeand the Far East, to take advantage of favourable market conditions:
● in June 1993, the province launched a successful $1.25 billion (Canadian) global bond issue;and
● in 1994/95, the province will launch a special Euro-debt issuance program, similar to thedomestic medium-term note program, to gain more efficient and cost-effective access toEuropean financial markets.
The Ministry of Finance and Corporate Relations has been working with a major internationalinvestment bank to implement a state-of-the-art, debt-management performance measurementsystem. Results indicate that active management of the province’s direct debt portfolio generatedsavings (in present-value terms) of $63 million through the first 11 months of 1993/94.
Examples of initiatives that produced savings for the province’s total debt portfolio include:
● Pro-active use of sophisticated financial instruments as part of regular financing activity. Useof derivative products, such as interest rate swaps, allowed the province to take advantage ofdeclining interest rates in 1993/94, thereby reducing its long-term debt costs.
● The province’s first global bond issue in June 1993, which saved $9 million compared to thedomestic market.
● The provincial medium-term note program, which has saved $2.5 million to date.
As shown above, the government is using sophisticated techniques to minimize the costs ofprovincial borrowing. These actions will help the government achieve its debt managementobjectives (see Appendix E).

65
APPENDIX E
Fiscal Strategy and Debt Management Plan
Summary and Highlights
● Taxes frozen. No new taxes.
● Budget balanced in 1996/97.
● Debt management plan introduced.
● Spending continues to decelerate.
● British Columbia Endowment Fund used to reduce debt.
This paper describes the progress made to date in achieving the British Columbiagovernment’s objective of a balanced budget. It outlines a fiscal strategy that balancesthe budget, including a timetable and guidelines for achieving this objective. Finally, itdiscusses the role of public debt in financing public investment in British Columbiaand outlines the impact of the debt management plan on provincial tax-supporteddebt.
A Balanced Budget for British Columbia: A Progress Report
When the government took office, it pledged to eliminate the deficit and ensure thatBritish Columbia remains on a sound financial footing.
Since taking office, the government has made considerable progress in reducing the large$2.4 billion deficit it inherited for the 1991/92 fiscal year.
In 1992/93, the deficit was reduced by $594 million.
In 1993/94, it was reduced by $477 million.
Today’s budget chops off another $386 million,
In three budgets, the deficit has been reduced by nearly $1.5 billion to under $900 million.
Much of this progress has been made by cutting spending growth; program spendingper person, after adjusting for inflation, rose by a cumulative 16.2 per cent in the lastthree budgets of the previous government. In contrast, it has declined a cumulative2.9 per cent in the three most recent budgets.
The 1994 budget achieves a program surplus for the first time in five years. This means thatrevenue exceeds program expenditure. As a result, the budget deficit is entirely the result ofinterest payments on the debt that was largely accumulated by previous administrations.
British Columbia is in the best fiscal position of any of the provinces. It has the highest creditrating (see Chart E1) and the lowest level of tax-supported debt relative to provincial grossdomestic product or GDP (see Chart E2). GDP measures the size of the economy and is agenerally-accepted benchmark for assessing governments’ ability to meet their debt obligations.British Columbia’s comparatively low debt-to-GDP ratio means its debt service costs are alsoproportionately the lowest of any province.

66
BC
Alta
Ont
Man
NB
Que
PEI
Sask
NS
Nfld
CHART E1PROVINCIAL CREDIT RATINGSAS OF MARCH 1994
Source: Moody’s Investors Service
Baa1 A3 A2 A1 Aa3 Aa2 Aa1 Aaa
0
10
20
30
40
50
60
70
BC Alta Sask Man Ont Que NB NS PEI Nfld
CHART E2PROVINCES’ TAX-SUPPORTED NET DEBTAS A PERCENTAGE OF GDP
At March 31, 1993
Source: Moody’s Investors Service (October 1993)

67
Consequences of Deficits and Debt
The deterioration of government finances caused by the recent recession in Canada has sparkedgrowing concern among the public and financial experts. A number of potential implications ofrising public sector indebtedness have been noted:
● Higher debt may require higher taxes in Canada in the future.
● The cost of debt-financed government spending is being passed on to future generations.
● Canada’s foreign indebtedness is rising because the public sector is consuming a larger shareof national savings. The diversion of national income to pay interest to foreign lenders impliesa lower standard of living in the future than would otherwise be the case.
● High levels of debt result in foreign investors demanding a risk premium when lending toCanadian companies and governments.
On the other hand, public capital investment is essential for continued economic growth,private-sector job creation and rising living standards. Most academic and private-sectoreconomists would agree that capital spending in the public sector should be debt-financedrather than paid for out of current operating budgets.
Nevertheless, the potentially negative consequences of rising debt levels makes it important forgovernments to plan for the orderly reduction of deficits and repayment of debt. While deficitelimination is within reach for British Columbia and some other provinces, debt repayment is amuch longer-term proposition — for all provinces and the federal government1.
Fiscal Strategy and Debt Management Plan
In order to control the growth of debt and protect taxpayers, the government is adopting athree-pronged fiscal strategy:
● Tax rates are frozen for the next three years and no new taxes will be introduced.
● The government will balance the budget in 1996/97 and introduce a debt management plan.
● In addition to eliminating the deficit, the government will wind up the British ColumbiaEndowment Fund and use the proceeds to pay down debt.
Tax Freeze
● Tax rates will be frozen at current levels for three years. There will be no new taxes.
A tax freeze was announced by Premier Mike Harcourt on March 8. The three-year freeze willapply to all the taxes listed in the table on the next page. Medical Services Plan premiums willalso be frozen.
The tax freeze means that the government will generate additional revenue mainly throughgrowth in employment, wages and profits. For example, individuals and companies will paymore taxes as business expands, and profits and employees’ wages rise.
1 For a review of these issues, see Richard G. Harris, ed., Deficits and Debt in the Canadian Economy, Proceedings of aPolicy Forum (Kingston, Ontario: John Deutsch Institute for the Study of Economic Policy, Queen’s University, 1993).

68
Tax Rate Freeze Applies To:
● Provincial personal and corporate income tax● Sales tax● Average school and rural area property tax levels● Property transfer tax● Corporation capital tax● Medical Services Plan (health care) premiums● Mineral land tax● Mineral tax
● Mining tax● Logging tax● Fuel taxes● Insurance premium tax● Tobacco tax● Hotel room tax● Horse racing tax
Fees, licences and other charges for government or Crown corporation services or products arenot frozen. Such charges are intended to reflect the costs of goods or services provided and toensure that the government does not compete unfairly with the private sector.

69
Balancing the Provincial Budget: A Debt Management Plan
Under the government’s debt management plan, the deficit is reduced to $898 million in1994/95, to $450 million in 1995/96 and the budget is balanced in 1996/97. ‘‘The DebtManagement Plan’’ is outlined in the box and illustrated in Charts E3 and E4.
TABLE E1THE DEBT MANAGEMENT PLAN
Revised BudgetActual Forecast Estimate Plan
1991/92 1992/93 1993/94 1994/95 1995/96 1996/97
($ millions)
Revenue..................................................... 14,745 16,168 17,681 18,732 19,575 20,425Total expenditure ............................... 17,100 17,929 18,965 19,630 20,025 20,425
— Program expenditure....... 16,457 17,115 18,052 18,649 19,025 19,400— Public debt interest ........... 643 814 913 981 1,000 1,025
Program surplus (deficit) ........... (1,712) (947) (371) 83 550 1,025Total surplus (deficit) ..................... (2,355) (1,761) (1,284) (898) (450) —
KEY ELEMENTS:
● The debt management plan incorporates the tax freeze.
● Growth in expenditure will be reduced to 2 per cent in 1995/96 and 1996/97,considerably less than the growth in population and inflation.
● Meeting these targets means that inflation and population growth will not befully funded in ministry budgets. There will be no money for public sectorwage increases.
It is important to note that Table E1 is a plan, not a forecast. Plans can be knocked off track byunexpected events. In particular, revenue growth depends on how the economy performs.2 Inthe event that revenue is lower than in the plan, the government will reduce spendingfrom the planned levels shown in order to achieve the deficit/balanced budget target.
2 There are also uncertainties about the level of federal transfer payments. In the recent federal budget, the federalMinister of Finance stated that social security reform ‘‘will enable the federal government to secure a minimum of$1.5 billion in savings in 1996/97’’*, relative to current projections of federal transfers to the provinces for socialassistance and post-secondary education.
* See Department of Finance Canada, The Budget Plan (Ottawa, February 1994) p. 38.

70
0
0.5
1
1.5
2
2.5
3
1990/91 1991/92 1992/93 1993/94RevisedForecast
1994/95Estimate
1995/96 1996/97
CHART E3B.C. DEFICIT AS A PER CENT OF GDP
Per cent
0.0
Plan
0
5
10
15
20
2 2
1990/91 1991/92* 1992/93 1993/94RevisedForecast
1994/95Estimate
1995/96 1996/97
CHART E4EXPENDITURE GROWTH RATE
Percentage change
* Excludes one-time accounting adjustments in 1991/92.
Plan

71
The Provincial DebtMany people are concerned about the growth in government debt in Canada in recent years.However, British Columbia is in a stronger fiscal position than other jurisdictions, due toproportionately lower levels of debt and debt service costs.
As a general rule, most governments and jurisdictions are better off the less debt they have.Debt service costs are lower and government has greater fiscal flexibility as a result.
However, the public debate on deficits and debt has tended to blur important distinctionsbetween various kinds of public debt incurred for different purposes. Two distinctions can bemade:
● Debt that is tax-supported and debt that is self-supporting.
● Within the tax-supported category, debt that funds operating expenditures and debt thatfinances capital spending.
Tax-supported vs. Self-supporting Debt: Credit-rating agencies and other analysts ofgovernment finances make a distinction between debt that is ‘‘tax-supported’’ and debt that isincurred by provincial Crown corporations and agencies that are self-supporting. Tax-supporteddebt includes ‘‘direct’’ debt incurred for government operations and debt of governmentagencies that require an operating or debt service subsidy from the provincial government. Asthe term implies, tax-supported debt is a direct burden on taxpayers. In contrast, self-supportingCrown corporations and agencies such as BC Hydro and BC Rail generate sufficient revenues toat least cover interest costs and re-pay principal. They may also pay dividends to the provincialgovernment.
Tax-supported Direct/Operating Debt vs. Tax-supported Capital Debt: It is also importantto distinguish between tax-supported debt incurred to fund operations and capital expenditures.In general, capital debt creates an offsetting physical asset, unlike operating or ‘‘direct’’ debt.Most of the non-direct debt incurred by Crown corporations and other government agenciesfunds capital expenditures.
An analogy to the household is the distinction between people’s mortgage debt and their credit-card debt. A house is an investment that provides ongoing benefits, while credit-card debt isoften used to pay for day-to-day consumption expenditures.
With the budget balanced in 1996/97, the need to borrow to fund government programspending will disappear. However, the provincial government and its agencies will need tocontinue to finance construction of schools, hospitals, roads and other long-lived assets. In muchof the public sector, as in the private sector, debt financing is the standard practice forinvestments that provide benefits over a long period of time.
Public Investment May Raise Private-Sector Productivity: Another reason for distinguishingbetween different types of public debt is that public projects deliver varying types and levels ofservice. Recent research suggests that there is a link between some types of public-sector capitaland growth in productivity and the economy as a whole3. For example, public investment inroads, airports and harbours may raise the productivity of private investment. If so, under-investment in public capital could result in an under-performing economy.
Public Debt vs. Public Assets: A final issue in considering whether public debt levels are toohigh is to consider the other side of the public-sector balance sheet: the value of assets ownedby the Crown. Table E2 provides estimates of the assets owned by the provincial governmentand its agencies. The net-book-value figures are based on the historical cost at which the assets
3 For a survey, see Alicia H. Munnell, ‘‘Infrastructure Investment and Productivity Growth’’, Journal of EconomicPerspectives (Fall 1992).

72
were acquired and therefore understate their true economic value or replacement cost. Forexample, it is estimated that the provincial road network, with a net book value of $4.6 billionin the Public Accounts, would cost upwards of $12 billion to replace. Similarly, the replacementcost of schools, universities, colleges and hospitals is estimated to exceed $20 billion. However,both the net book value and replacement costs of provincial assets exceeded the $23 billion intotal net debt of the province in 1993.
TABLE E2VALUE OF PROVINCIAL ASSETS, 1993
EstimatedNet Replacement
Book Value Cost
($ billions)Value of Provincial Government Assets........................................................................... 7 15Value of Crown Corporation Assets..................................................................................... 14 25Value of Assets of Institutions (includes schools, universities,
hospitals).............................................................................................................................................. 9* 20
Total .................................................................................................................................................................... 30 60
* Current value of depreciated capital stock from Statistics Canada.
Source: Province of British Columbia, 1992-93 Public Accounts; Statistics Canada, Investment and Capital Stock Division;and Ministry of Finance and Corporate Relations estimates of replacement costs.
To sum up:
● Debt incurred because the government budget was not balanced is similar to a householdrunning up credit-card debt. In contrast, government debt used to finance long-lived capitalassets is like taking out a mortgage to build a house.
● Debt-financed public investment may raise private-sector productivity and overall economicgrowth.
● The value of provincial public assets exceeds total provincial debt by a considerable margin.
British Columbia Endowment Fund Dedicated to Debt ReductionThe third element in the government’s debt management plan is the use of the British ColumbiaEndowment Fund (BCEF) to pay down debt.
In the 1992 budget, the government set up the BCEF to invest in a range of diversified financialassets. Over the last two years, the fund has generated significant earnings. The fund produced$65 million in earnings for the government’s Consolidated Revenue Fund in 1993/94. Inaddition, the market value of BCEF investments has risen significantly; at March 31, 1994, it isestimated that the BCEF’s assets will be worth over $700 million, up from $550 million onMarch 31, 1992.
The government has decided to wind up the BCEF. With the exception of the ‘‘BC Focus’’component that is creating jobs by making equity investments in British Columbia businesses,

73
BCEF assets will be sold and used to reduce provincial tax-supported debt. For planningpurposes, it is assumed that debt will be reduced by $300 million in each of 1994/95 and1995/96. The cumulative reduction in debt of $600 million will reduce provincial borrowingrequirements and debt service costs.
Effect of Debt Management Plan on Provincial Debt
The next chart shows the annual change in tax-supported debt under the debt managementplan outlined above. The chart splits the tax-supported debt into two components: ‘‘direct debtfor government purposes’’ resulting from budget deficits and ‘‘other tax-supported debt’’, muchof which is used to finance capital investment in schools, hospitals and roads. As discussedearlier, the two self-supporting Crown corporations, BC Hydro and BC Rail, are not included inthese figures.
0
500
1,000
1,500
2,000
2,500
3,000
3,500
Direct Debt for Other Tax-Supported
1990/91 1991/92 1992/93 1993/94Budget
1993/94RevisedForecast
1994/95Estimate
1995/96 1996/97
CHART E5TAX-SUPPORTED DEBT – ANNUAL CHANGE
$ billionsGovernment Purposes Debt*
*Excludes change in debt of commercial Crown corporations(BC Hydro, BC Rail)
Plan
As the chart indicates, achieving a balanced budget in 1996/97 will halt growth in ‘‘direct debtfor government purposes’’. ‘‘Other tax-supported debt’’ will increase to fund public capitalconstruction to meet the demands of a growing population. Total tax-supported debt growthwill slow to less than half the rate seen in recent years. Meanwhile, the capital assets financedby debt will deliver health, education and transportation services to current and futuregenerations.

74
Conclusion
The provincial budget will be balanced in 1996/97. This will be accomplished without raisingtaxes. Tax rates will be frozen for three years. The government will reduce the rate of spendinggrowth, but will not make drastic cuts to services; this would harm those most in need andcould de-rail the continued expansion of the province’s economy. In order to balance thebudget in 1996/97, spending growth will be reduced to 2 per cent in 1995/96 and 1996/97.This is a much slower rate of growth than in recent years, so public sector unions and agenciesreceiving provincial funding should incorporate the government’s fiscal strategy and debtmanagement plan in their planning.
The achievement of a balanced budget will stop direct debt accumulation. Other tax-supporteddebt, used mainly to fund long-lived capital assets, will be prudently managed in relation togrowth in the provincial economy.
This fiscal strategy will help ensure that British Columbians continue to enjoy a high standard ofliving and an appropriate balance between public services and taxation.

75
APPENDIX F
BC 21 — Building B.C. for the 21st Century
In 1993, the government introduced BC 21, a comprehensive, multi-year initiative to lay thefoundation for British Columbia’s economy in the 21st century. The primary goal of BC 21, asdefined in the Build BC Act, is to facilitate the expansion and diversification of theBritish Columbia economy. BC 21 is a government-wide initiative with all ministries and Crowncorporations taking an active role to increase the effectiveness of economic development, publicinvestment and job creation activities.
BC 21 has four key components:
Capital Investment — Building for the future by meeting vital community needs for healthcare, education, training and justice facilities.
The BC 21 strategy provides the framework to coordinate the government’s capitalexpenditure program to provide a solid foundation for future growth and development, andto ensure that government spending delivers benefits today, through increased economicactivity, training and jobs throughout the province.
As the population grows, schools, health-care centres and other public facilities must bebuilt. By coordinating how, when, and where these expenditures are made, BC 21 helpsBritish Columbians gain the maximum benefits in both the short and long term.
Projects are financed by long-term borrowing, with fixed repayment schedules. Debt isborrowed through the provincial government and is part of provincial tax-supported debt.Debt servicing costs are covered by provincial grants and rental payments and, for hospitals,partly through property taxes.
Economic Development — BC 21 ensures that existing public resources are coordinatedand provides a dedicated special account to promote sustainable economic growth, newjobs and expanded training opportunities in British Columbia’s regions.
Innovative programs with specific investment and job creation benefits are funded from the$100-million Build BC Special Account. Projects are managed and delivered throughpartnerships with other ministries, Crown corporations and the private sector.
Transportation — Planning and paying for new roads, highways and other transportationlinks essential to the long-term growth of B.C. communities and regions.
The BC Transportation Financing Authority will take a long-term approach to planning anddeveloping transportation initiatives to support economic growth. Car rental taxes and gaslevies provide dedicated funding. Other financing options include innovative partnershipswith private capital and other investment sources. This allows matching of benefits andcosts over the life of the assets.
The Ministry of Transportation and Highways undertakes construction of highway projectsand recovers the costs from the financing authority.
Crown Corporations — Ensuring the maximum benefit from public sector investment —jobs in the regions, opportunities for private sector suppliers and training for workers.
BC Hydro, B.C. Ferries, B.C. Transit, B.C. Buildings Corporation and other Crowncorporations make substantial investments in the British Columbia economy each year.Crown corporation capital construction is being coordinated so that the substantial resources

76
of these publicly-owned entities are directed toward the goals of the BC 21 strategy. Theseinclude greater use of B.C. based businesses, products and services, more emphasis on jobtraining and skills development, and greater benefits for local economies.
Public Investment
Public investment encompasses three categories outlined above – capital investment,transportation and Crown corporations.
Progress in 1993/94
In 1993/94, the province invested $1 billion in schools, hospitals, universities, colleges,courthouses and corrections facilities.
During 1993/94, a consolidated approach to capital planning was initiated within the Ministry ofEmployment and Investment. Its purpose is to ensure that major public investments are made ina cost-effective way, with maximum benefits for British Columbia’s regions.
The BC Transportation Financing Authority was established to undertake longer-termtransportation planning and financing.
Crown corporations have been directed to take into account the full range of economic andsocial objectives in their planning.
Examples of the new capital projects initiated through BC 21 in 1993/94 include:
● A three-year program to build 7,500 new child care spaces in schools, hospitals and otherpublic workplaces across the province;
● New research and development facilities at the University of British Columbia and theUniversity of Victoria;
● Expanded public transit in the Lower Mainland and southern Vancouver Island.
Plans For 1994/95
For 1994/95, the Ministry of Employment and Investment has developed the first consolidatedcapital plan for government. The plan takes account of the government’s debt managementplan, while advancing its social and economic goals.
Social capital investment in schools, health-care facilities, post-secondary institutions and justicefacilities will total $1 billion. This level of social capital expenditure is equal to last year’sspending and will keep social capital investment at a level that maintains facilities and meetsgrowth requirements. It also recognizes that spending growth must be reduced and is consistentwith the government’s overall fiscal targets.
The BC Transportation Financing Authority will invest $300 million in 1994/95. This will allowconstruction of the Vancouver Island Highway to continue, and a start to be made to otherimportant transportation projects to be announced during the coming months.
The province’s BC 21 initiatives will be supplemented in 1994/95 by a new federal-provincialinfrastructure agreement. The Canada-British Columbia Infrastructure Program creates a newprogram to cost-share infrastructure investment totalling $675 million over two years.
The program is based on partnerships between municipalities, the private sector and the federaland provincial governments. The province’s contribution to the program will be $225 million.Funding will be targeted mainly to priorities set by local governments and will emphasize water,sewer and local transportation projects.

77
Economic Development
Progress in 1993/94
During the 1993 legislative session, the Build BC Special Account was established under theBuild BC Act. The special account supports a range of initiatives that:
● Promote sustainable growth and long-term job creation, particularly in regions;
● Build partnerships among the public sector, private sector and community stakeholders; and
● Emphasize employment opportunities and training for traditionally disadvantaged groups.
Using the $100-million Build BC Special Account, BC 21 undertook a number of innovativeregional initiatives in 1993/94 that combined economic development, training and job creation.Initiatives included:
● Creation of 15 innovative regional job creation and investment programs across the province,including job training in forest communities, salmonid enhancement, student summeremployment and heritage preservation;
● Establishment of a regional export development program;
● Establishment of the Community Projects Program to help develop new and expandedcommunity-based facilities; and
● Investment in a new ferry service between Victoria and Seattle.
Plans for 1994/95
For 1994/95, the Build BC Special Account received a further injection of $100 million. Spendingpriorities include:
● Community Enhancement Programs — These programs will assist communities torespond to development challenges and opportunities and will provide direct employmentopportunities for traditionally disadvantaged groups.
As a major component of the Community Enhancement Programs, new housing initiatives willhelp communities respond to development and growth pressures. These initiatives willinclude a replacement for the Renter’s Tax Reduction, which was eliminated in 1993.
● BC 21 Community Grants — This community-based initiative will provide funding to buildor improve neighbourhood facilities around the province.
● Environment and Resource Programs — These programs will support environmentalmanagement and conservation, and resource enhancement throughout the province insupport of government priorities.
● Science and Technology Projects/Programs — These science and technology relatedprograms will assist with the development of new competitive advantages and opportunitiesfor industry and help build new partnerships between publicly-funded educational andresearch facilities and private-sector high-technology industries.

This page has
intentionally been
left blank
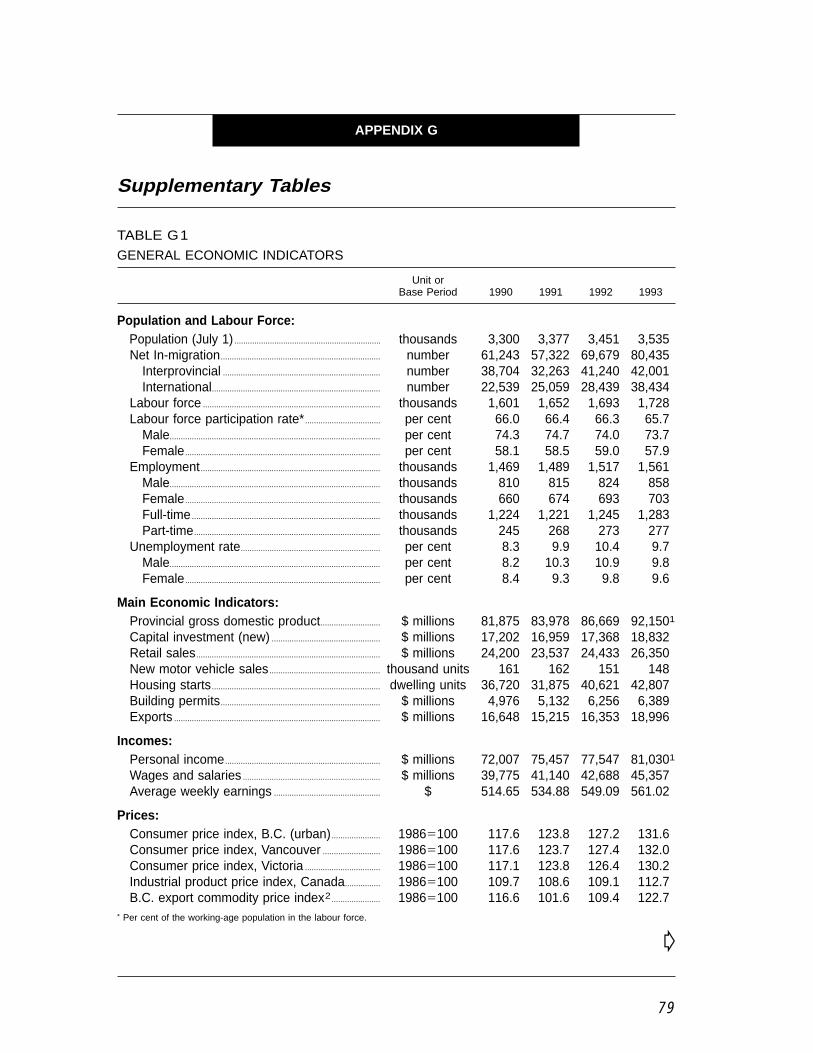
79
APPENDIX G
Supplementary Tables
TABLE G1
GENERAL ECONOMIC INDICATORS
Unit orBase Period 1990 1991 1992 1993
Population and Labour Force:Population (July 1) .................................................................. thousands 3,300 3,377 3,451 3,535Net In-migration........................................................................ number 61,243 57,322 69,679 80,435
Interprovincial ....................................................................... number 38,704 32,263 41,240 42,001International............................................................................ number 22,539 25,059 28,439 38,434
Labour force ................................................................................ thousands 1,601 1,652 1,693 1,728Labour force participation rate*.................................. per cent 66.0 66.4 66.3 65.7
Male............................................................................................... per cent 74.3 74.7 74.0 73.7Female........................................................................................ per cent 58.1 58.5 59.0 57.9
Employment................................................................................. thousands 1,469 1,489 1,517 1,561Male............................................................................................... thousands 810 815 824 858Female........................................................................................ thousands 660 674 693 703Full-time..................................................................................... thousands 1,224 1,221 1,245 1,283Part-time.................................................................................... thousands 245 268 273 277
Unemployment rate............................................................... per cent 8.3 9.9 10.4 9.7Male............................................................................................... per cent 8.2 10.3 10.9 9.8Female........................................................................................ per cent 8.4 9.3 9.8 9.6
Main Economic Indicators:Provincial gross domestic product........................... $ millions 81,875 83,978 86,669 92,1501
Capital investment (new) ................................................. $ millions 17,202 16,959 17,368 18,832Retail sales................................................................................... $ millions 24,200 23,537 24,433 26,350New motor vehicle sales.................................................. thousand units 161 162 151 148Housing starts............................................................................ dwelling units 36,720 31,875 40,621 42,807Building permits........................................................................ $ millions 4,976 5,132 6,256 6,389Exports ............................................................................................. $ millions 16,648 15,215 16,353 18,996
Incomes:Personal income...................................................................... $ millions 72,007 75,457 77,547 81,0301
Wages and salaries .............................................................. $ millions 39,775 41,140 42,688 45,357Average weekly earnings ................................................ $ 514.65 534.88 549.09 561.02
Prices:Consumer price index, B.C. (urban)...................... 19865100 117.6 123.8 127.2 131.6Consumer price index, Vancouver .......................... 19865100 117.6 123.7 127.4 132.0Consumer price index, Victoria .................................. 19865100 117.1 123.8 126.4 130.2Industrial product price index, Canada................ 19865100 109.7 108.6 109.1 112.7B.C. export commodity price index2...................... 19865100 116.6 101.6 109.4 122.7
* Per cent of the working-age population in the labour force.
G

80
TABLE G1
GENERAL ECONOMIC INDICATORS — Continued
Unit orBase Period 1990 1991 1992 1993
Financial Indicators:Business incorporations ..................................................... number 19,550 18,528 20,406 22,953Business bankruptcies ....................................................... number 1,128 1,262 1,031 830Shares traded (Vancouver Stock Exchange) $ millions 4,062 3,465 3,572 6,781Personal savings deposits at chartered
banks............................................................................................ $ millions 29,340 31,868 33,521 36,716
Sector Indicators:Manufacturing shipments .................................................. $ millions 25,329 23,553 24,322 26,892Timber scaled............................................................................. thousand cubic
metres78,318 73,677 74,006 79,239
Lumber production................................................................. thousand cubicmetres
33,515 31,406 33,396 33,935
Pulp and paper production.............................................thousand tonnes 6,712 6,677 6,646 7,041Gross value of mineral production .......................... $ millions 2,971 2,755 2,534 2,2823
Petroleum and natural gas production................. $ millions 900 859 883 1,0293
Electric power generation (net) .................................. million kilowatthours
60,662 62,981 64,058 58,586
Farm cash receipts................................................................ $ millions 1,215 1,247 1,357 1,427Foreign visitors.......................................................................... thousands 5,130 5,285 5,312 5,477
Regional Data:Housing Starts
Vancouver ............................................................................................................................ 17,970 14,769 18,684 21,307Victoria ................................................................................................................................... 2,588 2,129 2,421 2,633Chilliwack............................................................................................................................. 976 990 1,428 1,468Kamloops............................................................................................................................. 417 564 980 1,067Kelowna ................................................................................................................................ 2,061 2,218 2,612 1,963Matsqui .................................................................................................................................. 1,866 1,847 1,678 2,045Nanaimo ............................................................................................................................... 1,747 942 1,313 1,520Prince George................................................................................................................. 258 366 460 426Campbell River............................................................................................................... 339 260 421 416Courtenay............................................................................................................................ 740 642 1,096 1,471Duncan .................................................................................................................................. 349 415 507 625Penticton .............................................................................................................................. 783 773 1,018 885Vernon.................................................................................................................................... 582 802 794 742
Employment Unemployment Rate (%)1992 1993 1992 1993Labour Markets
Greater Vancouver ............................................................ 821,000 816,000 9.2 9.3Greater Victoria................................................................... 125,000 129,000 8.4 8.6East Kootenay...................................................................... 20,500 23,100 n.a. 12.4Central Kootenay............................................................... 37,900 42,100 12.1 9.8Okanagan-Boundary....................................................... 109,500 117,500 12.7 11.2Lillooet-Thompson ............................................................ 51,700 58,600 12.8 10.4Lower Mainland................................................................... 913,900 909,700 9.3 9.3Vancouver Island and Coast ................................... 250,500 267,800 11.0 10.0Cariboo-Fort George ...................................................... 80,800 86,500 13.1 10.4North............................................................................................. 52,500 55,100 12.9 8.8
1 Ministry of Finance and Corporate Relations estimate.2 Developed by BC Stats, Ministry of Government Services.3 Ministry of Energy, Mines and Petroleum Resources estimate.
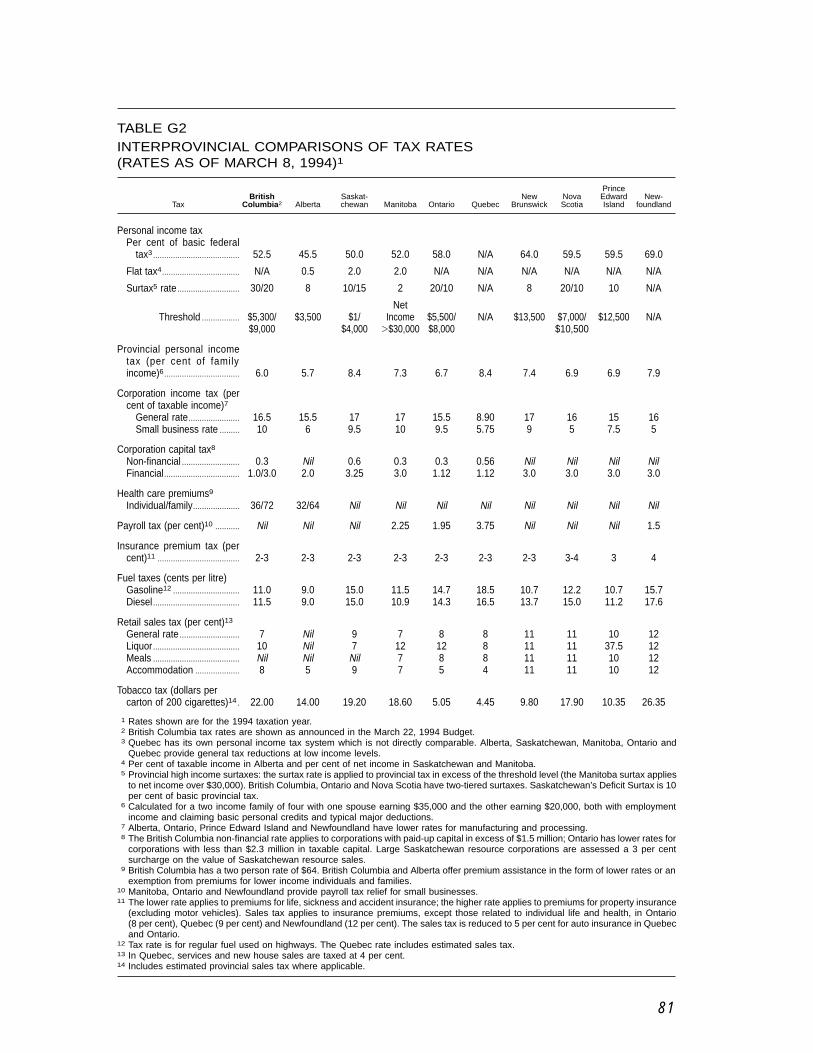
81
TABLE G2INTERPROVINCIAL COMPARISONS OF TAX RATES(RATES AS OF MARCH 8, 1994)1
PrinceBritish Saskat- New Nova Edward New-
Tax Columbia2 Alberta chewan Manitoba Ontario Quebec Brunswick Scotia Island foundland
Personal income taxPer cent of basic federal
tax3....................................... 52.5 45.5 50.0 52.0 58.0 N/A 64.0 59.5 59.5 69.0
Flat tax4................................... N/A 0.5 2.0 2.0 N/A N/A N/A N/A N/A N/A
Surtax5 rate ............................ 30/20 8 10/15 2 20/10 N/A 8 20/10 10 N/A
NetThreshold ................. $5,300/ $3,500 $1/ Income $5,500/ N/A $13,500 $7,000/ $12,500 N/A
$9,000 $4,000 .$30,000 $8,000 $10,500
Provincial personal incometax (per cent of familyincome)6.................................. 6.0 5.7 8.4 7.3 6.7 8.4 7.4 6.9 6.9 7.9
Corporation income tax (percent of taxable income)7
General rate....................... 16.5 15.5 17 17 15.5 8.90 17 16 15 16Small business rate ......... 10 6 9.5 10 9.5 5.75 9 5 7.5 5
Corporation capital tax8
Non-financial .......................... 0.3 Nil 0.6 0.3 0.3 0.56 Nil Nil Nil NilFinancial.................................. 1.0/3.0 2.0 3.25 3.0 1.12 1.12 3.0 3.0 3.0 3.0
Health care premiums9
Individual/family..................... 36/72 32/64 Nil Nil Nil Nil Nil Nil Nil Nil
Payroll tax (per cent)10 ........... Nil Nil Nil 2.25 1.95 3.75 Nil Nil Nil 1.5
Insurance premium tax (percent)11 ..................................... 2-3 2-3 2-3 2-3 2-3 2-3 2-3 3-4 3 4
Fuel taxes (cents per litre)Gasoline12 .............................. 11.0 9.0 15.0 11.5 14.7 18.5 10.7 12.2 10.7 15.7Diesel....................................... 11.5 9.0 15.0 10.9 14.3 16.5 13.7 15.0 11.2 17.6
Retail sales tax (per cent)13
General rate ........................... 7 Nil 9 7 8 8 11 11 10 12Liquor....................................... 10 Nil 7 12 12 8 11 11 37.5 12Meals ....................................... Nil Nil Nil 7 8 8 11 11 10 12Accommodation .................... 8 5 9 7 5 4 11 11 10 12
Tobacco tax (dollars percarton of 200 cigarettes)14 . 22.00 14.00 19.20 18.60 5.05 4.45 9.80 17.90 10.35 26.35
1 Rates shown are for the 1994 taxation year.2 British Columbia tax rates are shown as announced in the March 22, 1994 Budget.3 Quebec has its own personal income tax system which is not directly comparable. Alberta, Saskatchewan, Manitoba, Ontario and
Quebec provide general tax reductions at low income levels.4 Per cent of taxable income in Alberta and per cent of net income in Saskatchewan and Manitoba.5 Provincial high income surtaxes: the surtax rate is applied to provincial tax in excess of the threshold level (the Manitoba surtax applies
to net income over $30,000). British Columbia, Ontario and Nova Scotia have two-tiered surtaxes. Saskatchewan’s Deficit Surtax is 10per cent of basic provincial tax.
6 Calculated for a two income family of four with one spouse earning $35,000 and the other earning $20,000, both with employmentincome and claiming basic personal credits and typical major deductions.
7 Alberta, Ontario, Prince Edward Island and Newfoundland have lower rates for manufacturing and processing.8 The British Columbia non-financial rate applies to corporations with paid-up capital in excess of $1.5 million; Ontario has lower rates for
corporations with less than $2.3 million in taxable capital. Large Saskatchewan resource corporations are assessed a 3 per centsurcharge on the value of Saskatchewan resource sales.
9 British Columbia has a two person rate of $64. British Columbia and Alberta offer premium assistance in the form of lower rates or anexemption from premiums for lower income individuals and families.
10 Manitoba, Ontario and Newfoundland provide payroll tax relief for small businesses.11 The lower rate applies to premiums for life, sickness and accident insurance; the higher rate applies to premiums for property insurance
(excluding motor vehicles). Sales tax applies to insurance premiums, except those related to individual life and health, in Ontario(8 per cent), Quebec (9 per cent) and Newfoundland (12 per cent). The sales tax is reduced to 5 per cent for auto insurance in Quebecand Ontario.
12 Tax rate is for regular fuel used on highways. The Quebec rate includes estimated sales tax.13 In Quebec, services and new house sales are taxed at 4 per cent.14 Includes estimated provincial sales tax where applicable.

82
TABLE G3
COMPARISON OF PROVINCIAL AND FEDERAL TAXES BY PROVINCE — 1994
PrinceBritish Saskat- New Nova Edward New-
Tax Columbia Alberta chewan Manitoba Ontario Quebec Brunswick Scotia Island foundland
( $ )Unattached Individual — $25,000
1. Provincial Income Tax .... 1,416 1,345 2,004 1,550 1,564 2,393 1,726 1,605 1,605 1,8612. Property Tax ........................ — — — — — — — — — —3. Retail Sales Tax ................. 386 2 446 482 569 588 647 653 738 8314. Fuel Tax ................................. 110 90 150 115 147 191 107 122 107 157
5. Provincial Direct Taxes ... 1,912 1,437 2,600 2,147 2,280 3,172 2,480 2,380 2,450 2,849
6. Health Care Premiums/Payroll Taxes ....................... 432 384 — 563 488 938 — — — 375
7. Total Provincial Tax .......... 2,344 1,821 2,600 2,710 2,768 4,110 2,480 2,380 2,450 3,224
8. Federal Income Tax ......... 2,778 2,778 2,778 2,778 2,778 2,778 2,778 2,778 2,778 2,7789. Net Federal GST ............... 269 317 287 276 270 230 257 262 257 239
10. Total Tax ................................ 5,391 4,916 5,665 5,764 5,816 7,118 5,515 5,420 5,485 6,241
Unattached Individual — $80,000
1. Provincial Income Tax .... 8,981 7,699 10,923 10,402 9,778 13,030 9,912 9,659 9,216 10,6872. Property Tax
— Gross ................................ 1,660 1,600 1,550 1,950 2,700 2,500 825 1,996 1,453 1,423— Net ...................................... 1,190 1,600 1,550 1,700 2,700 2,500 825 1,996 1,453 1,423
3. Retail Sales Tax ................. 851 5 944 961 1,211 1,189 1,389 1,403 1,606 1,7554. Fuel Tax ................................. 165 135 225 173 221 287 161 183 161 236
5. Provincial Direct Taxes ... 11,187 9,439 13,642 13,236 13,910 17,006 12,287 13,241 12,436 14,101
6. Health Care Premiums/Payroll Taxes ....................... 432 384 — 1,800 1,560 3,000 — — — 1,200
7. Total Provincial Tax............ 11,619 9,823 13,642 15,036 15,470 20,006 12,287 13,241 12,436 15,301
8. Federal Income Tax ......... 16,102 16,102 16,102 16,102 16,102 16,102 16,102 16,102 16,102 16,1029. Net Federal GST ............... 1,259 1,372 1,187 1,209 1,220 1,079 1,202 1,212 1,218 1,144
10. Total Tax ................................ 28,980 27,297 30,931 32,347 32,792 37,187 29,591 30,555 29,756 32,547
Two Income Family of Four — $55,000
1. Provincial Income Tax .... 3,325 3,139 4,618 3,997 3,673 4,639 4,053 3,768 3,768 4,3692. Property Tax
— Gross ................................ 1,790 1,400 2,240 2,650 2,500 2,400 1,250 1,950 1,450 1,002— Net ...................................... 1,320 1,400 2,240 2,400 2,500 2,400 1,250 1,950 1,450 1,002
3. Retail Sales Tax ................. 802 6 958 893 1,052 1,216 1,177 1,216 1,163 1,5834. Fuel Tax ................................. 165 135 225 173 221 287 161 183 161 236
5. Provincial Direct Taxes ... 5,612 4,680 8,041 7,463 7,446 8,542 6,641 7,117 6,542 7,190
6. Health Care Premiums/Payroll Taxes ....................... 864 768 — 1,238 1,073 2,063 — — — 825
7. Total Provincial Tax .......... 6,476 5,448 8,041 8,701 8,519 10,605 6,641 7,117 6,542 8,015
8. Federal Income Tax ......... 6,522 6,522 6,522 6,522 6,522 6,522 6,522 6,522 6,522 6,5229. Net Federal GST ............... 1,134 1,198 1,106 1,136 1,140 1,088 1,120 1,125 1,129 1,075
10. Total Tax ................................ 14,132 13,168 15,669 16,359 16,181 18,215 14,283 14,764 14,193 15,612
G

83
TABLE G3COMPARISON OF PROVINCIAL AND FEDERAL TAXES BY PROVINCE — 1994— Continued
PrinceBritish Saskat- New Nova Edward New-
Tax Columbia Alberta chewan Manitoba Ontario Quebec Brunswick Scotia Island foundland
( $ )Two Income Family of Four — $90,0001. Provincial Income Tax .... 7,003 6,491 9,291 8,996 7,736 10,970 8,536 7,936 7,936 9,2032. Property Tax
— Gross ................................ 2,590 2,300 3,400 3,850 4,050 2,900 1,875 2,350 2,042 1,421— Net ...................................... 2,120 2,300 3,400 3,600 4,050 2,900 1,875 2,350 2,042 1,421
3. Retail Sales Tax ................. 1,069 8 1,250 1,156 1,381 1,517 1,536 1,595 1,525 2,0534. Fuel Tax ................................. 165 135 225 173 221 287 161 183 161 236
5. Provincial Direct Taxes .. 10,357 8,934 14,166 13,925 13,388 15,674 12,108 12,064 11,664 12,913
6. Health Care Premiums/Payroll Taxes ....................... 864 768 — 2,026 1,756 3,376 — — — 1,350
7. Total Provincial Tax............ 11,221 9,702 14,166 15,951 15,144 19,050 12,108 12,064 11,664 14,263
8. Federal Income Tax ......... 13,738 13,738 13,738 13,738 13,738 13,738 13,738 13,738 13,738 13,7389. Net Federal GST ............... 1,512 1,606 1,443 1,471 1,497 1,358 1,460 1,475 1,480 1,394
10. Total Tax ................................ 26,471 25,046 29,347 31,160 30,379 34,146 27,306 27,277 26,882 29,395
Senior Couple with Equal Pension Incomes — $30,0001. Provincial Income Tax .... 725 308 1,120 143 171 710 884 822 822 9522. Property Tax
— Gross ................................ 1,790 1,400 2,240 2,650 2,500 2,400 1,250 1,950 1,450 1,002— Net ...................................... 1,045 400 2,240 2,400 2,500 2,400 1,250 1,950 1,450 1,002
3. Retail Sales Tax ................. 649 8 815 757 991 1,099 1,037 1,032 1,010 1,4404. Fuel Tax ................................. 110 90 150 115 147 191 107 122 107 157
5. Provincial Direct Taxes .. 2,529 806 4,325 3,415 3,809 4,400 3,278 3,926 3,389 3,551
6. Health Care Premiums/Payroll Taxes ....................... 768 768 — — — — — — — —
7. Total Provincial Tax .......... 3,297 1,574 4,325 3,415 3,809 4,400 3,278 3,926 3,389 3,551
8. Federal Income Tax ......... 1,422 1,422 1,422 1,422 1,422 1,422 1,422 1,422 1,422 1,4229. Net Federal GST ................ 850 939 808 843 833 808 845 820 841 826
10. Total Tax ................................ 5,569 3,935 6,555 5,680 6,064 6,630 5,545 6,168 5,652 5,799
Personal Income Tax● Income tax is based on basic personal credits, applicable provincial credits, and typical major deductions at each income level. Quebec
residents pay federal income tax less an abatement of 16.5 per cent of basic federal tax. This abatement has been used to reduceQuebec provincial tax rather than federal tax, for comparative purposes. The two income family of four with $55,000 annual income isassumed to have one spouse earning $35,000 and the other $20,000, the family with $90,000 income is assumed to have one spouseearning $50,000 and the other $40,000, and each senior is assumed to receive $15,000 each. All representative families are assumedto have employment income except the senior couple.
Property Tax● Estimates of property taxes are from Royal LePage Winter 1994 Survey of Canadian House Prices. It is assumed that the individual at
$25,000 rents accommodation; the family at $55,000 and the senior couple own bungalows; the family at $90,000 owns a two-storeyexecutive style home; and the single at $80,000 owns a luxury condominium, in a major city for each province. Net property taxes areestimated as taxes owing after credits provided through the property tax system are subtracted.
Retail Sales and Fuel Tax● Includes sales tax on meals, liquor and accommodation. Estimates are based on expenditure patterns from the 1992 Survey of Family
Expenditures. In estimating individual and family taxable consumption, disposable income is reduced by 20 per cent to reflect housing(mortgage and property taxes or rent) costs. The senior couple is assumed to own their own home and have no mortgage costs. Foreach province, disposable income is further reduced by estimated federal income taxes, estimated provincial income taxes and healthcare premiums if applicable. In addition, the single individual with $80,000 annual income and the family with $90,000 annual incomeare assumed to have savings equal to five per cent of their disposable income. For each family, disposable income is distributed amongexpenditures using the consumption pattern of a typical family with the relevant characteristics as estimated by the family expendituresurvey. The provincial retail sales tax and the federal Goods and Services Tax (GST) components of these expenditures are thencalculated. GST estimates have been reduced by the GST credit, where applicable.
● Fuel tax is based on annual consumption: 1,000 litres of unleaded fuel for the single at $25,000 and the senior couple; others areassumed to consume 1,500 litres.
Health Care Premiums/Payroll Tax● Health care premiums are levied in British Columbia and Alberta only. Approximately 50 per cent of British Columbia premiums are paid
by employers on behalf of their employees with the remainder paid by individuals, either by employees or by residents who are notemployed. Payroll taxes are paid by the employer. The cost to employers of payroll taxes and health care premiums paid on behalf ofemployees is generally reflected in reduced wages.
Effective Tax Rates● British Columbia taxes have been calculated using rates in effect on March 22, 1994. Taxes for other provinces were calculated using
rates in effect on March 8, 1994.

84
TABLE G4
SUMMARY OF OPERATING AND FINANCING TRANSACTIONSCONSOLIDATED REVENUE FUND
Revised BudgetActual Actual Actual Forecast Estimate
1990/911 1991/921 1992/931 1993/941 1994/95
($ millions)
Revenue................................................................................. 14,418.1 14,745.0 16,167.62 17,681.0 18,732.0Expenditure......................................................................... 15,043.8 17,100.4 17,928.93 18,965.0 19,630.0
Surplus (Deficit).............................................................. (625.7) (2,355.4) (1,761.3) (1,284.0) (898.0)
Net Receipts (Disbursements) fromFinancing and Working CapitalTransactions4 .................................................................... (166.4) 342.0 (504.1) 264.3 (200.3)Decrease (Increase) in Cash and
Short-Term Investments............................. 274.8 128.8 (93.6) (70.0) 160.0British Columbia Endowment Fund
Proceeds.................................................................... — — — — 300.0
Net (Increase) Decrease inGovernment Direct Debt ....................... (517.3) (1,884.6) (2,359.0) (1,089.7) (638.3)
Net Debt at Year End:5Government Direct ................................................ 4,725.9 6,610.5 8,969.5 10,059.2 10,697.5Crown Corporation and Agency .............. 11,800.1 12,550.7 13,391.0 14,376.2 15,709.1Other Fiscal Agency Loans.......................... 138.5 241.9 385.9 478.6 578.1Other Guarantees................................................... 543.5 574.4 590.6 481.9 437.7
Total Net Debt at Year End............................. 17,208.0 19,977.5 23,337.0 25,395.9 27,422.4
1 Restated to conform to the 1994/95 budget estimates.2 For comparative purposes, 1992/93 revenue has been restated to reflect an accounting change to record personal income tax on an
accrual basis. This change increases 1992/93 revenue by $90.6 million. This accounting change also results in a negative prior-yearadjustment of $67.6 million in respect of 1991/92.
3 For comparative purposes, 1992/93 expenditure has been restated to reflect an accounting change in respect of sewer and water grantcommitments to municipalities. This change reduces 1992/93 expenditure by $26 million.
4 Financing and working capital transactions represent either a source or use of funds, such as the payment or collection of loans andaccounts payable/receivable. They do not cause a change in the annual surplus (deficit) but only a change in the composition of theprovincial government’s assets and liabilities.
5 Net of sinking funds and unamortized discount balances.

85
TABLE G5
REVENUE BY SOURCECONSOLIDATED REVENUE FUND
AnnualRate ofGrowth
Revised Budget 1990/91Actual Actual Actual Forecast Estimate to
1990/91 1991/92 1992/93 1993/94 1994/95 1994/95
($ millions) (per cent)Taxation Revenue:Personal income.................................................... 4,140.1 4,287.0 4,177.01 4,403.0 4,767.0 3.6Corporation income............................................. 607.5 577.4 545.0 709.0 873.0 9.5Social service ........................................................... 2,009.6 1,990.5 2,085.3 2,615.0 2,811.0 8.8Fuel.................................................................................... 555.0 538.8 591.1 624.0 636.0 3.5Tobacco ......................................................................... 346.5 433.0 483.2 478.0 449.0 6.7Property — residential (school
purpose) .................................................................. 284.9 332.1 416.2 454.0 473.0 13.5Property — business (school
purpose)................................................................... 554.5 579.3 638.8 665.0 680.0 5.2Property — rural area....................................... 52.4 54.5 55.0 57.0 59.0 3.0Property transfer .................................................... 211.4 282.4 353.1 381.0 385.0 16.2Corporation capital............................................... 10.2 13.4 280.4 335.0 364.0 144.4Insurance premium.............................................. 104.1 115.4 128.7 142.0 151.0 9.7Hotel room................................................................... 57.0 58.6 58.7 63.0 66.0 3.7Horse racing .............................................................. 6.1 5.9 6.0 6.0 6.0 (0.4)
Total taxation revenue........................... 8,939.3 9,268.3 9,818.5 10,932.0 11,720.0 7.0
Natural Resource Revenue:Petroleum and natural gas:
Natural gas royalties..................................... 74.5 73.8 76.4 110.0 132.0 15.4Permits and fees.............................................. 157.4 91.5 66.3 221.0 171.0 2.1Petroleum royalties........................................ 47.8 43.4 54.1 50.0 55.0 3.6
279.7 208.7 196.8 381.0 358.0 6.4
Minerals ......................................................................... 45.0 41.8 38.1 50.0 31.0 (8.9)
Forests:Timber sales ........................................................ 418.8 428.4 490.1 672.0 776.0 16.7Small Business Forest Enterprise
Program ............................................................. 111.5 131.4 176.1 250.0 320.0 30.2Logging tax ........................................................... 27.8 (24.5) (6.3) 17.0 20.0 (7.9)Other forests revenue ................................. 51.2 48.2 46.1 40.0 37.0 (7.8)
609.3 583.5 706.0 979.0 1,153.0 17.3
Water resources..................................................... 221.9 253.1 289.4 285.0 258.0 3.8Wildlife Act .................................................................. 14.4 14.1 14.7 16.0 19.0 7.2
236.3 267.2 304.1 301.0 277.0 4.1
Total natural resource revenue...... 1,170.3 1,101.2 1,245.0 1,711.0 1,819.0 11.7
G

86
TABLE G5
REVENUE BY SOURCE — ContinuedCONSOLIDATED REVENUE FUND
AnnualRate ofGrowth
Revised Budget 1990/91Actual Actual Actual Forecast Estimate to
1990/91 1991/92 1992/93 1993/94 1994/95 1994/95
($ millions) (per cent)Other Revenue:
Medical Services Plan premiums.. 660.3 742.2 776.4 786.0 806.0 5.1Motor vehicle licences and
permits............................................................. 199.0 219.9 231.6 253.0 272.0 8.1Other fees and licences......................... 250.0 283.2 309.4 339.0 363.0 9.8Investment earnings.................................. 110.3 131.9 122.62 115.0 110.0 (0.1)British Columbia Endowment
Fund................................................................... 52.7 51.9 46.9 65.0 73.0 8.5Miscellaneous3 .............................................. 194.2 143.0 164.3 173.0 168.0 (3.6)
Total other revenue......................... 1,466.5 1,572.1 1,651.2 1,731.0 1,792.0 5.1
Contributions from GovernmentEnterprises:
Liquor Distribution Branch ................... 446.7 454.1 517.1 550.0 560.0 5.8British Columbia Hydro and
Power Authority ....................................... 114.2 — 237.6 240.0 235.0 19.8British Columbia Lottery
Corporation4............................................... 205.3 219.0 227.0 221.0 230.0 2.9Other....................................................................... 68.3 27.3 35.4 15.0 26.0 (21.5)
Total contributions fromgovernment enterprises ........ 834.5 700.4 1,017.1 1,026.0 1,051.0 5.9
Contributions from the FederalGovernment:
Established Programs Financing... 1,110.3 1,156.0 1,463.01 1,275.0 1,295.0 3.9Canada Assistance Plan....................... 715.9 766.6 793.7 838.0 880.0 5.3Other....................................................................... 181.35 180.4 179.1 168.0 175.0 (0.9)
Total contributions from thefederal government................... 2,007.5 2,103.0 2,435.8 2,281.0 2,350.0 4.0
TOTAL REVENUE ........................................... 14,418.1 14,745.0 16,167.6 17,681.0 18,732.0 6.8
1 For comparative purposes, 1992/93 revenue has been restated to reflect an accounting change to record personal income tax on anaccrual basis. This change increases 1992/93 revenue by $90.6 million — personal income tax increases by $159.1 million and revenuefrom Established Programs Financing decreases by $68.5 million.
2 Beginning in 1992/93, investment earnings resulting from prefunding of operations (early borrowing) are deducted from expenditure.3 For comparative purposes, revenue for 1992/93 and prior years has been restated to deduct allowances for uncollectible revenue.
Previously these allowances were reported as expenditure.4 For comparative purposes, lottery proceeds revenue has been reclassified as a contribution from the British Columbia Lottery
Corporation. Last year, lottery proceeds were shown under Other Revenue.5 For comparative purposes, revenue for 1990/91 has been restated to include federal contributions for education of aboriginal children
and children of Department of National Defence personnel, which is included in Consolidated Revenue Fund revenue beginning in1991/92. Previously, this revenue was deducted from expenditure.
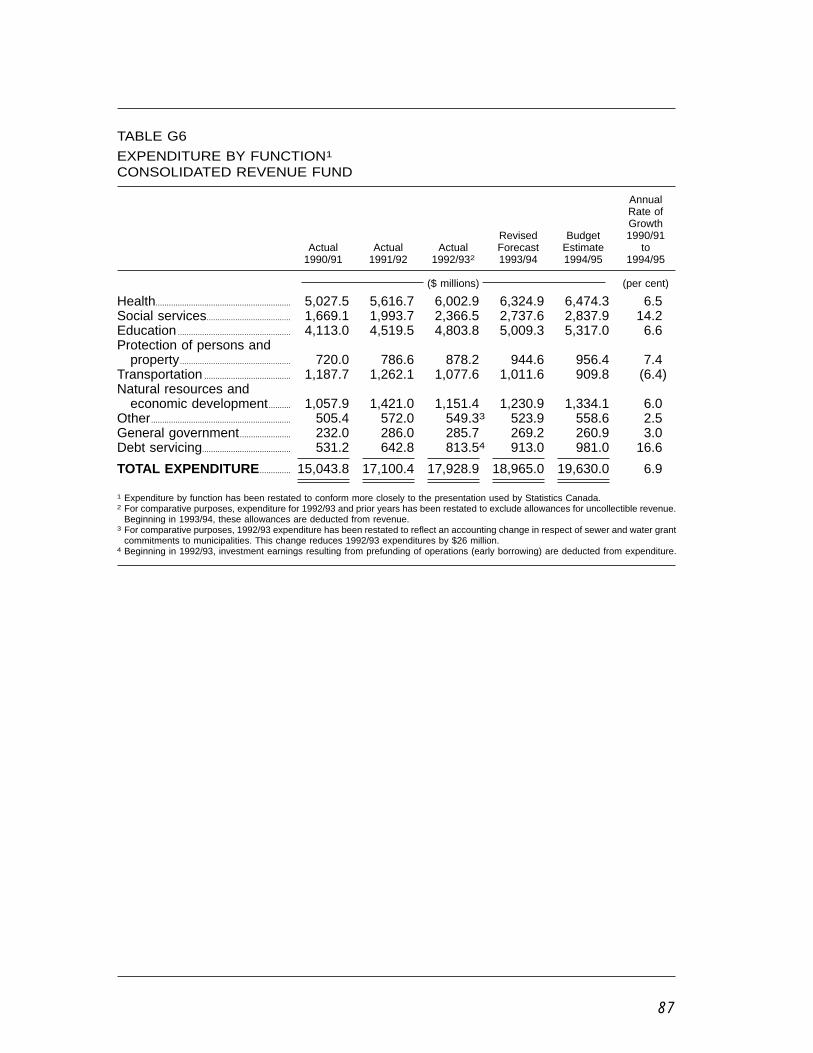
87
TABLE G6
EXPENDITURE BY FUNCTION1
CONSOLIDATED REVENUE FUND
AnnualRate ofGrowth
Revised Budget 1990/91Actual Actual Actual Forecast Estimate to
1990/91 1991/92 1992/932 1993/94 1994/95 1994/95
($ millions) (per cent)
Health............................................................. 5,027.5 5,616.7 6,002.9 6,324.9 6,474.3 6.5Social services...................................... 1,669.1 1,993.7 2,366.5 2,737.6 2,837.9 14.2Education ................................................... 4,113.0 4,519.5 4,803.8 5,009.3 5,317.0 6.6Protection of persons and
property.................................................. 720.0 786.6 878.2 944.6 956.4 7.4Transportation ....................................... 1,187.7 1,262.1 1,077.6 1,011.6 909.8 (6.4)Natural resources and
economic development.......... 1,057.9 1,421.0 1,151.4 1,230.9 1,334.1 6.0Other............................................................... 505.4 572.0 549.33 523.9 558.6 2.5General government....................... 232.0 286.0 285.7 269.2 260.9 3.0Debt servicing........................................ 531.2 642.8 813.54 913.0 981.0 16.6
TOTAL EXPENDITURE.............. 15,043.8 17,100.4 17,928.9 18,965.0 19,630.0 6.9
1 Expenditure by function has been restated to conform more closely to the presentation used by Statistics Canada.2 For comparative purposes, expenditure for 1992/93 and prior years has been restated to exclude allowances for uncollectible revenue.
Beginning in 1993/94, these allowances are deducted from revenue.3 For comparative purposes, 1992/93 expenditure has been restated to reflect an accounting change in respect of sewer and water grant
commitments to municipalities. This change reduces 1992/93 expenditures by $26 million.4 Beginning in 1992/93, investment earnings resulting from prefunding of operations (early borrowing) are deducted from expenditure.

88
TABLE G7
NET DEBT SUMMARY1
Revised BudgetActual Actual Actual Forecast Estimate
As at March 31, 1991 1992 1993 1994 1995
($ millions)
Purposes:Provincial Government Direct .................................................. 4,725.9 6,610.5 8,969.5 10,059.2 10,697.5
Commercial Crown Corporations and Agencies:British Columbia Hydro and Power Authority................. 7,151.8 7,226.1 7,259.7 7,404.0 7,546.6British Columbia Railway Company ..................................... 287.0 255.8 250.4 245.8 357.4
7,438.8 7,481.9 7,510.1 7,649.8 7,904.0
Economic Development Crown Corporations andAgencies:
British Columbia Ferry Corporation ...................................... 59.8 200.9 348.7 419.9 470.5British Columbia Transit ............................................................... 1,227.6 1,326.5 1,370.5 1,357.1 1,460.4BC Transportation Financing Authority............................... — — — 83.0 373.0Other2 ...................................................................................................... 0.6 12.9 9.3 19.4 27.7
1,288.0 1,540.3 1,728.5 1,879.4 2,331.6
Social and Government Services CrownCorporations and Agencies:
British Columbia Assessment Authority ............................. 6.4 8.0 5.5 0.9 0.9British Columbia Buildings Corporation.............................. 514.2 537.6 578.8 622.0 698.8British Columbia Educational Institutions Capital
Financing Authority .................................................................... 480.7 606.7 755.7 962.4 1,120.6British Columbia Regional Hospital Districts
Financing Authority .................................................................... 916.4 978.2 1,049.4 1,093.7 1,206.9British Columbia School Districts Capital
Financing Authority..................................................................... 952.7 1,142.6 1,392.5 1,784.1 2,058.3Capital Project Certificate of Approval Program3 ........ 174.5 251.2 369.5 365.0 365.0British Columbia Systems Corporation............................... 33.8 30.5 28.5 26.0 27.9
3,078.7 3,554.8 4,179.9 4,854.1 5,478.4
Other Fiscal Agency Loans:Greater Vancouver Sewerage and
Drainage District .......................................................................... 26.4 93.4 161.5 197.4 226.3Greater Vancouver Water District .......................................... 61.9 69.8 102.2 130.3 162.0Universities and Colleges............................................................ 46.8 75.1 117.8 148.1 186.7Local Governments ......................................................................... 3.4 3.6 4.4 2.8 3.1
138.5 241.9 385.9 478.6 578.1
Less Amounts Held as Investments/Cash forRelending by the Consolidated Revenue Fund ............ 5.4 26.3 27.5 7.1 4.9
Government, Crown Corporation and AgencyDebt Total............................................................................................. 16,664.5 19,403.1 22,746.4 24,914.0 26,984.7
Other Guarantees4 ............................................................................... 543.5 574.4 590.6 481.9 437.7
Total Direct and Guaranteed Debt ......................................... 17,208.0 19,977.5 23,337.0 25,395.9 27,422.4
1 Net debt is after deduction of sinking funds and unamortized discounts, and excludes accrued interest. Government direct and fiscalagency accrued interest is reported in the government’s accounts as an accounts payable.
2 Includes British Columbia Housing Management Commission, Pacific Racing Association and Whistler Land Developments Ltd.3 Short-term borrowings obtained by financing authorities under the Certificate of Approval Program are used as interim financing of
capital construction and are eventually converted to long-term debt.4 Includes student assistance loans, loan guarantees to agricultural producers and guarantees issued under economic development
assistance programs and the British Columbia Mortgage Assistance Program. Includes loan guarantee provisions.

Copyright in all material contained herein is claimed by the
Queen’s Printer, Province of British Columbia. This material is
for personal use only and may not be reproduced by any means
for financial or other gain.
This electronic version is for informational purposes only.
The printed version remains the official version.