bbva in 2019...(1) €10 cents / share paid in october 2019 plus €16 cents / share as final...
TRANSCRIPT

BBVA in 2019
Creating Opportunities
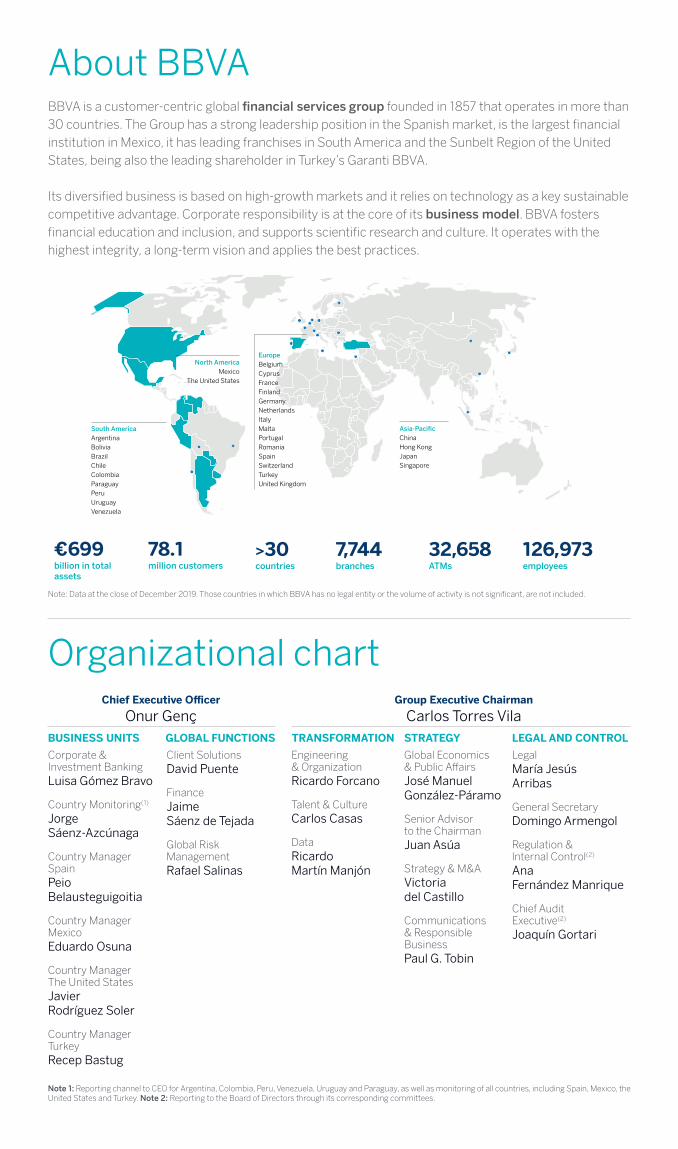
BUSINESS UNITS GLOBAL FUNCTIONS TRANSFORMATION LEGAL AND CONTROLSTRATEGYCorporate & Investment BankingLuisa Gómez Bravo
Country Monitoring(1)
Jorge Sáenz-Azcúnaga
Country Manager SpainPeio Belausteguigoitia
Country Manager MexicoEduardo Osuna
Country Manager The United StatesJavier Rodríguez Soler
Country Manager TurkeyRecep Bastug
Engineering & OrganizationRicardo Forcano
Talent & CultureCarlos Casas
DataRicardo Martín Manjón
Global Economics & Public AffairsJosé Manuel González-Páramo
Senior Advisor to the ChairmanJuan Asúa
Strategy & M&AVictoria del Castillo
Communications & Responsible BusinessPaul G. Tobin
LegalMaría Jesús Arribas
General SecretaryDomingo Armengol
Regulation & lnternal Control(2)
Ana Fernández Manrique
Chief Audit Executive(2)
Joaquín Gortari
Client SolutionsDavid Puente
FinanceJaime Sáenz de Tejada
Global Risk ManagementRafael Salinas
Chief Executive Officer
Onur GençGroup Executive Chairman
Carlos Torres Vila
About BBVABBVA is a customer-centric global financial services group founded in 1857 that operates in more than 30 countries. The Group has a strong leadership position in the Spanish market, is the largest financial institution in Mexico, it has leading franchises in South America and the Sunbelt Region of the United States, being also the leading shareholder in Turkey’s Garanti BBVA.
Its diversified business is based on high-growth markets and it relies on technology as a key sustainable competitive advantage. Corporate responsibility is at the core of its business model. BBVA fosters financial education and inclusion, and supports scientific research and culture. It operates with the highest integrity, a long-term vision and applies the best practices.
Note: Data at the close of December 2019. Those countries in which BBVA has no legal entity or the volume of activity is not significant, are not included.
South AmericaArgentinaBoliviaBrazilChileColombiaParaguayPeruUruguayVenezuela
North AmericaMexico
The United States
EuropeBelgiumCyprusFranceFinlandGermanyNetherlandsItalyMaltaPortugalRomaniaSpainSwitzerlandTurkeyUnited Kingdom
Asia-PacificChinaHong KongJapanSingapore
>30 7,744 32,658 126,973€699billion in totalassets
78.1million customers countries branches ATMs employees
Data at the end Dec 2019. Those countries in which BBVA has no legal entity or the volume of activity is not significant, are not included
Organizational chart
Note 1: Reporting channel to CEO for Argentina, Colombia, Peru, Venezuela, Uruguay and Paraguay, as well as monitoring of all countries, including Spain, Mexico, the United States and Turkey. Note 2: Reporting to the Board of Directors through its corresponding committees.

“BBVA has proven once again the strength of its diversified business model and its ability to generate strong results with double-digit returns, leading our peer group. Despite the challenging environment, the net attributable profit of BBVA Group in 2019, excluding non-recurring impacts, was €4,830 millions, which is the highest since 2009.
In 2019 we achieved excellent financial results, the best of the last ten years, additionally we made great progress in our transformation journey.
Looking forward, we want to help our clients to make better financial decisions and to support them in their transition to a more sustainable world. This aspect is crucial for all of us taking into account the important social and environmental challenges we are facing.
To this end, we have evolved our strategy and defined six new strategic priorities that seek to broaden the impact of our transformation journey on our clients and society, with the team, data and technology playing a key role to achieve our Purpose: to bring the age of opportunity to everyone.
Outstanding results in 2019 in a challenging environment thanks to record-high recurring revenue and exemplary cost management
2018 2019
Carlos Torres VilaGroup Executive Chairman
Onur GençChief Executive Officer
48.5%49.4%
2018 2019
-92basis
points
4,703(1)
4,830(2)
-35.0%
3,512
5,400
(1) Excluding earnings generated by BBVA Chile until its sale on July 6, 2018 and the net capital gains from the operation.(2) Excluding the goodwil impairment in the United States.
+2.7%
NET ATTRIBUTABLE PROFIT (€ Mill)
EFFICIENCY RATIO (At constant exchange rates)
“

BBVA Transformation Journey
Progress achieved by BBVA on its transformation since 2015
Customer comes first: We are empathetic We have integrity We meet their needs
We think big: We are ambitious We break the mold We amaze our customers
We are one team: I am committed I trust others I am BBVA
MOREACTIVE CUSTOMERS
MORESATISFACTION
MOREDIGITALIZATION
2015 2019
%
MILLIONS DIGITAL CUSTOMERS
MOBILE CUSTOMERS
DIGITAL SALES
+8.8 x2 x3 59
VALUES:
To bring the age of opportunity to everyone
PURPOSE:
vs 16% Jan-16
Leadership position in the client satisfaction index in most of the geographical areas
Non-residents
56.60%
Residents
43.40%
Banks
1.30%
Insitutions
2.92%
Individuals
39.18%
Focus on shareholder value creation
Cash (1)
26Dividend yield (2)
5.2%
CLEAR, SUSTAINABLE AND PREDICTABLE
DIVIDEND POLICY
(1) €10 cents / share paid in October 2019 plus €16 cents / share as final dividend for the year 2019 which, if approved, would be paid on April 9, 2020. (2) Calculated with the share closing price as of December 31, 2019.
Dec-18 Dec-19
5.866.53
6.27
+11.5%
0.26 Dividends
Shareholders
874,148
SHAREHOLDER BREAKDOWN(31/12/2019)
TANGIBLE BOOK VALUE + DIVIDENDS (€ PER SHARE)
€ cents/share (gross)
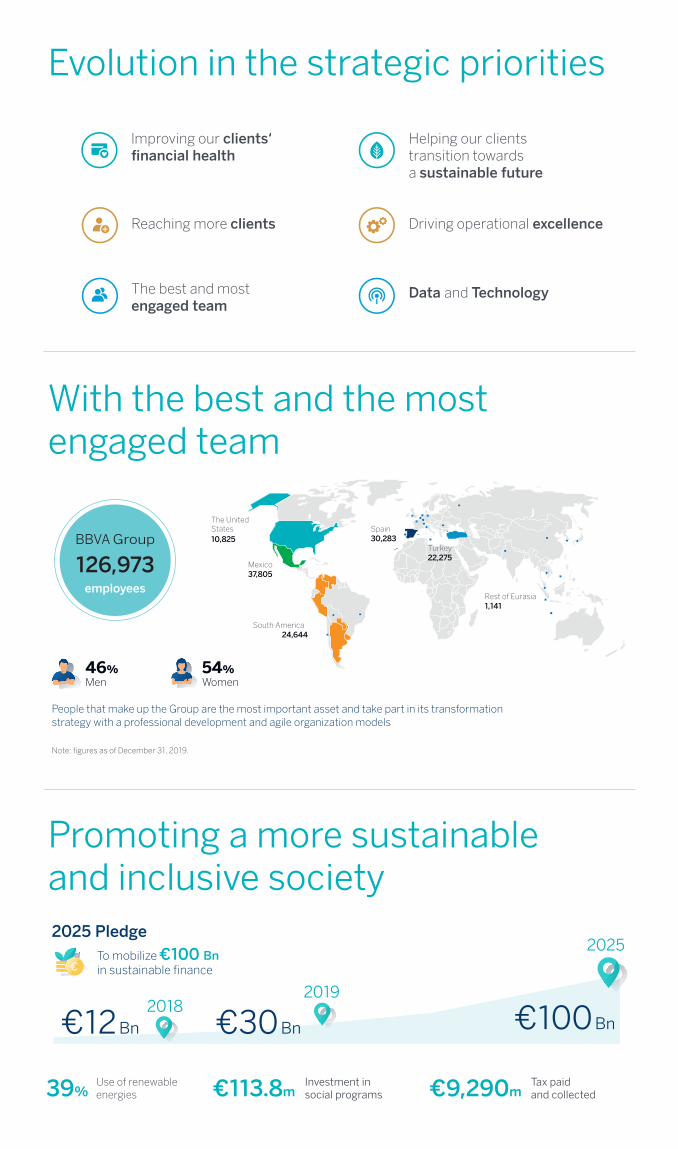
Evolution in the strategic priorities
With the best and the most engaged team
46%Men
54%Women
People that make up the Group are the most important asset and take part in its transformation strategy with a professional development and agile organization models
Note: figures as of December 31, 2019.
2025 PledgeTo mobilize €100 Bn in sustainable finance
Promoting a more sustainable and inclusive society
20182019
2025
€30 Bn €100 Bn€12 Bn
Use of renewable energies
Investment in social programs
Tax paid and collected39% €113.8m €9,290m
employees
BBVA Group
126,973
lmproving our clients‘ financial health
Helping our clientstransition towardsa sustainable future
Reaching more clients Driving operational excellence
The best and mostengaged team
Data and Technology
Mexico37,805
The United States10,825
Rest of Eurasia1,141
Spain30,283
Turkey22,275
South America 24,644

BBVA Group highlightsIFRS 9 IAS 39
Consolidated figures 31-12-19 ∆ % 31-12-18 31-12-17
Balance sheet (millions of euros)
Total assets 698,690 3.3 676,689 690,059
Loans and advances to customers (gross) 394,763 2.2 386,225 400,369
Deposits from customers 384,219 2.2 375,970 376,379
Total customer funds 492,022 3.8 474,120 473,088
Total equity 54,925 3.9 52,874 53,323
Income statement (millions of euros)
Net interest income 18,202 3.5 17,591 17,758
Gross income 24,542 3.3 23,747 25,270
Operating income 12,639 4.9 12,045 12,770
Net attributable profit (1) 4,830 2.7 4,703 4,637
The BBVA share and share performance ratios
Number of shares (millions) 6,668 - 6,668 6,668
Share price (euros) 4.98 7.5 4.64 7.11
Earning per share (euros) (1) (2) 0.66 3.4 0.64 0.63
Book value per share (euros) 7.32 2.8 7.12 6.96
Tangible book value per share (euros) 6.27 7.1 5.86 5.69
Market capitalization (millions of euros) 33,226 7.5 30,909 47,422
Yield (dividend/price; %) 5.2 5.4 4.2
Significant ratios (%)
ROE (net attributable profit/average shareholders’ funds +/- average accumulated other comprehensive income) (1) 9.9 10.2 9.7
ROTE (net attributable profit/average shareholders’ funds excluding averageintangible assets +/- average accumulated other comprehensive income) (1) 11.9 12.4 12.0
ROA (Profit or loss for the year/average total assets) (1) 0.82 0.81 0.84
RORWA (Profit or loss for the year/average risk-weighted assets - RWA) (1) 1.57 1.56 1.57
Efficiency ratio 48.5 49.3 49.5
Cost of risk 1.04 1.01 0.89
NPL ratio 3.8 3.9 4.6
NPL coverage ratio 77 73 65
Capital adequacy ratios (%)
CET1 fully-loaded 11.74 11.34 11.08
CET1 phased-in (3) 11.98 11.58 11.71
Total ratio phased-in (3) 15.92 15.71 15.51
Other information
Number of clients (millions) 78.1 4.4 74.8 72.8
Number of shareholders 874,148 (3.2) 902,708 891,453
Number of employees 126,973 1.1 125,627 131,856
Number of branches 7,744 (2.8) 7,963 8,271
Number of ATMs 32,658 0.5 32,502 32,327
General note: as a result of the amendment to IAS 12 “Income Taxes”, and in order to make the information comparable, the 2018 and 2017 income statements have been restated.(1) Excluding the goodwill impairment in the United States in 2019, BBVA Chile in 2018 and Telefónica impairment in 2017.(2) Adjusted by additional Tier 1 instrument remuneration.(3) Phased-in ratios include the temporary treatment on the impact of IFRS 9, calculated in accordance with Article 473 bis of the Capital Requirements Regulation (CRR).
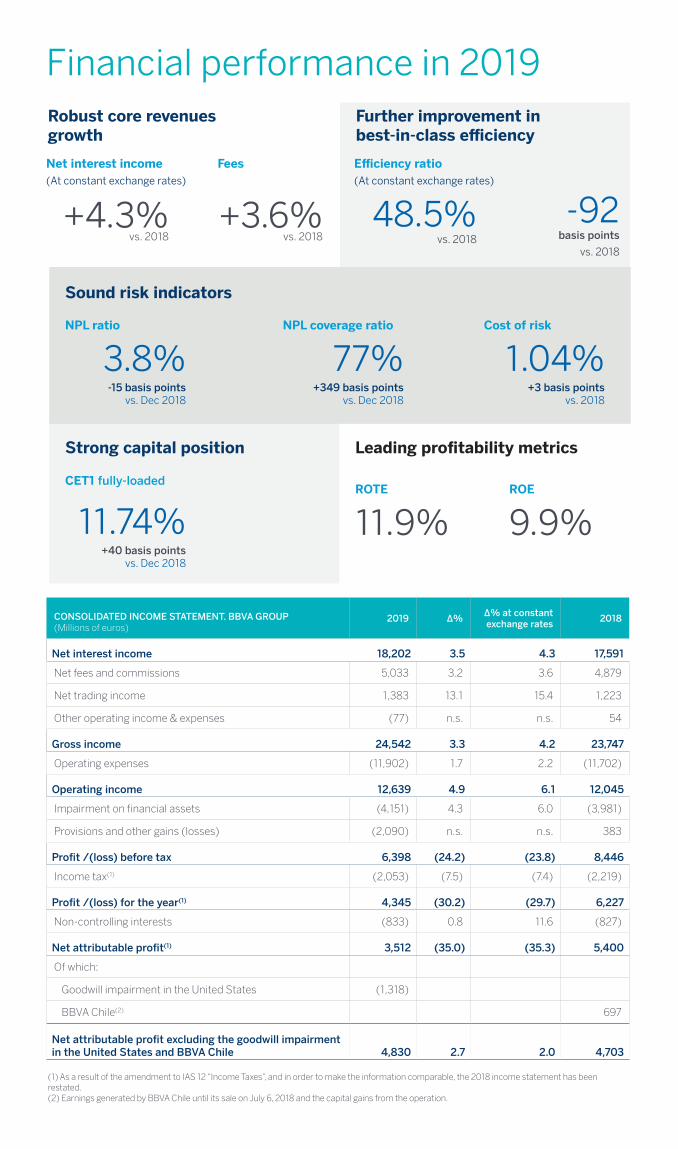
Financial performance in 2019
CONSOLIDATED INCOME STATEMENT. BBVA GROUP(Millions of euros)
2019 ∆% ∆% at constantexchange rates 2018
Net interest income 18,202 3.5 4.3 17,591
Net fees and commissions 5,033 3.2 3.6 4,879
Net trading income 1,383 13.1 15.4 1,223
Other operating income & expenses (77) n.s. n.s. 54
Gross income 24,542 3.3 4.2 23,747
Operating expenses (11,902) 1.7 2.2 (11,702)
Operating income 12,639 4.9 6.1 12,045
Impairment on financial assets (4,151) 4.3 6.0 (3,981)
Provisions and other gains (losses) (2,090) n.s. n.s. 383
Profit /(loss) before tax 6,398 (24.2) (23.8) 8,446
Income tax(1) (2,053) (7.5) (7.4) (2,219)
Profit /(loss) for the year(1) 4,345 (30.2) (29.7) 6,227
Non-controlling interests (833) 0.8 11.6 (827)
Net attributable profit(1) 3,512 (35.0) (35.3) 5,400
Of which:
Goodwill impairment in the United States (1,318)
BBVA Chile(2) 697
Net attributable profit excluding the goodwill impairment in the United States and BBVA Chile 4,830 2.7 2.0 4,703
(1) As a result of the amendment to IAS 12 “Income Taxes”, and in order to make the information comparable, the 2018 income statement has been restated.(2) Earnings generated by BBVA Chile until its sale on July 6, 2018 and the capital gains from the operation.
Robust core revenuesgrowth
Leading profitability metrics
Further improvement inbest-in-class efficiency
Strong capital position
Sound risk indicators
+4.3%vs. 2018
ROTE
11.9%
48.5%vs. 2018
CET1 fully-loaded
11.74%+40 basis points
vs. Dec 2018
NPL ratio
3.8%-15 basis points
vs. Dec 2018
+3.6%vs. 2018
ROE
9.9%
NPL coverage ratio
77%+349 basis points
vs. Dec 2018
Cost of risk
1.04%+3 basis points
vs. 2018
Net interest income Efficiency ratio(At constant exchange rates) (At constant exchange rates)
Fees
-92basis points
vs. 2018

Business areas
SPAIN
Year-on-year changes,data as of 31-12-2019
Year-on-year changes at constant exchange rate,data as of 31-12-2019
Performing loans undermanagement
Performing loans undermanagement
Total customer fundsunder management
Total customer fundsunder management
+2.1%
+7.6%
-1.4%
+3.7%
+7.0%
+1.2%
Results. 2019. Millions of euros. Year-on-year changes.
Net interest income 3,645 -1.4%
Gross income 5,734 -3.9%
Operating income 2,480 -5.8%
Net attributable profit 1,386 -1.0%
ACTIVITY(1)
ACTIVITY(1)
RISKS
RISKS
THE UNITED STATES
Results. 2019. Millions of euros. Year-on-year changes at constant exchange rate.
Net interest income 2,395 -0.2%
Gross income 3,223 +2.3%
Operating income 1,257 +5.8%
Net attributable profit 590 -23.9%
Dec 18 Dec 19
57
85
154
60
101
136
5.1
1.3
4.4
1.1
0.12
0.88
0.21
0.39
MEXICO
Results. 2019. Millions of euros. Year-on-year changes at constant exchange rate.
Net interest income 6,209 +5.9%
Gross income 8,029 +6.0%
Operating income 5,384 +6.5%
Net attributable profit 2,699 +8.2%
Growth in consumer, retail and commercial portfolios.Net interest income influenced by the impact of IFRS 16 “Leases”.
Activity impacted by Fed´s interest-rate cuts.
Good performance of net fees and commissions and net trading income.
Good performance of the lending activity, boosted by growth in the retail portfolio.
Positive trend of customer funds especially in demand deposits.
Continued improvement of the efficiency ratio.
Net attributable profit affected by the impairment on financial assets.
Net interest income growth in line with activity.
Excellent performance of the net trading income.
Cumulative cost of risk at historically low levels.
Continued decrease in operating expenses.
Positive impact of the sale of non-performing and write-off portfolios on loan loss provisions and risk indicators.
+6.7%
+16.6%
81
75
5.3
7.0
2.072.44
Results. 2019. Millions of euros. Year-on-year changes at constant exchange rate.
Net interest income 2,814 +0.1%
Gross income 3,590 +2.6%
Operating income 2,375 -0.2%
Net attributable profit 506 -0.5%
In Turkish lira, positive activity performance and relevant improvement in the spread.
Operating expenses growth below the inflation rate.
Positive evolution of net fees and commissions and lower requirements for loan-loss provisions on financial assets.
TURKEY
NPL coverage ratio (%) NPL ratio (%) Cost of risk (%)
Year-on-year changes at constant exchange rate,data as of 31-12-2019
Performing loans undermanagement
Total customer fundsunder management
ACTIVITY(1) RISKS
Year-on-year changes at constant exchange rate,data as of 31-12-2019
Performing loans undermanagement
Total customer fundsunder management
ACTIVITY(1) RISKS
Dec 18 Dec 19
Dec 18 Dec 19
Dec 18 Dec 19
2.12.4
3.013.07

SOUTH AMERICA
ARGENTINA, COLOMBIA AND PERU
Results. 2019. Millions of euros. Year-on-year changes at constant exchange rates.
Net attributable profit breakdown. Millions of euros
Net interest income 3,196 +15.2%
Gross income 3,850 +14.3%
Operating income 2,276 +25.2%
Net attributable profit 721 +43.8%
REST OF EURASIA
2,894
Results. 2019. Millions of euros. Year-on-year changes.
Net interest income 175 0.0%
Gross income 454 +9.6%
Operating income 161 +26.1%
Net attributable profit 127 +32.3%
of revenues given by ourrelations with clients
OTHER INFORMATION: CORPORATE & INVESTMENT BANKING
Results. 2019. Millions of euros. Year-on-year changes at constant exchange rates.
Gross income 3,055 +4.8%
Operating income 1,988 +5.4%
Net attributable profit 1,031 +1.5%
(1) Performing loans under management excluding repos. Total customer funds under management are made up of the sum of customer deposits under managementexcluding repos plus mutual funds, pension funds and other off-balance-sheet funds.(2) Client´s revenue / Gross income
* Rest includes Venezuela, Paraguay, Uruguay, Bolivia and Forum (Chile).
€ Mill, Year-on-year changesat constant exchange rates
+18.7%
+7.0%
+11.9%
-1.1%
+7.2%
-1.7%
CLIENT´S REVENUE
97
83
100
98
4.3
1.7
4.4
1.2
1.88
0.02
1.44
-0.11
Wholesale bankingrecurrent business(2)
95%
+7%
Positive evolution of activity in the main countries: Argentina, Colombia and Peru.
Improved efficiency ratio, supported by the growth in net interest income and the control in operating expenses.
Argentina: positive contribution to the area’s result thanks to excellent revenues’ performance.
Colombia: remarkable year-on-year growth of the net attributable profit, boosted by activity, efficiency improvement and lower impairments on financial assets.
Peru: net attributable profit growth favoured by revenues and offset by higher impairments on financial assets.
Good performance in lending, especially in Asia.
Flattish recurring revenue and positive performance of the net trading income.
Good performance of activity with customers.
Leadership position in green and sustainable loans.
Greater net trading income contribution in the year due to the positive effect derived from the positive contribution of foreign exchange transactions and Prisma sale in Argentina.
Net attributable profit negatively impacted by Argentina´s inflation adjustment.
Controlled growth of operating expenses.
Improved risk indicators.
Positive evolution of net interest income, linked to the activity.
Net attributable profit positively impacted by good performance in the fourth quarter.
Argentina
133
Colombia
267
Peru
202
Rest *
120
NPL coverage ratio (%) NPL ratio (%) Cost of risk (%)
Year-on-year changes,data as of 31-12-2019
Performing loans undermanagement
Total customer fundsunder management
ACTIVITY(1) RISKS
Year-on-year changes at constant exchange rates,data as of 31-12-2019
Performing loans undermanagement
Total customer fundsunder management
ACTIVITY(1)
Year-on-year changes at constant exchange rates,data as of 31-12-2019
Performing loans undermanagement
Total customer fundsunder management
ACTIVITY(1) RISKS
Dec 18 Dec 19
Dec 18 Dec 19

More information:
Sharesholder’s line +34 912 249 821
https://shareholdersandinvestors.bbva.com
Shareholder office:Ciudad BBVA. Calle Azul, 4. 28050 Madrid (Spain)
Creating Opportunities