bbn concordance: what’s the matter with li?
TRANSCRIPT
BBN Concordance:What’s the Matter with Li?
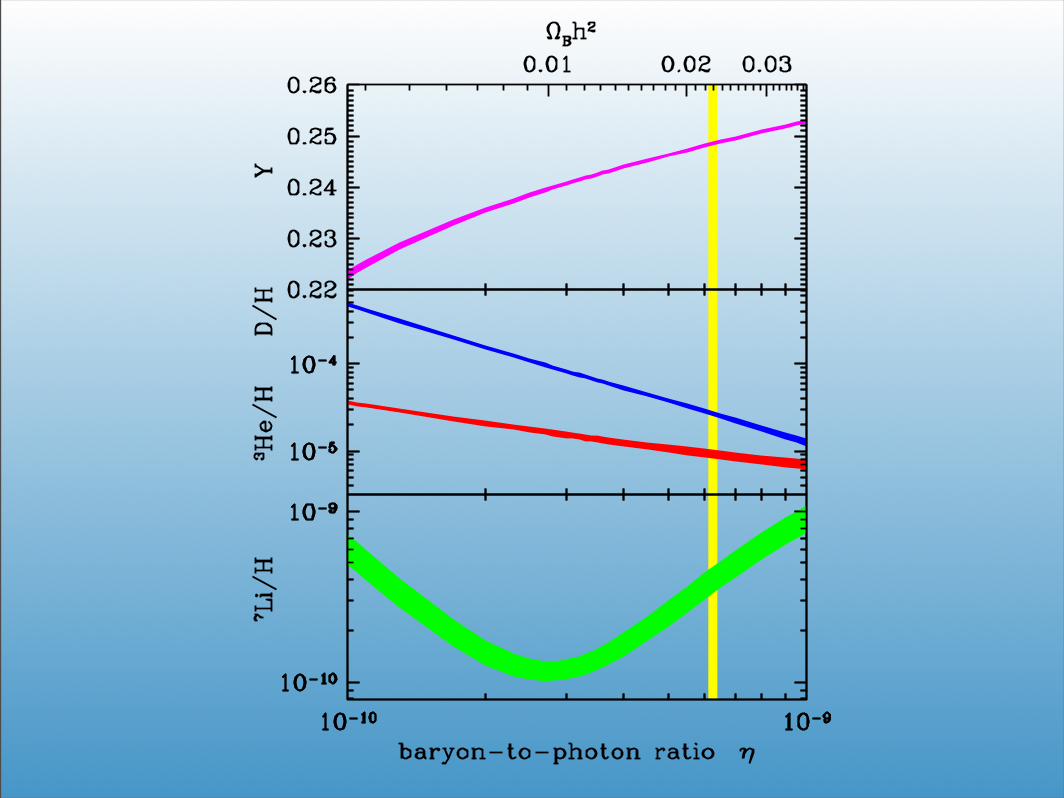
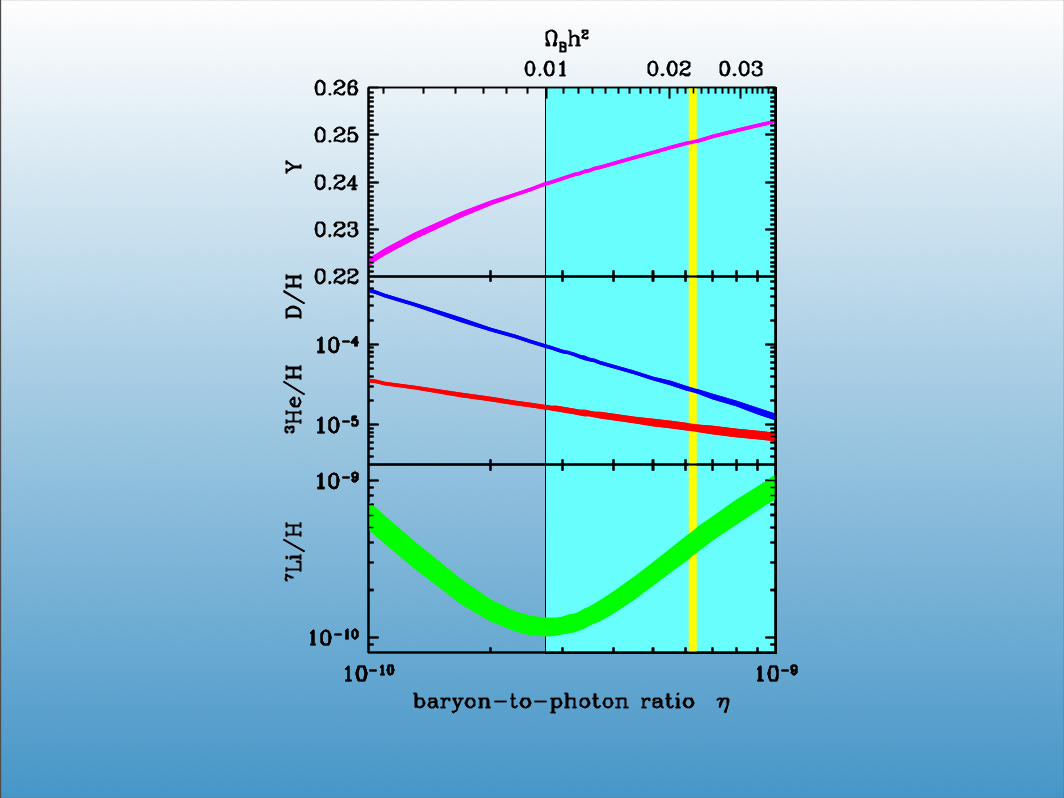
• BBN and the WMAP determination of η, ΩBh2
• Observations and Comparison with Theory - D/H - 4He - 7Li
• The Li Problem
• Cosmic-ray nucleosynthesis - 6,7Li - BeB
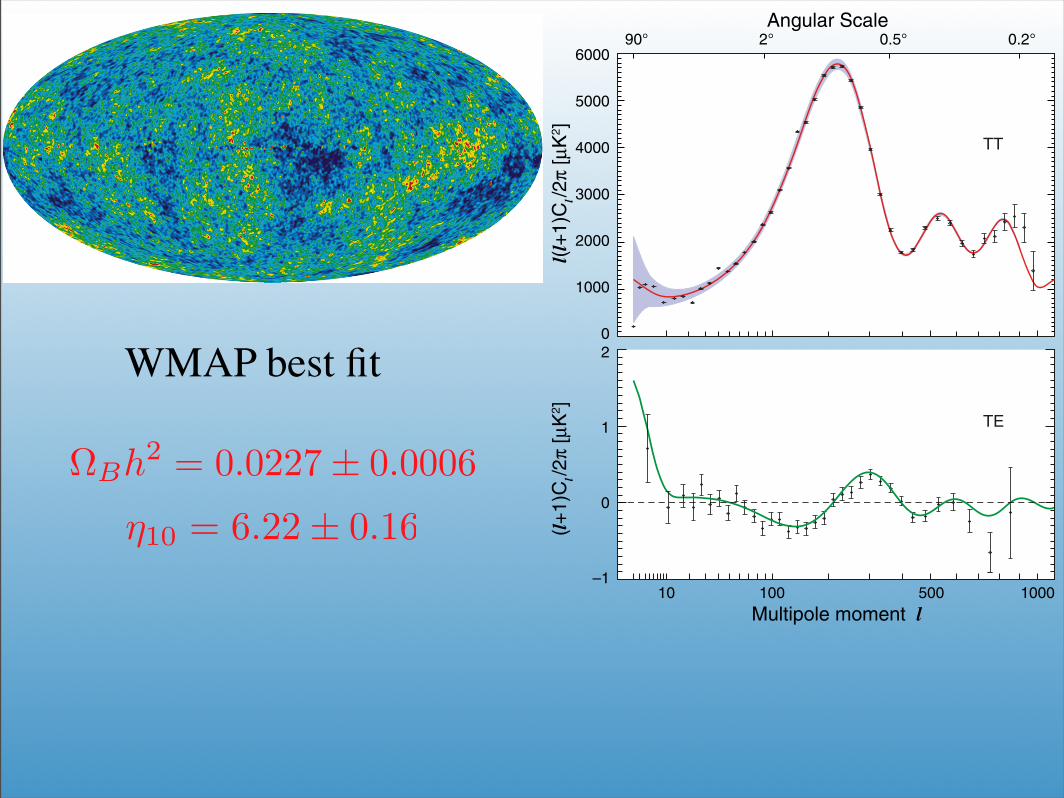
WMAP best fit
ΩBh2 = 0.0227± 0.0006
η10 = 6.22± 0.16
– 5 –
modifies this approach, keeping the same exponential dependence, but changes from a power law
in T 1/3
9 to a power law in T9: exp(a′/T 1/3
9 )(∑
j c′jTj9 ). The main reason for the form of their fit is
to get fast convergence to the numerical data. In some cases (e.g. 3He(d, n)4He and 7Li(p,α)4He)
additional factors are used to improve the fit to the numerical results.
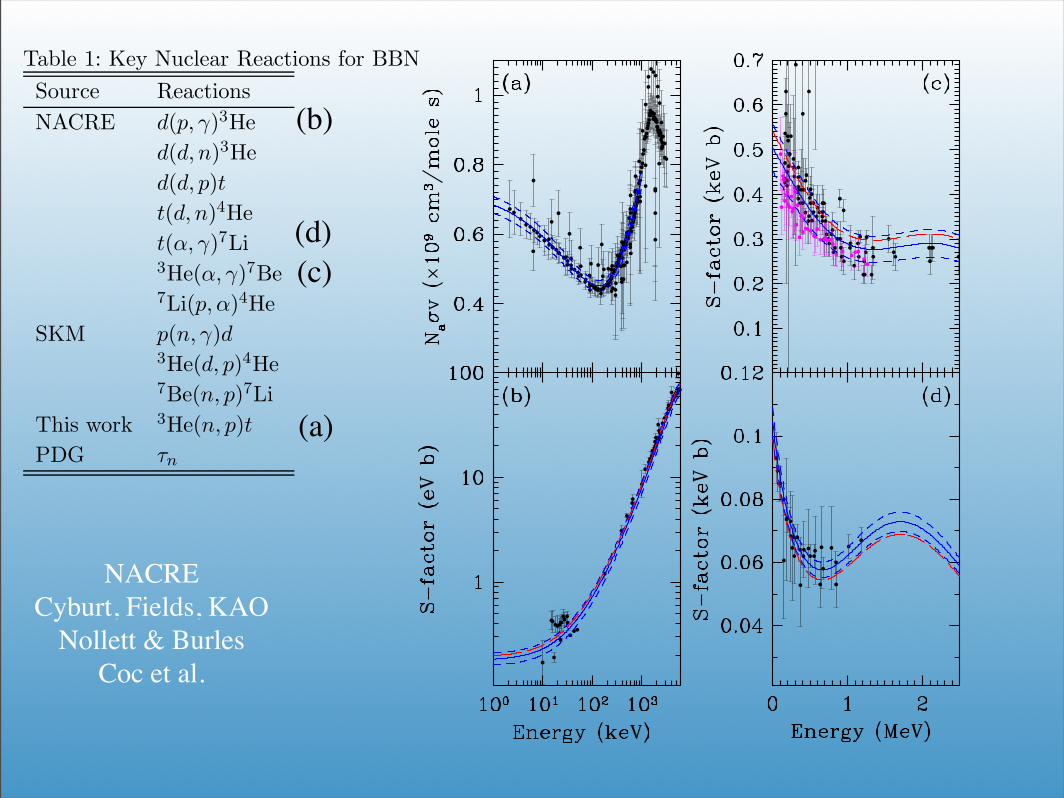
Table 1: Key Nuclear Reactions for BBN
Source Reactions
NACRE d(p, γ)3He
d(d, n)3He
d(d, p)t
t(d, n)4He
t(α, γ)7Li3He(α, γ)7Be7Li(p,α)4He
SKM p(n, γ)d3He(d, p)4He7Be(n, p)7Li
This work 3He(n, p)t
PDG τn
As noted above, some of the rates are not provided by NACRE. In these cases, the SKM rates
as indicated in Table 1 are used. One of these, 7Be(n, p)7Li, is a n-capture reaction for which a
large amount of data is available. The deuteron-induced reaction (3He(d, p)4He), is fit as a charged
particle reaction using the Caughlan & Fowler prescription, as discussed in the previous paragraph.
Several reactions deserve special mention. As noted by SKM and emphasized recently by
Nollett & Burles (2000), the p(n, γ)d reaction suffers from a lack of data in the BBN energy
range. Also, p(n, γ)d has only 4 data points (not available when SKM did their study) in the
relevant energy range ! 1 MeV. Fortunately, this reaction is well-described theoretically. Here we
follow both SKM and Nollett & Burles, by adopting the theoretical cross sections of Hale et al.
(1991), which provide an excellent fit to the four available data points by Suzuki (1995) and Nagai
(1997). Nevertheless, despite the present agreement between theory and data, the importance of
this reaction–which controls the onset of nucleosynthesis–demands that the theoretical cross section
fit be further tested by accurate experiment. We urge further investigation of this reaction.
Since SKM, Brune et al. (1999) have added new and very precise data for 3He(n, p)t (see Figure
1a).1 This has greatly reduced the uncertainty in this reaction. In order to use these data, we have
refit the R factor in the manner of SKM and Brune et al., using a third order polynomial in v and
1Note that in all figures having logarithmic vertical scales, errors have been properly propagated to reflect the log
nature of the plot.
(a)
(b)
(c)(d)
NACRECyburt, Fields, KAO
Nollett & BurlesCoc et al.


D/H• All Observed D is Primordial!
• Observed in the ISM and inferred from meteoritic samples (also HD in Jupiter)
• D/H observed in Quasar Absorption systems6 M. Pettini et al.
Table 2. Prime Sample of D/H measurements in QSO Absorption Line Systems
QSO zem zabs log N(H i) [O/H]b log (D/H) Ref.a
(cm−2)
HS0105+1619 2.640 2.53600 19.42 ± 0.01 −1.70 −4.60 ± 0.04 1Q0913+072 2.785 2.61843 20.34 ± 0.04 −2.37 −4.56 ± 0.04 2, 3Q1009+299 2.640 2.50357 17.39 ± 0.06 < −0.67c −4.40 ± 0.07 4Q1243+307 2.558 2.52566 19.73 ± 0.04 −2.76 −4.62 ± 0.05 5SDSS J155810.16−003120.0 2.823 2.70262 20.67 ± 0.05 −1.47 −4.48 ± 0.06 6Q1937−101 3.787 3.57220 17.86 ± 0.02 < −0.9 −4.48 ± 0.04 7Q2206−199 2.559 2.07624 20.43 ± 0.04 −2.04 −4.78 ± 0.09 2, 8
aReferences—1: O’Meara et al. (2001); 2: Pettini et al. (2008); 3: This work; 4: Burles & Tytler(1998b); 5: Kirkman et al. (2003); 6: O’Meara et al. (2006); 7: Burles & Tytler (1998a); 8: Pettini& Bowen (2001).bRelative to the solar value log(O/H)" + 12 = 8.66 (Asplund, Grevesse & Sauval 2005).cThis is a very conservative upper limit on the metallicity. Burles & Tytler (1998b) estimate[Si/H]" −2.5 and [C/H]" −2.9 from photoionisation modelling.
(the bootstrap method; see Efron & Tibshirani 1993). Inthis way we obtain:
〈log (D/H)p〉 = −4.55 ± 0.03
A more Bayesian approach could try to account for uncer-tainty in the error bars using the observed scatter in thedata. For example, fitting a Gaussian model with the vari-ance on each point increased by a constant to σ2
i +δσ2 showsthat the data prefer values of δσ > 0. Using the maximumlikelihood value δσ ∼ 0.07 gives a posterior constraint on〈log (D/H)p〉 consistent with the bootstrap estimate above,as does marginalizing over δσ2 with prior ∝ 1/(0.022 + δσ2)(though the distribution is somewhat non-Gaussian). Usinga model that multiplicatively increases the noise gives simi-lar results.
The scatter in the reported determinations of D/H inQSO absorbers is illustrated in Figure 3. Out of the sevenmeasurements, there are two which lie outside the confidenceintervals of the mean by more than 1σ: Q1009+299 andQ2206−199. If we consider these two cases more closely wecan find, in retrospect, plausible reasons why their 1σ errorsmay have been underestimated. The partial Lyman limitsystem in line to Q1009+299 has the lowest column densityamong the sample, log[N(H i)/cm−2] = 17.39, and is uniqueamong the ones considered here in showing D i absorption inonly one line, Lyα, the column density of D i being too lowto produce discernible absorption in higher order lines. Thezabs = 2.07624 DLA towards Q2206−199 is the lowest red-shift absorber in the sample, requiring space-borne observa-tions to record the high order lines where D i absorption canbe resolved from H i. The HST -STIS spectrum of this objectpublished by Pettini & Bowen (2001) is of lower S/N ratioand resolution than the other six cases in Table 2 which wereall obtained with ground-based 8-10m telescopes and echellespectrographs. If we arbitrarily double the 1σ estimates ofthe errors in the determinations of D/H in Q1009+299 andQ2206−199 reported in the original works, we find the sameweighted mean 〈log (D/H)p〉 = 4.55 ± 0.02 as before, but amuch reduced χ2 = 11 (P (χ2 > 11) & 0.1).
In conclusion, the value of D/H we deduce here for thezabs = 2.61843 DLA in the spectrum of Q0913+072 is ingood agreement with four out of the previous six determi-
Figure 3. Measures of deuterium abundance in high redshiftQSO absorbers. Only cases were the deuterium absorption isclearly resolved from nearby spectral features are shown here (seetext). Blue circles denote systems observed from the ground with8-10m telescopes and echelle spectrographs, while the red trian-gle refers to lower resolution observations made with the Hubble
Space Telescope. Absorption systems discussed in the text arelabelled with the name of the background QSO. The horizontallines are drawn at the weighted mean value of log (D/H) and itserror, as determined with the bootstrap method.
nations generally considered to be the most reliable. Its in-clusion in the ‘prime’ sample, helps identify two outliers andplausible reasons for much of the scatter among the sample.The weighted mean 〈log (D/H)p〉 is unchanged comparedto the most recent previous estimate of this quantity byO’Meara et al. (2006), leading us to conclude that the truevalue of the primordial abundance of deuterium lies in therange:
〈log (D/H)p〉 = −4.55 ± 0.03 (1)
at the 68% confidence level.
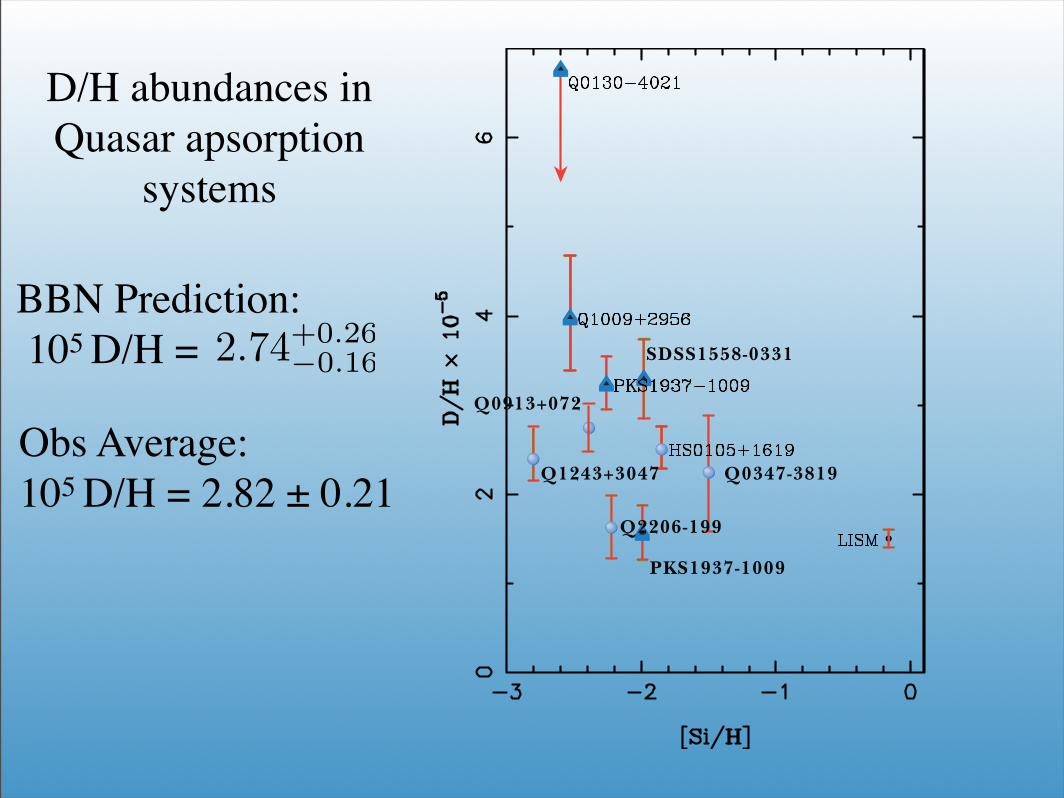
D/H abundances inQuasar apsorption
systems
Q0347-3819Q1243+3047
PKS1937-1009
Q2206-199
SDSS1558-0331
Q0913+072
BBN Prediction: 105 D/H = 2.74+0.26
−0.16
Obs Average:105 D/H = 2.82 ± 0.21

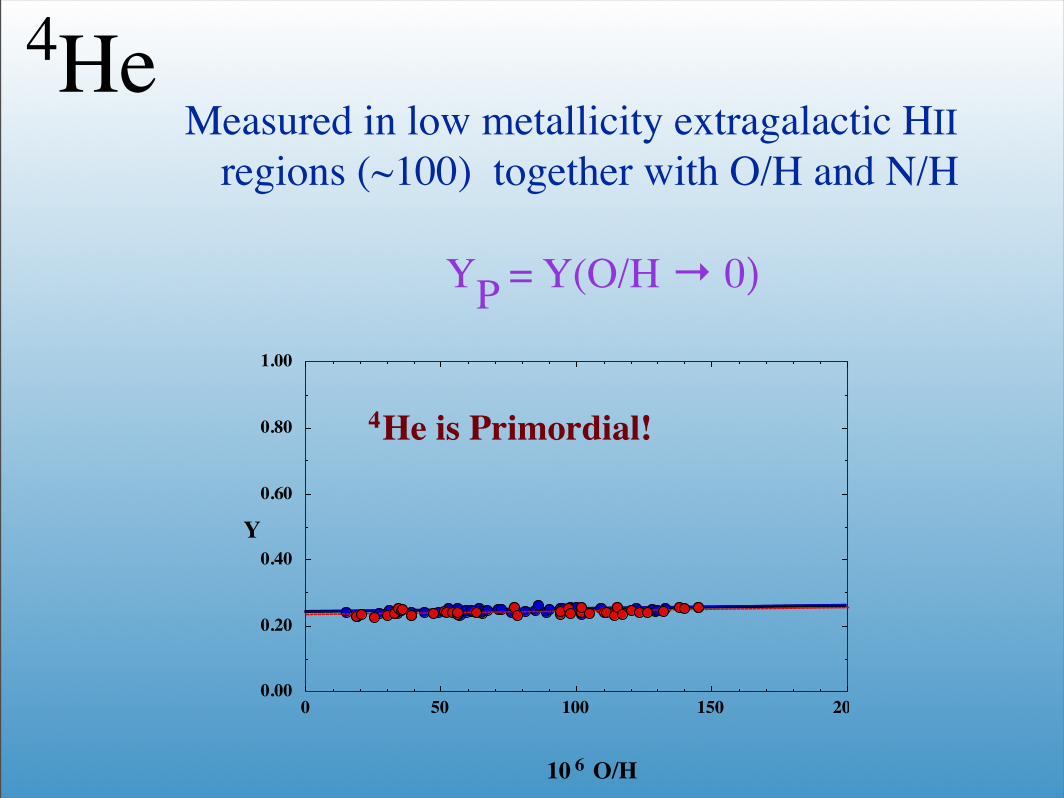
4HeMeasured in low metallicity extragalactic HII
regions (~100) together with O/H and N/H
YP = Y(O/H → 0)
0.00
0.20
0.40
0.60
0.80
1.00
Y
0 50 100 150 200
10 6 O/H
4He is Primordial!

0 50 100 150 200 2500.07
0.075
0.08
0.085
0.09
Density
0 0.1 0.2 0.3 0.4 0.50.07
0.075
0.08
0.085
0.09
Absorption (EW)
0 50 100 150 200 2500.07
0.075
0.08
0.085
0.09
Density
0 0.1 0.2 0.3 0.4 0.50.07
0.075
0.08
0.085
0.09
Absorption (EW)
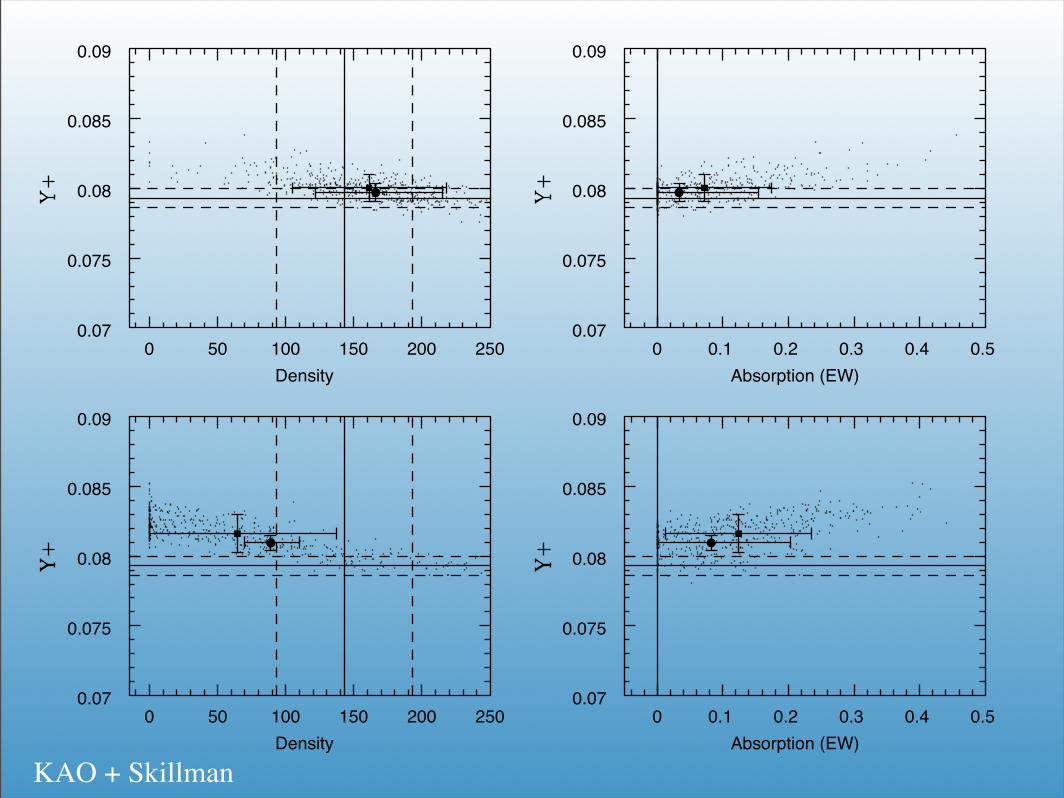
KAO + Skillman

0. .2 .4 .6 .8! ! 1.22
.23
.24
.25
.26
.27
O/H x 104
Y
IT 98
OS 04
Yp
Yp = 0.2495 ± 0.0092
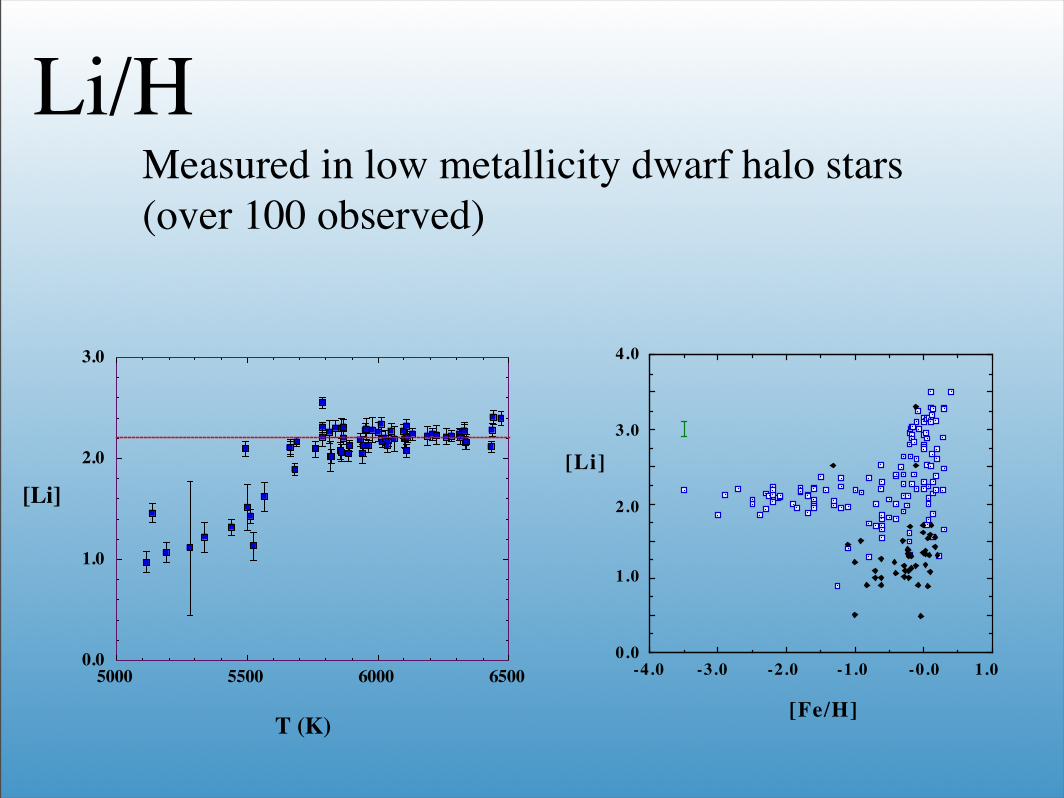
Li/HMeasured in low metallicity dwarf halo stars (over 100 observed)
0.0
1.0
2.0
3.0
[Li]
5000 5500 6000 6500
T (K)
4.0
3.0
2.0
1.0
0.0-4.0 -3.0 -2.0 -1.0 -0.0 1.0
[Li]
[Fe/H]
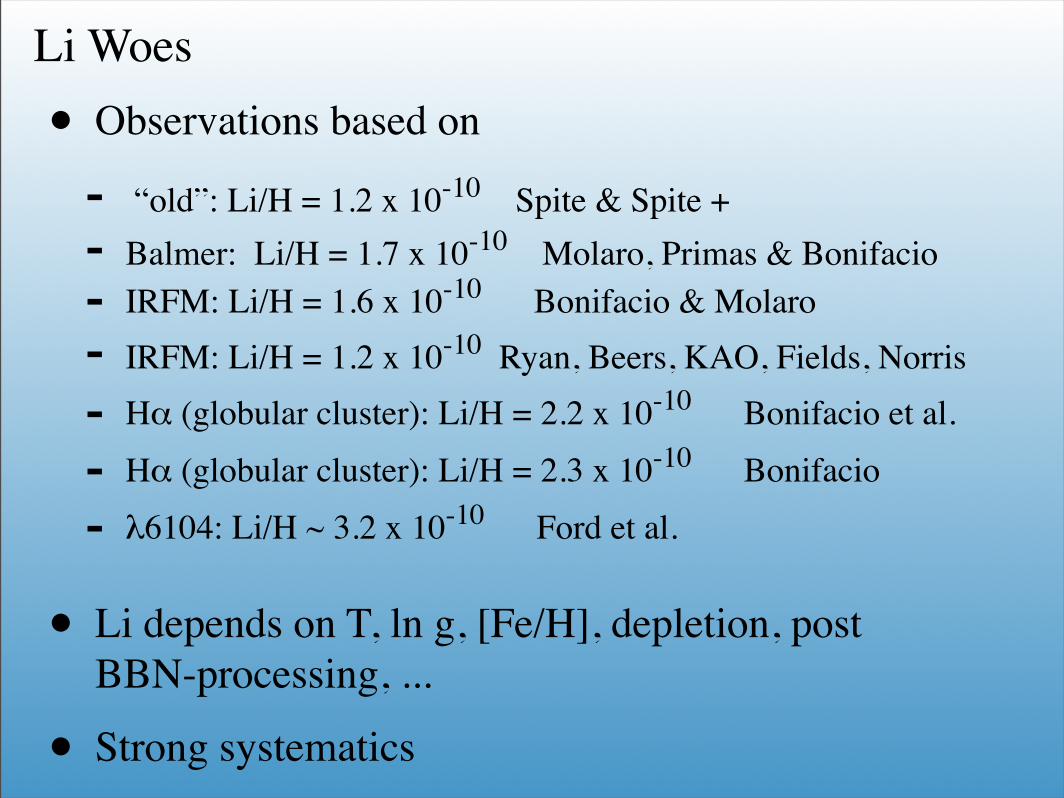
Li Woes
• Observations based on
- “old”: Li/H = 1.2 x 10⁻¹⁰ Spite & Spite + - Balmer: Li/H = 1.7 x 10⁻¹⁰ Molaro, Primas & Bonifacio- IRFM: Li/H = 1.6 x 10⁻¹⁰ Bonifacio & Molaro- IRFM: Li/H = 1.2 x 10⁻¹⁰ Ryan, Beers, KAO, Fields, Norris
- Hα (globular cluster): Li/H = 2.2 x 10⁻¹⁰ Bonifacio et al.
- Hα (globular cluster): Li/H = 2.3 x 10⁻¹⁰ Bonifacio
- λ6104: Li/H ~ 3.2 x 10⁻¹⁰ Ford et al.
• Li depends on T, ln g, [Fe/H], depletion, post BBN-processing, ...
• Strong systematics

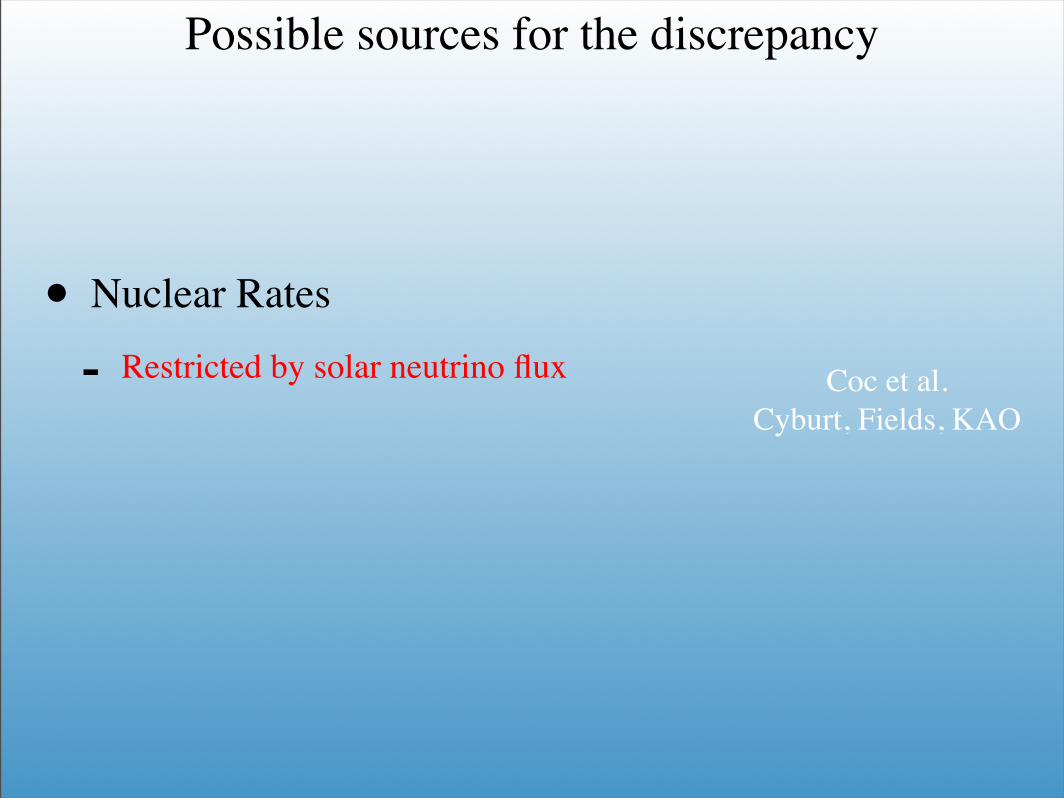
Possible sources for the discrepancy
• Nuclear Rates
- Restricted by solar neutrino flux Coc et al.Cyburt, Fields, KAO

Coc et al. consider large variations of certain rates. 3H (p,γ) 4He increase x1000 low η XX
4He (α,n) 7Be small compared with destruction X7Li (d,n) 24He increase x100 low η XX7Be (d,p) 24He increase >x100 high η ? X
Table 3 lists the few reactions for which a variation of theirrates by up to an arbitrary factor of 1000 induces a variation ofthe yields by more than 0.01 dex for 4He, D, 3He, and 7Li. Itshows that there are only four reactions that can lead to afactor of at least 3 (0.5 dex) on 7Li yield when their rates areartificially increased by up to a factor of 1000: 3H( p, !)4He,4He(" , n)7Be, 7Li(d, n)2 4He, and 7Be(d, p)2 4He. It remainsto be checked whether such a huge increase in these reaction
rates is possible. As we see below, this is generally ruled outby existing data.A factor of !1000 increase of the 3H( p, !)4He rate would
be needed to reduce the 7Li yield by a factor of 3. This isexcluded because, since CF88, this reaction cross section hasbeen measured precisely by Hahn, Brune, & Kavanagh (1995)and Canon et al. (2002) over the SBBN energy range. Thesmall changes in S-factor brought by these experiments (e.g., a!40% reduction relative to CF88 at a Gamow peak energycorresponding to T9 ¼ 1) rule out any possible influence inSBBN. In any case, as seen in Figure 3, this reaction couldonly affect the low baryonic density branch, 3H(" , !)7Li, andnot the WMAP density region.The reaction rate for 7Li(d, n)2 4He comes from an analysis
by Boyd, Mitchell, & Meyer (1993) of 7Li destruction inSBBN. A factor of 100 increase could reduce the 7Liproduction by a factor of !3. Even though no rateuncertainties are provided by Boyd et al., this seems quiteunlikely, since their analysis is based on experimental dataavailable in the SBBN energy range. Nevertheless, as for theprevious reaction, this could only influence the direct 7Liformation, i.e., the low baryonic density region.On the contrary, the 4He(" , n)7Be reaction (Q ¼ #18:99
MeV) could affect 7Li production at high #, at which it isformed as 7Be (Fig. 3), and through 7Be destruction by thereverse reaction, 7Be(n, "!)4He. However, the rate of thislatter is negligible compared to the main destruction mecha-nism: 7Be(n, p)7Li (Fig. 3), where an l ¼ 0 resonancedominates, while l ¼ 0 is forbidden in 7Be(n, "!)4He becauseof the symmetry of the outgoing channel.The last reaction in Table 3, 7Be(d, p)8Be(" )4He, is then
the most promising in view of reducing the discrepancybetween SBBN, 7Li, and CMB observations, and 7Beþ d
Fig. 4.—Same as Fig. 1 (bottom), but including the effect of 7Be(d, p)2 4He rate variations, while other reaction rates are set to their nominal values. The solidcurve is the reference for which the 7Be(d, p)2 4He rate from CF88 is used, while the dot-dashed curves correspond to an increase of the rate by factors of 30, 100,300, and 1000. [See the electronic edition of the Journal for a color version of this figure.]
Fig. 3.—The 12 main SBBN reactions plus 7Be(d, p)2 4He. [See theelectronic edition of the Journal for a color version of this figure.]
COC ET AL.550 Vol. 600

can see that the most important reaction that directly creates or destroys 7Li (or rather7Be, and subsequently 7Li) is the reaction 3He(α, γ)7Be (S34
2). The reactions n(p, γ)d,3He(d, p)4He, d(d, n)3He, and d(p, γ)3He are important in determining the deuterium, 3He
and 4He abundances, and thus the source and sink rates that determine 7Li. We mention
here the non-impact of the reaction 7Be(p, γ)8B (S17) only because we will discuss this
particular reaction later in this paper. This reaction is suppressed rather strongly by the
Coulomb potential between the 7Be and proton. It is this fact that no significant abundance
of heavier elements is produced during primordial nucleosynthesis. The time required to
form such elements is too long compared with the 350 second epoch of nucleosynthesis in
the early universe.
Table 2: BBN 7Li Sensitivities to the top 15 reaction rates and other parameters, given interms of the logarithmic derivatives of the predicted 7Li abundance with respect to eachrate or parameter. 7Li/7Li0 =
∏
i Rαi
i , where Ri represents a reaction or parameter, relativeto its fiducial value. The reaction 7Be(p, γ)8B is completely negligible, with its logarithmicderivative about α17 ∼ −10−6.
Reaction/Parameter sensitivities (αi)η10/6.14 +2.04n(p, γ)d +1.31
3He(α, γ)7Be +0.953He(d, p)4He −0.78d(d, n)3He +0.72
7Be(n, p)7Li −0.71Newton’s GN −0.66
d(p, γ)3He +0.54n-decay +0.49
Nν,eff/3.0 −0.263He(n, p)t −0.25d(d, p)t +0.078
7Li(p, α)4He −0.072t(α, γ)7Li +0.040t(d, n)4He −0.034t(p, γ)4He +0.019
7Be(n, α)4He −0.0147Be(d, p)24He −0.0087
The question of interest to us here, is which of these reactions can be altered to enhance or
2The S-factor is defined by the cross section: S(E) = σ(E)E exp(8π2αZ1Z2/v). The last term is theCoulomb penetration factor, in which Zi are the charges of the incoming nuclei and v their relative velocity.
6
BBN Li sensitivites7Li/7Li0 = ΠiR
αi
i
Key Rates:3He (α,γ) 7Be

diminish the 7Be (7Li) abundance and be consistent with observational constraints. We wish
to choose a reaction for which 7Li has a large sensitivity, as well as large enough uncertainties
to question its absolute normalization. The 3He(α, γ)7Be reaction meets this criteria, both
strongly influencing the 7Li prediction and having large enough uncertainties in the nuclear
data to let its absolute normalization float.
The determination of the BBN light element yields is from [7], where new normaliza-
tions and errors to the NACRE [25] rates important for primordial nucleosynthesis have
been assigned. For 3He(α, γ)7Be, the BBN calculation uses the renormalized NACRE rate
SOLD34 (0) = 0.504 ± 0.0534 keV b. Other compilations yield higher values, with the original
NACRE value SNAC34 (0) = 0.54±0.09 keV b [25] and the Adelberger SADL
34 (0) = 0.53±0.05keV
b [24]. One can see that these compilations will yield 7Li values about 7% larger than [7],
if the S(E) shapes are assumed to be the same. Given this reaction, we now address how
much this reaction must change to meet concordance with the light element observations. As
discussed above, there are two sets of 7Li observations we can try to match by renormalizing
the 3He(α, γ)7Be reaction. Using the 7Li measurements of a metal poor globular cluster [35]
would require a change of
SNEW34 (0) = 0.267 keVb
∆S34
S34= −0.47
globular cluster Li (3)
Using the 7Li measurements of metal poor stars in the Galactic halo [29] would require a
change ofSNEW
34 (0) = 0.136 keVb∆S34
S34= −0.73
halo star Li (4)
As one can see, shifts in the 3He(α, γ)7Be cross section as large as that necessary to produce
SNEW34 (0) are strongly excluded given the cited uncertainties for this reaction. Although ad-
justments in the nuclear cross-sections of this size are unlikely given the stated experimental
errors, one could worry that additional systematic effects are present, particularly given the
difficulties in establishing the absolute normalization for this reaction. As stated in the In-
troduction, these rates in particular can be bounded by another means. In the next section,
we will determine the maximum possible downward adjustment to S34 which is consistent
with solar neutrino fluxes.
The effect of changing the yields of certain BBN reactions was recently considered by
Coc et al. [27]. In particular, they concentrated on the set of cross sections which affect 7Li
and are poorly determined both experimentally and theoretically. In many cases however,
the required change in cross section far exceeded any reasonable uncertainty. Nevertheless,
it may be possible that certain cross sections have been poorly determined. In [27], it was
7
Require:
or

CFO
Table 4: Shown are the constraints placed on S34 using reaction rates from various sources.Column 1 lists the adopted S17 constraint used, while Columns 2 and 3 show the compilationused for the S11 and S33 reaction rates. The S34 numbers cited are the most likely valuesand their 68% (95%) confidence intervals.
Adopted S17 (eV b) Adelberger-based [24] NACRE-based [25]
Adelberger [24]
S17 = 19.0+4.0−2.0 S34 = 0.51+0.15 (0.34)
−0.12 (0.21) N.A.
NACRE [25]
S17 = 21.0 ± 2.31 N.A. S34 = 0.51+0.17 (0.38)−0.12 (0.22)
Junghans [43]
S17 = 21.4 ± 0.5(expt) ± 0.6(theor) S34 = 0.48+0.10 (0.23)−0.08 (0.15) S34 = 0.49+0.14 (0.30)
−0.11 (0.19)
Davids [44]
S17 = 18.6 ± 0.4(expt) ± 1.1(extrp) S34 = 0.57+0.13 (0.30)−0.11 (0.19) S34 = 0.59+0.17 (0.39)
−0.13 (0.24)
systematic errors in the normalization of S34, in an attempt to fix the BBN 7Li problem, we
will adopt various experimentally-determined values of S17 to place constraints on S34. Once
a value of S17 is adopted, we convolve the x likelihood distribution with the experimental
S17 distribution to get our S34 likelihood.
Besides using the Adelberger and NACRE rate compilations for S17, we also use two
more recent determinations. We use the recommended values from Junghans et al. [43], and
Davids and Typel [44]. The Junghans quoted value, S17 = 21.4 ± 0.5(expt) ± 0.6(theor)
eV b, is based on several direct capture data sets. The Davids and Typel value, S17 =
18.6±0.4(expt)±1.1(extrp) eV b, is based on both direct capture and Coulomb dissociation
measurements, excluding the Junghans data set because it is systematically higher than the
other data sets. Had the Junghans data been used, the value of S17 would lie between the
two cited values. We will adopt the cited numbers, keeping in mind that the difference in
their values are a measure of this systematic difference.
Our constraints in Table 4 are based on the likelihood functions in figure 3. We find that,
S34 > 0.35 keV barn (20)
at 95% CL for the case of the NACRE S17 value. Other choices give slightly higher limits,
e.g., Adelberger with the Davids S17 gives S34 > 0.42 keV barn.
As shown in Table 2, these limits on S34 place essentially identical limits to 7Li produc-
tion in BBN. One way to illustrate this is to fix the reaction normalization to its 95%CL
limit of S34 = 0.35 keV barn, and then to propagate the other nuclear uncertainties in the
16
at 95% CL
NeededS34 < 0.27 or 0.14 keV bn
Constraints from solar ν’s

Cyburt and Wands
New 3He(α,γ)7Be measurements

17% increase in S⇒ 16% increase in Li

In addition, 1.5% increase in η,leads to 3% increase in Li (Li ~ η2.12)plus another ~1%from pn
Net change in Li:4.26 x 10⁻¹⁰ to 5.24 x 10⁻¹⁰ or 23%
Cyburt, Fields, KAO

Possible sources for the discrepancy
• Nuclear Rates
- Restricted by solar neutrino flux
• Stellar Depletion- lack of dispersion in the data, 6Li abundance- standard models (< .05 dex), models (0.2 - 0.4 dex)
Coc et al.Cyburt, Fields, KAO
Vauclaire & CharbonnelPinsonneault et al.
Richard, Michaud, RicherKorn et al.

Nature 442, 657-659 (10 August 2006) 3
5.0
5.2
5.4
5.6
5.8
lo
g N
Fe
/ N
H +
12
Fe
6500 6000 5500 5000 effective temperature Teff [K]
0.5
1.0
1.5
2.0
2.5
3.0
lo
g N
Li /
NH +
12
Li
CMB+BBN
Figure 1: Trends of iron and lithium as a function of the effective temperatures of the observed stars compared to themodel predictions. The grey crosses are the individual measurements, while the bullets are the group averages. The solidlines are the predictions of the diffusion model, with the original abundance given by the dashed line. In b, the grey-shadedarea around the dotted line indicates the 1σ confidence interval of CMB + BBN1: log[ε(Li)] = log (NLi/NH) + 12 = 2.64 ±
0.03. In a, iron is treated in non-equilibrium20 (non-LTE), while in b, the equilibrium (LTE) lithium abundances are plotted,because the combined effect of 3D and non-LTE corrections was found to be very small29. For iron, the error bars are theline-to-line scatter of Fe I and Fe II (propagated into the mean for the group averages), whereas for the absolute lithiumabundances 0.10 is adopted. The 1σ confidence interval around the inferred primordial lithium abundance (log[ε(Li)] =2.54 ± 0.10) is indicated by the light-grey area.We attribute the modelling shortcomings with respect to lithium in thebRGB and RGB stars to the known need for extra mixing30, which is not considered in the diffusion model.
Stellar Depletion in the Turbulence Model of Korn et al.
Note new BBN Li result pushes primordial value up from 2.63 to 2.72

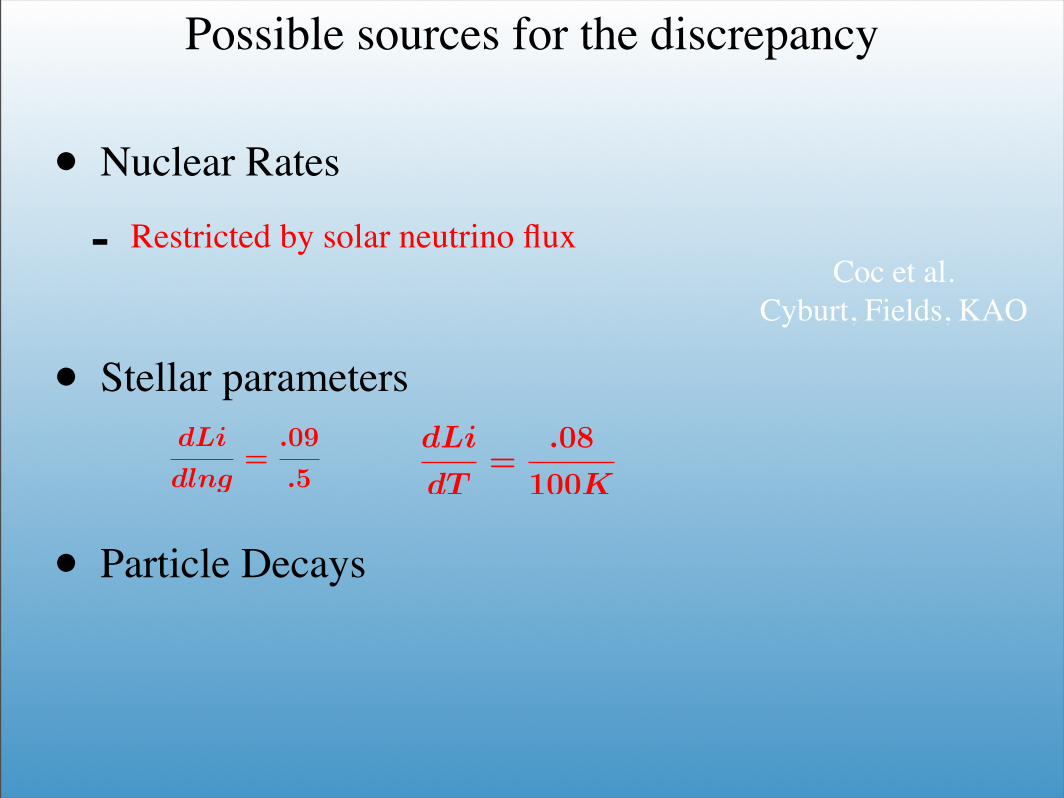
Possible sources for the discrepancy
• Nuclear Rates
- Restricted by solar neutrino flux
• Stellar Depletion- lack of dispersion in the data, 6Li abundance- standard models (< .05 dex), models (0.2 - 0.4 dex)
• Stellar parameters
dLi
dlng=
.09
.5
dLi
dT=
.08
100K
Coc et al.Cyburt, Fields, KAO
Vauclaire & CharbonnelPinsonneault et al.
Richard, Michaud, Richer
arX
iv:a
stro
-ph
/04
09
38
3 v
1
15
Sep
20
04
Submitted to the The Astrophysical Journal
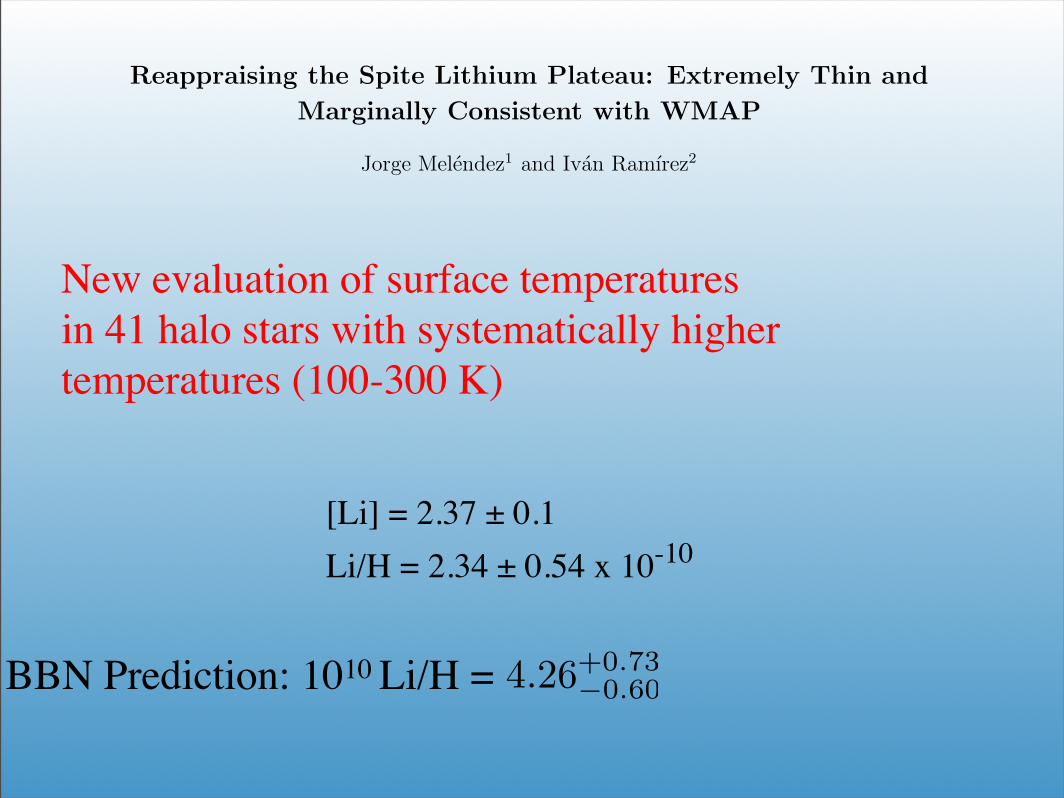
Reappraising the Spite Lithium Plateau: Extremely Thin and
Marginally Consistent with WMAP
Jorge Melendez1 and Ivan Ramırez2
ABSTRACT
The lithium abundance in 62 halo dwarfs is determined from accurate equiv-
alent widths reported in the literature and an improved infrared flux method(IRFM) temperature scale. The Li abundance of 41 plateau stars (those with
Teff > 6000 K) is found to be independent of temperature and metallicity, witha star-to-star scatter of only 0.06 dex over a broad range of temperatures (6000K < Teff < 6800 K) and metallicities (−3.4 < [Fe/H] < −1), thus imposing
stringent constraints on depletion by mixing and production by Galactic chemi-cal evolution. We find a mean Li plateau abundance of ALi = 2.37 dex (7Li/H
= 2.34 ×10⁻¹⁰), which, considering errors of the order of 0.1 dex in the absoluteabundance scale, is just in borderline agreement with the constraints imposed
by the theory of primordial nucleosynthesis and WMAP data (2.51 < AWMAPLi <
2.66 dex).
Subject headings: cosmology: observations - stars: abundances - stars: Popula-tion II
1. Introduction
The Li plateau was discovered by Spite & Spite (1982), who showed that the 7Li abun-dance obtained from the Li doublet at 6708 A in F and early G halo dwarfs is independent
of temperature and metallicity, suggesting that the Li abundance determined in halo starsrepresents the primordial abundance from Big Bang nucleosynthesis (BBN). The standard
1Department of Astronomy, Caltech, M/C 105-24, 1200 E. California Blvd, Pasadena, CA 91125;[email protected]
2Department of Astronomy, University of Texas at Austin, RLM 15.306, TX 78712-1083;[email protected]
New evaluation of surface temperaturesin 41 halo stars with systematically highertemperatures (100-300 K)
[Li] = 2.37 ± 0.1Li/H = 2.34 ± 0.54 x 10⁻¹⁰
BBN Prediction: 1010 Li/H = 4.26+0.73−0.60

– 11 –
Fig. 2.— Temperatures obtained in this work minus the temperatures from R01 (for starsin common with the present sample) as a function of the metallicities adopted in the present
work. Filled circles: plateau stars (Teff > 6000 K); open circles: stars with Teff < 6000 K.

Recent dedicated temperature determinations(excitation energy technique)
Hosford, Ryan, Garcia-Perez, Norris, Olive
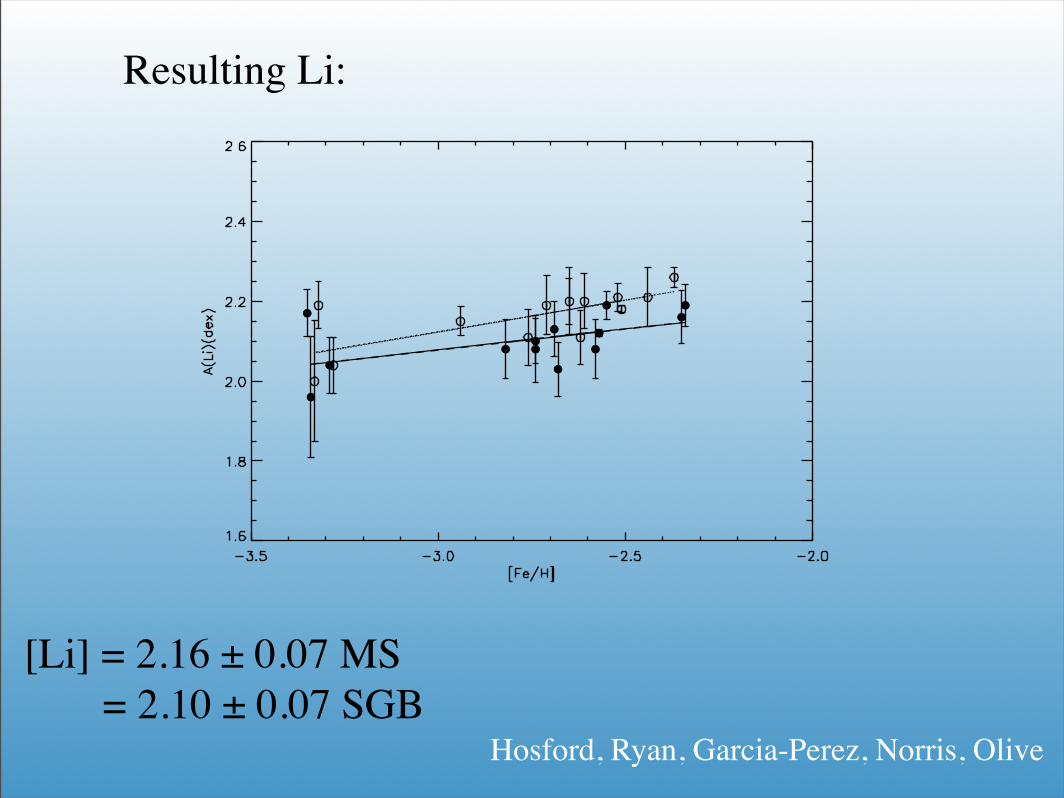
Resulting Li:
Hosford, Ryan, Garcia-Perez, Norris, Olive
[Li] = 2.16 ± 0.07 MS = 2.10 ± 0.07 SGB
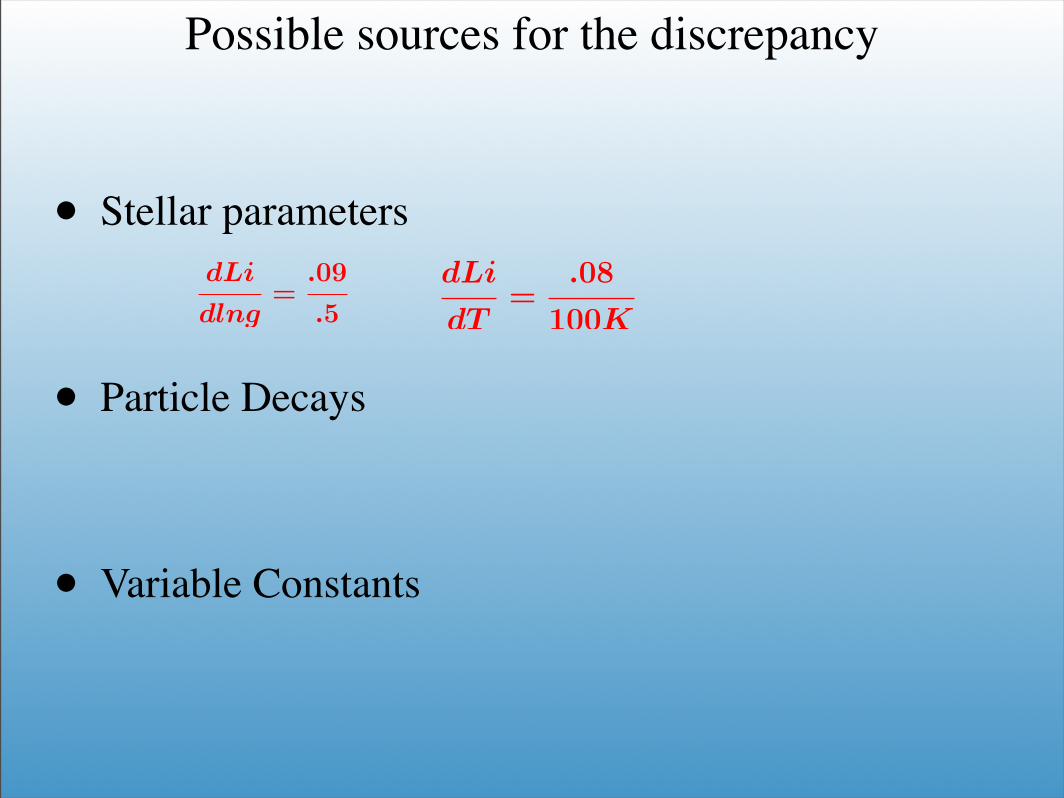
Possible sources for the discrepancy
• Nuclear Rates
- Restricted by solar neutrino flux
• Stellar parameters
• Particle Decays
dLi
dlng=
.09
.5
dLi
dT=
.08
100K
Coc et al.Cyburt, Fields, KAO

Solution 1: Particle Decays4
3e-05
D/H
1e-10
7Li/H
1e-02
0.1
1
10
102
103
104
105
106
! (sec)
6Li/
7Li
FIG. 2: Abundance yields of D/H, 7Li/H, and 7Li/6Li inan Ωbh
2 = 0.026 Universe as function of the hadronic de-cay time τ of a putative primordial relic. The models aredecay of a mχ = 10GeV particle (long-dashed), decay of amχ = 200GeV particle (solid), decay of a mχ = 4TeV par-ticle (dashed-dotted), injection of monoenergetic nucleons ofEkin = 250 MeV (short-dashed), and extended power-law in-jection due to a mχ = 200 GeV particle (dotted). Also shownare the two-sigma ranges of the inferred primordial D/H and7Li/H abundances [3, 10] as well as the 6Li/7Li ratio as in-ferred in the low-metallicity star HD84937 [25]. See text forfurther details.
scatterings an interconversion of protons to neutrons oc-curs frequently, such that energetic protons produce sec-ondary neutrons. For example, though the decay of a200 GeV particle generates only about ≈ 1 neutron perannihilation, around ≈ 1, 0.6 secondary neutrons resultat T ≈ 20, 40 keV, respectively [39], and ≈ 3.5 asymptot-ically at low temperatures T ∼ 0.1−1 keV. Here at highertemperatures the number of secondary neutrons reducesdue to the rapid Coulomb losses of protons. Neutrons,on the other hand, do not possess a significant bias to-wards producing secondary neutrons in np inelastic inter-
actions. Excess neutrons at T ≈ 40 keV are mostly dueto inelastic processes on 4He, accompanied by the pro-duction of D and 3He (i.e. n+4He → D+p+2n, ...), witha comparatively smaller amount of neutrons removed inpionic fusion processes (i.e. np → Dπ0, ...). One thusobtains approximately a ratio n/D≈ 3.6 for a 200 GeVparticle at T ≈ 40 keV, with similar ratios for n/3H andn/3He. As the 3H and 3He are energetic they may yieldthe production of 6Li. Nevertheless, 6Li production (andsurvival) may only be efficient at somewhat lower temper-atures. Due to Coulomb losses of energetic 3H and 3Heproduction is only efficient at T <
∼ 20 keV, whereas sur-vival of the freshly synthesized 6Li against destruction via6Li(p, α)3He is only nearly complete for T <
∼ 10 keV. Theproduction of 6Li at temperatures T ≈ 10− 20 keV for a200 GeV particle is found to be approximately 2 × 10⁻⁴
per decaying particle, becoming significantly lower atlower temperatures (e.g. 3×10⁻⁵ at T ≈ 1 keV). Cascadeyields are subject to some nuclear physics data uncertain-ties which in the case of 6Li may be of the order of a factortwo. In particular, it may be that 6Li yields are under-estimated due to an experimentally incomplete determi-nation of the high-energy tail of the energy distributionof energetic 3H and 3He produced in 4He spallation.
The developed code allows me to present detailed pre-dictions on the BBN in the presence of decaying parti-cles. Figure 2 shows the light-element yields for a varietyof decaying particles as a function of particle life timeτ . The panels show, from top-to-bottom, final abun-dances of D/H, 7Li/H, and 6Li/7Li, with the understand-ing that Yp is virtually unchanged when compared toSBBN at the same Ωbh2. In all models Ωbh2= 0.026has been assumed. Hadronically decaying particle yields(with the simplifying assumption that χ → qq yields theproduction of a pair of quarks, the up-quark for definit-ness) are shown for three particle masses: mχ = 10 GeVwith Ωχh2 = 7.5 × 10⁻⁵ (long-dashed), mχ = 200 GeVwith Ωχh2 = 1 × 10⁻⁴ (solid), and mχ = 4 TeV [40]with Ωχh2 = 6 × 10⁻⁴ (dashed-dotted). It is evidentthat for decay times around τ ≈ 103s an efficient de-struction of 7Li is obtained. For τ much shorter than103s the destroyed 7Be is regenerated, whereas for τmuch longer, incomplete 7Li burning in the reaction chain7Be(n, p)7Li(p, α)4He results in only partial reduction ofthe total 7Li yield. As anticipated, the destruction of 7Liis accompanied by production of D. When compared tothe injection of thermal neutrons, D/H yields are higher.This is due to D generated in the nuclear cascade it-self (i.e. by 4He spallation and pionic fusion). Cascadegenerated deuterium (as well as 3H, 3He, and 6Li) is sub-stantially reduced per injected neutron for sources whichinject nucleons with a soft spectrum. For example, I havealso employed a soft source with monoenergetic nucleonsof 250 MeV. Results for this case are shown by the short-dashed line, assuming Ωχh2/mχ ≈ 7.5×10⁻⁷GeV−1 andthe injection of one np pair per decay [41]. A cascaden/D≈ 10 ratio at T ≈ 40 keV is obtained in such scenar-ios. The more pronounced depth of the 7Li dip in Fig.
Jedamzik
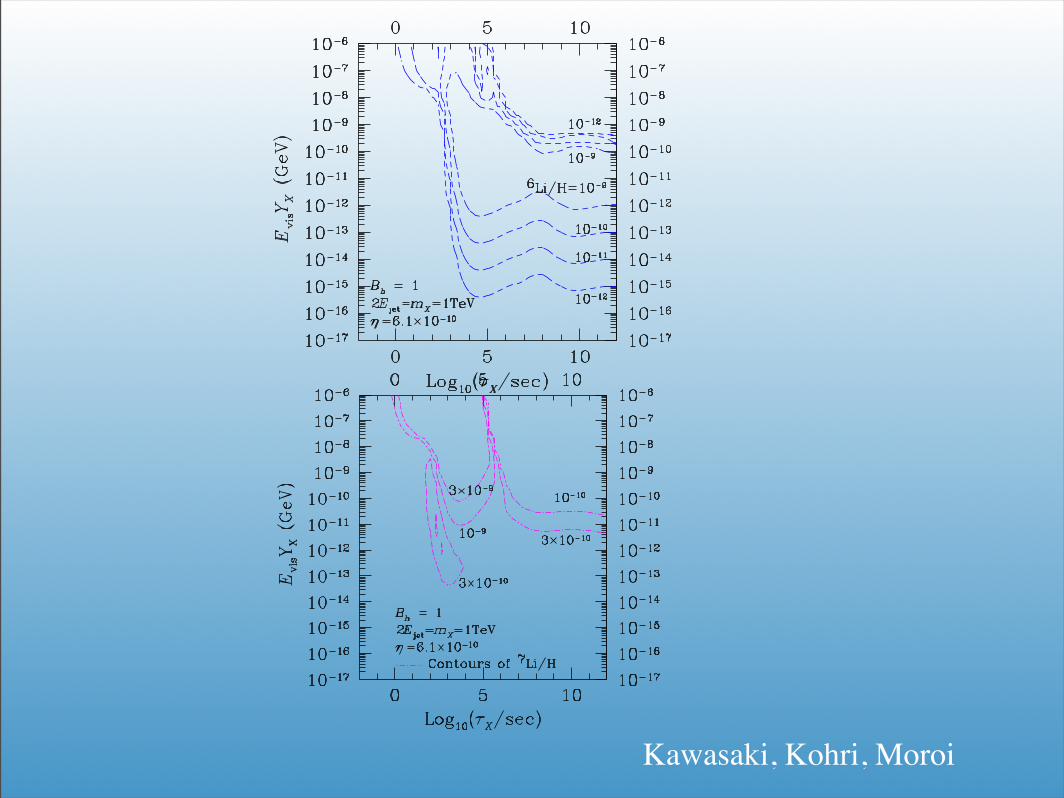
Figure 35: Contours of constant 6Li/H. Cosmological and model parameters are the sameas Fig. 32. In the SBBN, the theoreical predication is (6Li/H)SBBN = 1.30 × 10⁻¹⁴.
Figure 36: Contours of constant 7Li/H. Cosmological and model parameters are the sameas Fig. 32. In the SBBN, the theoreical predication of the abundance is (7Li/H)SBBN =3.81 × 10⁻¹⁰.
57
Kawasaki, Kohri, Moroi

Effects of Bound States
2
bound st. |E0b | a0 Rsc
N |Eb(RscN )| RNc |Eb(RNc)| T0
4HeX− 397 3.63 1.94 352 2.16 346 8.26LiX− 1343 1.61 2.22 930 3.29 780 197LiX− 1566 1.38 2.33 990 3.09 870 217BeX− 2787 1.03 2.33 1540 3 1350 328BeX− 3178 0.91 2.44 1600 3 1430 34
4HeX−− 1589 1.81 1.94 1200 2.16 1150 28
DX− 50 14 - 49 2.13 49 1.2
pX− 25 29 - 25 0.85 25 0.6
TABLE I: Properties of the bound states: Bohr a0 and nuclearradii RN in fm; binding energies Eb and “photo-dissociationdecoupling” temperatures T0 in KeV.
E0b = Z2α2mN/2 from ∼ 13% in (4HeX) to 50% in
(8BeX). Realistic binding energies are calculated for twotypes of nuclear radii assuming a uniform charge distri-bution: for the simplest scaling formula Rsc
N = 1.22A1
3 ,and for the nuclear radius determined via the the rootmean square charge radius, RNc = (5/3)1/3Rc with ex-perimental input for Rc where available. Finally, as anindication of the temperature at which (NX) are nolonger ionized, we include a scale T0 where the photo-dissociation rate Γph(T ) becomes smaller than the Hub-ble rate, Γph(T0) = H(T0). It is remarkable that sta-ble bound states of (8BeX) exist, opening up a path tosynthesize heavier elements such as carbon, which is notproduced in SBBN. In addition to atomic states, thereexist molecular bound states (NXX). The binding en-ergy of such molecules relative to (NX) are not small(e.g. about 300 KeV for (4HeX−X−)). Such neutralmolecules, along with (8BeX) and (8BeXX), are an im-portant path for the synthesis of heavier elements inCBBN. Table 1 also includes the case of doubly-chargedparticles, admittedly a much more exotic possibility fromthe model-building perspective, which was recently dis-cussed in [8] where the existence of cosmologically sta-ble bound states (4HeX−−) was suggested in connectionwith the dark matter problem. Although noted in pass-ing, the change in the BBN reaction rates was not ana-lyzed in [8]. Yet it should be important for this model, asany significant amount of stable X−− would lead to a fastconversion of 4He to carbon and build-up of (8BeX−−)at T ∼ 20 KeV, possibly ruling out such a scenario. Ref.[8] also contains some discussion of stable (4HeX−).
The initial abundance of X− particles relative tobaryons, YX(t " τ) ≡ nX−/nb, along with their life-time τ are the input parameters of CBBN. It is safe toassume that YX " 1, and to first approximation neglectthe binding of X− to elements such as Be, Li, D, and3He, as they exist only in small quantities. The bindingto p occurs very late (T0 = 0.6 KeV) and if nX− " n4He,which is the case for most applications, by that tempera-ture all X− particles would exist in the bound state with4He. Therefore, the effects of binding to p can be safely
ignored. For the concentration of bound states (4HeX),nBS(T ), we take the Saha-type formula,
nBS(T ) =nb(T )YX exp(−T 2
τ /T 2)
1 + n−1He (mαT )
3
2 (2π)−3
2 exp(−Eb/T )(3)
%nb(T )YX exp(−T 2
τ /T 2)
1 + T−3
2 exp(45.34 − 350/T ),
where we used temperature in KeV and nHe % 0.93 ×10⁻¹¹T 3. One can check that the recombination rateof X− and 4He is somewhat larger than the Hubblescale, which justifies the use of (3). The border-linetemperature when half of X− is in bound states is8.3 KeV. Finally, the exponential factor in the numer-ator of (3) accounts for the decay of X−, and the con-stant Tτ is determined from the Hubble rate and τ :Tτ = T (2τH(T ))−1/2.
Li6
He4He
4Li6
D ! D
X!X( !)
FIG. 1: SBBN and CBBN mechanisms for producing 6Li.
Photonless production of 6Li. The standard mecha-nism for 6Li production in SBBN is “accidentally” sup-pressed. The D-4He cluster description gives a goodapproximation to this process, and the reaction rateof (1) is dominated by the E2 amplitude because theE1 amplitude nearly vanishes due to an (almost) iden-tical charge to mass ratio for D and 4He. In the E2transition, the quadrupole moment of D-4He interactswith the gradient of the external electromagnetic field,Vint = Qij∇iEj . Consequently, the cross section at BBNenergies scales as the inverse fifth power of photon wave-length λ = ω−1 ∼ 130 fm, which is significantly largerthan the nuclear distances that saturate the matrix ele-ment of Qij , leading to strong suppression of (1) relativeto other BBN cross sections [10]. For the CBBN pro-cess (2) the real photon in the final state is replaced bya virtual photon with a characteristic wavelength on theorder of the Bohr radius in (4HeX−). Correspondingly,one expects the enhancement factor in the ratio of CBBNto SBBN cross sections to scale as (a0ω)−5 ∼ 5×10⁷. Fig-ure 1 presents a schematic depiction of both processes.It is helpful that in the limit of RN " a0, we can ap-ply factorization, calculate the effective ∇iEj created byX−, and relate SBBN and CBBN cross sections with-out explicitly calculating the 〈D4He|Qij |6Li〉 matrix el-ement. A straightforward quantum-mechanical calcula-tion with ∇iEj averaged over the Hydrogen-like initialstate of (4HeX) and the plane wave of 6Li in the finalstate leads to the following relation between the astro-physical S-factors at low energy:
SCBBN = SSBBN ×8
3π2
pfa0
(ωa0)5
(
1 +mD
m4He
)2
. (4)
• In SUSY models with a τ NLSP, bound states form between 4He and τ
•The 4He (D, γ) 6Li reaction is normally highly suppressed (production of low energy γ)
•Bound state reaction is not suppressed
~~
Pospelov

CMSSM
100 200 300 400 500 600 700 800 900 1000
0
100
200
300
400
500
600
700
800
100 200 300 400 500 600 700 800 900 1000
0
100
200
300
400
500
600
700
800
mh = 114 GeV
m0 (
GeV
)
m1/2 (GeV)
tan β = 10 , µ > 0
mχ± = 104 GeV
EOSS
100 1000 2000 3000
0
1000
1500
100 1000 2000 3000
0
1000
1500
mh = 114 GeV
m0 (
GeV
)
m1/2 (GeV)
tan β = 50 , µ > 0

Cyburt, Ellis, Fields, KO, Spanos
100 1000 2000 3000 4000 5000
0
1000
2000
100 1000 2000 3000 4000 5000
0
1000
2000
4.0D = 4.02.2
3He/D = 17
Li = 4.3
6Li/7
Li = 0.15 0.01
0.15
m0 (
GeV
)
m1/2 (GeV)
m3/2 = 100 GeV , tan ! = 10 , µ > 0
100 1000 2000 3000 4000 5000
0
1000
2000
100 1000 2000 3000 4000 5000
0
1000
2000
3He/D = 1
7Li = 4.3
6Li/7
Li = 0.15 0.01
4.0D = 4.02.2
m0 (
GeV
)
m1/2 (GeV)
m3/2 = 100 GeV , tan ! = 10 , µ > 0
4.3
100 1000 2000 3000 4000 5000
0
1000
2000
100 1000 2000 3000 4000 5000
0
1000
2000
D = 4.0
3He/D = 1
7Li = 4.3 6
Li/7Li = 0.15
0.01m0 (
GeV
)
m1/2 (GeV)
m3/2 = 0.2m0 , tan ! = 10 , µ > 0
100 1000 2000 3000 4000 5000
0
1000
2000
1
100 1000 2000 3000 4000 5000
0
1000
2000
D = 4.0
3He/D = 1
7Li = 4.3
6Li/7
Li = 0.150.01
m0 (
GeV
)
m1/2 (GeV)
m3/2 = 0.2m0 , tan ! = 10 , µ > 0
Figure 2: Some (m1/2, m0) planes for A0 = 0, µ > 0 and tanβ = 10. In the upper (lower)panels we use m3/2 = 100 GeV (m3/2 = 0.2 m0). In the right panels the effects of the staubound states have been included, while in those on the left we include only the effect of theNSP decays. The regions to the left of the solid black lines are not considered, since therethe gravitino is not the LSP. In the orange (light) shaded regions, the differences betweenthe calculated and observed light-element abundances are no greater than in standard BBNwithout late particle decays. In the pink (dark) shaded region in panel d, the abundances liewithin the ranges favoured by observation, as described in the text. The significances of theother lines and contours are explained in the text.
12
Possible sources for the discrepancy
• Stellar parameters
• Particle Decays
• Variable Constants
dLi
dlng=
.09
.5
dLi
dT=
.08
100K
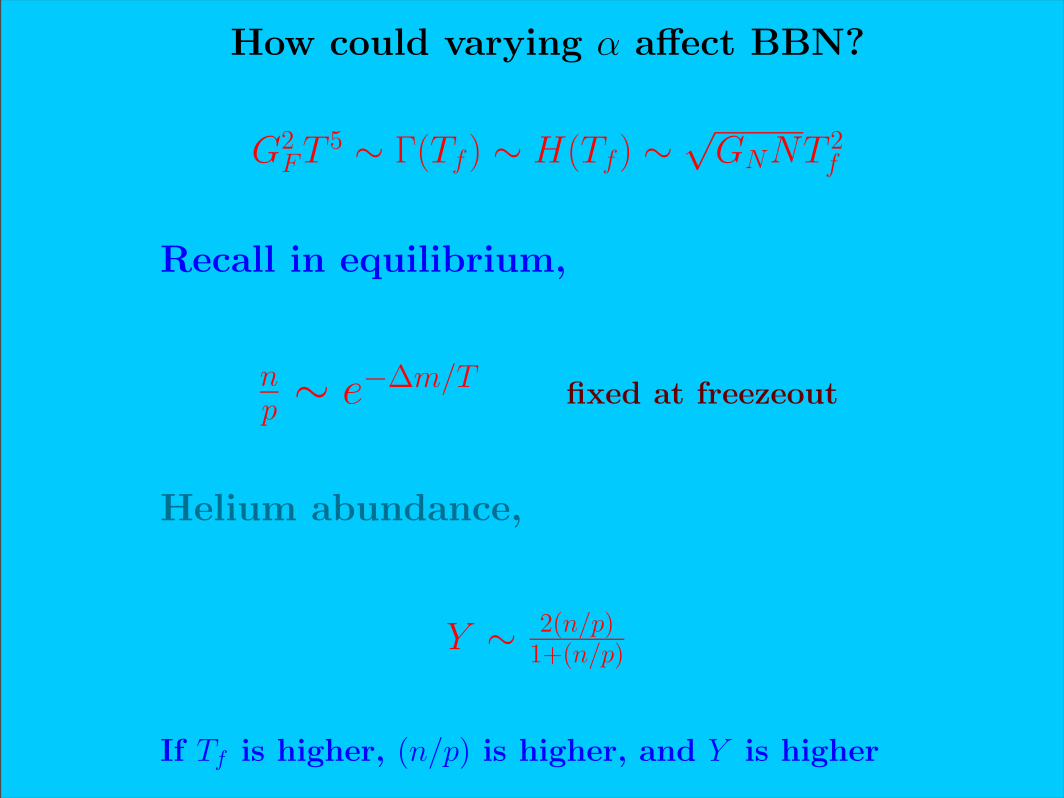
How could varying α affect BBN?
G2FT 5 ∼ Γ(Tf) ∼ H(Tf) ∼
√GNNT 2
f
Recall in equilibrium,
np ∼ e−∆m/T fixed at freezeout
Helium abundance,
Y ∼ 2(n/p)1+(n/p)
If Tf is higher, (n/p) is higher, and Y is higher
1
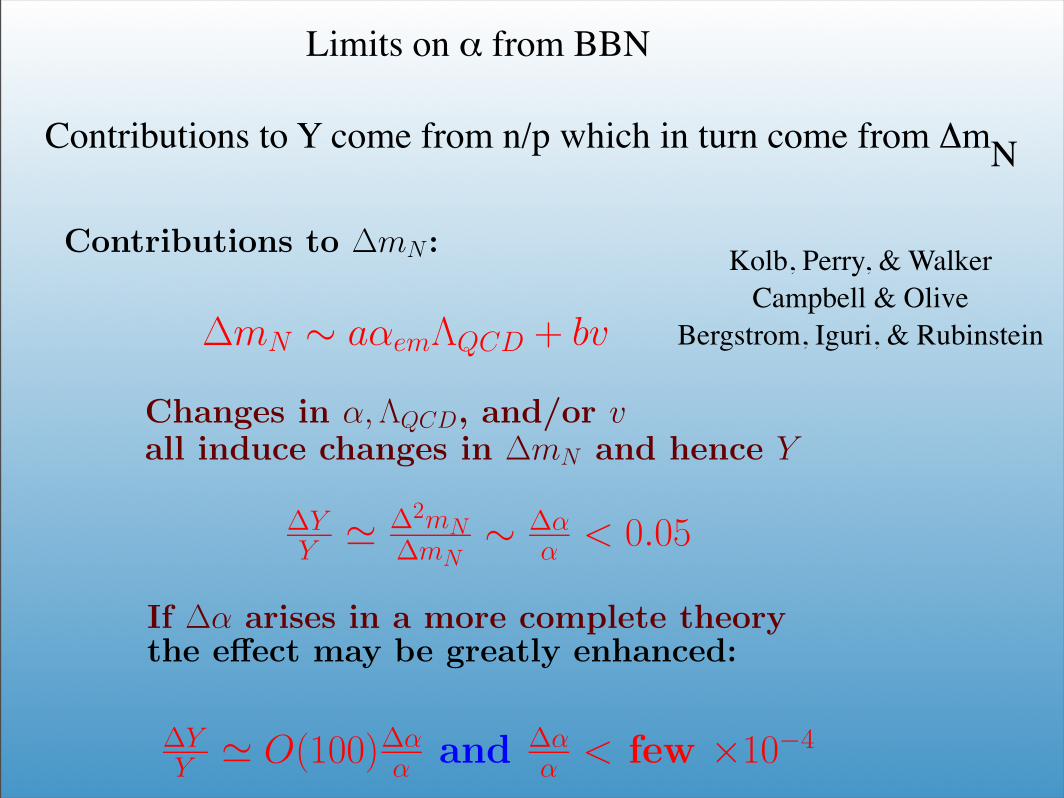
Contributions to Y come from n/p which in turn come from ΔmN
Limits:
∆YY
<∼±0.0120.24 = ±0.05
∆(n/p)(n/p) " ∆mN
Tf(∆TfTf
− ∆2mN∆mN
)
If the dominant contribution from ∆αis in ∆mN then:
∆YY " ∆2mN
∆mN∼ ∆α
α < 0.05
If ∆α arises in a more complete theorythe effect may be greatly enhanced:
∆YY " O(100)∆α
α and ∆αα < few ×10−4
Contributions to ∆Y : Kolb, Perry, and Walker
Campbell and Olive
Bergstrom, Iguri, and Rubenstein
∆YY ! 1
1+n/p∆(n/p)(n/p)
∆(n/p)(n/p) ! ∆mN
Tf(∆TfTf
− ∆2mN∆mN
)
Contributions to ∆mN :
∆mN ∼ aαemΛQCD + bv
electromagnetic weak-0.8 MeV 2.1 MeV
Changes in α, ΛQCD, and/or vall induce changes in ∆mN and hence Y
Kolb, Perry, & WalkerCampbell & Olive
Bergstrom, Iguri, & Rubinstein
Limits on α from BBN
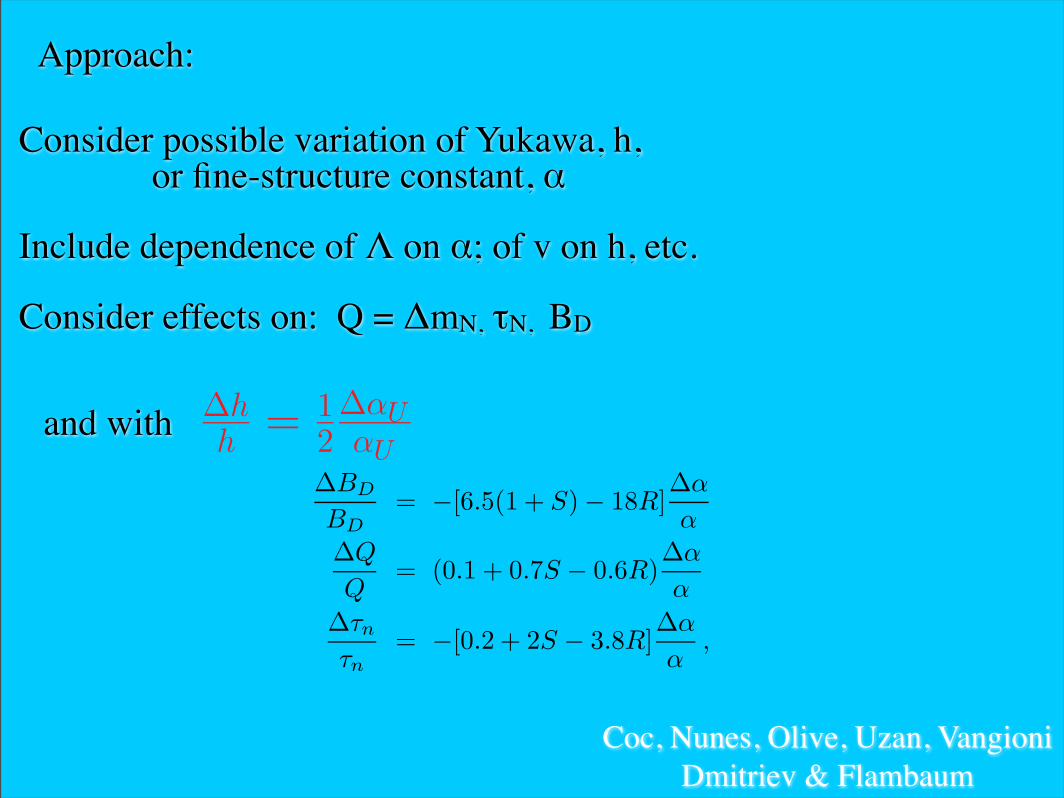
Approach:
Consider possible variation of Yukawa, h, or fine-structure constant, α
Include dependence of Λ on α; of v on h, etc.
Consider effects on: Q = ΔmN, τN, BD
Coc, Nunes, Olive, Uzan, VangioniDmitriev & Flambaum
and with
Also expect variations in Yukawas,
∆hh = 1
2∆αUαU
But in theories with radiative electroweaksymmetry breaking
v ∼ MP exp(−2πc/αt)
Thus small changes in htwill induce large changes in v
∆vv ∼ 80∆αU
αU
E.g., predict that:
∆µµ ∼ ∆Λ
Λ − ∆vv ∼ −50∆α
α
or
∆µµ ∼ −3 × 10⁻⁴
8
5
the relation between h, v and Λ is quite robust and hasbeen neglected in most studies discussing the effect ofvarying v (or varying GF ) [30, 31].
For the quantities we are interested in, we now have
∆BD
BD= −13
(
∆v
v+
∆h
h
)
+ 18R∆α
α, (15)
∆Q
Q= 1.5
(
∆v
v+
∆h
h
)
− 0.6(1 + R)∆α
α, (16)
∆τn
τn= −4
∆v
v− 8
∆h
h+ 3.8(1 + R)
∆α
α. (17)
where we have assumed that all Yukawa couplings varyidentically, ∆hi/hi = ∆h/h. For clarity, we have writ-ten only rounded values of the coefficients, however,the numerical computation of the light element abun-dances uses the more precise values. We also recall that∆GF /GF = −2∆v/v and ∆me/me = ∆h/h + ∆v/v.
B. Interrelations between fundamental parameters
Secondly, in all models in which the weak scale is de-termined by dimensional transmutation, changes in thelargest Yukawa coupling, ht, will trigger changes in v [43].In such cases, the Higgs vev is derived from some unifiedmass scale (or the Planck scale) and can be written as(see Ref. [27])
v = MP exp
(
−8π2c
h2t
)
, (18)
where c is a constant of order unity. Indeed, in su-persymmetric models with unification conditions such asthe constrained minimal supersymmetric standard model[57], there is in general a significant amount of sensitiv-ity to the Yukawa couplings and the top quark Yukawain particular. This sensitivity can be quantified by a fine-tuning measure defined by [58]
∆i ≡∂ lnmW
∂ ln ai(19)
where mW is the mass of the W boson and can be sub-stituted with v. The ai are the input parameters of thesupersymmetric model and include ht. In regions of theparameters space which provide a suitable dark mattercandidate [59], the total sensitivity ∆ =
√
∑
i ∆2i typi-
cally ranges from 100 – 400 for which the top quark con-tribution is in the range ∆t = 80− 250. In models wherethe neutralino is more massive, ∆ may surpass 1000 and∆t may be as large as ∼ 500.
Clearly there is a considerable model dependence inthe relation between ∆v and ∆ht. Here we assume arelatively central value obtained from Eq. (18) with c $h0 $ 1. In this case we have
∆v
v= 16π2c
∆h
h3$ 160
∆h
h, (20)
but in light of the model dependence, we will set
∆v
v≡ S
∆h
h, (21)
hence defining S ≡ d ln v/d lnh ∼ ∆t and keeping inmind that S $ 160. It follows that the variations of BD,Q and τn are expressed in the following way
∆BD
BD= −17(S + 1)
∆h
h+ 18
∆Λ
Λ, (22)
∆Q
Q= 1.6(S + 1)
∆h
h− 0.6
(
∆α
α+
∆Λ
Λ
)
, (23)
∆τn
τn=−(8.8 + 4.8S)
∆h
h+3.8
(
∆α
α+
∆Λ
Λ
)
(24)
where we have again assumed common variations in allof the Yukawa couplings. It also follows that ∆GF /GF =−2S∆h/h and ∆me/me = (1 + S)∆h/h.
Now, using the relation (14) we arrive at
∆BD
BD= −13(1 + S)
∆h
h+ 18R
∆α
α(25)
∆Q
Q= 1.5(1 + S)
∆h
h− 0.6(1 + R)
∆α
α, (26)
∆τn
τn= −(8 + 4S)
∆h
h+ 3.8(1 + R)
∆α
α. (27)
Finally we can take into account the possibility thatthe variation of the constants is induced by an evolv-ing dilaton [27]. In this scenario, it was shown that∆h/h = (1/2)∆α/α, therefore the expressions above canbe simplified to
∆BD
BD= −[6.5(1 + S) − 18R]
∆α
α(28)
∆Q
Q= (0.1 + 0.7S − 0.6R)
∆α
α(29)
∆τn
τn= −[0.2 + 2S − 3.8R]
∆α
α, (30)
though these relations will also be affected by model de-pendent threshold corrections.
C. Sensitivity of BD to the pion mass
An independent calculation suggests a large depen-dence of the binding energy of the deuteron to the pionmass [60] parametrized in Ref. [31], for constant Λ, by
∆BD
BD= −r
∆mπ
mπ, (31)
where r is a fitting parameter found to be between 6and 10. The mass of the pion is given by f2
πm2π = (mu +
md)〈qq〉, where fπ ∝ Λ is a coupling and 〈qq〉 ∝ Λ3 is the

For S = 240, R = 36,
S = 240, R = 0, 36, 60, !"/"=2!h/h
0.22
0.23
0.24
0.25
0.26
Mas
s fra
ctio
n4He
10-53 H
e/H
, D/H
D
3He
10-10
10-9
-0.3 -0.2 -0.1 0 0.1 0.2 0.3x 10 -4
7Li
!h/h
7 Li/H
9
enters as a factor (m−1p + m−1
n )1
2 in the p(n, γ)D rate.For variations of the order we are considering, this effectis negligible.
C. Allowing for ∆α/α != 0
We now allow the fine structure constant to vary andwe further assume that it is tied to the variation of theYukawa couplings according to ∆h/h = (1/2)∆α/α, us-ing Eqs. (28)–(30). The results are shown in Fig. 4 wherethe abundances are depicted for three values of the pa-rameter R. Comparison of this figure with Fig. 2 showsthe effect of including the variation in α. Not consider-ing 7Li, the tighter bounds on ∆h/h are again given bythe deuterium abundance and are comparable in order ofmagnitude to the ones found in Eq. (39):
−1.6 × 10⁻⁵ <∆h
h< 2.1 × 10⁻⁵ , (40)
for R = 36 and
−3 × 10⁻⁵ <∆h
h< 4 × 10⁻⁵ , (41)
for S = 240 and R = 60.While these limits are far more stringent than the one
found in Ref. [25], it is consistent with those derived inRefs. [26, 27] where coupled variations were considered.Once again, for a variation near the upper end of therange (40) and (41), we can simultaneously fit all of theobserved abundances.
As noted above, a variation of α induces a multitudeof changes in nuclear cross sections that have not beenincluded here. We have checked, however, that a varia-tion of ∆α/α ≈ 4 × 10⁻⁵ leads to variations in the reac-tion rates (numerically fit), mainly through the Coulombbarrier, of the most important α-dependent reactions inBBN [25] that never exceed one tenth of a percent inmagnitude.
Before concluding, we return once more to the ques-tion of model dependence. We have parametrized theuncertainty between ∆v and ∆h with the quantity S andthe uncertainty between ∆Λ and ∆α through R. In fullgenerality we ought to include one more unknown, sayT , that parametrizes the relation between ∆α and ∆h,T ≡ d lnh/d lnα [56]. In this work, however, we focusedour investigation in the dilaton model where T = 1/2. Itis now important to evaluate more precisely how sensitiveour results are to the value these parameters may take.In Fig. 5 we illustrate the evolution of the primordialabundances of the light nuclei with S for a fixed value ofthe change in the Yukawa couplings assuming ∆α/α = 0.We clearly see that, in this case, the theoretical 7Li abun-dance is compatible with its observational measurementprovided 200 ! S ! 370 (for the lower range of observa-tional 7Li abundances).
We can also evaluate the impact of changing R in thedilaton model, when we allow a variation in α. To this
S = 240, R = 0, 36, 60, !"/"=2!h/h
0.22
0.23
0.24
0.25
0.26
Mass
fracti
on
4He
10-5
3H
e/H
, D
/H
D
3He
10-10
10-9
-0.3 -0.2 -0.1 0 0.1 0.2 0.3
x 10-4
7Li
!h/h
7L
i/H
FIG. 4: Primordial abundances of 4He, D, 3He and 7Li as afunction of ∆h/h = (1/2)∆α/α when allowing a variation ofthe fine structure constant for three values of the R parameter:R = 0 (red lines), R = 36 (blue lines) and R = 60 (magentalines).
end we show in Fig. 6 the evolution of the primordialabundances for two different values of ∆h/h. We ob-serve that when ∆h/h = 1.5 × 10⁻⁵, we require R = 6.On the other hand, if we take ∆h/h = 2.5 × 10⁻⁵, theabundances are more sensitive to the value of R as theslope of the corresponding curves are steeper, but thereis also a narrow window around R = 45 where all thelight nuclei abundances are compatible with the full ob-servational data.
V. SUMMARY
In this article, we have considered the influence ofa possible variation of the fundamental constants onthe abundances of the light elements synthesized duringBBN. We have focused our attention on three fundamen-
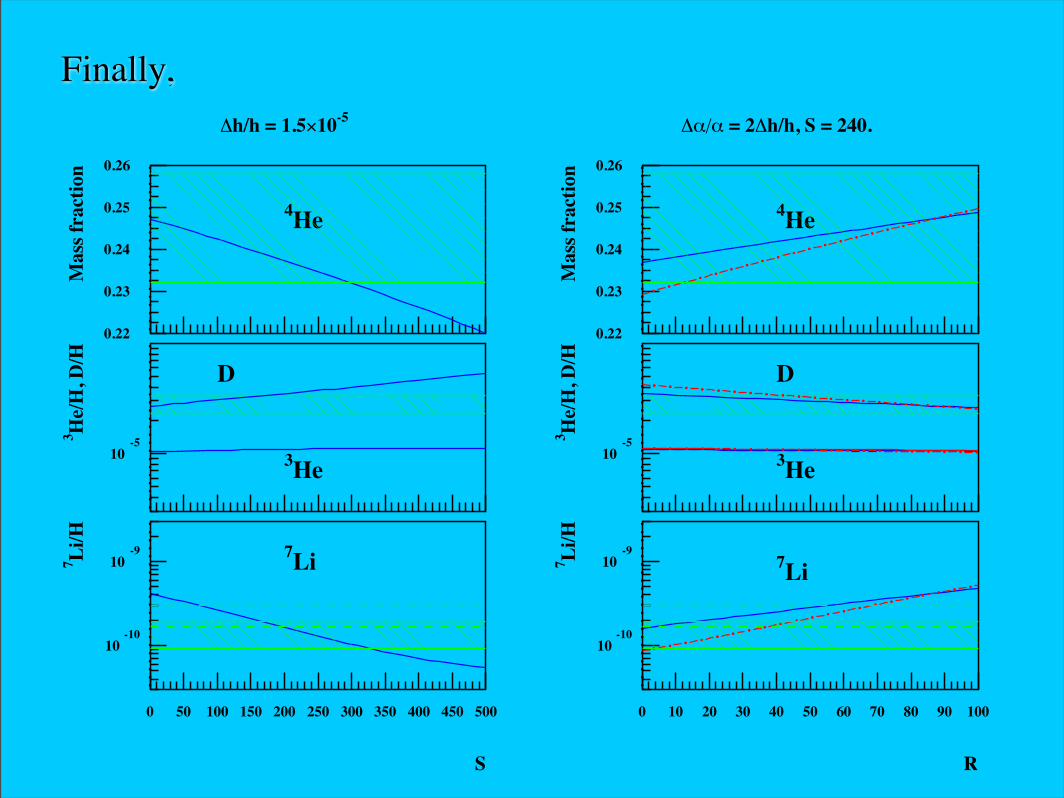
Finally,!h/h = 1.5×10⁻⁵
0.22
0.23
0.24
0.25
0.26
Mas
s fra
ctio
n
4He
10-53 H
e/H
, D/H
D
3He
10-10
10-9
0 50 100 150 200 250 300 350 400 450 500
7Li
S
7 Li/H
!"/" = 2!h/h, S = 240.
0.22
0.23
0.24
0.25
0.26
Mas
s fra
ctio
n
4He
10-53 H
e/H
, D/H
D
3He
10-10
10-9
0 10 20 30 40 50 60 70 80 90 100
7Li
R
7 Li/H
Summary
• D, He are ok -- issues to be resolved
• Li: 2 Problems- BBN 7Li high compared to observations- BBN 6Li low compared to observations
6Li plateau?• Important to consider:- Depletion- Li Systematics - T scale- Particle Decays?- Variable Constants? - PreGalactic production of 6Li (and BeB)