bayt.com career...
TRANSCRIPT

Bayt.com Career Aspirationsin the Middle East and North Africa
December 2014

PROJECT BACKGROUNDSection 1

Objective
§ To understand the challenges and aspirations of MENA professionals. The study covers aspects
such as perceptions and attitudes towards current job, career aspirations, barriers to career
growth, overall work environment and personal aspirations and concerns.
§ This report can be benchmarked against the Career Aspirations report done in November 2013,
to understand the changes in perception over the past year.

Key findings
§ The two factors that are seen as most important for an ideal job are salary & benefits and
opportunities for career growth. Slightly less than half of all respondents believe their current
job is the perfect one for them.
§ Most respondents believe they deserve to work in a higher level position, and half of them are
willing to move to another department/area of expertise to further their careers.
§ The majority of respondents have set professional goals for themselves, which include getting a
higher salary, finding a new job and learning new skills.
§ On a positive note, more than half of all respondents are satisfied with their professional
growth over the past year. Three in five respondents report having a mentor or role model in
their careers.
§ While nearly three-fifths of respondents (58%) report being motivated at work, the top 3
factors to increase motivation further are higher salaries and perks, more opportunities for
employees to showcase creativity/skills, and greater work-life balance.

Key findings
§ The key barriers to professional growth are poor management within the organization and lack
of growth opportunities.
§ Interestingly, the main reason for seeking employment is to consistently learn and gain
experience, followed by making money, being financially independent and contributing to
society.
§ One third of respondents report not being able to save any of their income over the past year,
and one quarter report saving less than 10% of their annual income.
§ Three-quarters of respondents would relocate to another country for employment purposes;
the top destination choice is the UAE, followed by KSA and Qatar.
§ Half of all respondents worry about financial issues in their day-to-day lives, and one third are
uncertain about their career paths or worried about unemployment.
§ 7 out of 10 respondents report saving more money as their personal goal for the upcoming
year. Overall, respondents have a positive outlook on what 2015 will bring.
RESEARCH METHODOLOGYSection 2

Sample Definition
Age and Gender:Adult males and femalesAged 18 plus years
Country of Residence
GCC: UAE, KSA, Kuwait, Oman, Qatar, Bahrain
Levant: Lebanon, Syria, Jordan
North Africa: Egypt, Morocco, Algeria, Tunisia
Data Collection
All data was collected online. Fieldwork was done between December 3rd – 10th 2014. The total number of respondents achieved was 8,963.

RESEARCH FINDINGSSection 3

Employment versus owning business
All figures are %’s
Q. Would you rather be an employee or have your own business?
Base: All respondents (8,963)
• Overall, respondents were almost evenly split between preferring to be an employee (42%) and owning one’s business (39%). Men were slightly more likely to favour having a business (40%) as compared to women (35%).
• Nearly half of all respondents in Levant (49%) preferred having their own business, versus more than a third (36%) of GCC residents and two-fifths (44%) of North African respondents.
• Interestingly, half of all UAE respondents preferred being an employee (49%), and only a third preferred having their own business (29%).
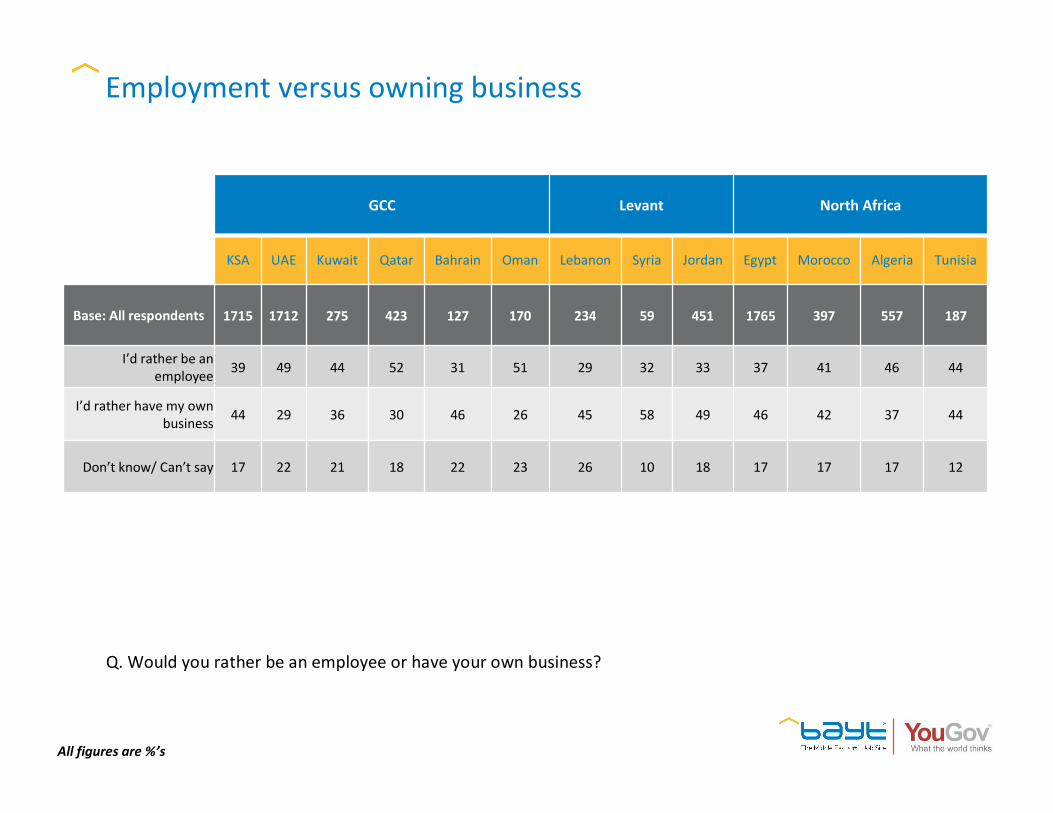
Employment versus owning business
All figures are %’s
Q. Would you rather be an employee or have your own business?
GCC Levant North Africa
KSA UAE Kuwait Qatar Bahrain Oman Lebanon Syria Jordan Egypt Morocco Algeria Tunisia
Base: All respondents 1715 1712 275 423 127 170 234 59 451 1765 397 557 187
I’d rather be an employee 39 49 44 52 31 51 29 32 33 37 41 46 44
I’d rather have my own business 44 29 36 30 46 26 45 58 49 46 42 37 44
Don’t know/ Can’t say 17 22 21 18 22 23 26 10 18 17 17 17 12

Current and preferred industries
All figures are %’s
Q. Which industry do you currently work in?Q. Given the choice, which ONE of the following industries would you want to work in?
• Overall about 1 in 10 (13%) of working respondents currently work in the construction industry. Perhaps unsurprisingly, significantly more respondents in the GCC region (18%) than those in Levant (7%) and North Africa (8%) reported working in construction.
• More males (15%) than females (4%) reported working in the construction industry, while more females (13%) than males (3%) reported working in education.
• Men were more likely to choose oil, gas & petrochemicals as their preferred industry (14%) as compared to women (5%). More women chose education/academia as their preferred industry (13%) as compared to men (4%).
Base: Working respondents (6,800) Base: All respondents (8,963)

Current and preferred industries
All figures are %’s
GCC Levant North Africa
KSA UAE Kuwait Qatar Bahrain Oman Lebanon Syria Jordan Egypt Morocco Algeria Tunisia
Base: Working respondents 1409 1452 236 373 106 145 178 39 310 1290 160 321 109
Q: Which industry do you currently work in?
Construction 21 13 12 29 8 19 7 3 8 8 8 11 1Tourism/ Hospitality 3 13 6 8 8 6 7 - 5 6 5 1 5
Advertising/ Marketing/ Public Relations 5 4 4 4 8 7 10 3 4 7 5 4 4
Banking/ Finance 3 6 7 4 6 3 6 8 7 6 2 5 3Education/ Academia 4 3 3 3 6 3 2 15 11 6 5 9 7
Industrial manufacturing 5 4 2 3 5 4 4 5 5 5 9 3 8IT 5 5 5 5 7 5 10 - 8 6 6 2 6
Medical/ Health Services 7 3 3 2 4 1 6 10 9 4 2 6 5Oil, Gas & Petrochemicals 5 4 8 7 3 13 1 10 3 5 1 11 8
Base: All respondents 1715 1712 275 423 127 170 234 59 451 1765 397 557 187
Q: Given the choice, which ONE of the following industries would you want to work in?Oil, Gas & Petrochemicals 11 11 14 14 8 16 2 8 5 16 3 18 15
Construction 12 7 7 15 6 10 8 8 9 6 4 7 2Advertising/ Marketing/
Public Relations 7 7 8 6 6 8 18 3 6 8 8 6 5Banking/ Finance 7 7 9 8 9 5 12 7 8 8 5 4 9
Education/ Academia 4 5 5 4 3 5 3 14 9 6 8 10 12IT 7 5 9 8 8 5 3 3 8 6 6 3 7
Tourism/ Hospitality 3 8 6 6 8 5 4 - 2 5 7 4 4

Ideal job
All figures are %’s
Q. When selecting your IDEAL JOB, which three factors would be most important to you? (Select only THREE from those listed)
• The two factors that were seen as important in an ideal job were salary & benefits (81%), and opportunities for career growth (59%).
• Interestingly, respondents in North Africa placed greater emphasis on work-life balance (38%) versus those in the GCC (21%) and Levant (28%). GCC respondents placed more importance on opportunities for career growth (67%) in comparison to those in Levant (59%) and North Africa (48%).
Base: All respondents (8,963)

Ideal job
All figures are %’s
Q. When selecting your IDEAL JOB, which three factors would be most important to you? (Select only THREE from those listed)
GCC Levant North Africa
KSA UAE Kuwait Qatar Bahrain Oman Lebanon Syria Jordan Egypt Morocco Algeria Tunisia
Base: All respondents 1715 1712 275 423 127 170 234 59 451 1765 397 557 187
Salary and benefits 88 86 88 84 87 81 79 80 85 81 58 65 67Opportunities for career
growth 64 72 63 64 71 67 76 39 53 56 35 36 40
Job security 35 37 36 27 32 33 17 25 41 20 27 20 26Work-life balance 23 19 13 26 23 23 26 34 28 32 50 50 41
Reputable organization 19 22 22 25 17 21 24 22 18 26 21 20 27Feeling of
accomplishment 18 11 15 16 15 14 21 31 26 25 36 37 25
Challenging work 17 20 21 22 15 26 20 14 13 15 16 20 25
Fair evaluation 13 8 10 11 9 4 14 27 15 21 11 16 18
Flexible work timings 10 12 13 8 12 10 14 17 11 9 12 10 8
Set number of working hours 5 4 7 4 3 5 3 3 4 8 14 7 8
Manageable workload 5 5 7 7 9 5 3 2 3 5 12 8 8

Current job satisfaction
All figures are %’s
Q. Thinking about your current job, how would you rate it on the following factors?
• Overall, respondents had an “average” level of job satisfaction with the mean score across all categories being 3.2 out of a 5-point scale (1= Very poor, 5 = Excellent).
• Organizational reputation was ranked quite high, whereas opportunities for career growth and fair evaluation were the main pain points, with only one quarter of respondents satisfied in these areas.
Top 2 boxes
Base: Working respondents (6,800)
32
25
44
56
45
27
39
45
38
42
35

Current job/career situation
All figures are %’s
Q. Thinking about your current job and career in general, which of the following applies to you? Select all that apply.
• Almost two thirds of respondents (64%) believed they deserve to work in a higher level position, and nearly half of all respondents (48%) were willing to move to another department/area of expertise to further their careers. Furthermore, two-fifths (43%) of all respondents were willing to move to a different industry altogether.
• Almost one third of respondents (30%) believed they had achieved all they could in their current organization, and were looking for a change, and almost the same proportion saw their current job as a training ground for their next move. Results were similar across the GCC, Levant & North Africa regions.
Base: Working respondents (6,800)

Current job/career situation
All figures are %’s
Q. Thinking about your current job and career in general, which of the following applies to you? Select all that apply.
GCC Levant North Africa
KSA UAE Kuwait Qatar Bahrain Oman Lebanon Syria Jordan Egypt Morocco Algeria Tunisia
Base: Working respondents 1409 1452 236 373 106 145 178 39 310 1290 160 321 109
I feel that I deserve to work in a higher level position 67 61 65 58 59 60 65 59 66 62 68 69 64
I am prepared to move to another area of expertise or department to further
my career
51 50 49 46 45 48 44 56 49 43 46 46 43
I am prepared to move to another industry to further
my career44 45 49 45 50 41 37 36 44 40 48 43 44
I see my current job as a training ground for a career
move to another organization
29 32 27 31 32 37 31 44 32 34 31 28 35
I feel I have achieved all I wanted to achieve in this organization and need to
move to another organization
33 29 30 26 31 30 33 18 32 31 25 20 23
I see my current job as a training ground to progress
to a career within the organization
18 17 18 16 17 15 16 18 16 16 23 25 15
I feel I have achieved all I wanted to achieve in my
career till now14 14 14 13 14 17 7 13 11 11 7 11 6

Professional/career goals
All figures are %’s
Q. Have you set any professional goals for yourself? Q. What are your top career goals?
• Over two thirds of respondents (68%) reported setting professional goals for themselves, which included getting a higher salary (54%), finding a new job (53%) and learning new skills (52%). A higher salary was more important to GCC respondents (59%) versus those in North Africa (49%).
• Nearly three-quarters of GCC respondents reported setting professional goals for themselves (72%), versus nearly two-thirds of those in Levant (64%) and North Africa (63%).
Base: All respondents (8,963)
Base: Those who have set professional goals (6,103)

Professional/career goals
All figures are %’s
Q. Have you set any professional goals for yourself? Q. What are your top career goals?
GCC Levant North Africa
KSA UAE Kuwait Qatar Bahrain Oman Lebanon Syria Jordan Egypt Morocco Algeria Tunisia
Base: All respondents 1715 1712 275 423 127 170 234 59 451 1765 397 557 187
Q: Have you set any professional goals for yourself?
Yes, for the next 5 years 28 26 23 30 29 28 19 27 22 25 24 24 29
Yes, for the next 2 years 22 27 20 20 23 21 19 15 20 19 11 15 13Yes, for the next year 14 16 17 14 13 16 12 17 20 14 12 12 13
Yes, for the next 6 months 6 7 8 7 6 8 7 8 5 6 10 6 6No I have not 20 15 21 21 20 21 29 24 24 27 31 27 29
Don’t know/ Can’t say 10 9 11 8 10 6 14 8 9 9 13 15 10
Base: Those who have set professional goals 1200 1294 188 303 89 124 134 40 301 1131 222 320 115
Q: What are your top career goals?Get a higher salary 62 58 62 55 57 56 59 55 49 54 38 42 45
Get a new job 52 57 56 55 49 53 54 50 53 49 53 48 50Learn new skills 53 50 47 54 44 57 53 70 47 55 58 50 52
Be more productive in my work 37 31 37 37 31 45 28 28 29 33 41 38 32
Get a promotion (in terms of title) 34 28 26 28 35 27 32 25 26 27 14 18 17
Go for higher education 32 23 21 21 25 24 36 35 31 23 23 25 9Shift my career to another
industry 19 27 20 23 24 22 19 8 16 15 16 17 12
Get along better with colleagues 13 11 10 12 11 9 8 2 7 11 16 13 10
Get along better with my boss 12 12 9 11 15 10 10 8 5 10 14 11 10

Current job versus perfect job
All figures are %’s
Q. To what extent do you agree or disagree that your current job is the perfect job for you?
Base: Working respondents (6,800) (KSA: 1,409) (UAE: 1,452) (Kuwait: 236) (Qatar:373) (Bahrain:106) (Oman:145) (Lebanon:178) (Syria:39) (Jordan:310) (Egypt: 1,290) (Morocco:160) (Algeria: 321) (Tunisia: 109)
• Overall, more than two-fifths of all respondents (45%) agreed that their current job is the perfect job for them.
• Two-fifths of GCC respondents (44%) and North African respondents (45%) believed their current job is perfect for them, versus a third (33%) of Levant respondents.
• In terms of specific countries, half of all respondents in Oman (50%) agreed with this statement, versus around one quarter (26%) of respondents in Lebanon.
45
45
43
45
47
41
50
26
41
35
46
38
47
46
Top 2 boxes

Satisfaction with professional growth
All figures are %’s
Q. How satisfied are you with your professional growth over the past year (2014)?
Base: Working respondents (6,800) (KSA: 1,409) (UAE: 1,452) (Kuwait: 236) (Qatar:373) (Bahrain:106) (Oman:145) (Lebanon:178) (Syria:39) (Jordan:310) (Egypt: 1,290) (Morocco:160) (Algeria: 321) (Tunisia: 109)
• Overall, nearly 6 in 10 respondents (57%) were satisfied with their professional growth over the past year.
• Three-fifths of KSA respondents (59%) were satisfied with their professional growth, versus over two-fifths (44%) of respondents in Syria.
57
59
55
51
57
46
56
52
44
49
61
57
54
52
Top 2 boxes
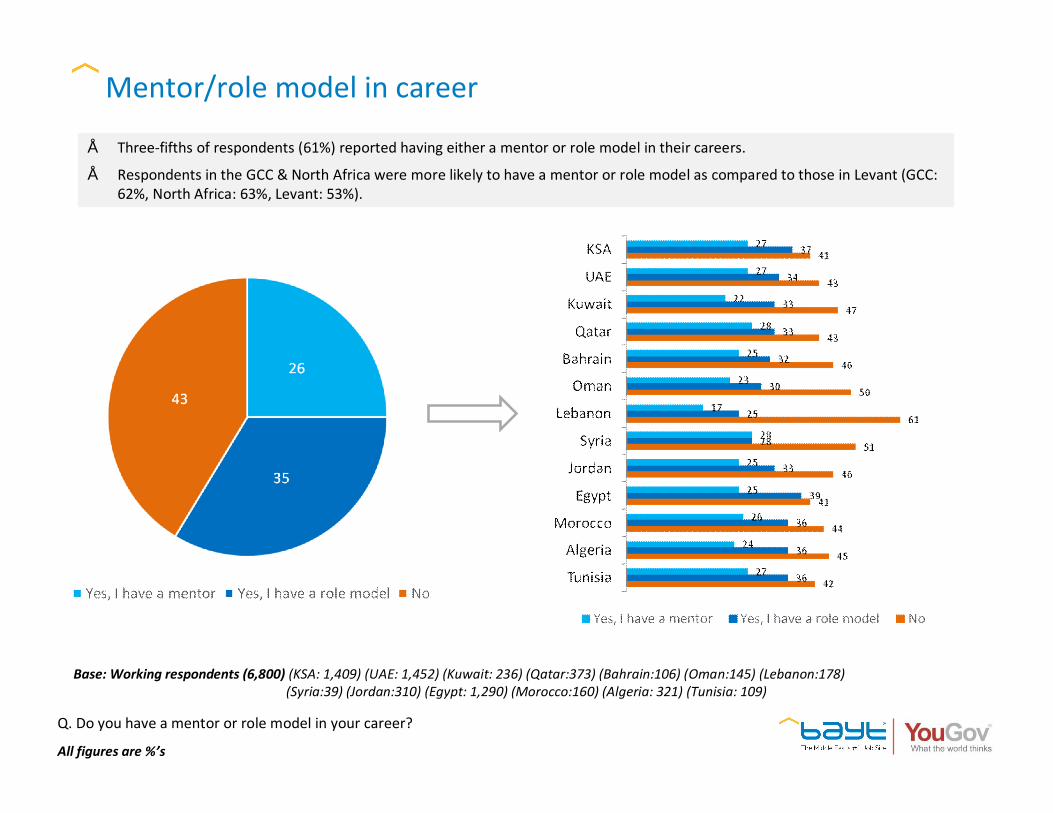
Mentor/role model in career
All figures are %’s
Q. Do you have a mentor or role model in your career?
• Three-fifths of respondents (61%) reported having either a mentor or role model in their careers.
• Respondents in the GCC & North Africa were more likely to have a mentor or role model as compared to those in Levant (GCC: 62%, North Africa: 63%, Levant: 53%).
Base: Working respondents (6,800) (KSA: 1,409) (UAE: 1,452) (Kuwait: 236) (Qatar:373) (Bahrain:106) (Oman:145) (Lebanon:178) (Syria:39) (Jordan:310) (Egypt: 1,290) (Morocco:160) (Algeria: 321) (Tunisia: 109)

Motivation at work
All figures are %’s
Q. In general, how motivated do you feel at work?
58
58
56
58
58
49
50
53
72
59
48
69
77
75
• Overall, nearly three-fifths of respondents (58%) reported feeling motivated at work.
• Three-quarters of respondents in Algeria (77%) and Tunisia (75%) reported feeling motivated at work, which was higher than other MENA countries.
Base: Working respondents (6,800) (KSA: 1,409) (UAE: 1,452) (Kuwait: 236) (Qatar:373) (Bahrain:106) (Oman:145) (Lebanon:178) (Syria:39) (Jordan:310) (Egypt: 1,290) (Morocco:160) (Algeria: 321) (Tunisia: 109)
Top 2 boxes

Factors to increase motivation at work
All figures are %’s
Q. Which of the following options would make you feel more motivated at work?
• Three-fifths of respondents reported that higher salaries and perks/benefits would increase motivation at work.
• Interestingly, more respondents stated that opportunities to express creativity (47%), and work-life balance (45%) would increase motivation, as compared to being promoted to the next level (40%).
Base: Working respondents (6,800)

Factors to increase motivation at work
All figures are %’s
Q. Which of the following options would make you feel more motivated at work?
GCC Levant North Africa
KSA UAE Kuwait Qatar Bahrain Oman Lebanon Syria Jordan Egypt Morocco Algeria Tunisia
Base: Working respondents 1409 1452 236 373 106 145 178 39 310 1290 160 321 109
Higher salary and perks/ benefits
64 62 63 60 65 57 70 59 66 61 52 52 64
Opportunity to express my creativity/ showcase my
skills47 49 52 49 49 48 50 44 45 47 44 40 44
Better work-life balance 44 46 36 48 49 54 31 41 37 42 54 54 39Promotion to the next level 43 40 44 35 46 41 38 44 45 41 40 34 41
More focus on training/learning new skills
39 39 38 35 42 44 39 49 38 42 41 37 33
More challenging work 36 37 38 38 32 43 39 44 29 34 35 34 44
Recognition of my work by peers and superiors
36 33 29 33 35 30 31 36 32 28 36 27 27
More positive reinforcement from my
supervisors31 29 25 29 28 30 28 31 30 31 29 27 31
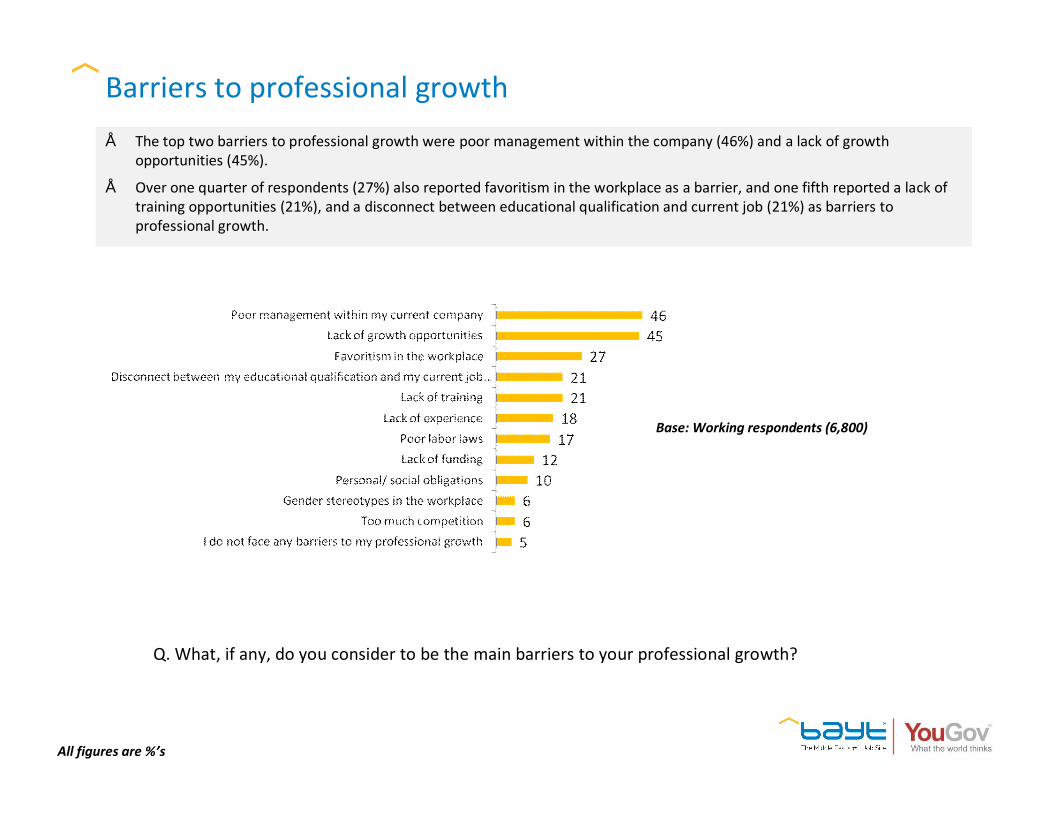
Barriers to professional growth
All figures are %’s
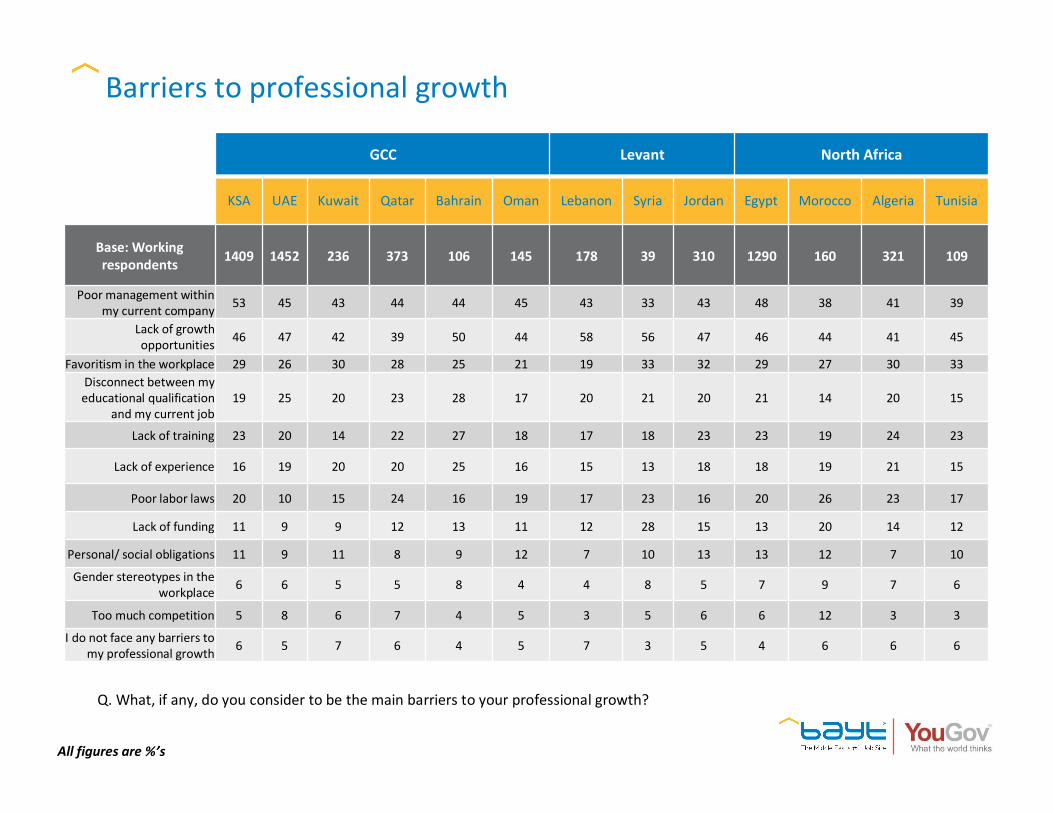
Q. What, if any, do you consider to be the main barriers to your professional growth?
• The top two barriers to professional growth were poor management within the company (46%) and a lack of growth opportunities (45%).
• Over one quarter of respondents (27%) also reported favoritism in the workplace as a barrier, and one fifth reported a lack of training opportunities (21%), and a disconnect between educational qualification and current job (21%) as barriers to professional growth.
Base: Working respondents (6,800)
Barriers to professional growth
All figures are %’s
Q. What, if any, do you consider to be the main barriers to your professional growth?
GCC Levant North Africa
KSA UAE Kuwait Qatar Bahrain Oman Lebanon Syria Jordan Egypt Morocco Algeria Tunisia
Base: Working respondents 1409 1452 236 373 106 145 178 39 310 1290 160 321 109
Poor management within my current company 53 45 43 44 44 45 43 33 43 48 38 41 39
Lack of growth opportunities 46 47 42 39 50 44 58 56 47 46 44 41 45
Favoritism in the workplace 29 26 30 28 25 21 19 33 32 29 27 30 33Disconnect between my educational qualification
and my current job19 25 20 23 28 17 20 21 20 21 14 20 15
Lack of training 23 20 14 22 27 18 17 18 23 23 19 24 23
Lack of experience 16 19 20 20 25 16 15 13 18 18 19 21 15
Poor labor laws 20 10 15 24 16 19 17 23 16 20 26 23 17
Lack of funding 11 9 9 12 13 11 12 28 15 13 20 14 12
Personal/ social obligations 11 9 11 8 9 12 7 10 13 13 12 7 10
Gender stereotypes in the workplace 6 6 5 5 8 4 4 8 5 7 9 7 6
Too much competition 5 8 6 7 4 5 3 5 6 6 12 3 3
I do not face any barriers to my professional growth 6 5 7 6 4 5 7 3 5 4 6 6 6

Reasons for seeking employment
All figures are %’s
Q. Listed here are reasons people have stated for seeking employment. Please select up to three reasons that best apply to you.
Base: All respondents (8,963)
• Interestingly, nearly three-quarters of all respondents (72%) reported seeking employment to learn and gain experience, whereas making money was ranked second, with three-fifths of respondents (58%) stating it as a key factor.
• Over two-fifths of respondents reported financial independence (44%) and feeling useful to society (44%) as reasons for seeking employment.
• Three-fifths of men (62%) stated making money as a key reason versus two-fifths (42%) of women. However, more women (57%) emphasized financial independence as compared to men (41%). Men and women placed equal importance on learning/gaining experience (71% for men versus 75% for women).

Reasons for seeking employment
All figures are %’s
Q. Listed here are reasons people have stated for seeking employment. Please select up to three reasons that best apply to you.
GCC Levant North Africa
KSA UAE Kuwait Qatar Bahrain Oman Lebanon Syria Jordan Egypt Morocco Algeria Tunisia
Base: All respondents 1715 1712 275 423 127 170 234 59 451 1765 397 557 187
To consistently learn and gain experience 73 70 70 66 73 68 76 80 71 77 68 71 70
To make money/ be gainfully employed 62 59 56 57 58 53 59 61 57 62 38 52 49
To be financially independent 45 50 52 46 58 51 47 51 44 35 49 33 44
To feel useful to society 42 32 35 38 33 35 38 54 48 53 61 57 55
To make use of my education 26 28 30 33 30 29 26 31 28 24 19 27 27
To meet people 15 15 16 16 13 14 22 12 22 21 23 19 26
To have a routine in life 9 11 10 8 9 8 3 - 6 5 10 9 2

Percentage of income saved
All figures are %’s
Q. Thinking about the past year, what percentage of your income were you able to save?
Base: Working respondents (6,800)
• Nearly one third of respondents (31%) reported not being able to save any of their income over the past year, whereas one quarter of respondents (24%) reported saving less than 10% of their annual income, and nearly three in 10 respondents (28%) reported saving 11-30% of their annual income.
• In terms of region, 45% of Levant respondents reported not saving any of their annual income, compared to one third of respondents in North Africa (33%) and one quarter of GCC respondents (27%).

Percentage of income saved
All figures are %’s
Q. Thinking about the past year, what percentage of your income were you able to save?
GCC Levant North Africa
KSA UAE Kuwait Qatar Bahrain Oman Lebanon Syria Jordan Egypt Morocco Algeria Tunisia
Base: Working respondents 1409 1452 236 373 106 145 178 39 310 1290 160 321 109
None 27 27 26 21 29 25 42 41 48 32 38 33 42
Less than 10% 22 27 22 20 22 19 22 31 23 22 21 24 22
10 – 20% 16 18 19 20 14 15 16 18 12 16 18 17 9
21 – 30% 13 12 10 15 13 14 11 8 8 12 11 10 15
31 – 40% 8 7 9 8 8 10 3 3 4 6 2 4 2
41 – 50% 7 4 7 9 4 7 2 - 3 6 4 5 5
More than 50% 7 4 8 7 9 10 4 - 3 7 6 7 6

Satisfaction with current work environment
All figures are %’s
Q. Overall how happy are you with the current work environment?
• Nearly two-fifths of respondents (38%) reported being satisfied with their current work environment, one third (30%) were neutral, and another third (33%) were not satisfied.
• Across countries, respondents in Algeria and Tunisia reported higher levels of satisfaction. Within the GCC, respondents in the UAE & KSA reported similar levels of satisfaction, whereas respondents in Bahrain reported lower levels of satisfaction.
Top 2 boxes
38
37
37
39
33
24
41
32
36
32
38
35
43
46
Base: Working respondents (6,800) (KSA: 1,409) (UAE: 1,452) (Kuwait: 236) (Qatar:373) (Bahrain:106) (Oman:145) (Lebanon:178) (Syria:39) (Jordan:310) (Egypt: 1290) (Morocco:160) (Algeria: 321) (Tunisia: 109)

Relocating for employment purposes
All figures are %’s
Q. Would you consider relocating to another country for employment purposes?
Base: All respondents (8,963)
Base: All respondents (8,963)
• Three-quarters of all respondents (73%) would consider relocating to another country for employment purposes.
• Men were more likely than women to relocate for employment (77% of men versus 57% of women).
• Three in five UAE respondents (61%) would consider relocating, which is lower than the overall average.

Country chosen for relocation purposes
All figures are %’s
Q. Which ONE country are you most likely to choose if relocating?
The top 3 countries chosen for relocation purposes were UAE
(28%), Qatar (13%) and KSA (13%).
Base: Respondents willing to relocate (6,538)

Country chosen for relocation purposes
All figures are %’s
Q. Which ONE country are you most likely to choose if relocating?
GCC Levant North Africa
KSA UAE Kuwait Qatar Bahrain Oman Lebanon Syria Jordan Egypt Morocco Algeria Tunisia
Base: Respondents willing to relocate 1116 1041 164 309 92 121 170 50 371 1400 292 477 168
Relocate to UAE 32 13 33 39 32 43 35 34 32 29 32 28 24
Relocate to KSA 9 8 4 8 5 6 4 14 19 24 5 8 12
Relocate to Qatar 16 10 11 10 9 13 10 8 16 8 17 27 21
Relocate to Canada 7 16 12 8 11 4 6 4 3 3 9 10 11
Relocate to the USA 5 8 5 3 3 1 7 2 6 3 5 3 3
Relocate to Kuwait 3 2 7 3 3 2 5 2 3 13 1 2 4

Ideal retirement age
All figures are %’s
Q. At what age would you like to retire?
Base: All respondents (8,963)
• More than two-fifths of respondents (43%) preferred to retire after the age of 60. Respondents in North Africa were more likely to state this preference (51%) as compared to Levant (45%) and GCC respondents (36%).
• Interestingly, less than a fifth of respondents (16%) chose retirement before 50, indicating a desire to stay in the workforce for a shorter period.

Ideal retirement age
All figures are %’s
Q. At what age would you like to retire?
GCC Levant North Africa
KSA UAE Kuwait Qatar Bahrain Oman Lebanon Syria Jordan Egypt Morocco Algeria Tunisia
Base: All respondents 1715 1712 275 423 127 170 234 59 451 1765 397 557 187
Before 50 years old 18 22 21 24 28 19 11 7 17 8 11 14 10
Between 50 – 55 years old 21 25 24 20 24 28 17 8 24 14 22 27 25
Between 56 – 60 years old 20 22 19 19 16 17 18 22 21 16 31 28 28
After 60 years old 41 32 36 37 32 36 55 63 38 61 37 31 37

Issues worried about in daily life
All figures are %’s
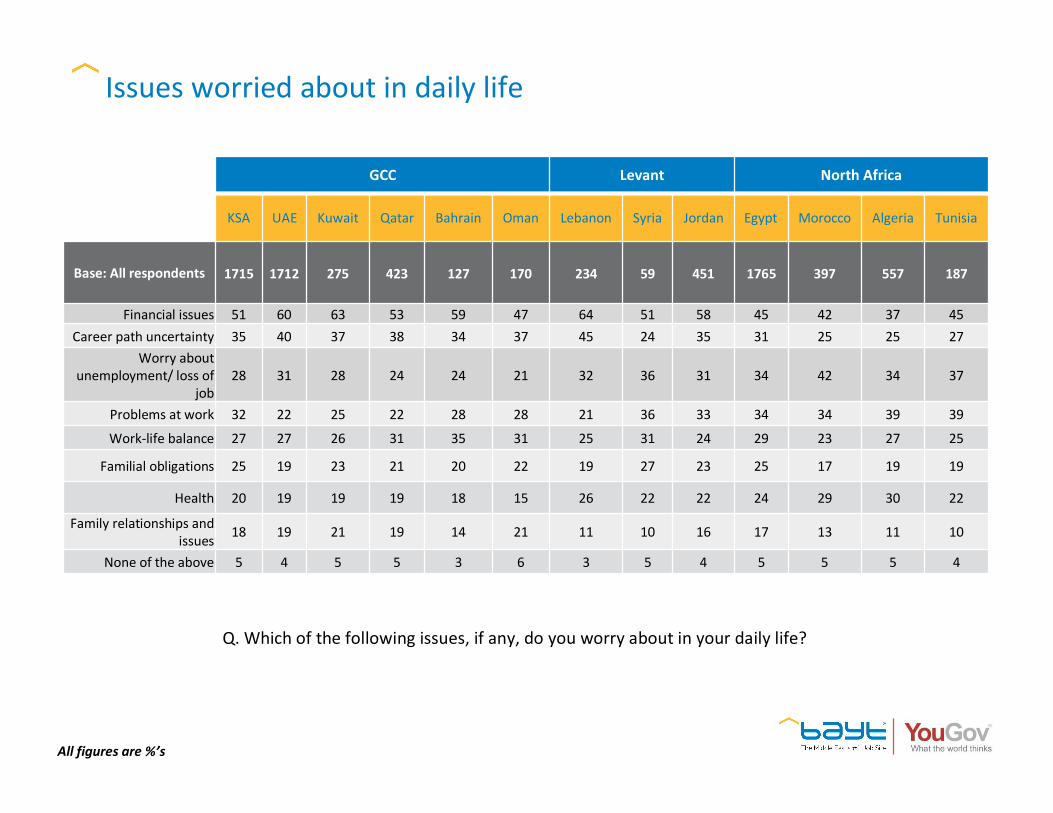
Q. Which of the following issues, if any, do you worry about in your daily life?
• Half of all respondents (51%) worry about financial issues in their daily lives, and a third worry about career path uncertainty(33%) and unemployment/losing their job (31%).
• Interestingly, women worry about unemployment more than men do (37% versus 29% for men).
Base: All respondents (8,963)
Issues worried about in daily life
All figures are %’s
Q. Which of the following issues, if any, do you worry about in your daily life?
GCC Levant North Africa
KSA UAE Kuwait Qatar Bahrain Oman Lebanon Syria Jordan Egypt Morocco Algeria Tunisia
Base: All respondents 1715 1712 275 423 127 170 234 59 451 1765 397 557 187
Financial issues 51 60 63 53 59 47 64 51 58 45 42 37 45Career path uncertainty 35 40 37 38 34 37 45 24 35 31 25 25 27
Worry about unemployment/ loss of
job28 31 28 24 24 21 32 36 31 34 42 34 37
Problems at work 32 22 25 22 28 28 21 36 33 34 34 39 39
Work-life balance 27 27 26 31 35 31 25 31 24 29 23 27 25
Familial obligations 25 19 23 21 20 22 19 27 23 25 17 19 19
Health 20 19 19 19 18 15 26 22 22 24 29 30 22
Family relationships and issues 18 19 21 19 14 21 11 10 16 17 13 11 10
None of the above 5 4 5 5 3 6 3 5 4 5 5 5 4

Top 3 personal goals for 2015
All figures are %’s
Q. What are your TOP THREE personal goals for 2015?
Base: All respondents (8,963)
• Overwhelmingly, the top personal goal for 2015 was reported to be saving more money, with nearly three-quarters of respondents (72%) reporting so. Other goals included travel (37%), buying property (33%) and spending time with family (30%).
• Perhaps unsurprisingly, buying property was a stronger preference among GCC respondents (39%) versus Levant (24%) and North Africa (24%).
• Half of all respondents in North Africa (49%) and Levant (50%) stated travel as a personal goal, compared to a quarter (27%) of GCC respondents.

Top 3 personal goals for 2015
All figures are %’s
Q. What are your TOP THREE personal goals for 2015?
GCC Levant North Africa
KSA UAE Kuwait Qatar Bahrain Oman Lebanon Syria Jordan Egypt Morocco Algeria Tunisia
Base: All respondents 1715 1712 275 423 127 170 234 59 451 1765 397 557 187
Save more money 75 78 75 73 69 70 70 66 72 73 57 60 68
Travel 28 26 25 25 31 38 43 68 51 47 43 53 60
Buy property 41 38 37 37 41 34 20 8 27 24 23 28 16
Spend more time with family 35 37 39 38 31 36 21 27 22 25 18 22 26
Exercise more 29 30 26 33 31 34 34 24 25 23 20 13 22
Meet new people 16 21 22 21 16 21 35 22 25 24 37 28 36
Get married 20 18 16 21 21 15 17 25 22 24 32 35 26
Eat healthier 15 19 19 17 20 19 17 8 14 13 9 8 9
Find new hobbies 8 7 9 7 6 3 5 3 9 12 16 17 8
Have children 11 9 10 9 6 8 1 15 8 9 12 12 10Spend more time doing my
hobbies 8 6 7 8 9 10 16 5 7 10 9 6 8
Other 5 5 8 4 6 6 11 3 6 6 5 5 6
Overall sentiment about 2015
All figures are %’s
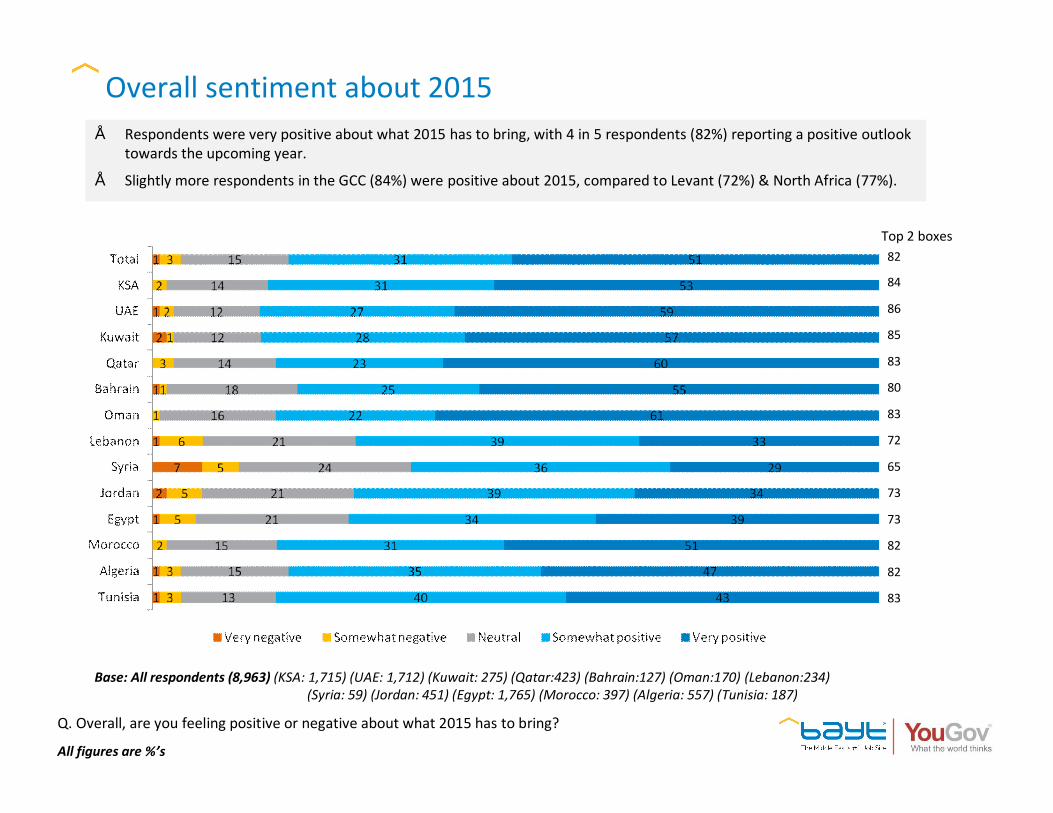
Q. Overall, are you feeling positive or negative about what 2015 has to bring?
Base: All respondents (8,963) (KSA: 1,715) (UAE: 1,712) (Kuwait: 275) (Qatar:423) (Bahrain:127) (Oman:170) (Lebanon:234) (Syria: 59) (Jordan: 451) (Egypt: 1,765) (Morocco: 397) (Algeria: 557) (Tunisia: 187)
• Respondents were very positive about what 2015 has to bring, with 4 in 5 respondents (82%) reporting a positive outlook towards the upcoming year.
• Slightly more respondents in the GCC (84%) were positive about 2015, compared to Levant (72%) & North Africa (77%).
Top 2 boxes82
84
86
85
83
80
83
72
65
73
73
82
82
83

DEMOGRAPHICSSection 4

Demographics
A total sample of 8,963 respondents was achieved.
Age•18-29 – 48%•30-39 – 33%•40-49 – 13%•50+ -- 6%
Marital Status•Single – 47%•Married – 51%•Separated/ divorced – 1%
Region•GCC – 49%•Levant – 8%•North Africa – 32%
Gender•Male – 80%•Female – 20%
All figures are %’s
Base: All respondents (8,963)

Demographics
Working full or part timeBase: 6,800
Male – 78%Female – 65%
18-29 – 67%30-39 – 86 %40-49 – 84% 50+ – 73%
GCC – 85%Levant – 71%
North Africa – 65%
• Three-quarters of respondents were working full or part-time.
• The largest working population was in the GCC, followed by Levant and North Africa.
All figures are %’s
Base: All respondents (8,963)

Demographics
72 68
21 22
1 1
3 1
1 1
• Nearly three-quarters of respondents were employed in the private sector, and a fifth were in the public sector.
• Men and women were distributed fairly equally across sectors.
71% Employed in private sector
21% Employed in public sector
3% Self-employed/ Work in family business
All figures are %’s
Base: Working respondents (6,800)
Less than a year 181 to 3 years 354 to 6 years 19
7 to 10 years 1411 to 15 years 7
More than 15 years 8
Length of employment with current company:
3 6

Thank You