bayesian network and its applications
DESCRIPTION
Bayesian network and its applications. Jun Zhu Genetics Rosetta Inpharmatics Merck & Co. Outline. Methods Integration of genetics and gene expression Integration of data from multiple tissues Construction of causal graphic networks - PowerPoint PPT PresentationTRANSCRIPT

Bayesian network and its applications
Jun ZhuGenetics
Rosetta InpharmaticsMerck & Co.

Outline
• Methods– Integration of genetics and gene expression – Integration of data from multiple tissues– Construction of causal graphic networks– Integration of transcription factor binding sites
and protein-protein interaction (PPI) data
• Applications – target selection and prioritization– Integrate with siRNA screening data– Integrate with proteomics data

Gene setsAssociation networks
Probabilistic causal networks
Mechanism based models
Biological details revealed
Data required to train models
Biological networks/pathways
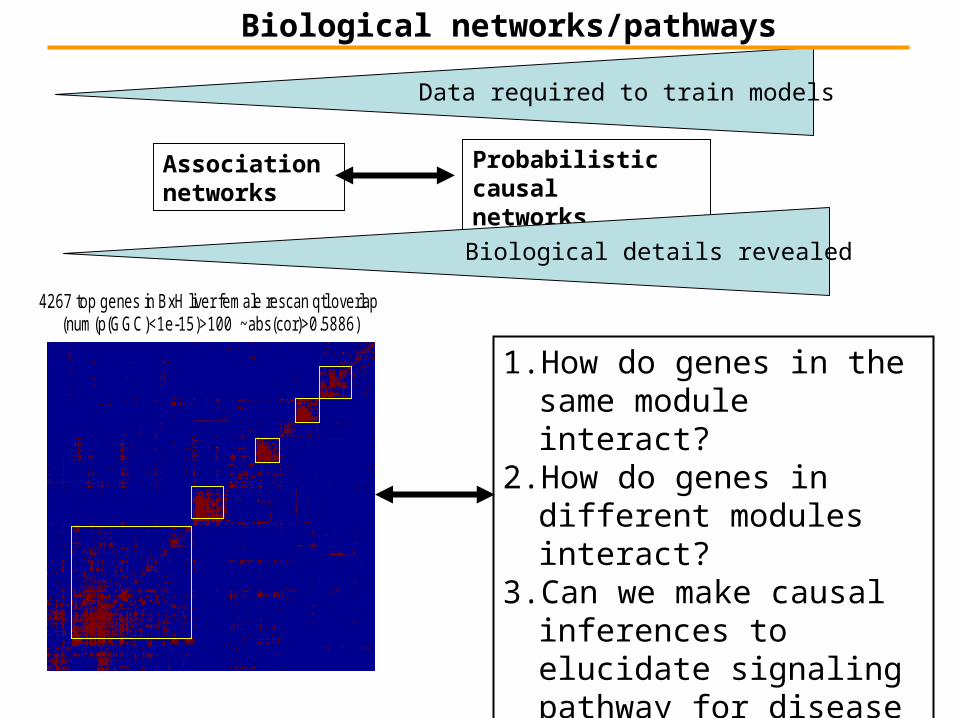
Association networks
Probabilistic causal networks
Biological details revealed
Data required to train models
Biological networks/pathways
1. How do genes in the same module interact?
2. How do genes in different modules interact?
3. Can we make causal inferences to elucidate signaling pathway for disease targets?
4267 top genes in BxH liver female rescan qtl overlap (num(p(GGC)<1e-15)>100 ~abs(cor)>0.5886)

A framework for data integration
How to integrate them?
Microarray data
Proteomic data
Genomics
Genetics
Medline Biocarta/Biopathway Biologists
Database
GUIHypothesis, test
High throughputdata
knowledge

Bayesian network
• decompose joint distribution based on conditional independence
• Find maximum likelihood of G given data D, p(D|G)
i
iin XPaXpXXXpGp ))(|()....,()( 21
Bayesian network
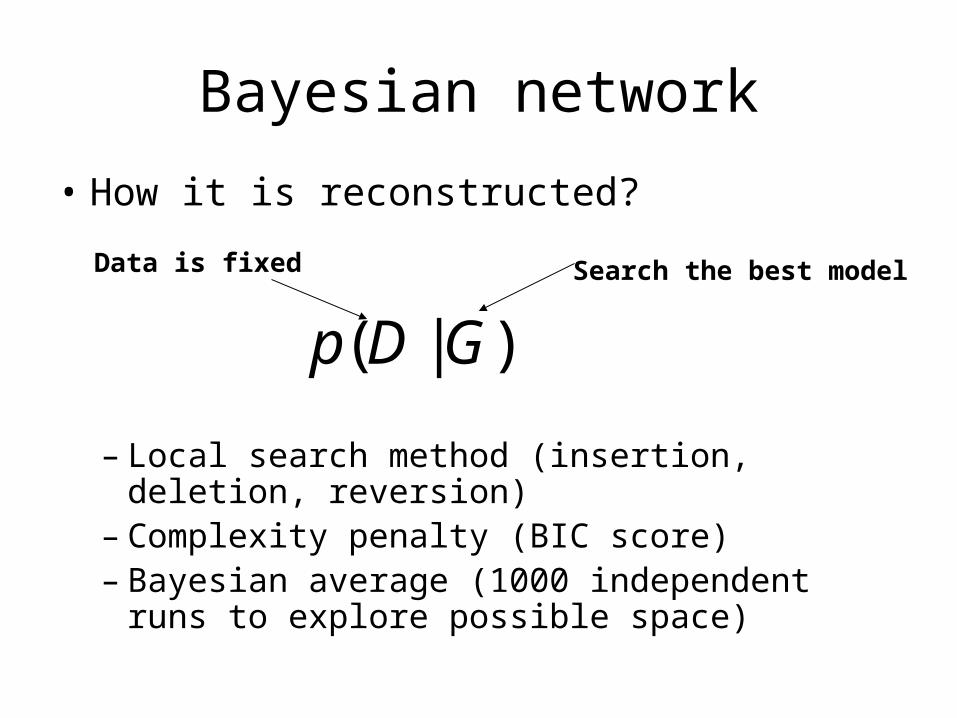
• How it is reconstructed?
– Local search method (insertion, deletion, reversion)
– Complexity penalty (BIC score)– Bayesian average (1000 independent runs to
explore possible space)
( | )p D G
Search the best modelData is fixed

Bayesian network-practical issues
• How it is reconstructed?– NP-hard problem– Limit numbers of nodes– Limit search space

BN: Markov equivalent
• Bayesian network is just a graphic model
• Itself does not reveal causal information
)()/()()/(),( BpBApApABpBAp
AB BA

A
B C
A
B C
A
B C
A
B C
AB C
L
Bayesian network: A, B and C are correlated, but through different mechanisms.
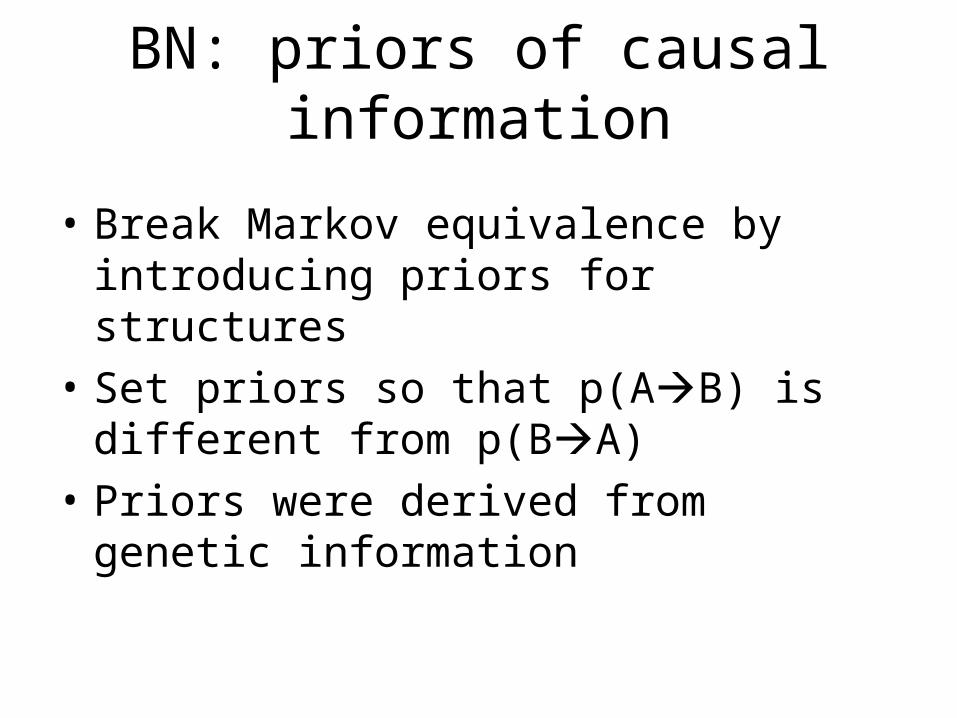
BN: priors of causal information
• Break Markov equivalence by introducing priors for structures
• Set priors so that p(AB) is different from p(BA)
• Priors were derived from genetic information

Experimental Design
Integration of genetics and gene expression
• Genetic map• Genotype• Gene expression of
relevant tissues• Clinical end points
Experimental Data

Variation in mRNA leads to variation in protein, which in turn can lead to disease
Ingredients for inferring causality
• Perturbations with a causal anchor– KOs/transgenics present a known perturbation (causal anchor)
where response can be studied– Natural variation in a segregating population provides the same
type of causal anchor (ability to identify DNA variations associated with response):
DNA Supporting Gene X
Variation in DNA leads to variation in mRNA
AA
CA
GT
TA
AC
GG
TT
High expression, alt splicing, codon change, etc.
Low expression, no alt. splicing, no codon change, etc.

L T2T1 L T2 T1 L
T1
T2
Avy
eumelanin RNAs
obesity
db/dbob/ob obesity leptinleptin obesity
Causative Model Reactive ModelIndependentModel
L: DNA Locus controlling RNA levels and/or clinical traits
R: Quantitative trait 1
C: Quantitative trait 2
L
T1
T2
Distinguishing Causal from Reactive Genes
1 2 1 2 1, , | |P L T T P T L P T T 1 2 2 1 2, , | |P L T T P T L P T T
1 2 2 1, , | |P L T T P T L P T L
Schadt E, et al., Nature Genetics, 2005

Inference causal relationships
Gene AGene B
Gene C
Gene D
Locus 1
Chr 1
Locus 1
Locus 1
Chr 1
Gene DPhysical location
Chr 9
Gene A
A and D have overlapping eQTL on Chr 1 at Locus 1
Gene A controls Gene D
Gene expression of A and D correlate
Gene A with cis acting QTL
Gene E
Locus 1 Locus 2 Locus 3
Chr2
Locus 2 Locus 3Chr2Chr2
Genes with complex trans acting QTLs
Genes B & C control Gene E
Gene D
Gene APhysical location
B, C and E have overlapping eQTL on Chr 2
Gene expression of B, C & E correlate

Bayesian network-integrating genetics
• Experimental Hsd11b1 signature : mice treated with Hsd1 inhibitor
• Prediction Hsd1 signatures based on BxD data– Correlation to Hsd1
• 10% of predicted signature overlap with experimental one
– BN without genetics• 20% of predicted signature overlap with
experimental one– BN with genetics
• 52% of predicted signature overlap with experimental one
Zhu J, et al, Cytogenet Genome Res. 2004
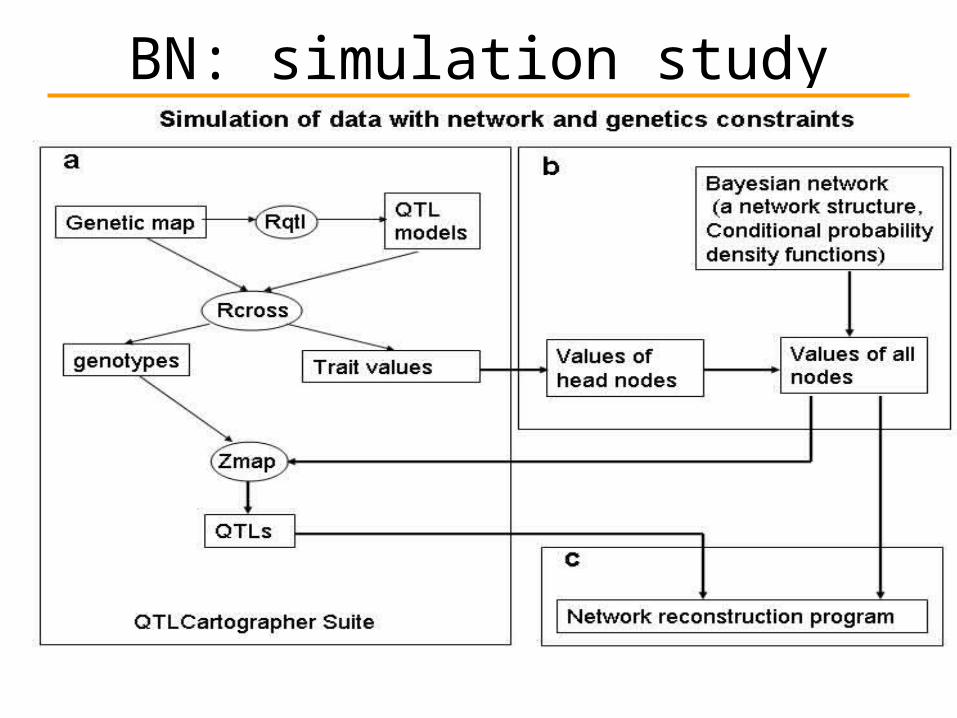
BN: simulation study

BN: Genetics information is critical when sample size is small
Zhu J, et al, PLoS Comput Biol. 2007

A framework for data integration
How to integrate them?
Microarray data
Proteomic data
Genomics
Genetics
Medline Biocarta/Biopathway Biologists
Database
GUIHypothesis, test
High throughputdata
knowledge
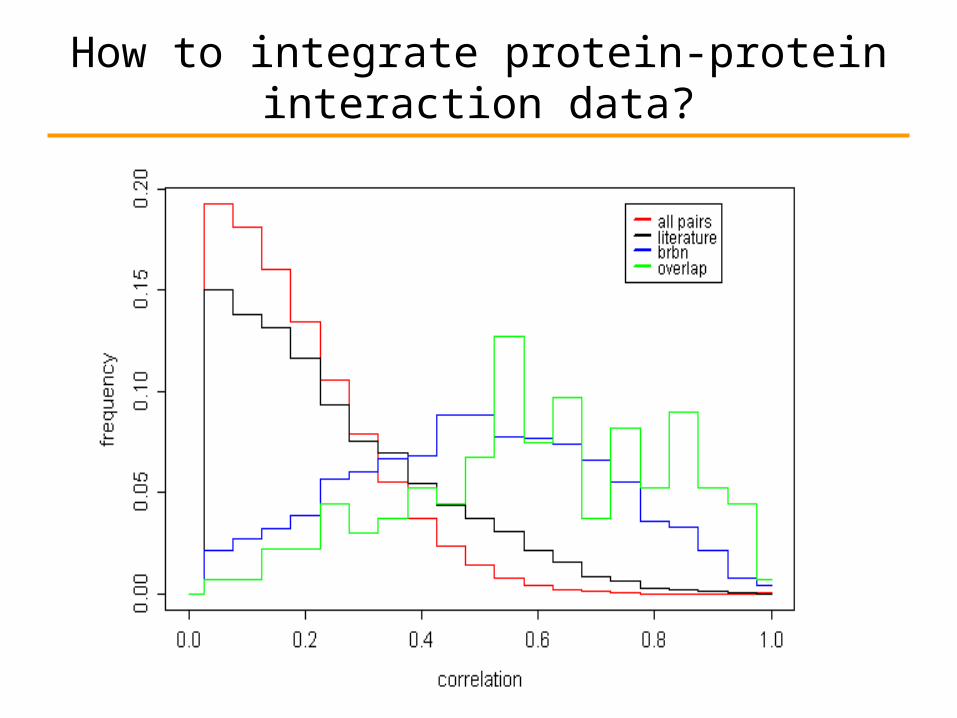
How to integrate protein-protein interaction data?

Can we find overlapped information better?
3-clique
4-clique 4-clique
3-clique
Clique community(partial clique)

Comparing protein-protein interactions with gene co-expression
0.19
0.29
0.50
0.51

Integrating transcription factor (TF) binding data and PPI
• Introducing scale-free priors for TF and large PPI complex
• Fixed prior for small PPI complex
)()( TwgTp
)),(log()(
Rg
cutoffi
i
rgTrTw

Application to yeast cross
BN KO data GO terms TF data
w/o any priors 125 55 26
w/ genetics priors 139 59 34
w/ genetics, TF and PPI priors 152 66 52
The network integrated genetics, TF and PPI has better prediction power.

Mechanism for a QTL hot spot
Red: TF
Green: PPI
Zhu J, et al. Nature Genetics, 2008

Applications
• How to use networks to prioritize candidates?
• How to use networks to identify causal genes in genome-wide association studies?

Driver potential
Query gene
Hypergeometric test


Validating connections in human cohorts
• Study of the genetics of gene expression in pedigrees using blood samples.
• Blood was collected from 455 individuals from 51 Icelandic families (Most families were dense three generation pedigrees).
• Samples were expression profiled against a common reference pool.
• Samples were genotyped for 1000 markers across the genome.
• Each of the 455 individuals was scored for 40 clinical traits.

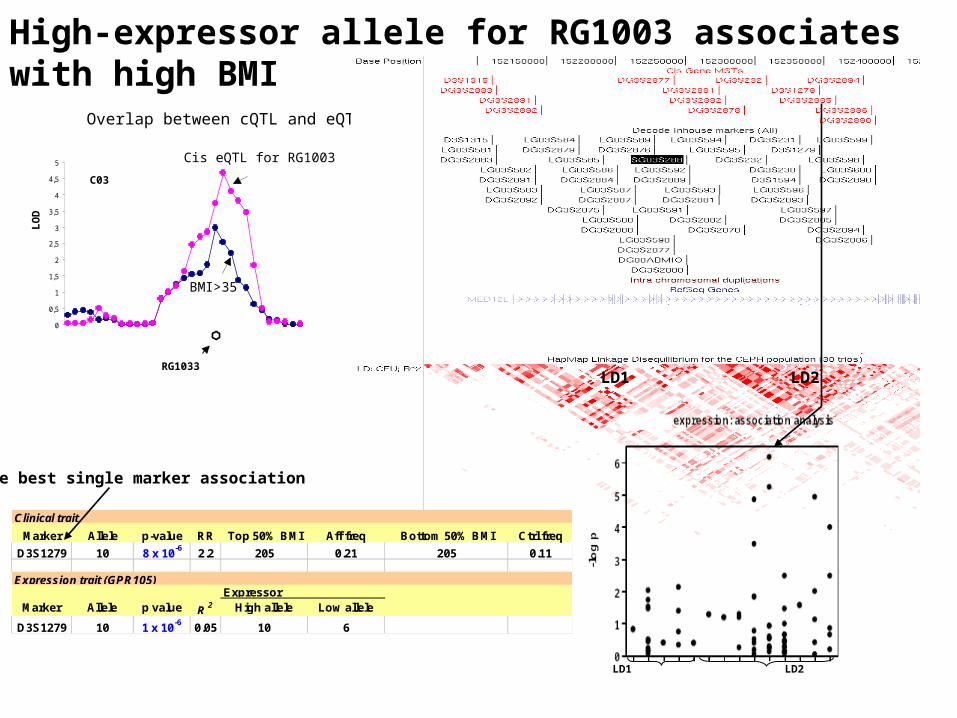
RG1033 has cis-acting QTL in Decode family blood expression data
Obese females
RG1003
RG1003 falls under linkage peak for obesity in females
Kissebah et al. 2000
RG1003
RG1003
RG1003 supported by Decode Linkage
RG1003 supported by obesity/diabetes linkages in the published literature
0
0,5
1
1,5
2
2,5
3
3,5
4
4,5
5 Cis eQTL for RG1003
C03
BMI>35
RG1033
Overlap between cQTL and eQTL
aka GPR105
LD1 LD2
LD1 LD2
LO
D
Clinical trait
Marker Allele p-value RR Top 50% BMI Aff freq Bottom 50% BMI Ctrl freq
D3S1279 10 8 x 10⁻⁶ 2.2 205 0.21 205 0.11
Expression trait (GPR105)Expressor
Marker Allele p value R 2 High allele Low allele
D3S1279 10 1 x 10⁻⁶ 0.05 10 6
High-expressor allele for RG1003 associates with high BMI
The best single marker association

ASO experiment in DIO mice
0
5
10
15
20
25
30
35
0.5 1 1.5 2 2.5 3 3.5 4 4.5
Wt Gain in DIO C57BL/6 Mice
vehicleGPR105SCD1Scrambled
wk
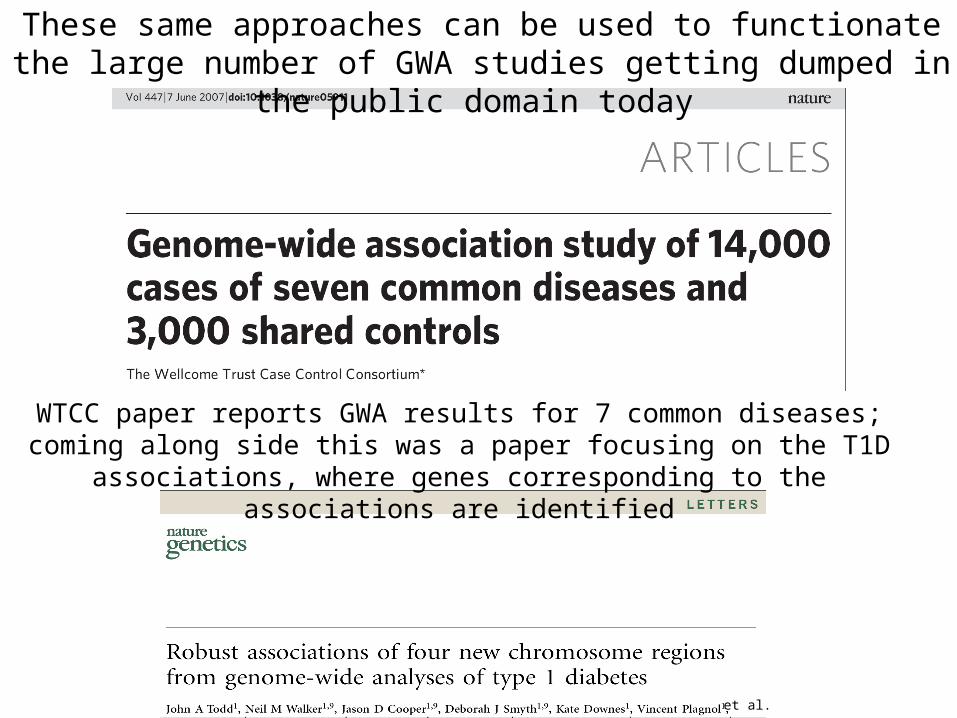
These same approaches can be used to functionate the large number of GWA studies getting dumped in the public domain today
et al.
WTCC paper reports GWA results for 7 common diseases; coming along side this was a paper focusing on the T1D associations, where genes
corresponding to the associations are identified

In the T1D Paper Genes Corresponding to the Associations in the WTCCC Paper are identified
• But what functional support is provided for these identifications?• Consider the chr 12q13 association and the identification of ERBB3:
– The gene was closest to the associated SNP– SH2B3 binds ERBB3, where ITAMs bind proteins like SH2B3 with SH2 signaling domains
involved in immune inflammatory events that lead to autoimmune pancreatic beta-cell destruction in T1D
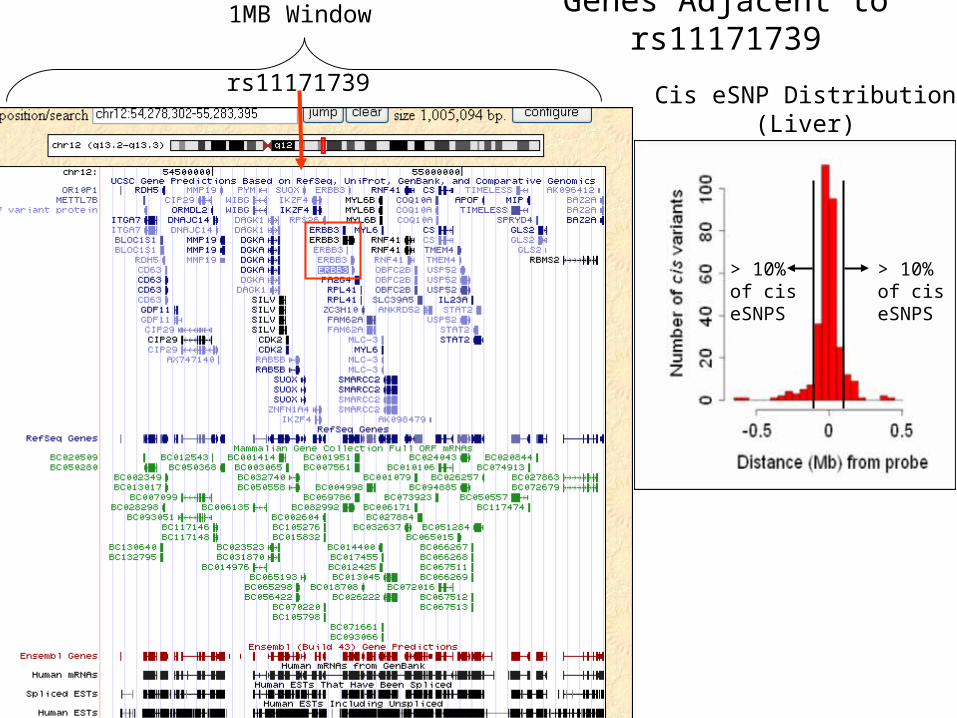
Genes Adjacent to rs11171739
rs11171739
1MB Window
Cis eSNP Distribution(Liver)
> 10% of cis eSNPS
> 10% of cis eSNPS
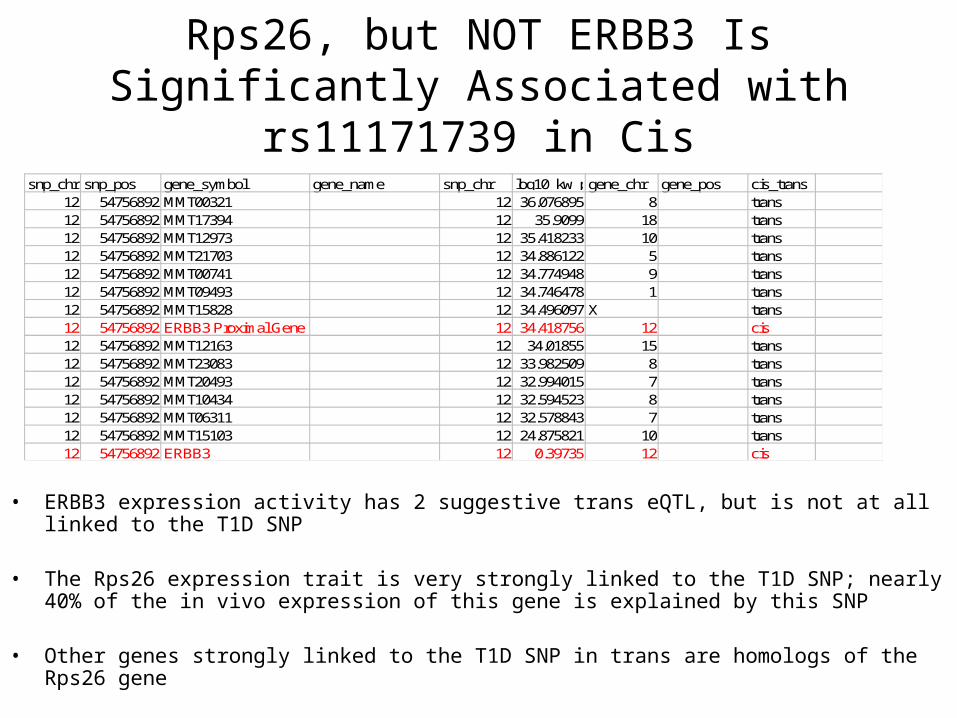
Rps26, but NOT ERBB3 Is Significantly Associated with rs11171739 in Cis
snp_chr snp_pos gene_symbol gene_name snp_chr log10_kw_pvaluegene_chr gene_pos cis_trans12 54756892 MMT00321 12 36.076895 8 trans12 54756892 MMT17394 12 35.9099 18 trans12 54756892 MMT12973 12 35.418233 10 trans12 54756892 MMT21703 12 34.886122 5 trans12 54756892 MMT00741 12 34.774948 9 trans12 54756892 MMT09493 12 34.746478 1 trans12 54756892 MMT15828 12 34.496097 X trans12 54756892 ERBB3 Proximal Gene 12 34.418756 12 cis12 54756892 MMT12163 12 34.01855 15 trans12 54756892 MMT23083 12 33.982509 8 trans12 54756892 MMT20493 12 32.994015 7 trans12 54756892 MMT10434 12 32.594523 8 trans12 54756892 MMT06311 12 32.578843 7 trans12 54756892 MMT15103 12 24.875821 10 trans12 54756892 ERBB3 12 0.39735 12 cis
• ERBB3 expression activity has 2 suggestive trans eQTL, but is not at all linked to the T1D SNP
• The Rps26 expression trait is very strongly linked to the T1D SNP; nearly 40% of the in vivo expression of this gene is explained by this SNP
• Other genes strongly linked to the T1D SNP in trans are homologs of the Rps26 gene

But now look at probabilistic causal networks
Rps26
T1D KEGG pathway genes
All crosses, all tissues• Liver• Adipose• Skeletal muscle• Islets• Whole brain• Hypothalamus
Schadt E, et al., PLoS Biology, 2008

Functional Enrichment of Rps26 Mouse Bayesian Network Genes
Similar Set Expectation Input IdentifiersMajor histocompatibility complex antigen 3.59615679443374E-11 H2-Aa;H2-Ab1;H2-Eb1;H2-M3;H2-DMa;H2-DMb1;H2-Q2;MMT00082085;H2-T-cell mediated immunity 4.11814903693412E-11 C2ta;Cd2;Ctss;H2-Aa;H2-Ab1;H2-Eb1;H2-M3;H2-DMa;H2-DMb1;H2-antigen processing 4.35718665292356E-10 Rmcs1;Ctss;H2-Aa;H2-Ab1;H2-Eb1;H2-DMa;H2-DMb1;MMT00082085;Hfe;Psmb8MHCII-mediated immunity 2.19156051592854E-09 C2ta;Ctss;H2-Aa;H2-Ab1;H2-Eb1;H2-DMa;H2-DMb1;MMT00072401antigen processing, exogenous antigen via 1.31842207155735E-08 Rmcs1;Ctss;H2-Aa;H2-Ab1;H2-Eb1;H2-DMa;H2-DMb1antigen presentation, exogenous antigen 1.48086534305264E-08 Rmcs1;Fcgr3;H2-Aa;H2-Ab1;H2-Eb1;H2-DMa;H2-DMb1;Psmb8Type I diabetes mellitus 2.60246885295535E-08 H2-Aa;H2-Ab1;H2-Eb1;H2-M3;H2-DMa;H2-DMb1;H2-Q2;MMT00082085;H2-T9;Hspd1Antigen processing and presentation 3.024258456011E-08 C2ta;Ctss;H2-Aa;H2-Ab1;H2-Eb1;H2-M3;H2-DMa;H2-DMb1;H2-MHC class II receptor activity 5.66821865604424E-07 Rmcs1;H2-Aa;H2-Ab1;H2-Eb1;H2-DMa;H2-DMb1Cell adhesion molecules (CAMs) 6.26076191318305E-07 Cd2;H2-Aa;H2-Ab1;H2-Eb1;H2-M3;H2-DMa;H2-DMb1;H2-Q2;MMT00082085;H2-antigen presentation 8.01315717611796E-07 Rmcs1;Fcgr3;H2-Aa;H2-Ab1;H2-Eb1;H2-DMa;H2-DMb1;MMT00082085;Hfe;Psmb8antigen presentation, exogenous antigen 1.42894483510369E-05 H2-Aa;H2-Ab1;H2-Eb1;H2-DMa;H2-DMb1

What about ERBB3 network in mouse?No functional enrichment in network genes (no T1D association)
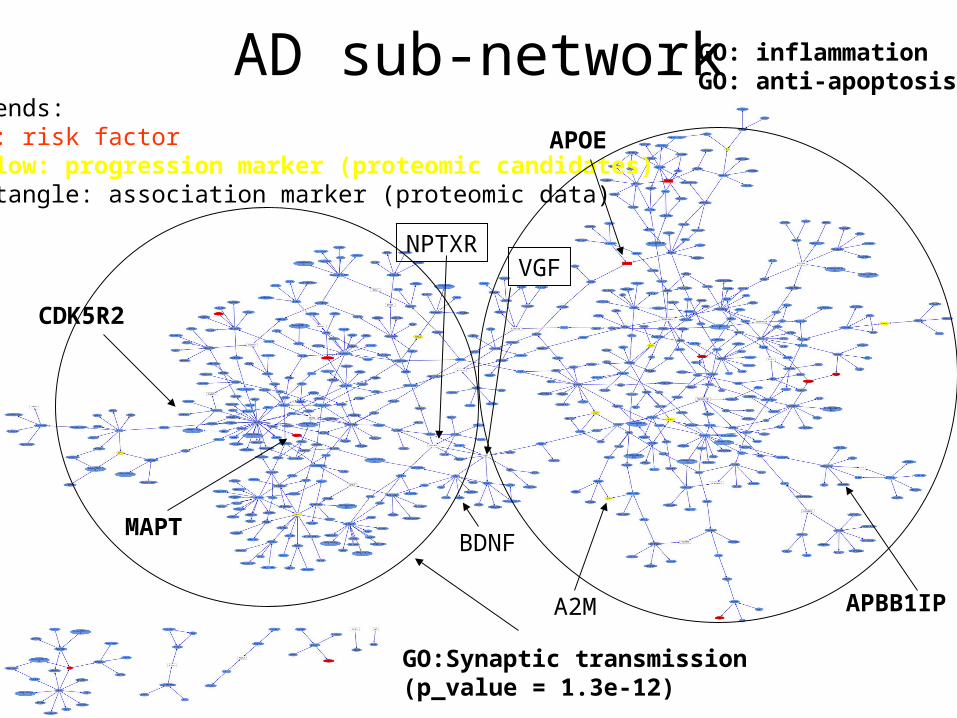
AD sub-networkLegends:Red: risk factorYellow: progression marker (proteomic candidates)Rectangle: association marker (proteomic data)
APBB1IP
MAPT
APOE
CDK5R2
GO:Synaptic transmission(p_value = 1.3e-12)
GO: inflammationGO: anti-apoptosis
BDNF
A2M
NPTXRVGF

How to understand phosphorylation changes detected by proteomics?
• 16 proteins’ phosphorylation states changed after inducing PIN1 siRNA (16 proteomic hits);
• Gene expression signature of PIN1 siRNA is also defined;
• Phosphorylation change is the primary signal, gene expression change is amplified signature.
• Do the two types of signals match?
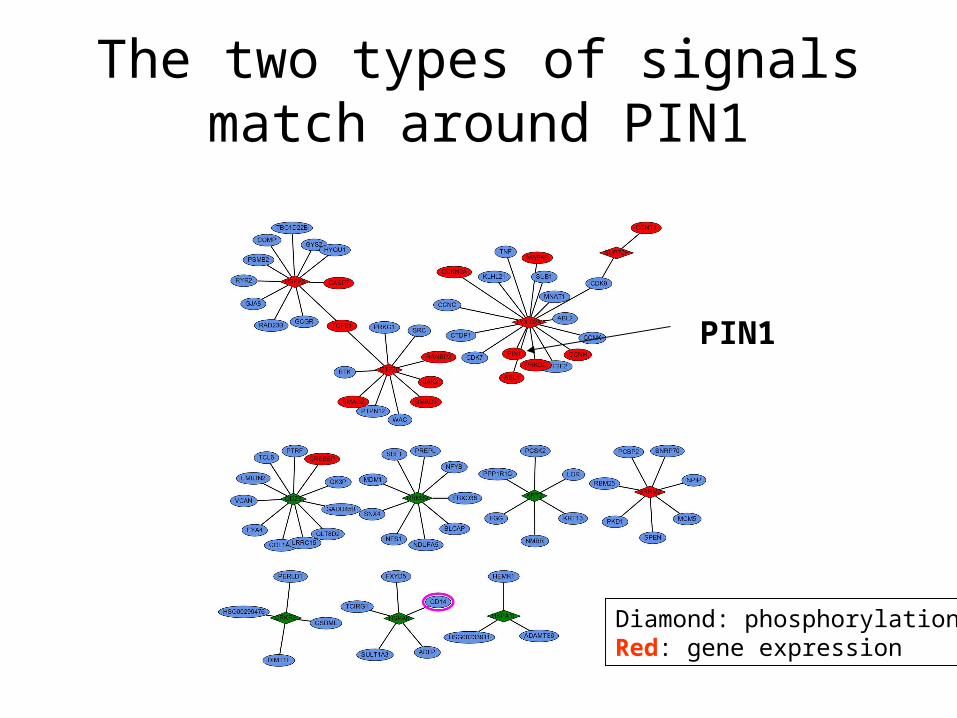
The two types of signals match around PIN1
PIN1
Diamond: phosphorylationRed: gene expression

GeneticsEric SchadtBiology/New Targets John Lamb Pek Lum Valur Emilsson
Jonathan DerryMichael CoonI-Ming WangDebraj GuhaThakurtaTao XieXia Yang
Network/Systems Biology Jun Zhu
Bin ZhangRadu DobrinZhidong TuDmitri VolfsonMani Narayanan
Data management/HP computing Andrew Kasarskis Archie Russell
Xavier SchildwachterEugene Chudin
Statistical GeneticsCliona MolonySolly SiebertsJosh MillsteinKe HaoHunter Fraiser
finance/admin)PMs: Sonia, Christine, and Rob*Chunsheng Zhang*
Merck CollaboratorsObesity/Diabetes
Marc ReitmanNancy ThornberryDoug MacNeilCharles RosenblumSu ChenShirly PintoBrian KennedyJoe ManciniJoel Berger
Sajjad A. Qureshi Cardiovascular
Sam WrightCarl SparrowMarty SpringerGerry WatersKenny Wong
SleepJohn Renger
Alzheimber’sDavid Stone
CancerStephen FriendTheresa Zhang
Joseph Marszalek Andrew Bloecher Vinayak KulkarniACSM
Jeff SachsArthur FridmanMatthew C. WienerEric Minch
External Collaborators
UW Steve Schwartz Roger BaumgarnerUWisc AttiegroupUCLA
Jake LusisUNL/UNC
Daniel PompDecode
Kari StefanssonNSI
Yanqing ChenHarvard Jun LiuBerkerley Rachel BremPrinceton Lenoid Kruglyak
MPRutper VesseyInformatics, Biosoft, BiologyGEL, GEM
Metabolite/Toxicogenomics Frank Sisteria Bill scheffer Ethan Xu Qiuwei XueOther Merck Collaborators
Andy PlumpLarry PetersonErik Lund