bayer-interim-report-2015-q2.pdf
TRANSCRIPT

Bayer significantly improves earnings
Interim ReportSecond Quarter of 2015
2 Bayer Interim Report
Key Data
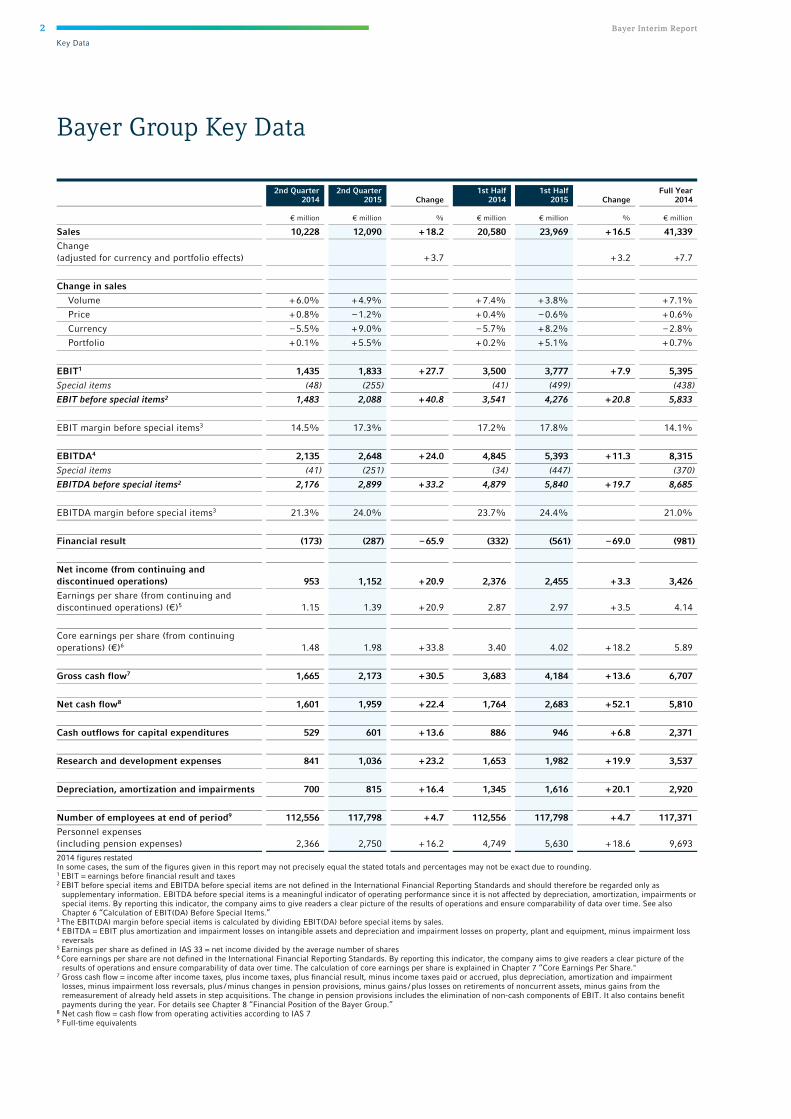
Bayer Group Key Data
2nd Quarter 2014
2nd Quarter 2015 Change
1st Half 2014
1st Half 2015 Change
Full Year 2014
€ million € million % € million € million % € million
Sales 10,228 12,090 + 18.2 20,580 23,969 + 16.5 41,339
Change (adjusted for currency and portfolio effects) + 3.7 + 3.2 +7.7
Change in sales
Volume + 6.0% + 4.9% + 7.4% + 3.8% + 7.1%
Price + 0.8% – 1.2% + 0.4% – 0.6% + 0.6%
Currency – 5.5% + 9.0% – 5.7% + 8.2% – 2.8%
Portfolio + 0.1% + 5.5% + 0.2% + 5.1% + 0.7%
EBIT1 1,435 1,833 + 27.7 3,500 3,777 + 7.9 5,395
Special items (48) (255) (41) (499) (438)
EBIT before special items2 1,483 2,088 + 40.8 3,541 4,276 + 20.8 5,833
EBIT margin before special items3 14.5% 17.3% 17.2% 17.8% 14.1%
EBITDA4 2,135 2,648 + 24.0 4,845 5,393 + 11.3 8,315
Special items (41) (251) (34) (447) (370)
EBITDA before special items2 2,176 2,899 + 33.2 4,879 5,840 + 19.7 8,685
EBITDA margin before special items3 21.3% 24.0% 23.7% 24.4% 21.0%
Financial result (173) (287) – 65.9 (332) (561) – 69.0 (981)
Net income (from continuing and discontinued operations) 953 1,152 + 20.9 2,376 2,455 + 3.3 3,426
Earnings per share (from continuing and discontinued operations) (€)5 1.15 1.39 + 20.9 2.87 2.97 + 3.5 4.14
Core earnings per share (from continuing operations) (€)6 1.48 1.98 + 33.8 3.40 4.02 + 18.2 5.89
Gross cash flow7 1,665 2,173 + 30.5 3,683 4,184 + 13.6 6,707
Net cash flow8 1,601 1,959 + 22.4 1,764 2,683 + 52.1 5,810
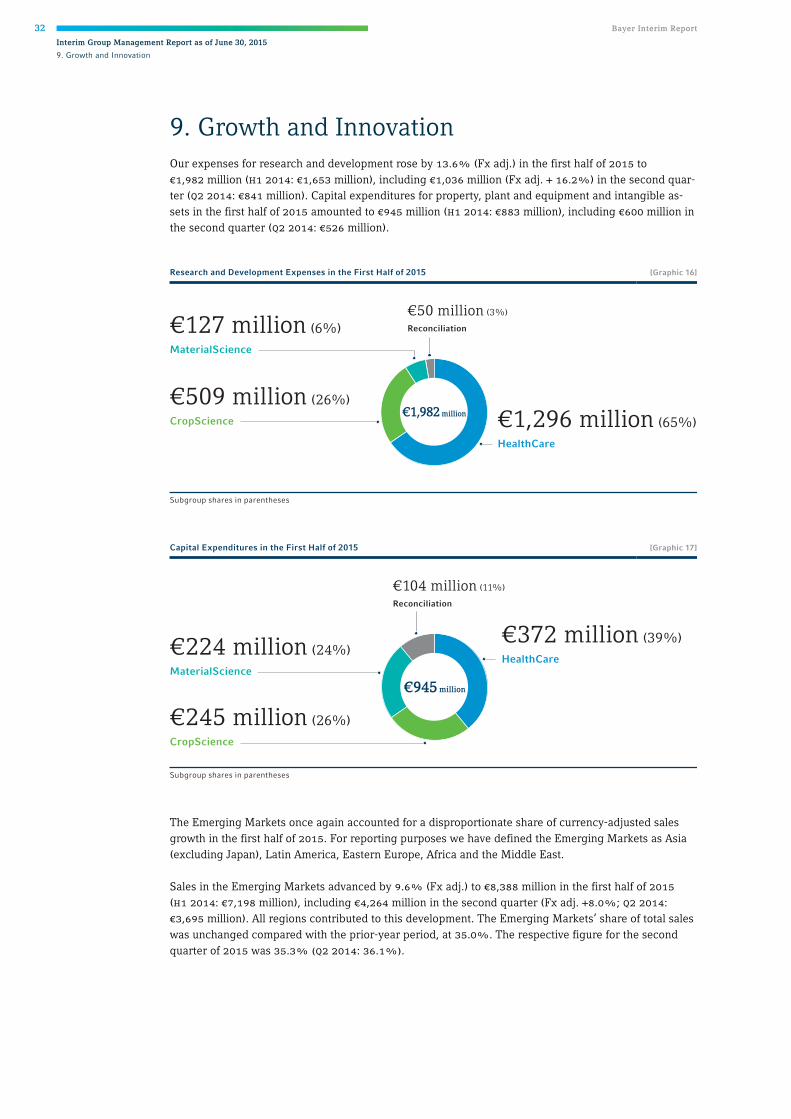
Cash outflows for capital expenditures 529 601 + 13.6 886 946 + 6.8 2,371
Research and development expenses 841 1,036 + 23.2 1,653 1,982 + 19.9 3,537
Depreciation, amortization and impairments 700 815 + 16.4 1,345 1,616 + 20.1 2,920
Number of employees at end of period9 112,556 117,798 + 4.7 112,556 117,798 + 4.7 117,371
Personnel expenses (including pension expenses) 2,366 2,750 + 16.2 4,749 5,630 + 18.6 9,693 2014 figures restated In some cases, the sum of the figures given in this report may not precisely equal the stated totals and percentages may not be exact due to rounding. 1 EBIT = earnings before financial result and taxes 2 EBIT before special items and EBITDA before special items are not defined in the International Financial Reporting Standards and should therefore be regarded only as
supplementary information. EBITDA before special items is a meaningful indicator of operating performance since it is not affected by depreciation, amortization, impairments or special items. By reporting this indicator, the company aims to give readers a clear picture of the results of operations and ensure comparability of data over time. See also Chapter 6 “Calculation of EBIT(DA) Before Special Items.”
3 The EBIT(DA) margin before special items is calculated by dividing EBIT(DA) before special items by sales. 4 EBITDA = EBIT plus amortization and impairment losses on intangible assets and depreciation and impairment losses on property, plant and equipment, minus impairment loss
reversals 5 Earnings per share as defined in IAS 33 = net income divided by the average number of shares 6 Core earnings per share are not defined in the International Financial Reporting Standards. By reporting this indicator, the company aims to give readers a clear picture of the
results of operations and ensure comparability of data over time. The calculation of core earnings per share is explained in Chapter 7 “Core Earnings Per Share." 7 Gross cash flow = income after income taxes, plus income taxes, plus financial result, minus income taxes paid or accrued, plus depreciation, amortization and impairment
losses, minus impairment loss reversals, plus / minus changes in pension provisions, minus gains / plus losses on retirements of noncurrent assets, minus gains from the remeasurement of already held assets in step acquisitions. The change in pension provisions includes the elimination of non-cash components of EBIT. It also contains benefit payments during the year. For details see Chapter 8 “Financial Position of the Bayer Group.”
8 Net cash flow = cash flow from operating activities according to IAS 7 9 Full-time equivalents
Bayer Interim Report 3
Contents
Contents
INTERIM GROUP MANAGEMENT REPORT AS OF JUNE 30, 2015 4
1. Overview of Sales, Earnings and Financial Position 5 2. Economic Outlook 7 3. Sales and Earnings Forecast 9 4. Corporate Structure 11 5. Business Development by Subgroup, Segment and Region 12
5.1 HealthCare 12 5.2 CropScience 18 5.3 MaterialScience 21 5.4 Business Development by Region 24
6. Calculation of EBIT(DA) Before Special Items 26 7. Core Earnings Per Share 28 8. Financial Position of the Bayer Group 29 9. Growth and Innovation 32
9.1 HealthCare 33 9.2 CropScience 36 9.3 MaterialScience 36
10. Employees 37 11. Opportunities and Risks 37 12. Events After the End of the Reporting Period 37 INVESTOR INFORMATION 38
CONDENSED CONSOLIDATED INTERIM FINANCIAL STATEMENTS
OF THE BAYER GROUP AS OF JUNE 30, 2015 39
Bayer Group Consolidated Income Statements 39 Bayer Group Consolidated Statements of Comprehensive Income 40 Bayer Group Consolidated Statements of Financial Position 41 Bayer Group Consolidated Statements of Cash Flows 42 Bayer Group Consolidated Statements of Changes in Equity 43 Notes to the Condensed Consolidated Interim Financial Statements of the Bayer Group as of June 30, 2015 44
Key Data per Segment and Region 44 Explanatory Notes 48
RESPONSIBILITY STATEMENT 59
REVIEW REPORT 60
Financial Calendar 61
Masthead 61
COVER PICTURE: Bayer researchers are working on new cancer treatments. Our cover picture shows laboratory technician Christina Scholl carrying out an experiment in the Bayer laboratory.

4 Bayer Interim Report
Interim Group Management Report as of June 30, 2015
Second Quarter of 2015
Bayer significantly improves earnings
// Very good business development at HealthCare
// CropScience performance steady in a weaker market
environment
// MaterialScience posts robust earnings growth
// Group sales €12.1 billion (+18.2%; Fx & portfolio adj. +3.7%)
// ebitda before special items €2.9 billion (+33.2%)
// ebit €1.8 billion (+27.7%)
// Net income €1.2 billion (+20.9%)
// Core earnings per share €1.98 (+33.8%)
// Group forecast 2015 for operational performance of
continuing operations confirmed and adjusted
for currency effects
The Bayer Group continued to grow sales in the second quarter of 2015 and significantly improved earnings. HealthCare posted considerable sales and earnings gains that were attributable to the further gratifying expansion of business with our recently launched pharmaceutical products and to the positive sales development in all Consumer Health divisions. Sales at CropScience matched the strong level of the prior-year quarter, while earnings improved. At MaterialScience, sales were level with the prior-year quarter. Earnings of the subgroup rose markedly, by almost 90%, particularly as a result of the improved demand situation and lower raw material costs. The preparations for the planned stock market flotation of MaterialScience are on schedule. We are confirming our Group forecast for the operational performance of continuing operations and adjusting our guidance to take account of the change in exchange rates as of June 30, 2015.
Bayer Interim Report 5
Interim Group Management Report as of June 30, 20151. Overview of Sales, Earnings and Financial Position
1. Overview of Sales, Earningsand Financial Position
SECOND QUARTER OF 2015
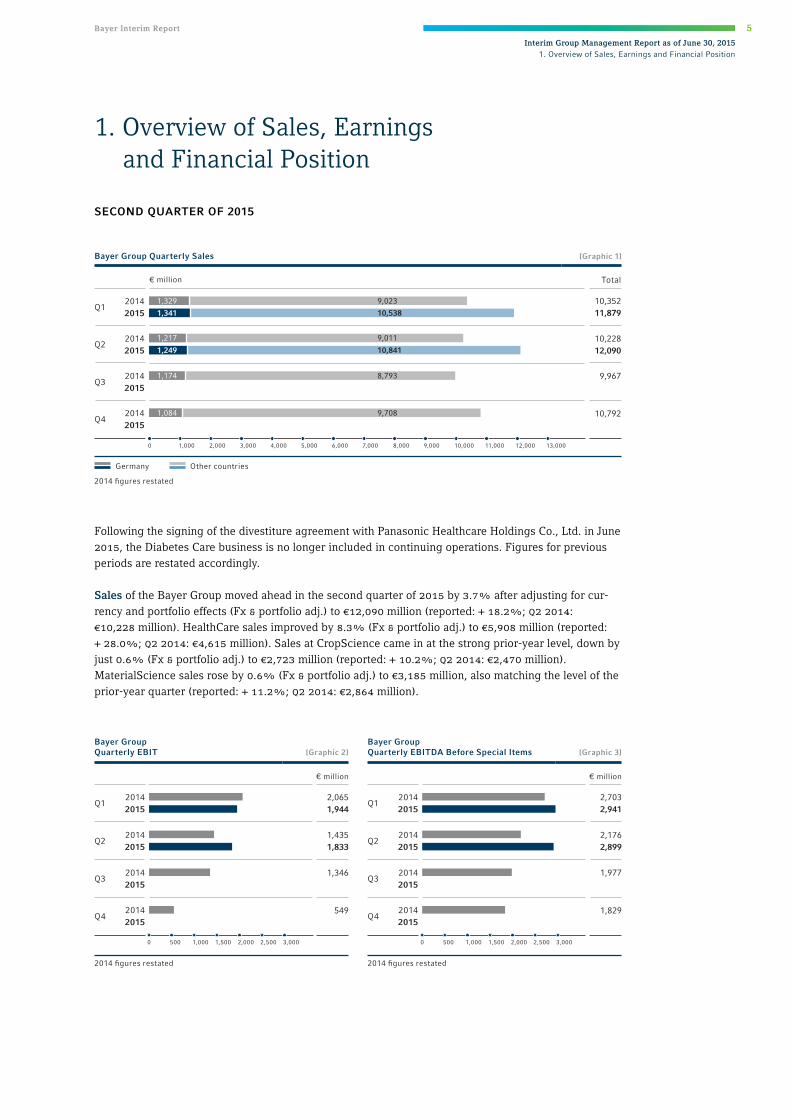
Following the signing of the divestiture agreement with Panasonic Healthcare Holdings Co., Ltd. in June 2015, the Diabetes Care business is no longer included in continuing operations. Figures for previous periods are restated accordingly.
Sales of the Bayer Group moved ahead in the second quarter of 2015 by 3.7% after adjusting for cur-rency and portfolio effects (Fx & portfolio adj.) to €12,090 million (reported: + 18.2%; q2 2014: €10,228 million). HealthCare sales improved by 8.3% (Fx & portfolio adj.) to €5,908 million (reported: + 28.0%; q2 2014: €4,615 million). Sales at CropScience came in at the strong prior-year level, down byjust 0.6% (Fx & portfolio adj.) to €2,723 million (reported: + 10.2%; q2 2014: €2,470 million).MaterialScience sales rose by 0.6% (Fx & portfolio adj.) to €3,185 million, also matching the level of theprior-year quarter (reported: + 11.2%; q2 2014: €2,864 million).
Bayer Group Quarterly Sales [Graphic 1]
Q1
Q2
Q3
Q4
€ million Total
0 1,000 2,000 3,000 4,000 5,000 6,000 7,000 8,000 9,000 13,00011,000 12,00010,000
Germany Other countries
20142015
20142015
20142015
20142015
10,792
10,35211,879
10,22812,090
9,967
10,538
9,023
1,341
10,8411,249
1,329
9,0111,217
8,7931,174
9,7081,084
2014 fi gures restated
Bayer GroupQuarterly EBIT [Graphic 2]
Bayer GroupQuarterly EBITDA Before Special Items [Graphic 3]
5000 1,000 1,500 3,0002,5002,000 5000 1,000 1,500 3,0002,5002,000
20142015
20142015
20142015
20142015
Q2
Q3
Q4
Q1
€ million€ million
Q2
Q3
Q4
20142015
20142015
20142015
20142015
Q12,0651,944
1,4351,833
1,346
549
2,7032,941
2,1762,899
1,977
1,829
2014 fi gures restated 2014 fi gures restated

6 Bayer Interim Report
Interim Group Management Report as of June 30, 2015
1. Overview of Sales, Earnings and Financial Position
ebit of the Bayer Group climbed by a substantial 27.7% to €1,833 million (q2 2014: €1,435 million) after net special charges of €255 million (q2 2014: €48 million). These mainly comprised €74 million from the revaluation of other receivables and €55 million in costs for the integration of acquired busi-nesses. Also included under special items are expenses of €41 million for the planned stock market flotation of MaterialScience, €32 million for efficiency improvement measures and €28 million for the consolidation of production sites. ebit before special items rose by 40.8% to €2,088 million (q2 2014: €1,483 million).
ebitda before special items came in 33.2% ahead of the prior-year period at €2,899 million (q2 2014: €2,176 million). The good sales development was accompanied by higher r&d and selling expenses. Positive currency effects buoyed earnings by about €260 million. At HealthCare, ebitda before special items rose by a considerable 27.5% to €1,675 million (q2 2014: €1,314 million). This was chiefly at-tributable to the continuing very good development of business at Pharmaceuticals and Consumer Health, the contribution from the acquired consumer care businesses, and currency effects of around €110 million. ebitda before special items of CropScience advanced by 19.2% to €733 million (q2 2014: €615 million), driven by a positive currency effect of around €70 million. MaterialScience registered a significant 87.4% increase in ebitda before special items to €506 million (q2 2014: €270 million). This was the result of considerably lower raw material costs – which more than compensated the decline in selling prices – higher volumes, and positive currency effects of €80 million. Earnings of the reconcilia-tion improved year on year largely on account of lower expenses for long-term stock-based compensa-tion.
After a financial result of minus €287 million (q2 2014: minus €173 million), income before income taxes was €1,546 million (q2 2014: €1,262 million). After income tax expense of €405 million (q2 2014: €343 million) and non-controlling interest, net income in the second quarter of 2015 came to €1,152 million (q2 2014: €953 million). Earnings per share were €1.39 (q2 2014: €1.15). Core earnings per share advanced by 33.8% to €1.98 (q2 2014: €1.48), calculated as explained in Chapter 7 “Core Earnings Per Share.”
Gross cash flow from continuing operations in the second quarter of 2015 advanced by 30.5% to €2,173 million (q2 2014: €1,665 million) due to the improvement in ebitda. Net cash flow (total) rose by 22.4% to €1,959 million (q2 2014: €1,601 million) despite an increase in cash tied up in working capi-tal. We paid income taxes of €352 million in the second quarter of 2015 (q2 2014: €360 million).
Net financial debt declined slightly, from €21.3 billion on March 31, 2015, to €21.1 billion on June 30, 2015. Cash inflows from operating activities and positive currency effects offset the outflow for the dividend payment. The net defined benefit liability for post-employment benefits – the difference be-tween benefit obligations and plan assets – decreased from €13.6 billion to €11.1 billion over the same period due to a rise in long-term capital market interest rates for high-quality corporate bonds.
Quarterly Gross Cash FlowFrom Continuing Operations [Graphic 4]
Quarterly Net Cash FlowFrom Continuing Operations [Graphic 5]
20142015
20142015
20142015
20142015
20142015
20142015
Q2Q2
Q3Q3
Q1Q1
20142015
20142015
Q4Q4
2,0182,011
1,6652,173
1,466
1,558
144677
1,5691,950
1,781
2,203
€ million€ million
5000 1,000 1,500 2,5002,000 5000 1,000 1,500 2,5002,000
2014 fi gures restated 2014 fi gures restated

Bayer Interim Report 7
Interim Group Management Report as of June 30, 20152. Economic Outlook
FIRST HALF OF 2015 Sales of the Bayer Group rose in the first half of 2015. Our HealthCare business was the main driver of this growth, while CropScience and MaterialScience matched the prior-year level. Group ebitda before special items improved significantly, with all subgroups, particularly HealthCare and MaterialScience, contributing to this improvement.
Sales increased by 3.2% (Fx & portfolio adj.) to €23,969 million (reported: + 16.5%; h1 2014: €20,580 million). HealthCare sales grew by 7.7% on a currency- and portfolio-adjusted basis (reported: + 27.0%). Despite the difficult market environment, sales of CropScience were flat year on year (Fx & portfolio adj.: + 0.2%; reported: + 8.3%). Sales of MaterialScience also matched the prior-year level (Fx & portfolio adj.: minus 0.7%; reported: + 9.4%).
ebit climbed by 7.9% to €3,777 million (h1 2014: €3,500 million). There were net special charges of €499 million (h1 2014: €41 million). ebit before special items rose by 20.8% to €4,276 million (h1 2014: €3,541 million). ebitda before special items increased by 19.7% to €5,840 million (h1 2014: €4,879 million), reflecting positive currency effects of about €300 million and additional r&d expenses of roughly €320 million.
After a financial result of minus €561 million (h1 2014: minus €332 million), income before income taxes was €3,216 million (h1 2014: €3,168 million). The financial result mainly comprised net interest expense of €288 million (h1 2014: €86 million), interest cost of €148 million (h1 2014: €139 million) for pension and other provisions, and exchange losses of €122 million (h1 2014: €85 million). After tax expense of €811 million (h1 2014: €851 million), income after income taxes was €2,467 million (h1 2014: €2,380 million).
After non-controlling interest, net income amounted to €2,455 million (h1 2014: €2,376 million). Earn-ings per share rose to €2.97 (h1 2014: €2.87), and core earnings per share (calculated as explained in Chapter 7) to €4.02 (h1 2014: €3.40).
Gross cash flow from continuing operations climbed by 13.6% to €4,184 million (h1 2014: €3,683 million). Net cash flow (total) rose sharply by 52.1% to €2,683 million (h1 2014: €1,764 million) due to a reduction in cash tied up in working capital. This figure reflected income tax payments of €796 million (h1 2014: €735 million). Net financial debt rose to €21.1 billion as of June 30, 2015, com-pared with €19.6 billion on December 31, 2014. The net defined benefit liability for post-employment benefits declined from €12.2 billion on December 31, 2014, to €11.1 billion, mainly due to a rise in long-term capital market interest rates for high-quality corporate bonds.
2. Economic Outlook
Economic Outlook [Table 1]
Growth1 2014 Growth1 forecast
2015
World + 2.8% + 2.6%
European Union + 1.4% + 1.8%
of which Germany + 1.6% + 1.7%
United States + 2.4% + 2.2%
Emerging markets2 + 4.4% + 3.9% 1 real growth of gross domestic product, source: IHS Global Insight 2 including about 50 countries defined by IHS Global Insight as emerging markets in line with the World Bank as of July 2015

8 Bayer Interim Report
Interim Group Management Report as of June 30, 2015
2. Economic Outlook
The global economy is likely to grow in 2015 at the same pace as in the previous year, supported by a generally expansionary monetary policy and the sharp decline in oil prices. Following a weak first quar-ter, the pace of growth is expected to decline slightly in the United States. We expect the economic recovery in the European Union to continue, although significant risks still exist in the eurozone. The rate of expansion in the emerging countries is likely to weaken again slightly on average.
The pharmaceuticals market is likely to grow slightly more slowly in 2015 than in the previous year, especially because of the lower growth rate predicted for this market in the United States. Following double-digit growth in the u.s. last year, which was driven by new product introductions and health system reforms, this market will probably expand at a slower rate in 2015, partly as a result of new patent expirations and launches of further generic products. We expect demand to be stable in the emerging economies.
Growth in the consumer care market in 2015 is likely to be level with the previous year. At Medical Care – our business with contrast agents and medical devices – we anticipate slight market growth. The animal health market is anticipated to grow at about the same rate as in 2014.
We expect the global seed and crop protection market to develop considerably more weakly in 2015 than in previous years. We anticipate stagnation or only very slight growth, mainly as a result of the low price level for agricultural commodities, which could have a negative effect on farmers’ yield expecta-tions and, in turn, their investment decisions.
In view of the stable global economic climate, we continue to predict positive growth momentum in the main customer industries of MaterialScience in 2015.
Economic Outlook for the Subgroups [Table 2]
Growth1 2014 Growth1 forecast
2015
HealthCare
Pharmaceuticals market + 8% + 6%
Consumer care market + 4% + 4%
Medical care market – 1% + 1%
Animal health market + 5% + 5%
CropScience
Seed and crop protection market + 6% ≤ 1%
MaterialScience
(main customer industries)
Automotive + 3% + 3%
Construction + 4% + 4%
Electrical / electronics + 4% + 5%
Furniture + 4% + 4% 1 Bayer’s estimate; except pharmaceuticals. Source for pharmaceuticals market: IMS Health, IMS Market Prognosis. Copyright 2015.
All rights reserved; currency-adjusted; 2014 data provisional as of July 2015

Bayer Interim Report 9
Interim Group Management Report as of June 30, 20153. Sales and Earnings Forecast
3. Sales and Earnings Forecast The following forecast for 2015 is based on the business development described in this report, taking into account the potential risks and opportunities.
BAYER GROUP We have adjusted the exchange rates on which our forecast is based to reflect current developments. With respect to the second half of 2015, we are now using the exchange rates prevailing on June 30, 2015. Following the signing of the divestiture agreement with Panasonic Healthcare Holdings Co., Ltd. in June 2015, the Diabetes Care business is no longer included in continuing operations and therefore is also not included in the updated forecast. The prior-year figures are restated. The Diabetes Care busi-ness was still included in the forecasts published in February and April 2015. The aforementioned ef-fects taken together result in an adjustment of the forecast; however, our expectation regarding the company’s operating performance remains largely unchanged.
We are now planning sales in the region of €47 billion (previously: in the region of €48 billion to €49 billion, of which discontinued operations: approximately €0.9 billion). This still corresponds to a low-single-digit percentage increase on a currency- and portfolio-adjusted basis. We expect currency effects to boost sales by approximately 7% (previously: approximately 9%) compared with the prior year. It remains our aim to raise ebitda before special items by a high-teens percentage, allowing for expected positive currency effects of about 5% (previously: around 8%). We continue to target a high-teens percentage increase in core earnings per share (calculated as explained in Chapter 7), allowing for expected positive currency effects of around 5% (previously: around 7%).
We now expect to take special charges in the region of €900 million, with the integration of the acquired consumer care businesses, the planned stock market listing of MaterialScience and the optimization of production structures accounting for most of this amount.
We continue to anticipate the financial result to come in at around minus €1 billion and the effective tax rate at around 25% in 2015. As before, we expect net financial debt at year end to be below €20 billion.
Further details of the business forecast are given in Chapter 20.2 of the Annual Report 2014.
Group sales
ebitda before special items
Plus approx. 7%(previously: plus approx. 9%)
Low-single-digit percentage increase1
Low-single-digit percentage increase1
€48 billion to €49 billion Approx. €47 billion
Forecast 2015(April 2015)
Revised forecast 2015continuing operations
Currency effects allowed for in the forecast2
High-teens percentage increase
High-teens percentage increase
Plus approx. 5%(previously: plus approx. 8%)
1 currency- and portfolio-adjusted2 2015 forecast based for the fi rst half on average exchange rates and for the second half on June 30, 2015 closing rates
Core earnings per share
High-teens percentage increase
High-teens percentage increase
Plus approx. 5%(previously: plus approx. 7%)

10 Bayer Interim Report
Interim Group Management Report as of June 30, 2015
3. Sales and Earnings Forecast
HEALTHCARE At HealthCare we now expect sales from continuing operations to rise to approximately €23 billion (previously: over €24 billion). This corresponds to a mid-single-digit percentage increase on a currency- and portfolio-adjusted basis. We predict positive currency effects of approximately 6% (previously: about 9%) compared with 2014. We plan to raise ebitda before special items by a low-twenties per-centage.
We continue to expect sales in the Pharmaceuticals segment to move ahead to approximately €14 billion. This corresponds to a mid- to high-single-digit percentage increase on a currency- and portfolio-adjusted basis. We anticipate positive currency effects of approximately 6% (previously: about 9%) compared with 2014. We intend to raise sales of our recently launched products to over €4 billion. We plan to raise ebitda before special items by a mid-teens percentage.
In the Consumer Health segment, we now expect sales of over €9 billion (previously: over €10 billion), including those of the acquired consumer care businesses but excluding the Diabetes Care business. We plan to grow sales by a mid-single-digit percentage on a currency- and portfolio-adjusted basis. We anticipate positive currency effects of approximately 7% (previously: about 9%) compared with 2014. We expect to raise ebitda before special items by a mid-thirties percentage, with the acquired consum-er care businesses contributing to the increase.
CROPSCIENCE At CropScience we expect to continue growing faster than the market and aim to raise sales to approx-imately €10.5 billion (previously: around €11 billion). This corresponds to a low-single-digit percentage increase on a currency- and portfolio-adjusted basis (previously: a low- to mid-single digit percentage increase). We anticipate positive currency effects of about 8% (previously: about 11%) compared with 2014. In view of the weakened market environment, we now plan to improve ebitda before special items by a mid- to high-single-digit percentage (previously: a low- to mid-teens percentage).
MATERIALSCIENCE At MaterialScience we continue to plan further volume growth in 2015 accompanied by declining sell-ing prices. This will lead to lower sales on a currency- and portfolio-adjusted basis. However, we con-tinue to expect to see a significant increase in ebitda before special items. We aim to return to earning the full cost of capital in 2015.
After adjusting for currency and portfolio effects, we expect sales in the third quarter of 2015 to come in below the level of the prior-year quarter. We expect ebitda before special items to be above the level of the prior-year quarter but below the previous quarter.
RECONCILIATION For 2015 we continue to expect sales on a currency- and portfolio-adjusted basis to be level with the previous year. We expect ebitda before special items to be in the region of minus €0.3 billion.

Bayer Interim Report 11
Interim Group Management Report as of June 30, 20154. Corporate Structure
4. Corporate Structure Bayer AG, headquartered in Leverkusen, Germany, is the strategic management holding company for the Bayer Group. Business operations are conducted by the HealthCare, CropScience and Material-Science subgroups.
Our subgroups are supported by the Business Services, Technology Services and Currenta service com-panies, which are reported in the reconciliation as “All Other Segments” along with “Corporate Center and Consolidation.”
CHANGES IN CORPORATE STRUCTURE Following the signing of the divestiture agreement in June 2015, the Diabetes Care business is recog-nized under discontinued operations. The Medical Care Division now only comprises the business with contrast agents and medical devices. All data and prior-year figures are restated accordingly unless otherwise indicated.
Restated 2014 fi gures in parentheses
Sales in the 1st Half of 2015 [Graphic 6]
48% (43%)HealthCarePharmaceuticals 28% (26%)
Consumer Health 20% (17%)
24% (28%)CropScience
2% (2%)
Reconciliation
26% (27%)MaterialScience
€24.0 billion(€20.6 billion)
Key Data by Subgroup and Segment [Table 3]
Sales EBIT EBITDA
before special items1
2nd Quarter
2014 2nd Quarter
2015 2nd Quarter
2014 2nd Quarter
2015 2nd Quarter
2014 2nd Quarter
2015
€ million € million € million € million € million € million
HealthCare 4,615 5,908 927 1,068 1,314 1,675
Pharmaceuticals 2,960 3,492 656 706 927 1,077
Consumer Health 1,655 2,416 271 362 387 598
CropScience 2,470 2,723 470 571 615 733
MaterialScience 2,864 3,185 109 278 270 506
Reconciliation 279 274 (71) (84) (23) (15)
Group 10,228 12,090 1,435 1,833 2,176 2,899
1st Half
2014 1st Half
2015 1st Half
2014 1st Half
2015 1st Half
2014 1st Half
2015
HealthCare 8,984 11,412 1,858 2,054 2,580 3,231
Pharmaceuticals 5,742 6,692 1,297 1,397 1,800 2,065
Consumer Health 3,242 4,720 561 657 780 1,166
CropScience 5,370 5,815 1,458 1,445 1,713 1,773
MaterialScience 5,667 6,199 328 497 636 930
Reconciliation 559 543 (144) (219) (50) (94)
Group 20,580 23,969 3,500 3,777 4,879 5,840 2014 figures restated 1 For definition see Chapter 6 “Calculation of EBIT(DA) Before Special Items.”
12 Bayer Interim Report
Interim Group Management Report as of June 30, 2015
5. Business Development by Subgroup, Segment and Region
5. Business Development by Subgroup, Segment and Region
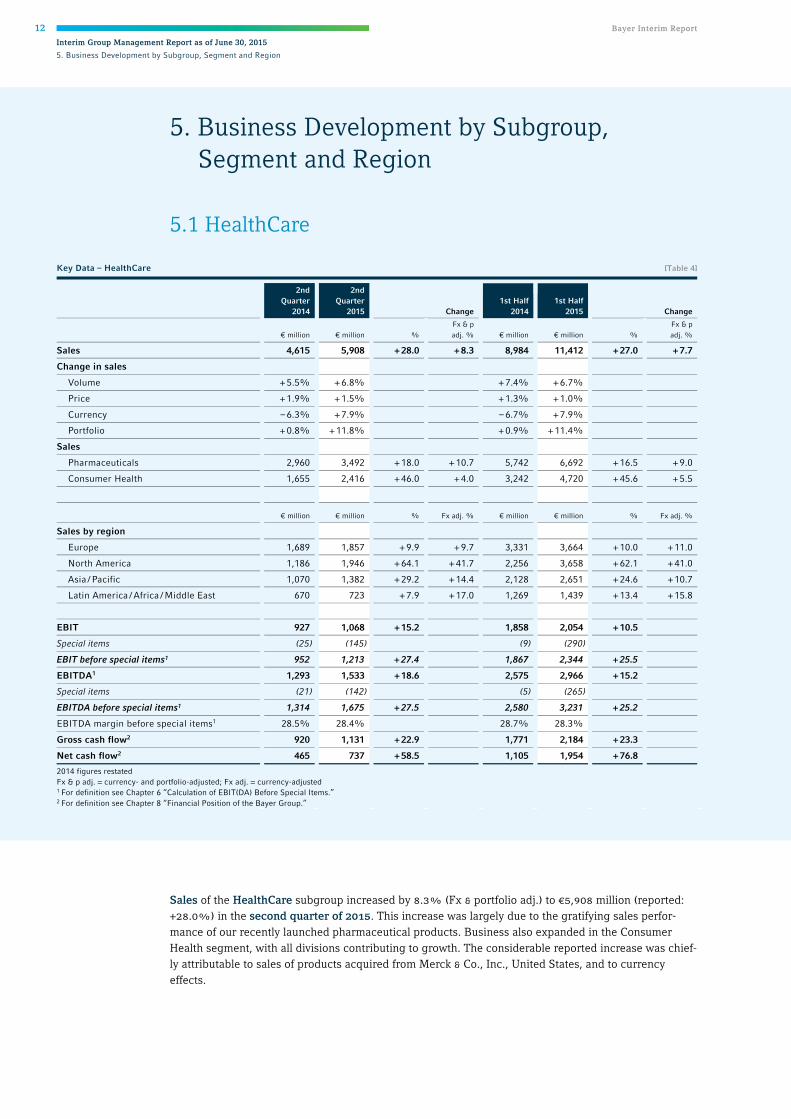
5.1 HealthCare
Sales of the HealthCare subgroup increased by 8.3% (Fx & portfolio adj.) to €5,908 million (reported: +28.0%) in the second quarter of 2015. This increase was largely due to the gratifying sales perfor-mance of our recently launched pharmaceutical products. Business also expanded in the Consumer Health segment, with all divisions contributing to growth. The considerable reported increase was chief-ly attributable to sales of products acquired from Merck & Co., Inc., United States, and to currency effects.
Key Data – HealthCare [Table 4]
2nd Quarter
2014
2nd Quarter
2015 Change 1st Half
2014 1st Half
2015 Change
€ million € million %
Fx & p
adj. % € million € million %
Fx & p
adj. %
Sales 4,615 5,908 + 28.0 + 8.3 8,984 11,412 + 27.0 + 7.7
Change in sales
Volume + 5.5% + 6.8% + 7.4% + 6.7%
Price + 1.9% + 1.5% + 1.3% + 1.0%
Currency – 6.3% + 7.9% – 6.7% + 7.9%
Portfolio + 0.8% + 11.8% + 0.9% + 11.4%
Sales
Pharmaceuticals 2,960 3,492 + 18.0 + 10.7 5,742 6,692 + 16.5 + 9.0
Consumer Health 1,655 2,416 + 46.0 + 4.0 3,242 4,720 + 45.6 + 5.5
€ million € million % Fx adj. % € million € million % Fx adj. %
Sales by region
Europe 1,689 1,857 + 9.9 + 9.7 3,331 3,664 + 10.0 + 11.0
North America 1,186 1,946 + 64.1 + 41.7 2,256 3,658 + 62.1 + 41.0
Asia / Pacific 1,070 1,382 + 29.2 + 14.4 2,128 2,651 + 24.6 + 10.7
Latin America / Africa / Middle East 670 723 + 7.9 + 17.0 1,269 1,439 + 13.4 + 15.8
EBIT 927 1,068 + 15.2 1,858 2,054 + 10.5
Special items (25) (145) (9) (290)
EBIT before special items1 952 1,213 + 27.4 1,867 2,344 + 25.5
EBITDA1 1,293 1,533 + 18.6 2,575 2,966 + 15.2
Special items (21) (142) (5) (265)
EBITDA before special items1 1,314 1,675 + 27.5 2,580 3,231 + 25.2
EBITDA margin before special items1 28.5% 28.4% 28.7% 28.3%
Gross cash flow2 920 1,131 + 22.9 1,771 2,184 + 23.3
Net cash flow2 465 737 + 58.5 1,105 1,954 + 76.8 2014 figures restated Fx & p adj. = currency- and portfolio-adjusted; Fx adj. = currency-adjusted 1 For definition see Chapter 6 “Calculation of EBIT(DA) Before Special Items.” 2 For definition see Chapter 8 “Financial Position of the Bayer Group.”

Bayer Interim Report 13
Interim Group Management Report as of June 30, 20155. Business Development by Subgroup, Segment and Region
ebit of HealthCare improved by 15.2% in the second quarter of 2015 to €1,068 million (q2 2014: €927 million), reflecting special charges of €145 million (q2 2014: €25 million). ebit before special items improved considerably by 27.4% to €1,213 million (q2 2014: €952 million). ebitda before special items increased by a substantial 27.5% to €1,675 million (q2 2014: €1,314 million). The continued very good business development at Pharmaceuticals and Consumer Health – which at Consumer Care was due mainly to the acquired businesses – resulted in positive earnings contributions, as did currency effects of approximately €110 million. Earnings were held back in particular by an increase in research and development expenses at Pharmaceuticals.
2014 fi gures restated
Q1
Q4
Q2
Q3
€ million
0 500 1,000 1,500 2,000 2,500 3,000 3,500 6,0005,5005,0004,5004,000
HealthCare Quarterly Sales [Graphic 7]
20142015
20142015
20142015
20142015
4,3695,504
5,351
4,6155,908
4,740
2014 fi gures restated 2014 fi gures restated
Q2 Q2
Q3 Q3
Q4 Q4
Q1 Q1
€ million € million
5000 1,000 2,0001,5000 400200 600 1,2001,000800
HealthCareQuarterly EBIT [Graphic 8]
HealthCareQuarterly EBITDA Before Special Items [Graphic 9]
20142015
20142015
20142015
20142015
20142015
20142015
20142015
20142015
931986
9271,068
1,062
550
1,2661,556
1,3141,675
1,368
1,409

14 Bayer Interim Report
Interim Group Management Report as of June 30, 2015
5. Business Development by Subgroup, Segment and Region
PHARMACEUTICALS
Sales of our Pharmaceuticals segment rose by a substantial 10.7% (Fx & portfolio adj.) to €3,492 million in the second quarter of 2015. Our recently launched products Xarelto™, Eylea™, Stivarga™, Xofigo™ and Adempas™ continued to experience dynamic growth, posting combined sales of €1,051 million (q2 2014: €702 million). The Pharmaceuticals business grew in all regions on a currency-adjusted basis.
Key Data – Pharmaceuticals [Table 5]
2nd Quarter
2014
2nd Quarter
2015 Change 1st Half
2014 1st Half
2015 Change
€ million € million %
Fx & p
adj. % € million € million %
Fx & p
adj. %
Sales 2,960 3,492 + 18.0 + 10.7 5,742 6,692 + 16.5 + 9.0
€ million € million %
Fx adj.
% € million € million %
Fx adj.
%
Sales by region
Europe 1,091 1,232 + 12.9 + 12.3 2,126 2,363 + 11.1 + 11.3
North America 671 864 + 28.8 + 8.0 1,262 1,625 + 28.8 + 9.1
Asia / Pacific 797 998 + 25.2 + 9.9 1,598 1,913 + 19.7 + 5.7
Latin America / Africa / Middle East 401 398 – 0.7 + 12.5 756 791 + 4.6 + 9.7
EBIT 656 706 + 7.6 1,297 1,397 + 7.7
Special items (12) (74) 4 (98)
EBIT before special items1 668 780 + 16.8 1,293 1,495 + 15.6
EBITDA1 919 1,007 + 9.6 1,808 1,971 + 9.0
Special items (8) (70) 8 (94)
EBITDA before special items1 927 1,077 + 16.2 1,800 2,065 + 14.7
EBITDA margin before special items1 31.3% 30.8% 31.3% 30.9%
Gross cash flow2 662 720 + 8.8 1,236 1,410 + 14.1
Net cash flow2 292 433 + 48.3 739 1,185 + 60.4 Fx & p adj. = currency- and portfolio-adjusted; Fx adj. = currency-adjusted 1 For definition see Chapter 6 “Calculation of EBIT(DA) Before Special Items.” 2 For definition see Chapter 8 “Financial Position of the Bayer Group.”
Best-Selling Pharmaceuticals Products [Table 6]
2nd Quarter
2014
2nd Quarter
2015 Change 1st Half
2014 1st Half
2015 Change
€ million € million % Fx adj.
% € million € million % Fx adj.
%
Xarelto™ 381 549 + 44.1 + 42.6 723 1,031 + 42.6 + 40.6
Kogenate™ 243 299 + 23.0 + 14.3 513 560 + 9.2 + 1.6
Eylea™ 194 301 + 55.2 + 49.1 351 554 + 57.8 + 51.8
Mirena™ product family 208 270 + 29.8 + 11.1 386 502 + 30.1 + 12.5
Betaferon™ / Betaseron™ 216 222 + 2.8 – 8.8 406 430 + 5.9 – 5.2
Nexavar™ 196 231 + 17.9 + 7.1 379 427 + 12.7 + 1.9
YAZ™ / Yasmin™ / Yasminelle™ 191 174 – 8.9 – 9.8 372 355 – 4.6 – 6.6
Adalat™ 156 168 + 7.7 – 3.9 296 330 + 11.5 – 0.7
Aspirin™ Cardio 117 127 + 8.5 – 2.3 232 263 + 13.4 + 3.0
Glucobay™ 106 129 + 21.7 – 0.3 208 259 + 24.5 + 3.9
Avalox™ / Avelox™ 92 99 + 7.6 + 0.7 200 209 + 4.5 – 4.1
Stivarga™ 61 92 + 50.8 + 33.0 115 163 + 41.7 + 24.0
Xofigo™ 43 65 + 51.2 + 30.5 79 119 + 50.6 + 29.4
Levitra™ 62 53 – 14.5 – 14.2 124 106 – 14.5 – 15.8
Fosrenol™ 33 47 + 42.4 + 37.7 80 85 + 6.3 + 0.9
Total 2,299 2,826 + 22.9 + 13.9 4,464 5,393 + 20.8 + 11.9
Proportion of Pharmaceuticals sales 78% 81% 78% 81% Fx adj. = currency-adjusted
Bayer Interim Report 15
Interim Group Management Report as of June 30, 20155. Business Development by Subgroup, Segment and Region
Our new oral anticoagulant Xarelto™ maintained its strong growth momentum. We registered substan-tial volume increases in all regions, especially in Europe and Japan. Business with Xarelto™ also devel-oped very positively in the United States, where it is marketed by a subsidiary of Johnson & Johnson. We posted further robust gains for our eye medicine Eylea™ mainly as a result of very good business in Europe and Japan after marketing authorization was granted in further indications. Our cancer drug Stivarga™ benefited from positive development in the United States and particularly from the reversal of a rebate provision in France. A further positive contribution to sales development came from the cancer drug Xofigo™, particularly in Europe. Sales of Adempas™ to treat pulmonary hypertension amounted to €44 million (q2 2014: €23 million) and reflected the proportionate recognition of the one-time payment resulting from the sGC collaboration with Merck & Co., United States.
Higher sales of our blood-clotting drug Kogenate™ were chiefly attributable to shifts in order patterns. The hormone-releasing intrauterine devices of the Mirena™ product family – Mirena™ and Jaydess™ / Skyla™ – posted encouraging development, largely as a result of higher volumes in the United States. We also registered sales gains for our cancer drug Nexavar™, particularly in the United States.
Business with our multiple sclerosis drug Betaferon™ / Betaseron™ was down overall, due partly to increased competition in Europe and the United States. Receding sales of our yaz™ / Yasmin™ /
Yasminelle™ line of oral contraceptives resulted from lower demand in Europe and the United States.
ebit of the Pharmaceuticals segment rose by 7.6% in the second quarter of 2015 to €706 million. This figure reflected special charges of €74 million (q2 2014: €12 million) that mainly comprised €54 million from the revaluation of other receivables and €18 million in costs for efficiency improvement measures. ebit before special items increased by 16.8% to €780 million. ebitda before special items improved by 16.2% to €1,077 million. This earnings growth was primarily attributable to the ongoing good develop-ment of business, particularly for our recently launched products, and to positive currency effects of about €70 million. Earnings were diminished as expected by increased investment in research and development.
Sales of the Pharmaceuticals segment rose by 9.0% (Fx & portfolio adj.) in the first half of 2015 to €6,692 million. This increase was driven by our recently launched products Xarelto™, Eylea™, Stivarga™, Xofigo™ and Adempas™, which generated combined sales of €1,948 million (h1 2014: €1,300 million). Pharmaceutical sales moved ahead in all regions.
ebit for the first half of 2015 advanced by 7.7% to €1,397 million after special charges of €98 million (h1 2014: special gains of €4 million) that mainly comprised €54 million from the revaluation of other receivables and €28 million in costs for efficiency improvement measures. ebit before special items advanced by 15.6% to €1,495 million. ebitda before special items improved by 14.7% to €2,065 million after positive currency effects of about €100 million.

16 Bayer Interim Report
Interim Group Management Report as of June 30, 2015
5. Business Development by Subgroup, Segment and Region
CONSUMER HEALTH
Sales of the Consumer Health segment climbed by 4.0% (Fx & portfolio adj.) to €2,416 million in the second quarter of 2015, with all divisions contributing to this growth. The significant reported increase in sales in the Consumer Care Division resulted from the products added through the recent acquisitions.
Following the signing of the divestiture agreement in June 2015, the Diabetes Care business is recognized under discontinued operations. The Medical Care Division now only comprises the business with contrast agents and medical devices. All data and prior-year figures are restated accordingly.
Key Data – Consumer Health [Table 7]
2nd Quarter
2014
2nd Quarter
2015 Change 1st Half
2014 1st Half
2015 Change
€ million € million %
Fx & p
adj. % € million € million %
Fx & p
adj. %
Sales 1,655 2,416 + 46.0 + 4.0 3,242 4,720 + 45.6 + 5.5
Consumer Care 932 1,590 + 70.6 + 3.2 1,855 3,146 + 69.6 + 5.8
Animal Health 358 428 + 19.6 + 6.4 688 814 + 18.3 + 6.3
Medical Care 365 398 + 9.0 + 3.8 699 760 + 8.7 + 4.0
€ million € million %
Fx adj.
% € million € million %
Fx adj.
%
Sales by region
Europe 598 625 + 4.5 + 4.8 1,205 1,301 + 8.0 + 10.5
North America 515 1,082 + 110.1 + 85.4 994 2,033 + 104.5 + 81.5
Asia / Pacific 273 384 + 40.7 + 27.5 530 738 + 39.2 + 25.8
Latin America / Africa / Middle East 269 325 + 20.8 + 23.8 513 648 + 26.3 + 24.8
EBIT 271 362 + 33.6 561 657 + 17.1
Special items (13) (71) (13) (192)
EBIT before special items1 284 433 + 52.5 574 849 + 47.9
EBITDA1 374 526 + 40.6 767 995 + 29.7
Special items (13) (72) (13) (171)
EBITDA before special items1 387 598 + 54.5 780 1,166 + 49.5
EBITDA margin before special items1 23.4% 24.8% 24.1% 24.7%
Gross cash flow2 258 411 + 59.3 535 774 + 44.7
Net cash flow2 173 304 + 75.7 366 769 + 110.1 2014 figures restated Fx & p adj. = currency- and portfolio-adjusted; Fx adj. = currency-adjusted 1 For definition see Chapter 6 “Calculation of EBIT(DA) Before Special Items.” 2 For definition see Chapter 8 “Financial Position of the Bayer Group.”
Bayer Interim Report 17
Interim Group Management Report as of June 30, 20155. Business Development by Subgroup, Segment and Region
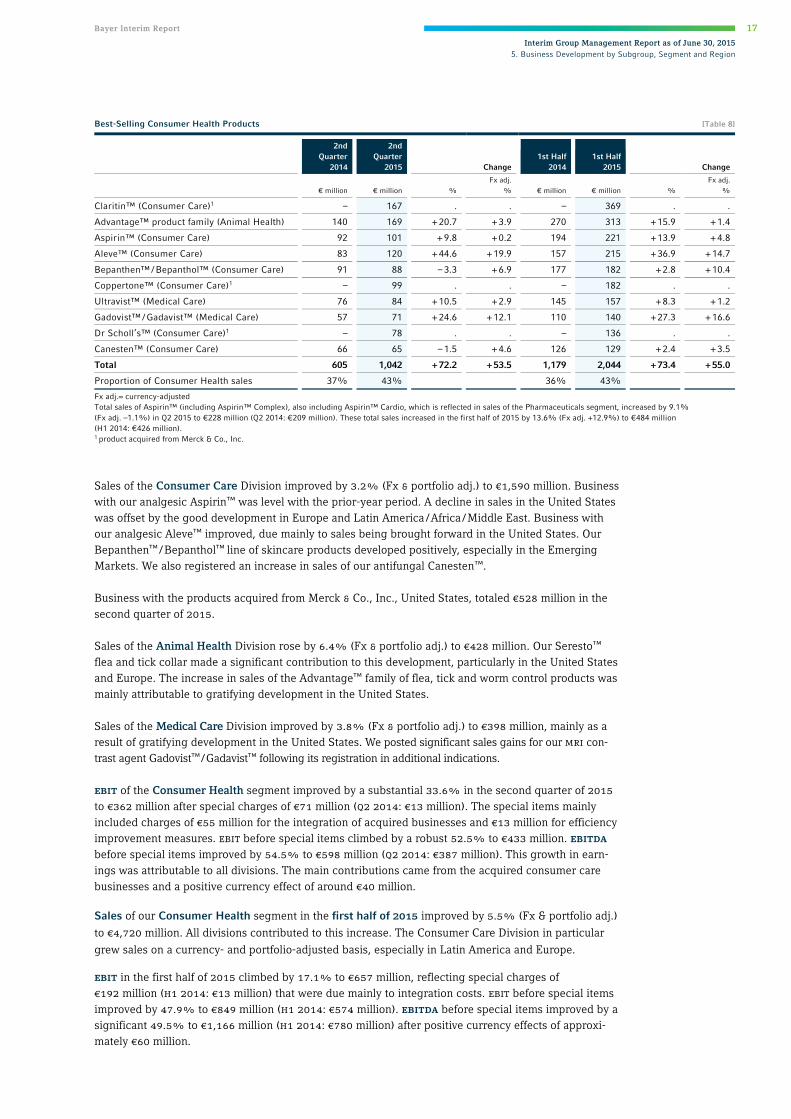
Sales of the Consumer Care Division improved by 3.2% (Fx & portfolio adj.) to €1,590 million. Business with our analgesic Aspirin™ was level with the prior-year period. A decline in sales in the United States was offset by the good development in Europe and Latin America / Africa / Middle East. Business with our analgesic Aleve™ improved, due mainly to sales being brought forward in the United States. Our Bepanthen™ / Bepanthol™ line of skincare products developed positively, especially in the Emerging Markets. We also registered an increase in sales of our antifungal Canesten™.
Business with the products acquired from Merck & Co., Inc., United States, totaled €528 million in the second quarter of 2015.
Sales of the Animal Health Division rose by 6.4% (Fx & portfolio adj.) to €428 million. Our Seresto™ flea and tick collar made a significant contribution to this development, particularly in the United States and Europe. The increase in sales of the Advantage™ family of flea, tick and worm control products was mainly attributable to gratifying development in the United States.
Sales of the Medical Care Division improved by 3.8% (Fx & portfolio adj.) to €398 million, mainly as a result of gratifying development in the United States. We posted significant sales gains for our mri con-trast agent Gadovist™ / Gadavist™ following its registration in additional indications.
ebit of the Consumer Health segment improved by a substantial 33.6% in the second quarter of 2015 to €362 million after special charges of €71 million (q2 2014: €13 million). The special items mainly included charges of €55 million for the integration of acquired businesses and €13 million for efficiency improvement measures. ebit before special items climbed by a robust 52.5% to €433 million. ebitda before special items improved by 54.5% to €598 million (q2 2014: €387 million). This growth in earn-ings was attributable to all divisions. The main contributions came from the acquired consumer care businesses and a positive currency effect of around €40 million.
Sales of our Consumer Health segment in the first half of 2015 improved by 5.5% (Fx & portfolio adj.)
to €4,720 million. All divisions contributed to this increase. The Consumer Care Division in particular
grew sales on a currency- and portfolio-adjusted basis, especially in Latin America and Europe.
ebit in the first half of 2015 climbed by 17.1% to €657 million, reflecting special charges of €192 million (h1 2014: €13 million) that were due mainly to integration costs. ebit before special items improved by 47.9% to €849 million (h1 2014: €574 million). ebitda before special items improved by a significant 49.5% to €1,166 million (h1 2014: €780 million) after positive currency effects of approxi-mately €60 million.
Best-Selling Consumer Health Products [Table 8]
2nd Quarter
2014
2nd Quarter
2015 Change 1st Half
2014 1st Half
2015 Change
€ million € million %
Fx adj.
% € million € million %
Fx adj.
%
Claritin™ (Consumer Care)1 – 167 . . – 369 . .
Advantage™ product family (Animal Health) 140 169 + 20.7 + 3.9 270 313 + 15.9 + 1.4
Aspirin™ (Consumer Care) 92 101 + 9.8 + 0.2 194 221 + 13.9 + 4.8
Aleve™ (Consumer Care) 83 120 + 44.6 + 19.9 157 215 + 36.9 + 14.7
Bepanthen™ / Bepanthol™ (Consumer Care) 91 88 – 3.3 + 6.9 177 182 + 2.8 + 10.4
Coppertone™ (Consumer Care)1 – 99 . . – 182 . .
Ultravist™ (Medical Care) 76 84 + 10.5 + 2.9 145 157 + 8.3 + 1.2
Gadovist™ / Gadavist™ (Medical Care) 57 71 + 24.6 + 12.1 110 140 + 27.3 + 16.6
Dr Scholl’s™ (Consumer Care)1 – 78 . . – 136 . .
Canesten™ (Consumer Care) 66 65 – 1.5 + 4.6 126 129 + 2.4 + 3.5
Total 605 1,042 + 72.2 + 53.5 1,179 2,044 + 73.4 + 55.0
Proportion of Consumer Health sales 37% 43% 36% 43% Fx adj.= currency-adjusted Total sales of Aspirin™ (including Aspirin™ Complex), also including Aspirin™ Cardio, which is reflected in sales of the Pharmaceuticals segment, increased by 9.1% (Fx adj. –1.1%) in Q2 2015 to €228 million (Q2 2014: €209 million). These total sales increased in the first half of 2015 by 13.6% (Fx adj. +12.9%) to €484 million (H1 2014: €426 million). 1 product acquired from Merck & Co., Inc.

18 Bayer Interim Report
Interim Group Management Report as of June 30, 2015
5. Business Development by Subgroup, Segment and Region
5.2 CropScience
Sales of the CropScience subgroup in the second quarter of 2015, at €2,723 million, were level with the strong prior-year period (Fx & portfolio adj.: –0.6%; reported: +10.2%). Crop Protection / Seeds posted a slight sales decline against the background of a persisting difficult market environment, particularly in Latin America. This was partly offset by substantial increases at Environmental Science.
Key Data – CropScience [Table 9]
2nd Quarter
2014
2nd Quarter
2015 Change 1st Half
2014 1st Half
2015 Change
€ million € million %
Fx & p adj.
% € million € million %
Fx & p adj.
%
Sales 2,470 2,723 + 10.2 – 0.6 5,370 5,815 + 8.3 + 0.2
Change in sales
Volume + 7.5% – 0.7% + 9.0% – 1.6%
Price + 3.0% + 0.1% + 2.2% + 1.8%
Currency – 7.2% + 10.0% – 7.1% + 7.4%
Portfolio 0.0% + 0.8% + 0.1% + 0.7%
Sales
Crop Protection / Seeds 2,273 2,472 + 8.8 – 1.3 5,007 5,361 + 7.1 – 0.2
Environmental Science 197 251 + 27.4 + 6.6 363 454 + 25.1 + 5.5
€ million € million % Fx adj. % € million € million % Fx adj. %
Sales by region
Europe 887 894 + 0.8 + 0.9 2,126 2,272 + 6.9 + 10.3
North America 748 915 + 22.3 + 2.0 1,702 1,858 + 9.2 – 7.6
Asia / Pacific 371 443 + 19.4 + 4.9 700 803 + 14.7 + 0.6
Latin America / Africa / Middle East 464 471 + 1.5 – 8.8 842 882 + 4.8 – 6.3
EBIT 470 571 + 21.5 1,458 1,445 – 0.9
Special items 0 (28) 0 (75)
EBIT before special items1 470 599 + 27.4 1,458 1,520 + 4.3
EBITDA1 615 705 + 14.6 1,713 1,703 – 0.6
Special items 0 (28) 0 (70)
EBITDA before special items1 615 733 + 19.2 1,713 1,773 + 3.5
EBITDA margin before special items1 24.9% 26.9% 31.9% 30.5%
Gross cash flow2 469 537 + 14.5 1,239 1,242 + 0.2
Net cash flow2 971 742 – 23.6 249 (81) . Fx & p adj. = currency- and portfolio-adjusted; Fx adj. = currency-adjusted 1 For definition see Chapter 6 “Calculation of EBIT(DA) Before Special Items.” 2 For definition see Chapter 8 “Financial Position of the Bayer Group.”

Bayer Interim Report 19
Interim Group Management Report as of June 30, 20155. Business Development by Subgroup, Segment and Region
Sales of Crop Protection / Seeds fell by 1.3% (Fx & portfolio adj.) to €2,472 million in the second quarter of 2015, mainly as a result of a sharp decline in business at Insecticides. By contrast, our Seeds busi-ness, which expanded by a double-digit figure, registered a positive trend – especially for vegetables and rice. We also significantly grew sales at Herbicides.
Sales of Environmental Science advanced by 6.6% (Fx & portfolio adj.) to €251 million, mainly as a result of strong growth in products for professional users.
The sales development of CropScience varied by region:
Sales in Europe came in at €894 million in the second quarter of 2015, up 0.9% on a currency-adjusted basis. Our seed treatments were successful, particularly those for use in cereals. The vegetable seed business also registered strong, double-digit growth. Sales at Fungicides were down against the strong prior-year quarter following an early start to the season in the first quarter and lower pest pressure due to weather conditions.
Sales in North America climbed by 2.0% (Fx adj.) to €915 million. This increase was mainly attributa-ble to sales of herbicides in the United States for use particularly in corn and cotton. Sales at Fungicides fell sharply due in part to dry weather in Canada. At Environmental Science, business with products for professional users developed positively.
Sales in the Asia / Pacific region climbed by 4.9% (Fx adj.) to €443 million. The Seeds business regis-tered a significant expansion in sales, particularly for rice, cotton and vegetables. Herbicides and Fun-gicides also posted successful development.
CropScience Quarterly Sales [Graphic 10]
Q1
Q4
Q2
Q3
€ million
0 500 1,000 1,500 2,000 3,5003,0002,500
20142015
20142015
20142015
20142015
2,9003,092
2,4702,723
1,929
2,195
Sales by Business Unit [Table 10]
2nd Quarter
2014 2nd Quarter
2015 Change 1st Half
2014 1st Half
2015 Change
€ million € million % Fx & p adj. % € million € million % Fx & p adj. %
Herbicides 683 787 + 15.2 + 5.6 1,648 1,693 + 2.7 – 2.7
Fungicides 781 827 + 5.9 – 2.4 1,443 1,657 + 14.8 + 8.9
Insecticides 390 360 – 7.7 – 17.7 742 695 – 6.3 – 15.2
SeedGrowth 156 163 + 4.5 – 5.1 408 384 – 5.9 – 12.5
Crop Protection 2,010 2,137 + 6.3 – 2.9 4,241 4,429 + 4.4 – 1.9
Seeds 263 335 + 27.4 + 11.0 766 932 + 21.7 + 9.1
Crop Protection / Seeds 2,273 2,472 + 8.8 – 1.3 5,007 5,361 + 7.1 – 0.2
Environmental Science 197 251 + 27.4 + 6.6 363 454 + 25.1 + 5.5 Fx & p adj. = currency- and portfolio-adjusted

20 Bayer Interim Report
Interim Group Management Report as of June 30, 2015
5. Business Development by Subgroup, Segment and Region
Sales in the Latin America / Africa / Middle East region moved back by 8.8% (Fx adj.) to €471 million. Crop Protection / Seeds registered a decline mainly in Insecticides in Brazil, where sales were weakened by lower pest pressure. Business at Herbicides and SeedGrowth also fell sharply in that region. At the same time, we posted strong sales gains at Fungicides, particularly for soybeans, and at Environmental Science.
ebit of CropScience rose by 21.5% in the second quarter of 2015 to €571 million, reflecting special charges of €28 million (q2 2014: €0 million) related to litigations and the revaluation of other receiva-bles. ebit before special items climbed by 27.4% to €599 million. ebitda before special items came in 19.2% above the prior-year quarter at €733 million (q2 2014: €615 million). This increase was driven by a positive currency effect of about €70 million.
Sales of CropScience in the first half of 2015 were level year on year at €5,815 million (Fx & portfolio adj. +0.2%) despite the difficult market environment. At Crop Protection / Seeds, the positive overall development at Fungicides and Seeds offset lower sales at Insecticides and SeedGrowth. Environmental Science posted gratifying growth. In regional terms, we were particularly successful in the first half of 2015 in Europe, registering double-digit growth. By contrast, sales were down in North America and in Latin America / Africa / Middle East.
ebit of CropScience for the first half of 2015 came in level with the prior-year period at €1,445 million (–0.9%). Earnings were diminished by special charges of €75 million (h1 2014: €0 million) that resulted mainly from the consolidation of production sites. ebit before special items climbed by 4.3% to €1,520 million. ebitda before special items came in 3.5% above the prior-year period at €1,773 million. Nega-tive effects of lower volumes and higher selling expenses were more than offset by an increase in selling prices and a positive currency effect of around €30 million.
CropScienceQuarterly EBIT [Graphic 11]
CropScienceQuarterly EBITDA Before Special Items [Graphic 12]
Q2 Q2
Q3 Q3
Q4 Q4
Q1 Q1
€ million € million
4000 600200 1,2001,000800 4002000 600 1,2001,000800
20142015
20142015
20142015
20142015
20142015
20142015
20142015
20142015
1,0981,040
615733
278
369
988874
470571
157
191

Bayer Interim Report 21
Interim Group Management Report as of June 30, 20155. Business Development by Subgroup, Segment and Region
5.3 MaterialScience
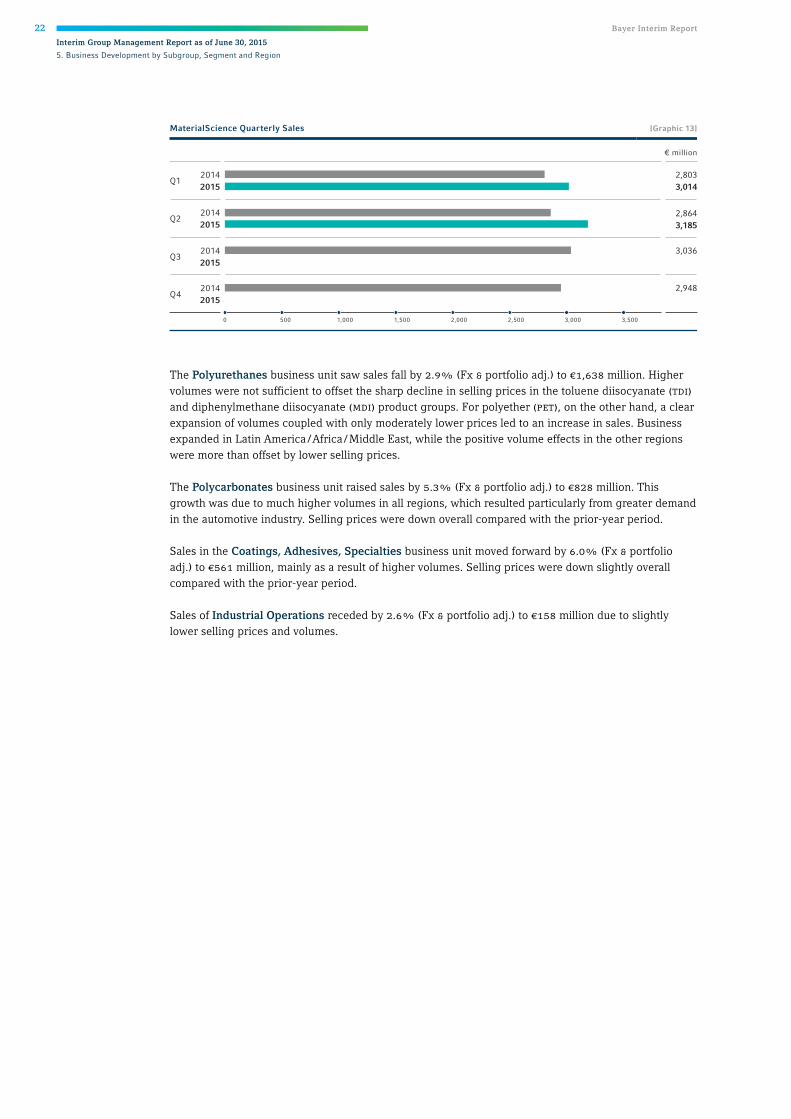
Sales of the MaterialScience subgroup in the second quarter of 2015, at €3,185 million, were level with the prior-year figures (Fx & portfolio adj.: +0.6%; reported +11.2%). Volumes expanded in all regions. Sales were diminished by negative price effects, particularly at Polyurethanes. Raw material prices were down steeply overall against the prior-year period.
Key Data – MaterialScience [Table 11]
2nd Quarter
2014 2nd Quarter
2015 Change 1st Half
2014 1st Half
2015 Change
€ million € million %
Fx & p adj.
% € million € million %
Fx & p adj.
%
Sales 2,864 3,185 + 11.2 + 0.6 5,667 6,199 + 9.4 – 0.7
Change in sales
Volume + 5.6% + 7.0% + 6.6% + 4.7%
Price – 2.0% – 6.4% – 2.4% – 5.4%
Currency – 3.6% + 10.6% – 3.4% + 10.1%
Portfolio – 0.4% 0.0% – 0.5% 0.0%
Sales
Polyurethanes 1,532 1,638 + 6.9 – 2.9 3,042 3,189 + 4.8 – 4.8
Polycarbonates 694 828 + 19.3 + 5.3 1,353 1,592 + 17.7 + 4.7
Coatings, Adhesives, Specialties 483 561 + 16.1 + 6.0 952 1,095 + 15.0 + 5.4
Industrial Operations 155 158 + 1.9 – 2.6 320 323 + 0.9 – 3.8
€ million € million %
Fx adj.
% € million € million %
Fx adj.
%
Sales by region
Europe 1,142 1,158 + 1.4 + 1.6 2,283 2,251 – 1.4 – 1.2
North America 646 766 + 18.6 – 4.2 1,242 1,484 + 19.5 – 2.5
Asia / Pacific 746 904 + 21.2 – 0.4 1,482 1,760 + 18.8 – 1.0
Latin America / Africa / Middle East 330 357 + 8.2 + 8.8 660 704 + 6.7 + 4.8
EBIT 109 278 + 155.0 328 497 + 51.5
Special items (17) (59) (19) (101)
EBIT before special items1 126 337 + 167.5 347 598 + 72.3
EBITDA1 256 448 + 75.0 620 851 + 37.3
Special items (14) (58) (16) (79)
EBITDA before special items1 270 506 + 87.4 636 930 + 46.2
EBITDA margin before special items1 9.4% 15.9% 11.2% 15.0%
Gross cash flow2 214 359 + 67.8 499 671 + 34.5
Net cash flow2 133 360 + 170.7 89 523 . Fx & p adj. = currency- and portfolio-adjusted; Fx adj. = currency-adjusted 1 For definition see Chapter 6 “Calculation of EBIT(DA) Before Special Items.” 2 For definition see Chapter 8 “Financial Position of the Bayer Group.”
22 Bayer Interim Report
Interim Group Management Report as of June 30, 2015
5. Business Development by Subgroup, Segment and Region
The Polyurethanes business unit saw sales fall by 2.9% (Fx & portfolio adj.) to €1,638 million. Higher volumes were not sufficient to offset the sharp decline in selling prices in the toluene diisocyanate (tdi) and diphenylmethane diisocyanate (mdi) product groups. For polyether (pet), on the other hand, a clear expansion of volumes coupled with only moderately lower prices led to an increase in sales. Business expanded in Latin America / Africa / Middle East, while the positive volume effects in the other regions were more than offset by lower selling prices.
The Polycarbonates business unit raised sales by 5.3% (Fx & portfolio adj.) to €828 million. This growth was due to much higher volumes in all regions, which resulted particularly from greater demand in the automotive industry. Selling prices were down overall compared with the prior-year period.
Sales in the Coatings, Adhesives, Specialties business unit moved forward by 6.0% (Fx & portfolio adj.) to €561 million, mainly as a result of higher volumes. Selling prices were down slightly overall compared with the prior-year period.
Sales of Industrial Operations receded by 2.6% (Fx & portfolio adj.) to €158 million due to slightly lower selling prices and volumes.
MaterialScience Quarterly Sales [Graphic 13]
Q1
Q4
Q2
Q3
20142015
20142015
20142015
20142015
€ million
0 500 1,000 1,500 2,000 2,500 3,5003,000
2,8033,014
2,8643,185
3,036
2,948
Bayer Interim Report 23
Interim Group Management Report as of June 30, 20155. Business Development by Subgroup, Segment and Region
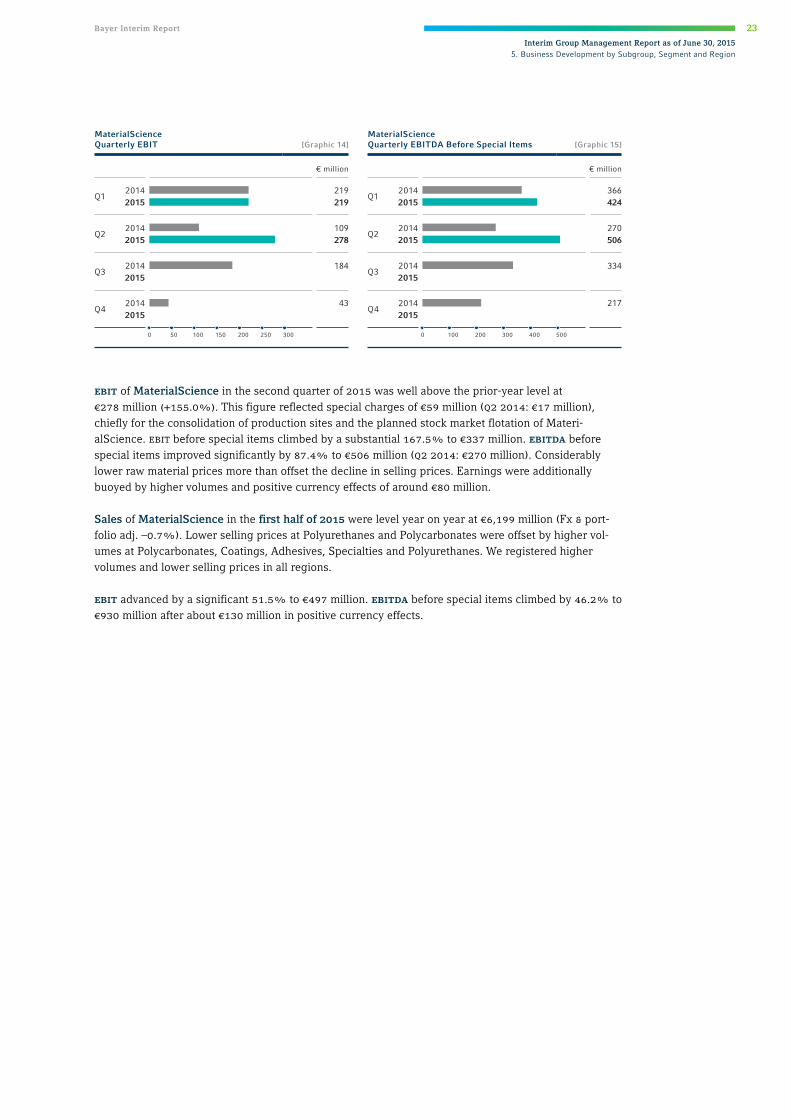
ebit of MaterialScience in the second quarter of 2015 was well above the prior-year level at €278 million (+155.0%). This figure reflected special charges of €59 million (q2 2014: €17 million), chiefly for the consolidation of production sites and the planned stock market flotation of Materi-alScience. ebit before special items climbed by a substantial 167.5% to €337 million. ebitda before special items improved significantly by 87.4% to €506 million (q2 2014: €270 million). Considerably lower raw material prices more than offset the decline in selling prices. Earnings were additionally buoyed by higher volumes and positive currency effects of around €80 million.
Sales of MaterialScience in the first half of 2015 were level year on year at €6,199 million (Fx & port-folio adj. –0.7%). Lower selling prices at Polyurethanes and Polycarbonates were offset by higher vol-umes at Polycarbonates, Coatings, Adhesives, Specialties and Polyurethanes. We registered higher volumes and lower selling prices in all regions.
ebit advanced by a significant 51.5% to €497 million. ebitda before special items climbed by 46.2% to €930 million after about €130 million in positive currency effects.
MaterialScienceQuarterly EBIT [Graphic 14]
MaterialScienceQuarterly EBITDA Before Special Items [Graphic 15]
366424
270506
334
217
€ million € million
0 100 300200 400 500
Q2 Q2
Q3 Q3
Q4 Q4
20142015
20142015
20142015
20142015
20142015
20142015
20142015
20142015
Q1 Q1219219
109278
184
43
0 50 150100 200 250 300
24 Bayer Interim Report
Interim Group Management Report as of June 30, 2015
5. Business Development by Subgroup, Segment and Region
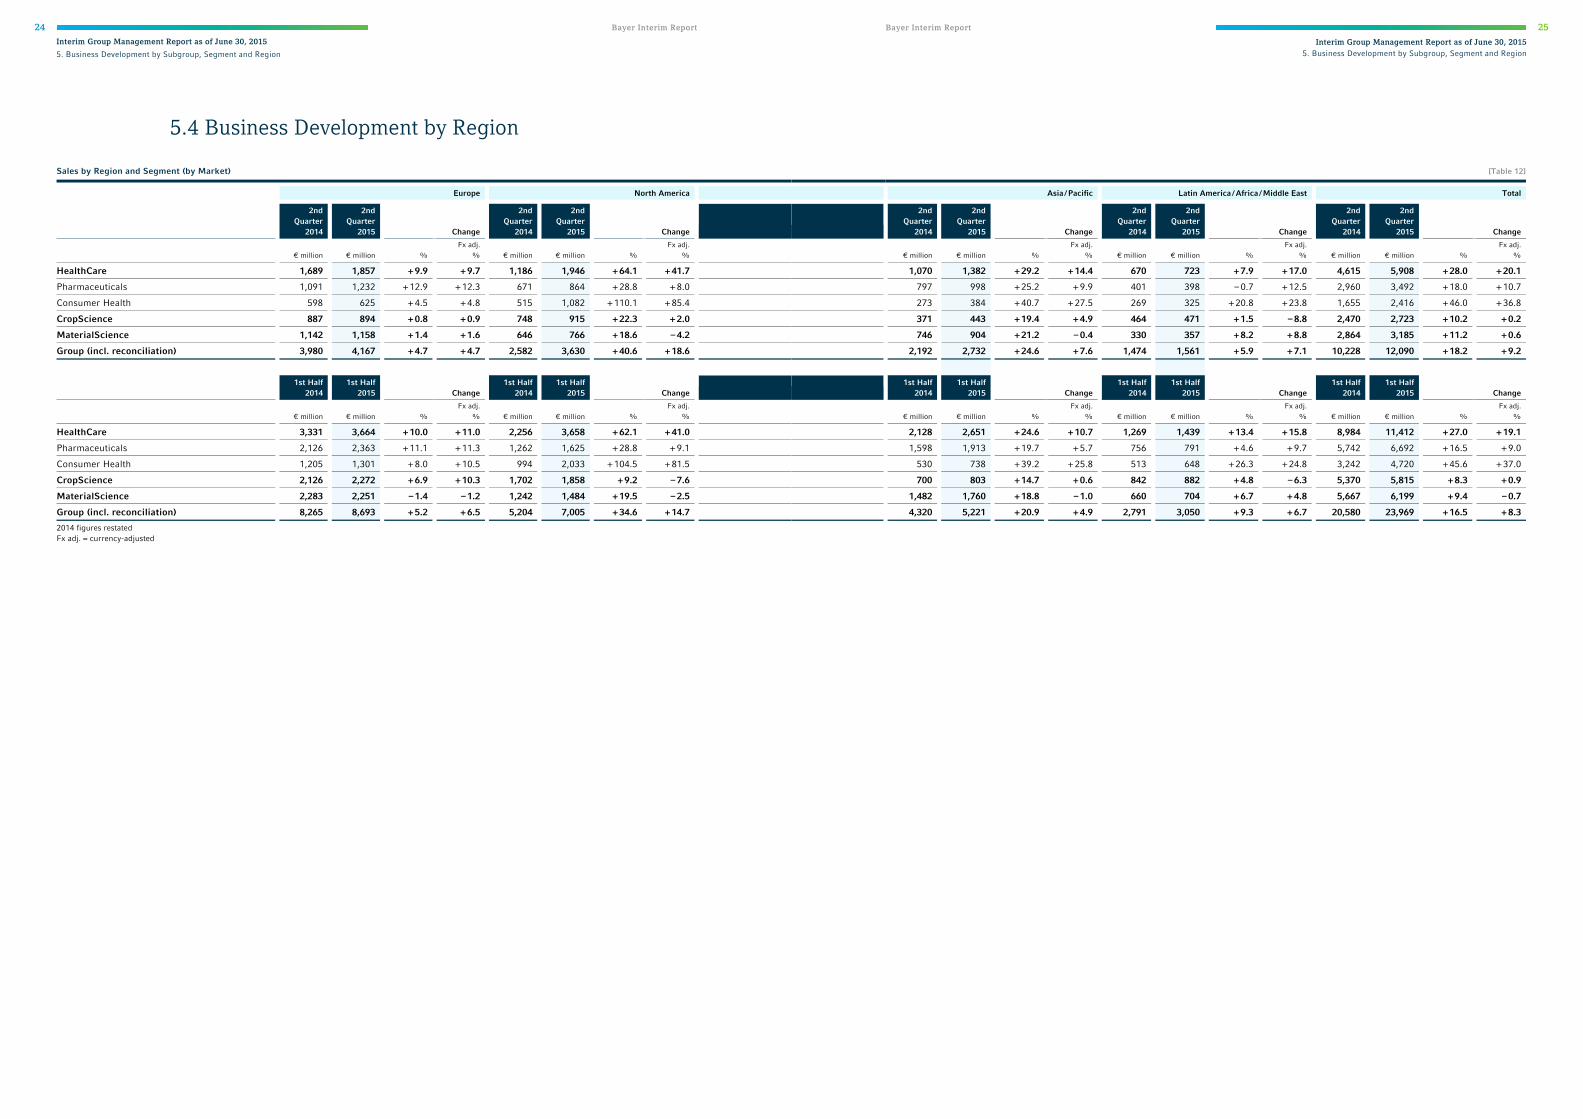
5.4 Business Development by Region
Sales by Region and Segment (by Market) Europe North America
2nd Quarter
2014
2nd Quarter
2015 Change
2nd Quarter
2014
2nd Quarter
2015 Change
€ million € million % Fx adj.
% € million € million % Fx adj.
%
HealthCare 1,689 1,857 + 9.9 + 9.7 1,186 1,946 + 64.1 + 41.7
Pharmaceuticals 1,091 1,232 + 12.9 + 12.3 671 864 + 28.8 + 8.0
Consumer Health 598 625 + 4.5 + 4.8 515 1,082 + 110.1 + 85.4
CropScience 887 894 + 0.8 + 0.9 748 915 + 22.3 + 2.0
MaterialScience 1,142 1,158 + 1.4 + 1.6 646 766 + 18.6 – 4.2
Group (incl. reconciliation) 3,980 4,167 + 4.7 + 4.7 2,582 3,630 + 40.6 + 18.6
1st Half
2014 1st Half
2015 Change 1st Half
2014 1st Half
2015 Change
€ million € million % Fx adj.
% € million € million % Fx adj.
%
HealthCare 3,331 3,664 + 10.0 + 11.0 2,256 3,658 + 62.1 + 41.0
Pharmaceuticals 2,126 2,363 + 11.1 + 11.3 1,262 1,625 + 28.8 + 9.1
Consumer Health 1,205 1,301 + 8.0 + 10.5 994 2,033 + 104.5 + 81.5
CropScience 2,126 2,272 + 6.9 + 10.3 1,702 1,858 + 9.2 – 7.6
MaterialScience 2,283 2,251 – 1.4 – 1.2 1,242 1,484 + 19.5 – 2.5
Group (incl. reconciliation) 8,265 8,693 + 5.2 + 6.5 5,204 7,005 + 34.6 + 14.7 2014 figures restated Fx adj. = currency-adjusted
Bayer Interim Report 25
Interim Group Management Report as of June 30, 20155. Business Development by Subgroup, Segment and Region
[Table 12]
Asia / Pacific Latin America / Africa / Middle East Total
2nd Quarter
2014
2nd Quarter
2015 Change
2nd Quarter
2014
2nd Quarter
2015 Change
2nd Quarter
2014
2nd Quarter
2015 Change
€ million € million % Fx adj.
% € million € million % Fx adj.
% € million € million % Fx adj.
%
1,070 1,382 + 29.2 + 14.4 670 723 + 7.9 + 17.0 4,615 5,908 + 28.0 + 20.1
797 998 + 25.2 + 9.9 401 398 – 0.7 + 12.5 2,960 3,492 + 18.0 + 10.7
273 384 + 40.7 + 27.5 269 325 + 20.8 + 23.8 1,655 2,416 + 46.0 + 36.8
371 443 + 19.4 + 4.9 464 471 + 1.5 – 8.8 2,470 2,723 + 10.2 + 0.2
746 904 + 21.2 – 0.4 330 357 + 8.2 + 8.8 2,864 3,185 + 11.2 + 0.6
2,192 2,732 + 24.6 + 7.6 1,474 1,561 + 5.9 + 7.1 10,228 12,090 + 18.2 + 9.2
1st Half
2014 1st Half
2015 Change 1st Half
2014 1st Half
2015 Change 1st Half
2014 1st Half
2015 Change
€ million € million % Fx adj.
% € million € million % Fx adj.
% € million € million % Fx adj.
%
2,128 2,651 + 24.6 + 10.7 1,269 1,439 + 13.4 + 15.8 8,984 11,412 + 27.0 + 19.1
1,598 1,913 + 19.7 + 5.7 756 791 + 4.6 + 9.7 5,742 6,692 + 16.5 + 9.0
530 738 + 39.2 + 25.8 513 648 + 26.3 + 24.8 3,242 4,720 + 45.6 + 37.0
700 803 + 14.7 + 0.6 842 882 + 4.8 – 6.3 5,370 5,815 + 8.3 + 0.9
1,482 1,760 + 18.8 – 1.0 660 704 + 6.7 + 4.8 5,667 6,199 + 9.4 – 0.7
4,320 5,221 + 20.9 + 4.9 2,791 3,050 + 9.3 + 6.7 20,580 23,969 + 16.5 + 8.3

26 Bayer Interim Report
Interim Group Management Report as of June 30, 2015
6. Calculation of EBIT(DA) Before Special Items
6. Calculation of EBIT(DA) Before Special Items
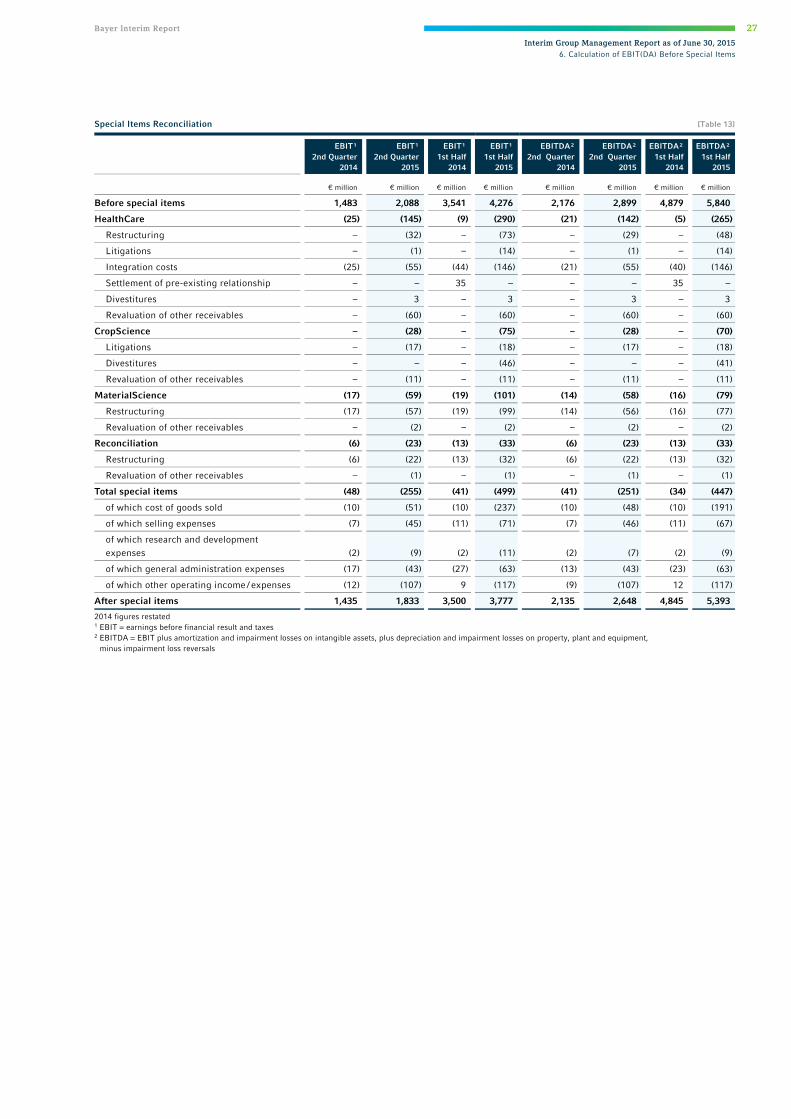
Key performance indicators for the Bayer Group are ebit before special items and ebitda before special items. These indicators are reported in order to allow a more accurate assessment of business opera-tions. The special items – comprising effects that are non-recurring or do not regularly recur or attain similar magnitudes – are detailed in the following table. ebitda, ebitda before special items and ebit before special items are not defined in the International Financial Reporting Standards (ifrs) and should therefore be regarded only as supplementary information. ebitda before special items is a meaningful indicator of operating performance since it is not affected by depreciation, amortization, impairment losses, impairment loss reversals or special items. By reporting this indicator, the company aims to give readers a clear picture of the results of operations and to ensure comparability of data over time. The ebitda margin before special items, which is the ratio of ebitda before special items to sales, serves as a relative indicator for the internal and external comparison of operational earning power.
Depreciation, amortization and impairments rose by 20.1% in the first half of 2015 to €1,616 million (h1 2014: €1,345 million), comprising €870 million (h1 2014: €711) in amortization and impairments of intangible assets and €746 million (h1 2014: €634 million) in depreciation and impairments of property, plant and equipment. Impairments totaled €67 million (h1 2014: €49 million), of which €52 million (h1 2014: €7 million) was included in special items.
Bayer Interim Report 27
Interim Group Management Report as of June 30, 20156. Calculation of EBIT(DA) Before Special Items
Special Items Reconciliation [Table 13]
EBIT¹ 2nd Quarter
2014
EBIT¹ 2nd Quarter
2015
EBIT¹ 1st Half
2014
EBIT¹ 1st Half
2015
EBITDA² 2nd Quarter
2014
EBITDA² 2nd Quarter
2015
EBITDA² 1st Half
2014
EBITDA² 1st Half
2015
€ million € million € million € million € million € million € million € million
Before special items 1,483 2,088 3,541 4,276 2,176 2,899 4,879 5,840
HealthCare (25) (145) (9) (290) (21) (142) (5) (265)
Restructuring – (32) – (73) – (29) – (48)
Litigations – (1) – (14) – (1) – (14)
Integration costs (25) (55) (44) (146) (21) (55) (40) (146)
Settlement of pre-existing relationship – – 35 – – – 35 –
Divestitures – 3 – 3 – 3 – 3
Revaluation of other receivables – (60) – (60) – (60) – (60)
CropScience – (28) – (75) – (28) – (70)
Litigations – (17) – (18) – (17) – (18)
Divestitures – – – (46) – – – (41)
Revaluation of other receivables – (11) – (11) – (11) – (11)
MaterialScience (17) (59) (19) (101) (14) (58) (16) (79)
Restructuring (17) (57) (19) (99) (14) (56) (16) (77)
Revaluation of other receivables – (2) – (2) – (2) – (2)
Reconciliation (6) (23) (13) (33) (6) (23) (13) (33)
Restructuring (6) (22) (13) (32) (6) (22) (13) (32)
Revaluation of other receivables – (1) – (1) – (1) – (1)
Total special items (48) (255) (41) (499) (41) (251) (34) (447)
of which cost of goods sold (10) (51) (10) (237) (10) (48) (10) (191)
of which selling expenses (7) (45) (11) (71) (7) (46) (11) (67)
of which research and development expenses (2) (9) (2) (11) (2) (7) (2) (9)
of which general administration expenses (17) (43) (27) (63) (13) (43) (23) (63)
of which other operating income / expenses (12) (107) 9 (117) (9) (107) 12 (117)
After special items 1,435 1,833 3,500 3,777 2,135 2,648 4,845 5,393 2014 figures restated 1 EBIT = earnings before financial result and taxes 2 EBITDA = EBIT plus amortization and impairment losses on intangible assets, plus depreciation and impairment losses on property, plant and equipment,
minus impairment loss reversals

28 Bayer Interim Report
Interim Group Management Report as of June 30, 2015
7. Core Earnings Per Share
7. Core Earnings Per Share Earnings per share according to ifrs are affected by the purchase price allocation for acquisitions and other special factors. To enhance comparability, we also determine core net income from continuing operations after eliminating amortization and impairment losses / impairment loss reversals on intangi-ble assets, impairment losses / impairment loss reversals on property, plant and equipment, and special items, along with the related tax effects.
From this core net income we calculate core earnings per share in the same way as earnings per share. Core earnings per share form the basis for our dividend policy. Core earnings per share in the second quarter of 2015 increased by 33.8% to €1.98 (q2 2014: €1.48).
Core net income from continuing operations, core earnings per share from continuing operations and core ebit are not defined in ifrs.
Core Earnings per Share [Table 14]
2nd Quarter
2014 2nd Quarter
2015 1st Half
2014 1st Half
2015
€ million € million € million € million
EBIT (as per income statements) 1,435 1,833 3,500 3,777
Amortization and impairment losses / loss reversals on intangible assets 365 446 711 870
Impairment losses / loss reversals on property, plant and equipment 35 19 35 55
Special items (other than amortization and impairment losses / loss reversals) 41 251 34 447
Core EBIT 1,876 2,549 4,280 5,149
Financial result (as per income statements) (173) (287) (332) (561)
Special items in the financial result (5) (6) (49) (9)
Income taxes (as per income statements) (343) (405) (851) (811)
Tax effects related to amortization, impairment losses / loss reversals and special items (129) (210) (235) (431)
Income after income taxes attributable to non-controlling interest (as per income statements) (2) (6) (4) (12)
Core net income from continuing operations 1,224 1,635 2,809 3,325
Shares Shares Shares Shares
Number of issued ordinary shares 826,947,808 826,947,808 826,947,808 826,947,808
Core earnings per share from continuing operations (€) 1.48 1.98 3.40 4.02
Core earnings per share from discontinued operations (€) 0.05 0.02 0.08 0.08
Core earnings per share from continuing and discontinued operations (€) 1.53 2.00 3.48 4.10 2014 figures restated
Bayer Interim Report 29
Interim Group Management Report as of June 30, 20158. Financial Position of the Bayer Group
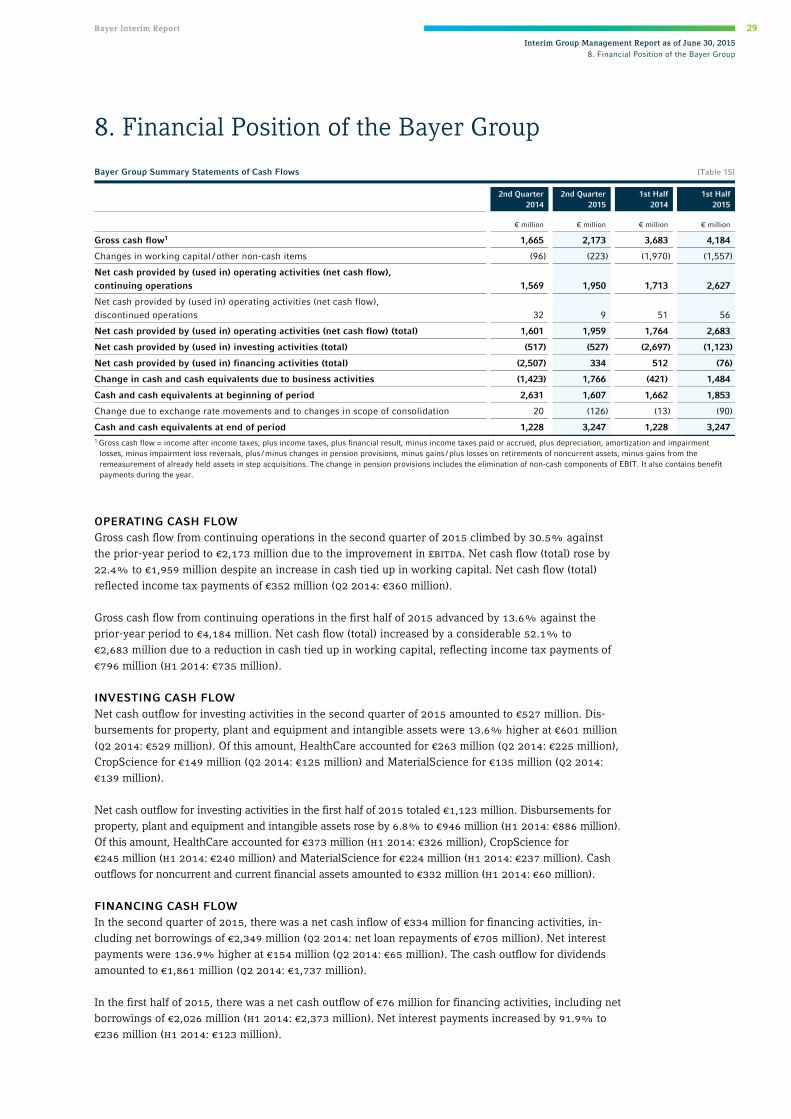
8. Financial Position of the Bayer Group
OPERATING CASH FLOW Gross cash flow from continuing operations in the second quarter of 2015 climbed by 30.5% against the prior-year period to €2,173 million due to the improvement in ebitda. Net cash flow (total) rose by 22.4% to €1,959 million despite an increase in cash tied up in working capital. Net cash flow (total) reflected income tax payments of €352 million (q2 2014: €360 million).
Gross cash flow from continuing operations in the first half of 2015 advanced by 13.6% against the prior-year period to €4,184 million. Net cash flow (total) increased by a considerable 52.1% to €2,683 million due to a reduction in cash tied up in working capital, reflecting income tax payments of €796 million (h1 2014: €735 million).
INVESTING CASH FLOW Net cash outflow for investing activities in the second quarter of 2015 amounted to €527 million. Dis-bursements for property, plant and equipment and intangible assets were 13.6% higher at €601 million (q2 2014: €529 million). Of this amount, HealthCare accounted for €263 million (q2 2014: €225 million), CropScience for €149 million (q2 2014: €125 million) and MaterialScience for €135 million (q2 2014: €139 million).
Net cash outflow for investing activities in the first half of 2015 totaled €1,123 million. Disbursements for property, plant and equipment and intangible assets rose by 6.8% to €946 million (h1 2014: €886 million). Of this amount, HealthCare accounted for €373 million (h1 2014: €326 million), CropScience for €245 million (h1 2014: €240 million) and MaterialScience for €224 million (h1 2014: €237 million). Cash outflows for noncurrent and current financial assets amounted to €332 million (h1 2014: €60 million).
FINANCING CASH FLOW In the second quarter of 2015, there was a net cash inflow of €334 million for financing activities, in-cluding net borrowings of €2,349 million (q2 2014: net loan repayments of €705 million). Net interest payments were 136.9% higher at €154 million (q2 2014: €65 million). The cash outflow for dividends amounted to €1,861 million (q2 2014: €1,737 million).
In the first half of 2015, there was a net cash outflow of €76 million for financing activities, including net borrowings of €2,026 million (h1 2014: €2,373 million). Net interest payments increased by 91.9% to €236 million (h1 2014: €123 million).
Bayer Group Summary Statements of Cash Flows [Table 15]
2nd Quarter
2014 2nd Quarter
2015 1st Half
2014 1st Half
2015
€ million € million € million € million
Gross cash flow1 1,665 2,173 3,683 4,184
Changes in working capital / other non-cash items (96) (223) (1,970) (1,557)
Net cash provided by (used in) operating activities (net cash flow), continuing operations 1,569 1,950 1,713 2,627
Net cash provided by (used in) operating activities (net cash flow), discontinued operations 32 9 51 56
Net cash provided by (used in) operating activities (net cash flow) (total) 1,601 1,959 1,764 2,683
Net cash provided by (used in) investing activities (total) (517) (527) (2,697) (1,123)
Net cash provided by (used in) financing activities (total) (2,507) 334 512 (76)
Change in cash and cash equivalents due to business activities (1,423) 1,766 (421) 1,484
Cash and cash equivalents at beginning of period 2,631 1,607 1,662 1,853
Change due to exchange rate movements and to changes in scope of consolidation 20 (126) (13) (90)
Cash and cash equivalents at end of period 1,228 3,247 1,228 3,247 1 Gross cash flow = income after income taxes, plus income taxes, plus financial result, minus income taxes paid or accrued, plus depreciation, amortization and impairment
losses, minus impairment loss reversals, plus / minus changes in pension provisions, minus gains / plus losses on retirements of noncurrent assets, minus gains from the remeasurement of already held assets in step acquisitions. The change in pension provisions includes the elimination of non-cash components of EBIT. It also contains benefit payments during the year.
30 Bayer Interim Report
Interim Group Management Report as of June 30, 2015
8. Financial Position of the Bayer Group
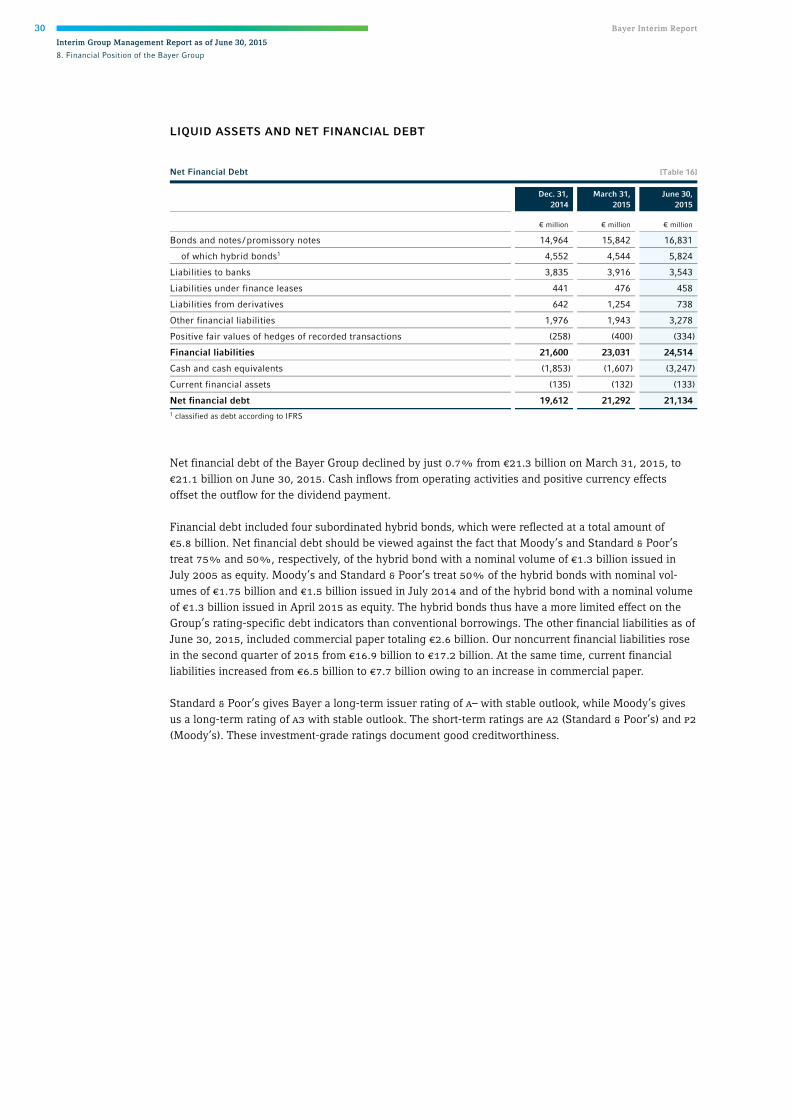
LIQUID ASSETS AND NET FINANCIAL DEBT
Net financial debt of the Bayer Group declined by just 0.7% from €21.3 billion on March 31, 2015, to €21.1 billion on June 30, 2015. Cash inflows from operating activities and positive currency effects offset the outflow for the dividend payment.
Financial debt included four subordinated hybrid bonds, which were reflected at a total amount of €5.8 billion. Net financial debt should be viewed against the fact that Moody’s and Standard & Poor’s treat 75% and 50%, respectively, of the hybrid bond with a nominal volume of €1.3 billion issued in July 2005 as equity. Moody’s and Standard & Poor’s treat 50% of the hybrid bonds with nominal vol-umes of €1.75 billion and €1.5 billion issued in July 2014 and of the hybrid bond with a nominal volume of €1.3 billion issued in April 2015 as equity. The hybrid bonds thus have a more limited effect on the Group’s rating-specific debt indicators than conventional borrowings. The other financial liabilities as of June 30, 2015, included commercial paper totaling €2.6 billion. Our noncurrent financial liabilities rose in the second quarter of 2015 from €16.9 billion to €17.2 billion. At the same time, current financial liabilities increased from €6.5 billion to €7.7 billion owing to an increase in commercial paper.
Standard & Poor’s gives Bayer a long-term issuer rating of a– with stable outlook, while Moody’s gives us a long-term rating of a3 with stable outlook. The short-term ratings are a2 (Standard & Poor’s) and p2 (Moody’s). These investment-grade ratings document good creditworthiness.
Net Financial Debt [Table 16]
Dec. 31,
2014 March 31,
2015 June 30,
2015
€ million € million € million
Bonds and notes / promissory notes 14,964 15,842 16,831
of which hybrid bonds1 4,552 4,544 5,824
Liabilities to banks 3,835 3,916 3,543
Liabilities under finance leases 441 476 458
Liabilities from derivatives 642 1,254 738
Other financial liabilities 1,976 1,943 3,278
Positive fair values of hedges of recorded transactions (258) (400) (334)
Financial liabilities 21,600 23,031 24,514
Cash and cash equivalents (1,853) (1,607) (3,247)
Current financial assets (135) (132) (133)
Net financial debt 19,612 21,292 21,134 1 classified as debt according to IFRS

Bayer Interim Report 31
Interim Group Management Report as of June 30, 20158. Financial Position of the Bayer Group
ASSET AND CAPITAL STRUCTURE
Total assets fell by €1.0 billion against March 31, 2015, to €75.6 billion. Noncurrent assets decreased by €2.2 billion to €49.5 billion, largely due to currency effects and lower deferred tax assets. Total current assets rose by €1.0 billion to €26.2 billion, mainly due to an increase in the cash position.
Equity increased by €0.5 billion to €22.4 billion, lifted by income after income taxes of €1.1 billion, the €1.7 billion decrease – recognized outside profit or loss – in post-employment benefit obligations and changes of €0.1 billion in the cash flow hedges. The €1.9 billion dividend payment and €0.5 billion in negative exchange differences had an offsetting effect. The equity ratio (equity coverage of total assets) as of June 30, 2015, was 29.7% (March 31, 2015: 28.5%).
Liabilities fell by €1.6 billion in the second quarter of 2015 to €53.2 billion. Provisions for pensions and other post-employment benefits declined by €2.4 billion, while other provisions moved back by €0.4 billion. The €1.4 billion increase in financial liabilities resulted partly from the hybrid bond issu-ance and the commercial paper.
The net defined benefit liability for post-employment benefits declined by €2.5 billion in the second quarter of 2015 to €11.1 billion, mainly due to an increase in long-term capital market interest rates for high-quality corporate bonds.
Bayer Group Summary Statements of Financial Position [Table 17]
Dec. 31,
2014 March 31,
2015 June 30,
2015
€ million € million € million
Noncurrent assets 48,007 51,689 49,462
Current assets 22,227 24,951 25,975
Assets held for sale and discontinued operations – – 183
Total current assets 22,227 24,951 26,158
Total assets 70,234 76,640 75,620
Equity 20,218 21,863 22,423
Noncurrent liabilities 34,513 34,514 32,433
Current liabilities 15,503 20,263 20,650
Liabilities directly related to assets held for sale and discontinued operations – – 114
Total current liabilities 15,503 20,263 20,764
Liabilities 50,016 54,777 53,197
Total equity and liabilities 70,234 76,640 75,620
Net Defined Benefit Liability for Post-Employment Benefits [Table 18]
Dec. 31,
2014 March 31,
2015 June 30,
2015
€ million € million € million
Provisions for pensions and other post-employment benefits 12,236 13,594 11,176
Net defined benefit asset (41) (41) (43)
Net defined benefit liability for post-employment benefits 12,195 13,553 11,133
32 Bayer Interim Report
Interim Group Management Report as of June 30, 2015
9. Growth and Innovation
9. Growth and Innovation Our expenses for research and development rose by 13.6% (Fx adj.) in the first half of 2015 to €1,982 million (h1 2014: €1,653 million), including €1,036 million (Fx adj. + 16.2%) in the second quar-ter (q2 2014: €841 million). Capital expenditures for property, plant and equipment and intangible as-sets in the first half of 2015 amounted to €945 million (h1 2014: €883 million), including €600 million in the second quarter (q2 2014: €526 million).
The Emerging Markets once again accounted for a disproportionate share of currency-adjusted sales growth in the first half of 2015. For reporting purposes we have defined the Emerging Markets as Asia (excluding Japan), Latin America, Eastern Europe, Africa and the Middle East.
Sales in the Emerging Markets advanced by 9.6% (Fx adj.) to €8,388 million in the first half of 2015 (h1 2014: €7,198 million), including €4,264 million in the second quarter (Fx adj. +8.0%; q2 2014: €3,695 million). All regions contributed to this development. The Emerging Markets’ share of total sales was unchanged compared with the prior-year period, at 35.0%. The respective figure for the second quarter of 2015 was 35.3% (q2 2014: 36.1%).
€1,296 million (65%)
HealthCare
€509 million (26%)
CropScience
€127 million (6%)
MaterialScience
€50 million (3%)
Reconciliation
Subgroup shares in parentheses
€1,982 million
Research and Development Expenses in the First Half of 2015 [Graphic 16]
€372 million (39%)
HealthCare
€245 million (26%)
CropScience
€224 million (24%)
MaterialScience
€104 million (11%)
Reconciliation
Subgroup shares in parentheses
€945 million
Capital Expenditures in the First Half of 2015 [Graphic 17]
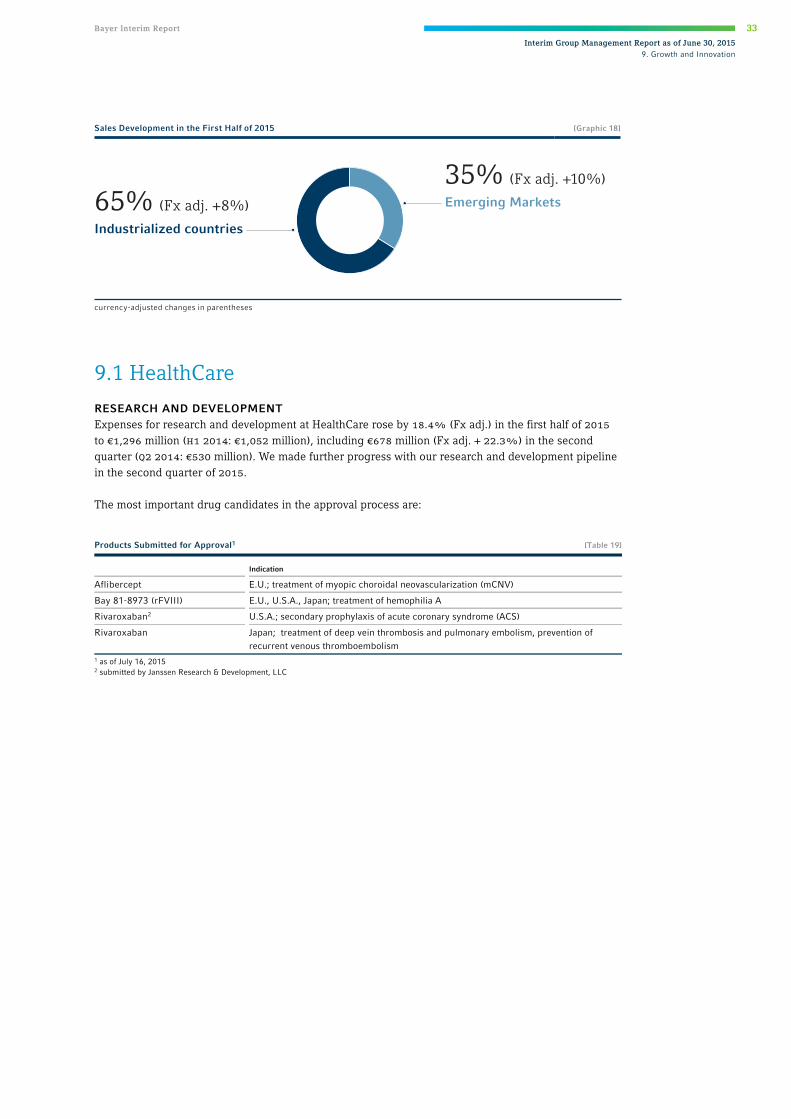
Bayer Interim Report 33
Interim Group Management Report as of June 30, 20159. Growth and Innovation
9.1 HealthCare
RESEARCH AND DEVELOPMENT Expenses for research and development at HealthCare rose by 18.4% (Fx adj.) in the first half of 2015 to €1,296 million (h1 2014: €1,052 million), including €678 million (Fx adj. + 22.3%) in the second quarter (q2 2014: €530 million). We made further progress with our research and development pipeline in the second quarter of 2015.
The most important drug candidates in the approval process are:
Sales Development in the First Half of 2015 [Graphic 18]
35% (Fx adj. +10%)
Emerging Markets65% (Fx adj. +8%)
Industrialized countries
currency-adjusted changes in parentheses
Products Submitted for Approval1 [Table 19]
Indication
Aflibercept E.U.; treatment of myopic choroidal neovascularization (mCNV)
Bay 81-8973 (rFVIII) E.U., U.S.A., Japan; treatment of hemophilia A
Rivaroxaban2 U.S.A.; secondary prophylaxis of acute coronary syndrome (ACS)
Rivaroxaban Japan; treatment of deep vein thrombosis and pulmonary embolism, prevention of recurrent venous thromboembolism
1 as of July 16, 2015 2 submitted by Janssen Research & Development, LLC

34 Bayer Interim Report
Interim Group Management Report as of June 30, 2015
9. Growth and Innovation
The following table shows our most important drug candidates currently in Phase ii or iii of clinical testing:
Research and Development Projects (Phases II and III)
1 [Table 20]
Indication Status
Amikacin Inhale Pulmonary infection Phase III
Damoctocog alfa pegol (BAY 94-9027, long-acting rFVIII) Hemophilia A Phase III
Ciprofloxacin DPI Pulmonary infection Phase III
Copanlisib (PI3K inhibitor) Various forms of non-Hodgkin’s lymphoma (NHL) Phase III
LCS-16 (ULD LNG Contraceptive System) Intrauterine contraception, duration of use: up to 5 years Phase III
ODM-201 (AR antagonist) Prostate cancer Phase III
Radium-223 dichloride Combination treatment of castration-resistant prostate cancer Phase III
Regorafenib Refractory liver cancer Phase III
Riociguat Pulmonary arterial hypertension (PAH) in patients who do not sufficiently respond to PDE-5i / ERA Phase III
Rivaroxaban Prevention of major adverse cardiac events (MACE) Phase III
Rivaroxaban Anti-coagulation in patients with chronic heart failure2 Phase III
Rivaroxaban Long-term prevention of venous thromboembolism Phase III
Rivaroxaban Prevention of venous thromboembolism in high-risk patients after discharge from hospital2 Phase III
Rivaroxaban Embolic stroke of undetermined source (ESUS) Phase III
Rivaroxaban Peripheral artery disease (PAD) Phase III
Tedizolid Pulmonary infection3 Phase III
Anetumab ravtansine (Mesothelin ADC) Cancer Phase II
BAY 1067197 (partial adenosine A1 agonist) Heart failure Phase II
BAY 1007626 (progestine IUS) Contraception Phase II
BAY 1142524 (chymase inhibitor) Heart failure Phase II
BAY 98-7196 (intravaginal ring) Endometriosis Phase II
Copanlisib (PI3K inhibitor) Recurrent / resistant non-Hodgkin’s lymphoma (NHL) Phase II
Finerenone (MR antagonist) Chronic heart failure Phase II
Finerenone (MR antagonist) Diabetic nephropathy Phase II
Molidustat (HIF-PH inhibitor) Anemia Phase II
Radium-223 dichloride Bone metastases in cancer Phase II
Refametinib (MEK inhibitor) Cancer Phase II
Regorafenib Cancer Phase II
Riociguat Pulmonary hypertension (IIP) Phase II
Riociguat Raynaud’s phenomenon Phase II
Riociguat Diffuse systemic sclerosis Phase II
Riociguat Cystic fibrosis Phase II
Rivaroxaban Secondary prevention of acute coronary syndrome (ACS)2 Phase II
Roniciclib (CDK inhibitor) Small-cell lung cancer (SCLC) Phase II
Vericiguat (BAY 1021189, sGC stimulator) Chronic heart failure Phase II
Vilaprisan (S-PRM) Uterine fibroids Phase II
Vilaprisan (S-PRM) Endometriosis Phase II 1 as of July 16, 2015 2 sponsored by Janssen Research & Development, LLC 3 Phase III for the treatment of complicated skin infections is completed; first submissions have been made The nature of drug discovery and development is such that not all compounds can be expected to meet the pre-defined project goals. It is possible that any or all of the projects listed above may have to be discontinued due to scientific and / or commercial reasons and will not result in commercialized products. It is also possible that the requisite Food and Drug Administration (FDA), European Medicines Agency (EMA) or other regulatory approvals will not be granted for these compounds.

Bayer Interim Report 35
Interim Group Management Report as of June 30, 20159. Growth and Innovation
We have expanded our global clinical development program for the cancer drug copanlisib to include new studies. A Phase iii and a Phase ii trial began enrolling patients in May 2015, while a further Phase iii study started in June 2015. The new studies are designed to investigate the safety and efficacy of copanlisib in patients with recurring indolent non-Hodgkin’s lymphoma (nhl) and diffuse large B-cell lymphomas (dlbcl), an aggressive subtype of nhl. Copanlisib is a novel, intravenous phosphatidylinosi-tol 3-kinase (pi3k) inhibitor.
In April 2015, we submitted an application to the Japanese Ministry of Health, Labour and Welfare (mhlw) for marketing authorization for radium-223 dichloride as an injection solution for the treatment of prostate carcinoma with bone metastases. Radium-223 dichloride is approved in more than 40 coun-tries worldwide under the brand name Xofigo™.
In May 2015, the oral anticoagulant Xarelto™ (active ingredient: rivaroxaban) was approved by the China Food and Drug Administration (cfda) for the prevention of stroke and systemic embolism in pa-tients with atrial fibrillation and for the treatment of deep vein thrombosis (dvt). The approval also includes the use of Xarelto™ to reduce the risk of recurrent dvt and pulmonary embolism following acute dvt.
In June 2015, the Japanese mhlw approved Eylea™ (active ingredient: aflibercept for injection into the eye) to treat of patients with macular edema secondary to retinal vein occlusion (rvo). This new approv-al includes branch retinal vein occlusion (brvo) in addition to the previously-approved indication of macular edema secondary to central retinal vein occlusion (crvo).
In June 2015, we submitted an application to the Japanese mhlw for marketing authorization for the recombinant Factor viii compound bay 81-8973 for the treatment of hemophilia a.
A Phase IIa clinical study with regorafenib eye drops did not show the desired results and the project is therefore being discontinued. The study investigated the use of regorafenib for the treatment of wet age-related macular degeneration (amd).
CAPITAL EXPENDITURES, ACQUISITIONS AND COOPERATIONS In April 2015, we entered into an exclusive license agreement with Isis Pharmaceuticals, Inc., United States, pertaining to isis-fxiRx, an antisense drug in clinical development for the prevention of throm-bosis. Under the agreement, Bayer will further develop and commercialize isis-fxiRx in areas of high unmet medical need. Antisense drugs bind to the target mRNA molecules in the cell and inhibit the production of disease-causing proteins. The novel mechanism of inhibiting Factor xi synthesis through isis-fxiRx may offer a treatment option for patients for whom none is currently available.
In June 2015, we entered into a strategic research alliance with Johns Hopkins University, United States, concerning the discovery and development of innovative drugs for the treatment of serious diseases of the posterior part of the eye that affect many people worldwide. The five-year collaboration will aim to develop new ophthalmic therapies for various retinal diseases.
EMERGING MARKETS HealthCare raised sales in the Emerging Markets by 16.2% (Fx adj.) in the first half of 2015 to €3,603 million (h1 2014: €2,989 million), including €1,824 million (Fx adj. + 15.0%) in the second quar-ter of 2015 (q2 2014: €1,544 million). The largest increase in absolute terms in the second quarter was recorded in China, where, in addition to the positive development of our pharmaceutical products, we especially benefited from the acquired consumer care businesses. We posted double-digit sales growth in Latin America and Eastern Europe. The Emerging Markets’ share of total HealthCare sales was 31.6% in the first half of 2015 (h1 2014: 33.3%) and 30.9% in the second quarter (q2 2014: 33.5%).
36 Bayer Interim Report
Interim Group Management Report as of June 30, 2015
9. Growth and Innovation
9.2 CropScience
RESEARCH AND DEVELOPMENT Research and development expenses at CropScience rose by 4.2% (Fx adj.) in the first half of 2015 to €509 million (h1 2014: €452 million), including €269 million (Fx adj. + 4.2%) in the second quarter of 2015 (q2 2014: €238 million).
CAPITAL EXPENDITURES, ACQUISITIONS AND COOPERATIONS In May 2015, CropScience entered into a strategic innovation partnership with Flagship Ventures that also includes an investment in Flagship Ventures Fund V. CropScience will contribute its strengths in science, innovation and regulatory affairs to help in the identification, funding and development of promising startup companies.
In June 2015, CropScience announced the acquisition of SeedWorks India Pvt. Ltd., headquartered in Hyderabad, India, a company specialized in the breeding, production and marketing of hybrid seeds for tomatoes, hot peppers, okra and gourds. Existing and forthcoming varieties will be marketed under CropScience’s Nunhems™ brand.
Also in June 2015, CropScience and the Grains Research & Development Corporation (grdc) based in Australia entered into a five-year innovation partnership aimed partly at the joint development of new technologies to manage resistant weeds. grdc will support the expansion of capacities at the Bayer CropScience herbicide research center in Frankfurt, Germany.
EMERGING MARKETS CropScience raised sales in the Emerging Markets by 7.7% (Fx adj.) in the first half of 2015 to €2,097 million (h1 2014: €1,871 million), including €1,059 million in the second quarter (Fx adj. + 0.8%; q2 2014: €973 million). Strong gains were recorded in Africa / Middle East and Eastern Europe.Asia likewise developed favorably. Sales in Latin America declined substantially against the strong prior-year quarter. The Emerging Markets’ share of total CropScience sales was 36.1% in the first half of2015 (h1 2014: 34.8%) and 38.9% in the second quarter of 2015 (q2 2014: 39.4%).
9.3 MaterialScience
RESEARCH AND DEVELOPMENT Research and development expenses at MaterialScience rose by 2.7% (Fx adj.) in the first half of 2015 to €127 million (h1 2014: €111 million), including €68 million (Fx adj. + 19.6%) in the second quarter of 2015 (q2 2014: €51 million). This investment went mainly to explore new areas of application and im-prove process technologies and products. MaterialScience also invested an additional €82 million in the first half of 2015 (h1 2014: €37 million) in joint development projects with customers, including €21 million in the second quarter (q2 2014: €19 million).
EMERGING MARKETS In the Emerging Markets, MaterialScience posted sales of €2,656 million in the first half of 2015 (Fx adj. + 2.6%; h1 2014: €2,309 million), including €1,368 million in the second quarter (Fx adj. + 4.6%;q2 2014: €1,163 million). Strong currency-adjusted growth was recorded in Africa and the Middle East.Business in Eastern Europe, Latin America and Asia expanded as well. The Emerging Markets’ share oftotal MaterialScience sales was 42.8% in the first half of 2015 (h1 2014: 40.7%) and 43.0% in thesecond quarter of 2015 (q2 2014: 40.6%).
Bayer Interim Report 37
Interim Group Management Report as of June 30, 201510. Employees
10. EmployeesOn June 30, 2015, the Bayer Group employed 117,798 people in its continuing operations worldwide (December 31, 2014: 117,371). The workforce thus grew by 427 (+ 0.4%).
HealthCare employed 58,658 people (December 31, 2014: 59,199). The number of employees at CropScience increased to 23,856 (December 31, 2014: 23,060). The number of employees at MaterialScience rose to 15,071 (December 31, 2014: 14,122), while the number of people mainly em-ployed in the service companies declined to 20,213 (December 31, 2014: 20,990). This was largely due to the transfer of around 790 employees in preparation for the planned stock market flotation of MaterialScience.
Personnel expenses rose by 18.6% (Fx adj. 10.8%) in the first half of 2015 to €5,630 million (h1 2014: €4,749 million), partly due to portfolio adjustments, with the second quarter accounting for €2,750 million.
11. Opportunities and RisksAs a global enterprise with a diversified portfolio, the Bayer Group is exposed to a wide range of inter-nal or external developments or events that could significantly impact the achievement of our financial and non-financial objectives.
Bayer regards risk management as an integral part of corporate governance. Our risk management process and the opportunities / risks outlined in detail in the Annual Report 2014 (Combined Manage-ment Report, Chapter 20.3) are materially unchanged. No risks have been identified that could endan-ger the Bayer Group’s continued existence. There are also no risks with mutually reinforcing dependen-cies that could combine to endanger the Group’s continued existence.
Significant developments that have occurred in respect of the legal risks since publication of the Bayer Annual Report 2014 (Note [32] to the Consolidated Financial Statements) are described in the Notes to the Condensed Consolidated Interim Financial Statements under “Legal Risks.” The Bayer Annual Re-port 2014 can be downloaded free of charge at www.bayer.com.
12. Events After the End of the ReportingPeriod
After the end of the reporting period – on July 1, 2015 – the acquisition of SeedWorks India Pvt. Ltd., headquartered in Hyderabad, India, was closed.
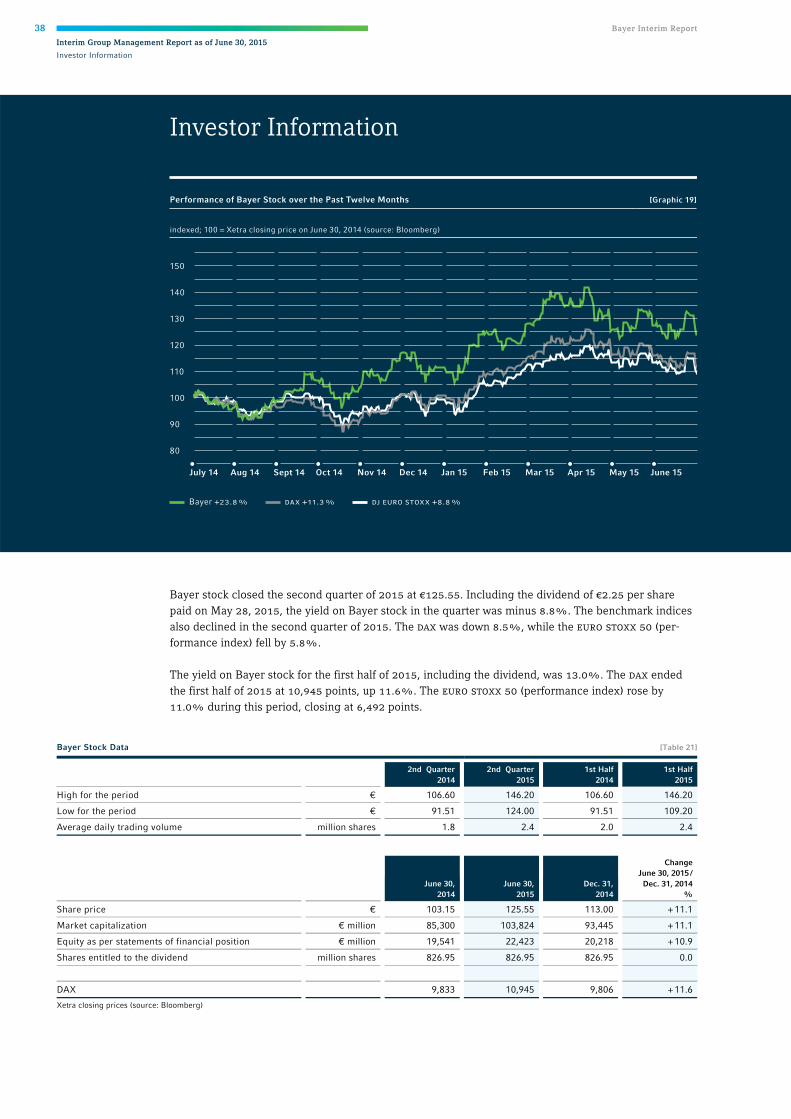
38 Bayer Interim Report
Interim Group Management Report as of June 30, 2015
Investor Information
Investor Information
Bayer stock closed the second quarter of 2015 at €125.55. Including the dividend of €2.25 per share paid on May 28, 2015, the yield on Bayer stock in the quarter was minus 8.8%. The benchmark indices also declined in the second quarter of 2015. The dax was down 8.5%, while the euro stoxx 50 (per-formance index) fell by 5.8%.
The yield on Bayer stock for the first half of 2015, including the dividend, was 13.0%. The dax ended the first half of 2015 at 10,945 points, up 11.6%. The euro stoxx 50 (performance index) rose by 11.0% during this period, closing at 6,492 points.
Bayer +23.8 % dax +11.3 % dj euro stoxx +8.8 %
Performance of Bayer Stock over the Past Twelve Months [Graphic 19]
indexed; 100 = Xetra closing price on June 30, 2014 (source: Bloomberg)
July 14 June 15Feb 15 Apr 15Dec 14Sept 14 May 15Jan 15Oct 14 Mar 15Nov 14Aug 14
150
140
130
120
110
100
90
80
Bayer Stock Data [Table 21]
2nd Quarter 2014
2nd Quarter 2015
1st Half 2014
1st Half 2015
High for the period € 106.60 146.20 106.60 146.20
Low for the period € 91.51 124.00 91.51 109.20
Average daily trading volume million shares 1.8 2.4 2.0 2.4
June 30, 2014
June 30, 2015
Dec. 31, 2014
Change June 30, 2015 /
Dec. 31, 2014 %
Share price € 103.15 125.55 113.00 + 11.1
Market capitalization € million 85,300 103,824 93,445 + 11.1
Equity as per statements of financial position € million 19,541 22,423 20,218 + 10.9
Shares entitled to the dividend million shares 826.95 826.95 826.95 0.0
DAX 9,833 10,945 9,806 + 11.6
Xetra closing prices (source: Bloomberg)
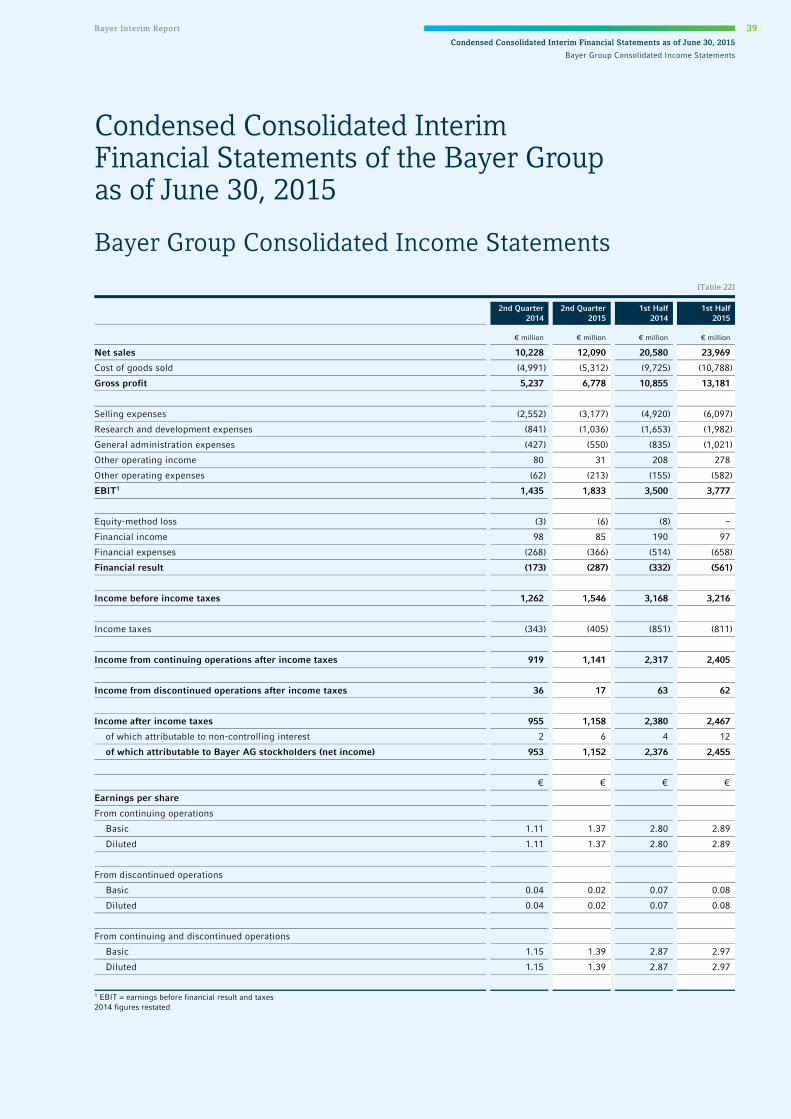
Bayer Interim Report 39
Condensed Consolidated Interim Financial Statements as of June 30, 2015
Bayer Group Consolidated Income Statements
Bayer Group Consolidated Income Statements
Condensed Consolidated Interim Financial Statements of the Bayer Group as of June 30, 2015
[Table 22]
2nd Quarter
2014 2nd Quarter
2015 1st Half
2014 1st Half
2015
€ million € million € million € million
Net sales 10,228 12,090 20,580 23,969
Cost of goods sold (4,991) (5,312) (9,725) (10,788)
Gross profit 5,237 6,778 10,855 13,181
Selling expenses (2,552) (3,177) (4,920) (6,097)
Research and development expenses (841) (1,036) (1,653) (1,982)
General administration expenses (427) (550) (835) (1,021)
Other operating income 80 31 208 278
Other operating expenses (62) (213) (155) (582)
EBIT1 1,435 1,833 3,500 3,777
Equity-method loss (3) (6) (8) –
Financial income 98 85 190 97
Financial expenses (268) (366) (514) (658)
Financial result (173) (287) (332) (561)
Income before income taxes 1,262 1,546 3,168 3,216
Income taxes (343) (405) (851) (811)
Income from continuing operations after income taxes 919 1,141 2,317 2,405
Income from discontinued operations after income taxes 36 17 63 62
Income after income taxes 955 1,158 2,380 2,467
of which attributable to non-controlling interest 2 6 4 12
of which attributable to Bayer AG stockholders (net income) 953 1,152 2,376 2,455
€ € € €
Earnings per share
From continuing operations
Basic 1.11 1.37 2.80 2.89
Diluted 1.11 1.37 2.80 2.89
From discontinued operations
Basic 0.04 0.02 0.07 0.08
Diluted 0.04 0.02 0.07 0.08
From continuing and discontinued operations
Basic 1.15 1.39 2.87 2.97
Diluted 1.15 1.39 2.87 2.97
1 EBIT = earnings before financial result and taxes 2014 figures restated
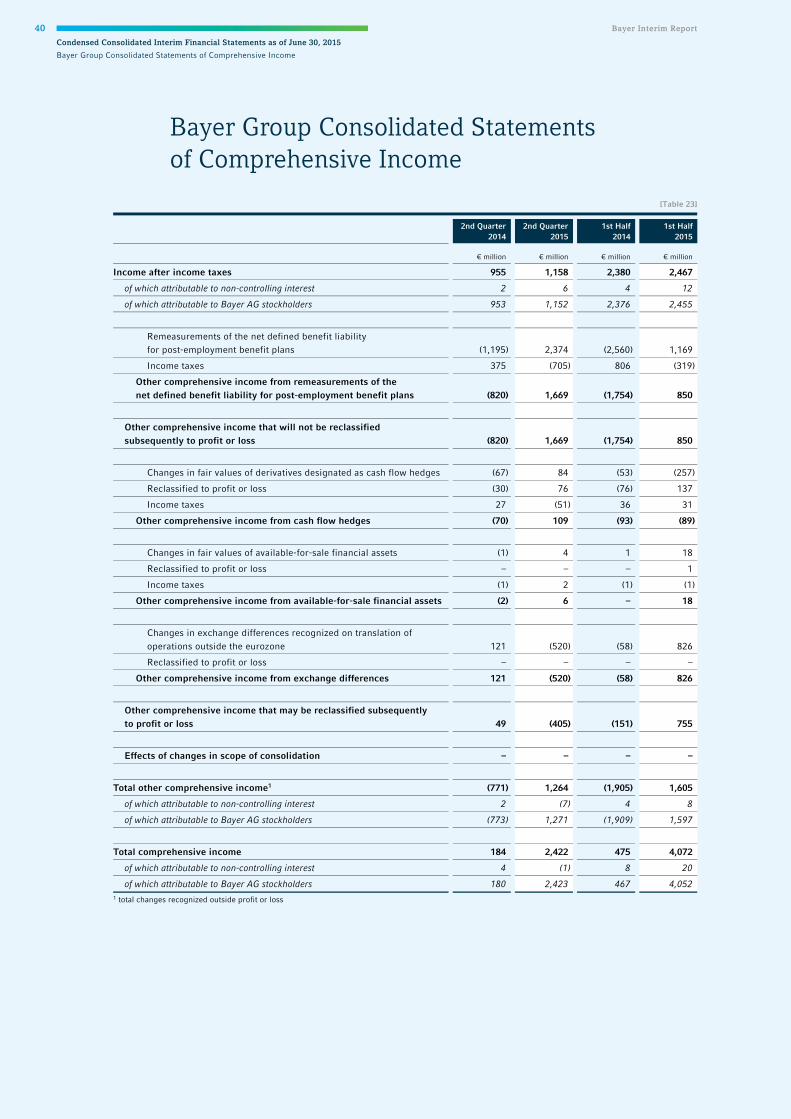
40 Bayer Interim Report
Condensed Consolidated Interim Financial Statements as of June 30, 2015
Bayer Group Consolidated Statements of Comprehensive Income
Bayer Group Consolidated Statements of Comprehensive Income
[Table 23]
2nd Quarter
2014 2nd Quarter
2015 1st Half
2014 1st Half
2015
€ million € million € million € million
Income after income taxes 955 1,158 2,380 2,467
of which attributable to non-controlling interest 2 6 4 12
of which attributable to Bayer AG stockholders 953 1,152 2,376 2,455
Remeasurements of the net defined benefit liability for post-employment benefit plans (1,195) 2,374 (2,560) 1,169
Income taxes 375 (705) 806 (319)
Other comprehensive income from remeasurements of the net defined benefit liability for post-employment benefit plans (820) 1,669 (1,754) 850
Other comprehensive income that will not be reclassified subsequently to profit or loss (820) 1,669 (1,754) 850
Changes in fair values of derivatives designated as cash flow hedges (67) 84 (53) (257)
Reclassified to profit or loss (30) 76 (76) 137
Income taxes 27 (51) 36 31
Other comprehensive income from cash flow hedges (70) 109 (93) (89)
Changes in fair values of available-for-sale financial assets (1) 4 1 18
Reclassified to profit or loss – – – 1
Income taxes (1) 2 (1) (1)
Other comprehensive income from available-for-sale financial assets (2) 6 – 18
Changes in exchange differences recognized on translation of operations outside the eurozone 121 (520) (58) 826
Reclassified to profit or loss – – – –
Other comprehensive income from exchange differences 121 (520) (58) 826
Other comprehensive income that may be reclassified subsequently to profit or loss 49 (405) (151) 755
Effects of changes in scope of consolidation – – – –
Total other comprehensive income1 (771) 1,264 (1,905) 1,605
of which attributable to non-controlling interest 2 (7) 4 8
of which attributable to Bayer AG stockholders (773) 1,271 (1,909) 1,597
Total comprehensive income 184 2,422 475 4,072
of which attributable to non-controlling interest 4 (1) 8 20
of which attributable to Bayer AG stockholders 180 2,423 467 4,052
1 total changes recognized outside profit or loss

Bayer Interim Report 41
Condensed Consolidated Interim Financial Statements as of June 30, 2015
Bayer Group Consolidated Statements of Financial Position
Bayer Group Consolidated Statements of Financial Position
[Table 24]
June 30,
2014 June 30,
2015 Dec. 31,
2014
€ million € million € million
Noncurrent assets
Goodwill 10,322 16,870 16,168
Other intangible assets 10,056 15,686 15,653
Property, plant and equipment 10,061 11,873 11,428
Investments accounted for using the equity method 198 240 223
Other financial assets 1,267 1,136 1,107
Other receivables 441 404 447
Deferred taxes 1,604 3,253 2,981
33,949 49,462 48,007
Current assets
Inventories 7,416 8,668 8,478
Trade accounts receivable 9,423 11,242 9,097
Other financial assets 617 816 723
Other receivables 1,480 1,496 1,488
Claims for income tax refunds 463 506 588
Cash and cash equivalents 1,228 3,247 1,853
Assets held for sale and discontinued operations 363 183 –
20,990 26,158 22,227
Total assets 54,939 75,620 70,234
Equity
Capital stock of Bayer AG 2,117 2,117 2,117
Capital reserves of Bayer AG 6,167 6,167 6,167
Other reserves 11,165 14,013 11,822
Equity attributable to Bayer AG stockholders 19,449 22,297 20,106
Equity attributable to non-controlling interest 92 126 112
19,541 22,423 20,218
Noncurrent liabilities
Provisions for pensions and other post-employment benefits 9,824 11,176 12,236
Other provisions 1,877 2,100 2,016
Financial liabilities 8,008 17,178 18,484
Other liabilities 305 1,095 1,088
Deferred taxes 714 884 689
20,728 32,433 34,513
Current liabilities
Other provisions 5,368 5,716 4,912
Financial liabilities 3,589 7,676 3,376
Trade accounts payable 4,136 5,239 5,363
Income tax liabilities 85 74 63
Other liabilities 1,492 1,945 1,789
Liabilities directly related to assets held for sale and discontinued operations – 114 –
14,670 20,764 15,503
Total equity and liabilities 54,939 75,620 70,234

42 Bayer Interim Report
Condensed Consolidated Interim Financial Statements as of June 30, 2015
Bayer Group Consolidated Statements of Cash Flows
Bayer Group Consolidated Statements of Cash Flows
[Table 25]
2nd Quarter
2014 2nd Quarter
2015 1st Half
2014 1st Half
2015
€ million € million € million € million
Income from continuing operations after income taxes 919 1,141 2,317 2,405
Income taxes 343 405 851 811
Financial result 173 287 332 561
Income taxes paid or accrued (395) (440) (935) (1,073)
Depreciation, amortization and impairments 700 815 1,345 1,616
Change in pension provisions (69) (36) (185) (123)
(Gains) losses on retirements of noncurrent assets (6) 1 (42) (13)
Gross cash flow 1,665 2,173 3,683 4,184
Decrease (increase) in inventories 27 (212) (312) (151)
Decrease (increase) in trade accounts receivable 183 (93) (1,707) (2,042)
(Decrease) increase in trade accounts payable (68) 144 (384) (347)
Changes in other working capital, other non-cash items (238) (62) 433 983
Net cash provided by (used in) operating activities (net cash flow), continuing operations 1,569 1,950 1,713 2,627
Net cash provided by (used in) operating activities (net cash flow), discontinued operations 32 9 51 56
Net cash provided by (used in) operating activities (net cash flow) (total) 1,601 1,959 1,764 2,683
Cash outflows for additions to property, plant, equipment and intangible assets (529) (601) (886) (946)
Cash inflows from the sale of property, plant, equipment and other assets 35 59 51 84
Cash inflows from divestitures 6 – 6 –
Cash inflows from (outflows for) noncurrent financial assets (62) (77) (66) (336)
Cash outflows for acquisitions less acquired cash – 36 (1,857) 3
Interest and dividends received 33 57 49 68
Cash inflows from (outflows for) current financial assets – (1) 6 4
Net cash provided by (used in) investing activities (total) (517) (527) (2,697) (1,123)
Dividend payments and withholding tax on dividends (1,737) (1,861) (1,737) (1,866)
Issuances of debt 2,378 4,681 6,833 7,202
Retirements of debt (3,083) (2,332) (4,460) (5,176)
Interest paid including interest-rate swaps (105) (195) (166) (287)
Interest received from interest-rate swaps 40 41 43 51
Cash outflows for the purchase of additional interests in subsidiaries – – (1) –
Net cash provided by (used in) financing activities (total) (2,507) 334 512 (76)
Change in cash and cash equivalents due to business activities (total) (1,423) 1,766 (421) 1,484
Cash and cash equivalents at beginning of period 2,631 1,607 1,662 1,853
Change in cash and cash equivalents due to changes in scope of consolidation – – – 3
Change in cash and cash equivalents due to exchange rate movements 20 (126) (13) (93)
Cash and cash equivalents at end of period 1,228 3,247 1,228 3,247

Bayer Interim Report 43
Condensed Consolidated Interim Financial Statements as of June 30, 2015
Bayer Group Consolidated Statements of Changes in Equity
Bayer Group Consolidated Statements of Changes in Equity
[Table 26]
Capital stock of Bayer AG
Capital reserves of
Bayer AG
Other reserves
Equity attributable to Bayer AG
stockholders
Equity attributable
to non-controlling
interest
Equity
€ million € million € million € million € million € million
Dec. 31, 2013 2,117 6,167 12,434 20,718 86 20,804
Equity transactions with owners
Capital increase / decrease
Dividend payments (1,737) (1,737) (1) (1,738)
Other changes 1 1 (1)
Total comprehensive income 467 467 8 475
June 30, 2014 2,117 6,167 11,165 19,449 92 19,541
Dec. 31, 2014 2,117 6,167 11,822 20,106 112 20,218
Equity transactions with owners
Capital increase / decrease
Dividend payments (1,861) (1,861) (6) (1,867)
Other changes
Total comprehensive income 4,052 4,052 20 4,072
June 30, 2015 2,117 6,167 14,013 22,297 126 22,423
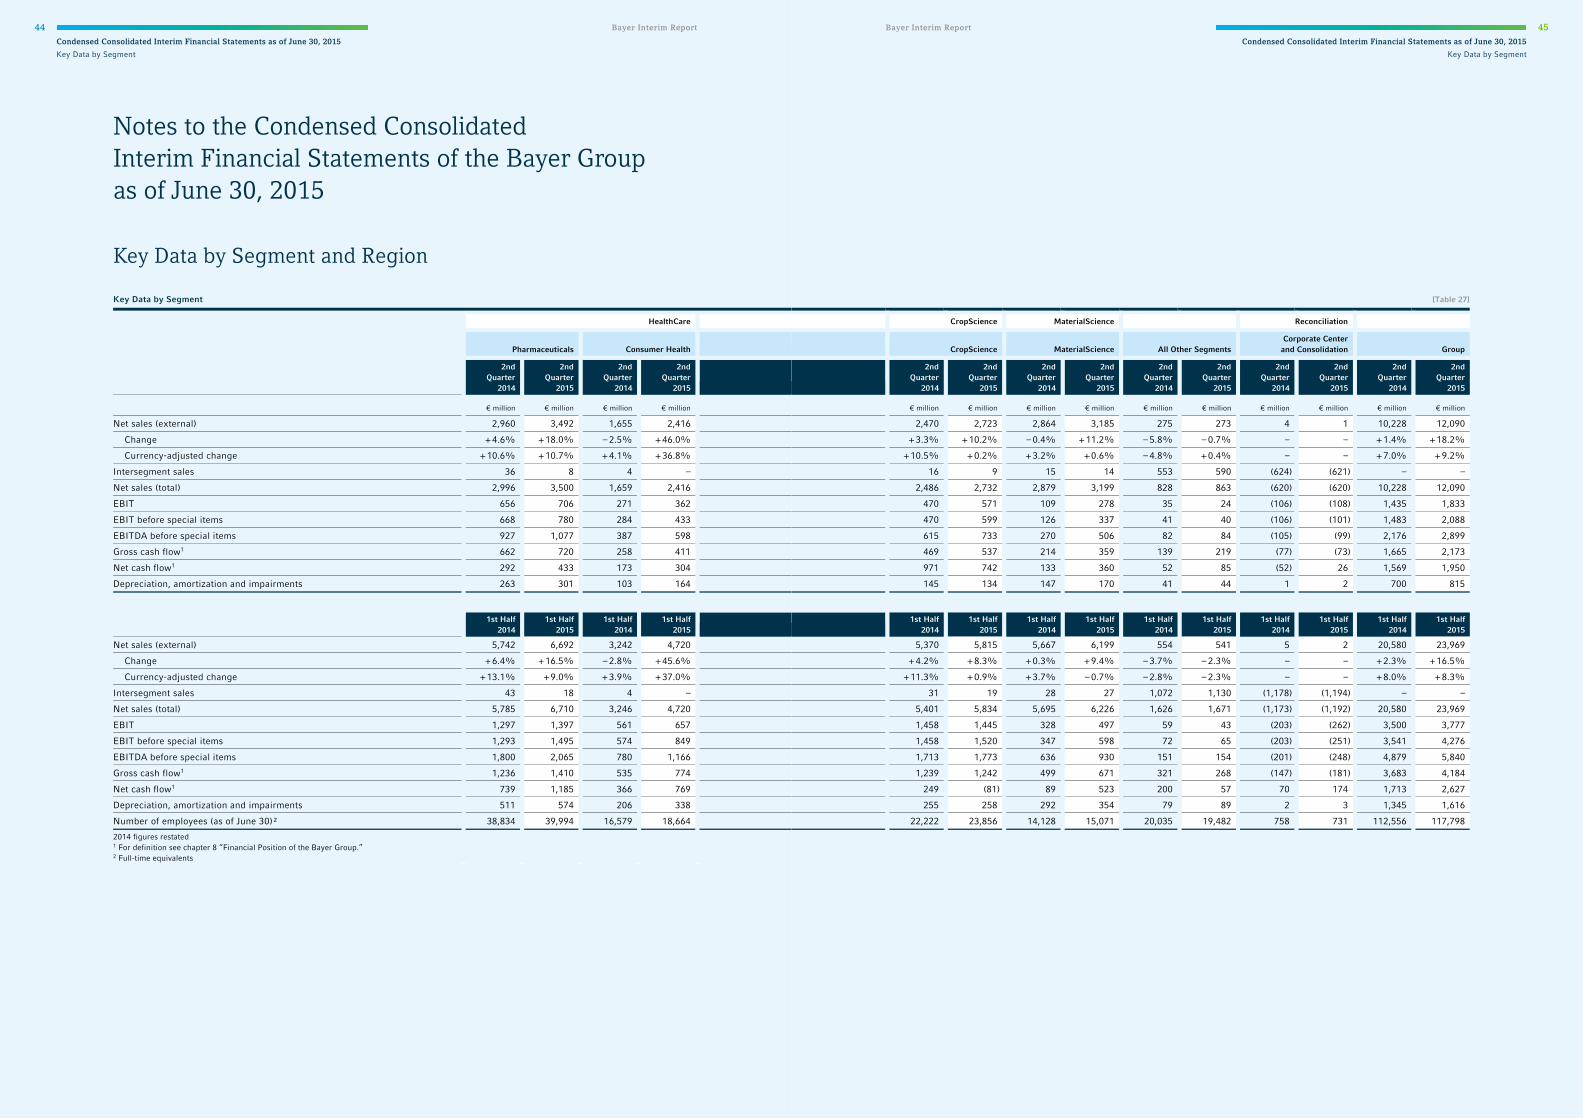
44 Bayer Interim Report
Condensed Consolidated Interim Financial Statements as of June 30, 2015
Key Data by Segment
Notes to the Condensed Consolidated Interim Financial Statements of the Bayer Group as of June 30, 2015
Key Data by Segment and Region
Key Data by Segment
HealthCare
Pharmaceuticals Consumer Health
2nd Quarter
2014
2nd Quarter
2015
2nd Quarter
2014
2nd Quarter
2015
€ million € million € million € million
Net sales (external) 2,960 3,492 1,655 2,416
Change + 4.6% + 18.0% – 2.5% + 46.0%
Currency-adjusted change + 10.6% + 10.7% + 4.1% + 36.8%
Intersegment sales 36 8 4 –
Net sales (total) 2,996 3,500 1,659 2,416
EBIT 656 706 271 362
EBIT before special items 668 780 284 433
EBITDA before special items 927 1,077 387 598
Gross cash flow1 662 720 258 411
Net cash flow1 292 433 173 304
Depreciation, amortization and impairments 263 301 103 164
1st Half
2014 1st Half
2015 1st Half
2014 1st Half
2015
Net sales (external) 5,742 6,692 3,242 4,720
Change + 6.4% + 16.5% – 2.8% + 45.6%
Currency-adjusted change + 13.1% + 9.0% + 3.9% + 37.0%
Intersegment sales 43 18 4 –
Net sales (total) 5,785 6,710 3,246 4,720
EBIT 1,297 1,397 561 657
EBIT before special items 1,293 1,495 574 849
EBITDA before special items 1,800 2,065 780 1,166
Gross cash flow1 1,236 1,410 535 774
Net cash flow1 739 1,185 366 769
Depreciation, amortization and impairments 511 574 206 338
Number of employees (as of June 30)² 38,834 39,994 16,579 18,664 2014 figures restated 1 For definition see chapter 8 “Financial Position of the Bayer Group.” 2 Full-time equivalents
Bayer Interim Report 45
Condensed Consolidated Interim Financial Statements as of June 30, 2015
Key Data by Segment
[Table 27]
CropScience MaterialScience Reconciliation
CropScience MaterialScience All Other Segments Corporate Center
and Consolidation Group
2nd Quarter
2014
2nd Quarter
2015
2nd Quarter
2014
2nd Quarter
2015
2nd Quarter
2014
2nd Quarter
2015
2nd Quarter
2014
2nd Quarter
2015
2nd Quarter
2014
2nd Quarter
2015
€ million € million € million € million € million € million € million € million € million € million
2,470 2,723 2,864 3,185 275 273 4 1 10,228 12,090
+ 3.3% + 10.2% – 0.4% + 11.2% – 5.8% – 0.7% – – + 1.4% + 18.2%
+ 10.5% + 0.2% + 3.2% + 0.6% – 4.8% + 0.4% – – + 7.0% + 9.2%
16 9 15 14 553 590 (624) (621) – –
2,486 2,732 2,879 3,199 828 863 (620) (620) 10,228 12,090
470 571 109 278 35 24 (106) (108) 1,435 1,833
470 599 126 337 41 40 (106) (101) 1,483 2,088
615 733 270 506 82 84 (105) (99) 2,176 2,899
469 537 214 359 139 219 (77) (73) 1,665 2,173
971 742 133 360 52 85 (52) 26 1,569 1,950
145 134 147 170 41 44 1 2 700 815
1st Half
2014 1st Half
2015 1st Half
2014 1st Half
2015 1st Half
2014 1st Half
2015 1st Half
2014 1st Half
2015 1st Half
2014 1st Half
2015
5,370 5,815 5,667 6,199 554 541 5 2 20,580 23,969
+ 4.2% + 8.3% + 0.3% + 9.4% – 3.7% – 2.3% – – + 2.3% + 16.5%
+ 11.3% + 0.9% + 3.7% – 0.7% – 2.8% – 2.3% – – + 8.0% + 8.3%
31 19 28 27 1,072 1,130 (1,178) (1,194) – –
5,401 5,834 5,695 6,226 1,626 1,671 (1,173) (1,192) 20,580 23,969
1,458 1,445 328 497 59 43 (203) (262) 3,500 3,777
1,458 1,520 347 598 72 65 (203) (251) 3,541 4,276
1,713 1,773 636 930 151 154 (201) (248) 4,879 5,840
1,239 1,242 499 671 321 268 (147) (181) 3,683 4,184
249 (81) 89 523 200 57 70 174 1,713 2,627
255 258 292 354 79 89 2 3 1,345 1,616
22,222 23,856 14,128 15,071 20,035 19,482 758 731 112,556 117,798
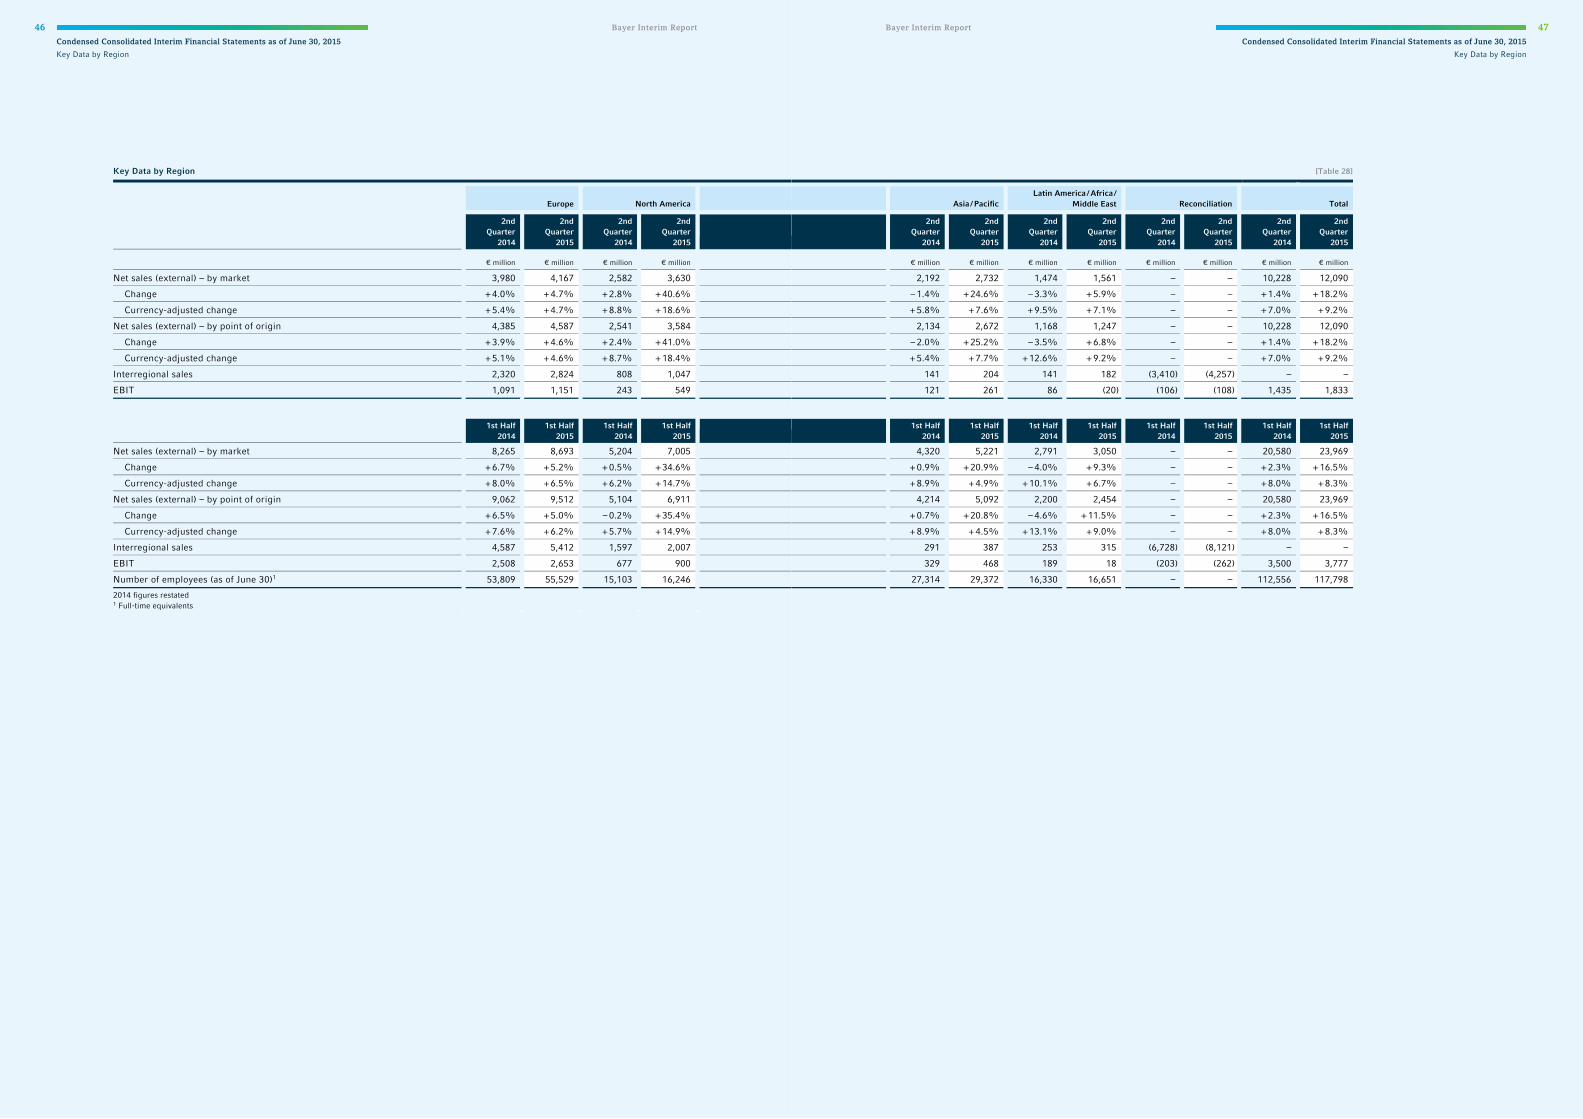
46 Bayer Interim Report
Condensed Consolidated Interim Financial Statements as of June 30, 2015
Key Data by Region
Key Data by Region
Europe North America
2nd Quarter
2014
2nd Quarter
2015
2nd Quarter
2014
2nd Quarter
2015
€ million € million € million € million
Net sales (external) – by market 3,980 4,167 2,582 3,630
Change + 4.0% + 4.7% + 2.8% + 40.6%
Currency-adjusted change + 5.4% + 4.7% + 8.8% + 18.6%
Net sales (external) – by point of origin 4,385 4,587 2,541 3,584
Change + 3.9% + 4.6% + 2.4% + 41.0%
Currency-adjusted change + 5.1% + 4.6% + 8.7% + 18.4%
Interregional sales 2,320 2,824 808 1,047
EBIT 1,091 1,151 243 549
1st Half
2014 1st Half
2015 1st Half
2014 1st Half
2015
Net sales (external) – by market 8,265 8,693 5,204 7,005
Change + 6.7% + 5.2% + 0.5% + 34.6%
Currency-adjusted change + 8.0% + 6.5% + 6.2% + 14.7%
Net sales (external) – by point of origin 9,062 9,512 5,104 6,911
Change + 6.5% + 5.0% – 0.2% + 35.4%
Currency-adjusted change + 7.6% + 6.2% + 5.7% + 14.9%
Interregional sales 4,587 5,412 1,597 2,007
EBIT 2,508 2,653 677 900
Number of employees (as of June 30)1 53,809 55,529 15,103 16,246 2014 figures restated 1 Full-time equivalents
Bayer Interim Report 47
Condensed Consolidated Interim Financial Statements as of June 30, 2015
Key Data by Region
[Table 28]
Asia / Pacific Latin America / Africa /
Middle East Reconciliation Total
2nd Quarter
2014
2nd Quarter
2015
2nd Quarter
2014
2nd Quarter
2015
2nd Quarter
2014
2nd Quarter
2015
2nd Quarter
2014
2nd Quarter
2015
€ million € million € million € million € million € million € million € million
2,192 2,732 1,474 1,561 – – 10,228 12,090
– 1.4% + 24.6% – 3.3% + 5.9% – – + 1.4% + 18.2%
+ 5.8% + 7.6% + 9.5% + 7.1% – – + 7.0% + 9.2%
2,134 2,672 1,168 1,247 – – 10,228 12,090
– 2.0% + 25.2% – 3.5% + 6.8% – – + 1.4% + 18.2%
+ 5.4% + 7.7% + 12.6% + 9.2% – – + 7.0% + 9.2%
141 204 141 182 (3,410) (4,257) – –
121 261 86 (20) (106) (108) 1,435 1,833
1st Half
2014 1st Half
2015 1st Half
2014 1st Half
2015 1st Half
2014 1st Half
2015 1st Half
2014 1st Half
2015
4,320 5,221 2,791 3,050 – – 20,580 23,969
+ 0.9% + 20.9% – 4.0% + 9.3% – – + 2.3% + 16.5%
+ 8.9% + 4.9% + 10.1% + 6.7% – – + 8.0% + 8.3%
4,214 5,092 2,200 2,454 – – 20,580 23,969
+ 0.7% + 20.8% – 4.6% + 11.5% – – + 2.3% + 16.5%
+ 8.9% + 4.5% + 13.1% + 9.0% – – + 8.0% + 8.3%
291 387 253 315 (6,728) (8,121) – –
329 468 189 18 (203) (262) 3,500 3,777
27,314 29,372 16,330 16,651 – – 112,556 117,798

48 Bayer Interim Report
Condensed Consolidated Interim Financial Statements as of June 30, 2015
Notes
Explanatory Notes
ACCOUNTING POLICIES Pursuant to Section 37w Paragraph 3 of the German Securities Trading Act, the consolidated interim financial statements as of June 30, 2015, were prepared in condensed form according to the Interna-tional Financial Reporting Standards (ifrs) – including ias 34 – of the International Accounting Stand-ards Board (iasb), London, which are endorsed by the European Union, and the Interpretations of the ifrs Interpretations Committee in effect at the closing date.
Reference should be made as appropriate to the Notes to the Consolidated Financial Statements for the 2014 fiscal year, particularly with regard to the main recognition and measurement principles, except where financial reporting standards have been applied for the first time in 2015.
FINANCIAL REPORTING STANDARDS APPLIED FOR THE FIRST TIME IN 2015 The first-time application of the following amended financial reporting standards had no impact, or no material impact, on the presentation of the Group’s financial position or results of operations, or on earnings per share.
In December 2013, the iasb published the fifth and sixth sets of “Annual Improvements to ifrss.” The amendments address details of the recognition, measurement and disclosure of business transactions and serve to standardize terminology. They consist mainly of editorial changes to existing standards. They are to be applied for annual periods beginning on or after July 1, 2014.

Bayer Interim Report 49
Condensed Consolidated Interim Financial Statements as of June 30, 2015
Notes
CHANGES IN UNDERLYING PARAMETERS Changes in the underlying parameters relate primarily to currency exchange rates and the interest rates used to calculate pension obligations.
The exchange rates for major currencies against the euro varied as follows:
The most important interest rates used to calculate the present value of pension obligations are given below:
The data selection criteria used to determine the discount rate in the eurozone were modified at the beginning of 2015. The item “Remeasurements of the net defined benefit liability for post-employment benefit plans” contains gains resulting from the rise in market interest rates. The modification of the data selection criteria had an effect of €0.7 billion. The discount rate obtained by applying the previous data selection criteria would have been lower by 20 basis points as of June 30, 2015. The change in the way the discount rate is determined reduces the net pension expense for the 2015 fiscal year by €17 million. As before, the underlying bond portfolio consists entirely of high-quality corporate bonds with a minimum aa or aaa rating. It does not include government-guaranteed or covered bonds.
Exchange Rates for Major Currencies [Table 29]
Closing Rate Average Rate
€1 Dec. 31,
2014 June 30,
2014 June 30,
2015 1st Half
2014 1st Half
2015
BRL Brazil 3.22 3.00 3.47 3.15 3.30
CAD Canada 1.41 1.46 1.38 1.50 1.38
CHF Switzerland 1.20 1.22 1.04 1.22 1.06
CNY China 7.54 8.47 6.94 8.45 6.94
GBP United Kingdom 0.78 0.80 0.71 0.82 0.73
JPY Japan 145.23 138.44 137.01 140.50 134.14
MXN Mexico 17.87 17.71 17.53 17.98 16.88
RUB Russia 72.34 46.38 62.36 47.95 63.83
USD United States 1.21 1.37 1.12 1.37 1.12
Discount Rate for Pension Obligations [Table 30]
Dec. 31,
2014 March 31,
2015 June 30,
2015
% % %
Germany 2.00 1.60 2.30
United Kingdom 3.60 3.30 3.80
United States 3.70 3.50 4.10
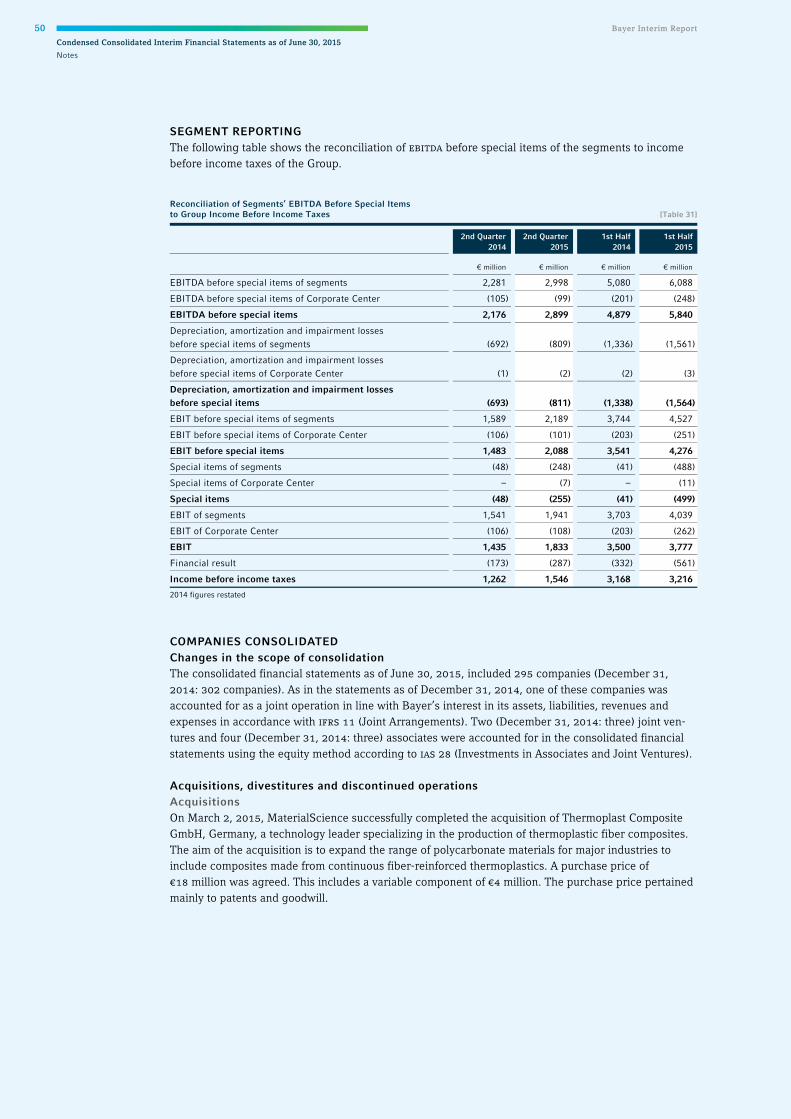
50 Bayer Interim Report
Condensed Consolidated Interim Financial Statements as of June 30, 2015
Notes
SEGMENT REPORTING The following table shows the reconciliation of ebitda before special items of the segments to income before income taxes of the Group.
COMPANIES CONSOLIDATED Changes in the scope of consolidation The consolidated financial statements as of June 30, 2015, included 295 companies (December 31, 2014: 302 companies). As in the statements as of December 31, 2014, one of these companies was accounted for as a joint operation in line with Bayer’s interest in its assets, liabilities, revenues and expenses in accordance with ifrs 11 (Joint Arrangements). Two (December 31, 2014: three) joint ven-tures and four (December 31, 2014: three) associates were accounted for in the consolidated financial statements using the equity method according to ias 28 (Investments in Associates and Joint Ventures).
Acquisitions, divestitures and discontinued operations Acquisitions On March 2, 2015, MaterialScience successfully completed the acquisition of Thermoplast Composite GmbH, Germany, a technology leader specializing in the production of thermoplastic fiber composites. The aim of the acquisition is to expand the range of polycarbonate materials for major industries to include composites made from continuous fiber-reinforced thermoplastics. A purchase price of €18 million was agreed. This includes a variable component of €4 million. The purchase price pertained mainly to patents and goodwill.
Reconciliation of Segments’ EBITDA Before Special Items to Group Income Before Income Taxes [Table 31]
2nd Quarter
2014 2nd Quarter
2015 1st Half
2014 1st Half
2015
€ million € million € million € million
EBITDA before special items of segments 2,281 2,998 5,080 6,088
EBITDA before special items of Corporate Center (105) (99) (201) (248)
EBITDA before special items 2,176 2,899 4,879 5,840
Depreciation, amortization and impairment losses before special items of segments (692) (809) (1,336) (1,561)
Depreciation, amortization and impairment losses before special items of Corporate Center (1) (2) (2) (3)
Depreciation, amortization and impairment losses before special items (693) (811) (1,338) (1,564)
EBIT before special items of segments 1,589 2,189 3,744 4,527
EBIT before special items of Corporate Center (106) (101) (203) (251)
EBIT before special items 1,483 2,088 3,541 4,276
Special items of segments (48) (248) (41) (488)
Special items of Corporate Center – (7) – (11)
Special items (48) (255) (41) (499)
EBIT of segments 1,541 1,941 3,703 4,039
EBIT of Corporate Center (106) (108) (203) (262)
EBIT 1,435 1,833 3,500 3,777
Financial result (173) (287) (332) (561)
Income before income taxes 1,262 1,546 3,168 3,216 2014 figures restated

Bayer Interim Report 51
Condensed Consolidated Interim Financial Statements as of June 30, 2015
Notes
The effects of this transaction and other, smaller transactions made in the first half of 2015 – along with adjustments to purchase prices and purchase price allocations made in the first half of 2015 relating to previous years’ / quarters’ transactions – on the Group’s assets and liabilities as of the respective acquisi-tion or adjustment dates are shown in the table. Net of acquired cash and cash equivalents, the transac-tions resulted in the following cash outflow:
On July 1, 2015, CropScience closed the acquisition of SeedWorks India Pvt. Ltd., based in Hyderabad, India. The company is specialized in the breeding, production and marketing of hybrid seeds of tomato, hot pepper, okra and gourds. It has research and seed processing locations in Bangalore and Hydera-bad, respectively. The purchase of SeedWorks India is intended to further strengthen CropScience’s vegetable seed business in India. A basic purchase price of €78 million was agreed.
As part of the acquisition of the consumer care business of Merck & Co., Inc., Whitehouse Station, New Jersey, United States, the production facilities at the Pointe-Claire site in Canada were acquired on July 1, 2015.
The global purchase price allocation for the consumer care business of Merck & Co., Inc. currently re-mains incomplete pending compilation and review of the relevant financial information. Significant changes may yet be made in the allocation of the purchase price to the individual assets and liabilities.
Divestitures On March 2, 2015, Consumer Health completed the sale of two equine products, Legend / Hyonate and Marquis, to Merial, Inc. A purchase price of €120 million was agreed. The one-time payment is account-ed for as deferred income. The purchase prices for Legend / Hyonate and Marquis will be reflected in sales and earnings over a four-year and a three-year period, respectively.
Acquired Assets, Assumed Liabilities and Adjustments (Fair Values at the Respective Acquisition Dates) [Table 32]
1st Half
2015
€ million
Goodwill (8)
Patents and technologies 21
Other intangible assets 33
Property, plant and equipment 22
Inventories (24)
Other current assets 8
Cash and cash equivalents –
Deferred tax assets (2)
Other provisions (34)
Financial liabilities –
Other liabilities 7
Deferred tax liabilities (3)
Net assets 20
Changes in non-controlling interest –
Purchase price 20
Acquired cash and cash equivalents –
Liabilities for future payments (5)
Purchase price adjustment (18)
Payments for previous years’ / quarters’ acquisitions –
Net cash outflow for acquisitions (3)

52 Bayer Interim Report
Condensed Consolidated Interim Financial Statements as of June 30, 2015
Notes
Discontinued operations On June 8, 2015, an agreement was signed to sell the Diabetes Care business to Panasonic Healthcare Holdings Co., Ltd., Tokyo, Japan, for €1,022 million. The sale will include the leading Contour™ portfolio of blood glucose monitoring meters and strips, as well as other products such as Breeze™2, Elite™ and Microlet™ lancing devices. Closing of the transaction is subject to customary conditions, including relevant antitrust clearance, and is expected to occur in the first quarter of 2016.
The Diabetes Care activities are reported as a discontinued operation. The respective information is provided from the standpoint of the Bayer Group and is not intended to present these activities as a separate entity.
The income statements for the discontinued operation are given below:
Income Statements for Discontinued Operations [Table 33]
2nd Quarter
2014 2nd Quarter
2015 1st Half
2014 1st Half
2015
€ million € million € million € million
Net sales 230 235 433 473
Cost of goods sold (89) (96) (170) (186)
Gross profit 141 139 263 287
Selling expenses (88) (94) (163) (179)
Research and development expenses (9) (12) (17) (22)
General administration expenses (9) (6) (18) (18)
Other operating income / expenses 1 (4) 2 7
EBIT1 38 20 69 74
Financial result – – – –
Income before income taxes 38 20 69 74
Income taxes (2) (3) (6) (12)
Income after income taxes 36 17 63 62 1 EBIT = earnings before financial result and taxes 2014 figures restated
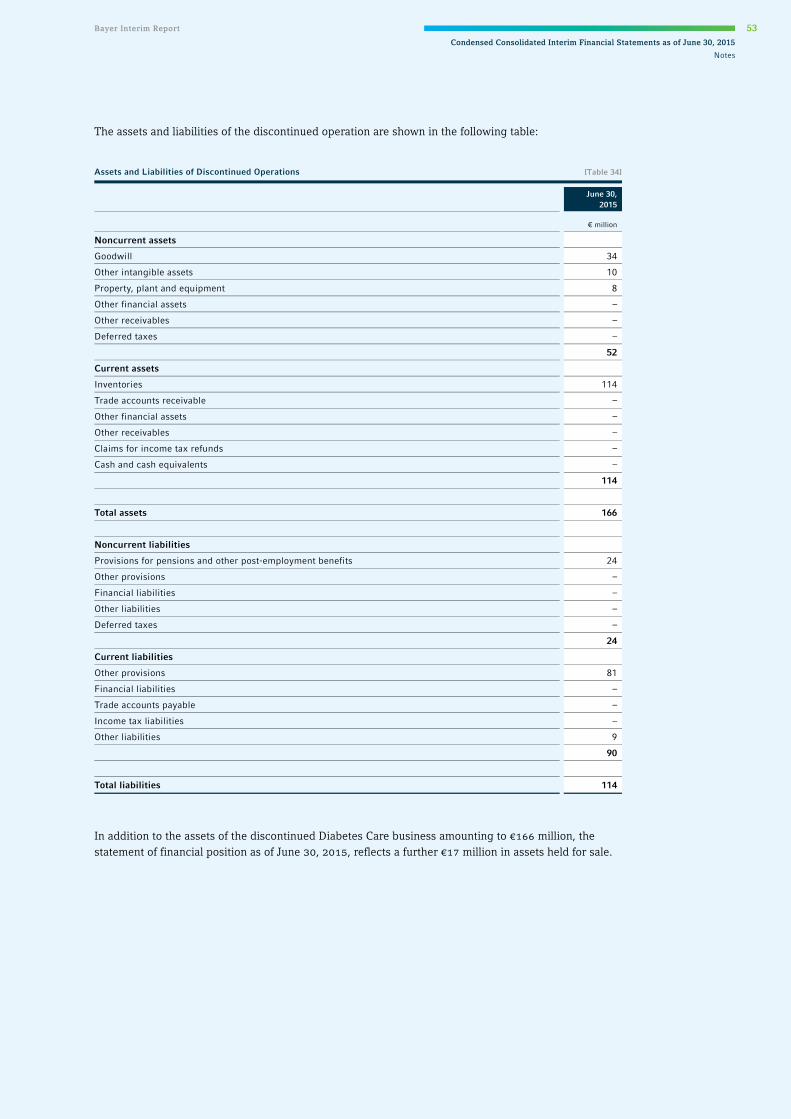
Bayer Interim Report 53
Condensed Consolidated Interim Financial Statements as of June 30, 2015
Notes
The assets and liabilities of the discontinued operation are shown in the following table:
In addition to the assets of the discontinued Diabetes Care business amounting to €166 million, the statement of financial position as of June 30, 2015, reflects a further €17 million in assets held for sale.
Assets and Liabilities of Discontinued Operations [Table 34]
June 30,
2015
€ million
Noncurrent assets
Goodwill 34
Other intangible assets 10
Property, plant and equipment 8
Other financial assets –
Other receivables –
Deferred taxes –
52
Current assets
Inventories 114
Trade accounts receivable –
Other financial assets –
Other receivables –
Claims for income tax refunds –
Cash and cash equivalents –
114
Total assets 166
Noncurrent liabilities
Provisions for pensions and other post-employment benefits 24
Other provisions –
Financial liabilities –
Other liabilities –
Deferred taxes –
24
Current liabilities
Other provisions 81
Financial liabilities –
Trade accounts payable –
Income tax liabilities –
Other liabilities 9
90
Total liabilities 114
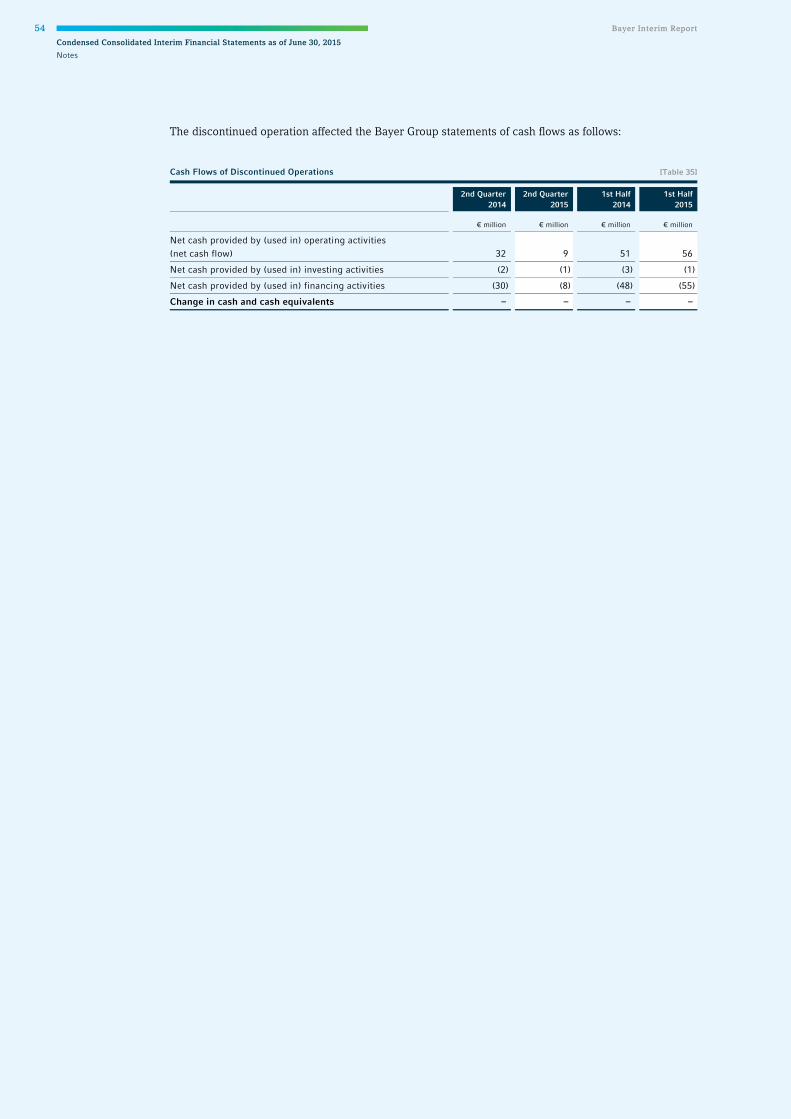
54 Bayer Interim Report
Condensed Consolidated Interim Financial Statements as of June 30, 2015
Notes
The discontinued operation affected the Bayer Group statements of cash flows as follows:
Cash Flows of Discontinued Operations [Table 35]
2nd Quarter
2014 2nd Quarter
2015 1st Half
2014 1st Half
2015
€ million € million € million € million
Net cash provided by (used in) operating activities (net cash flow) 32 9 51 56
Net cash provided by (used in) investing activities (2) (1) (3) (1)
Net cash provided by (used in) financing activities (30) (8) (48) (55)
Change in cash and cash equivalents – – – –
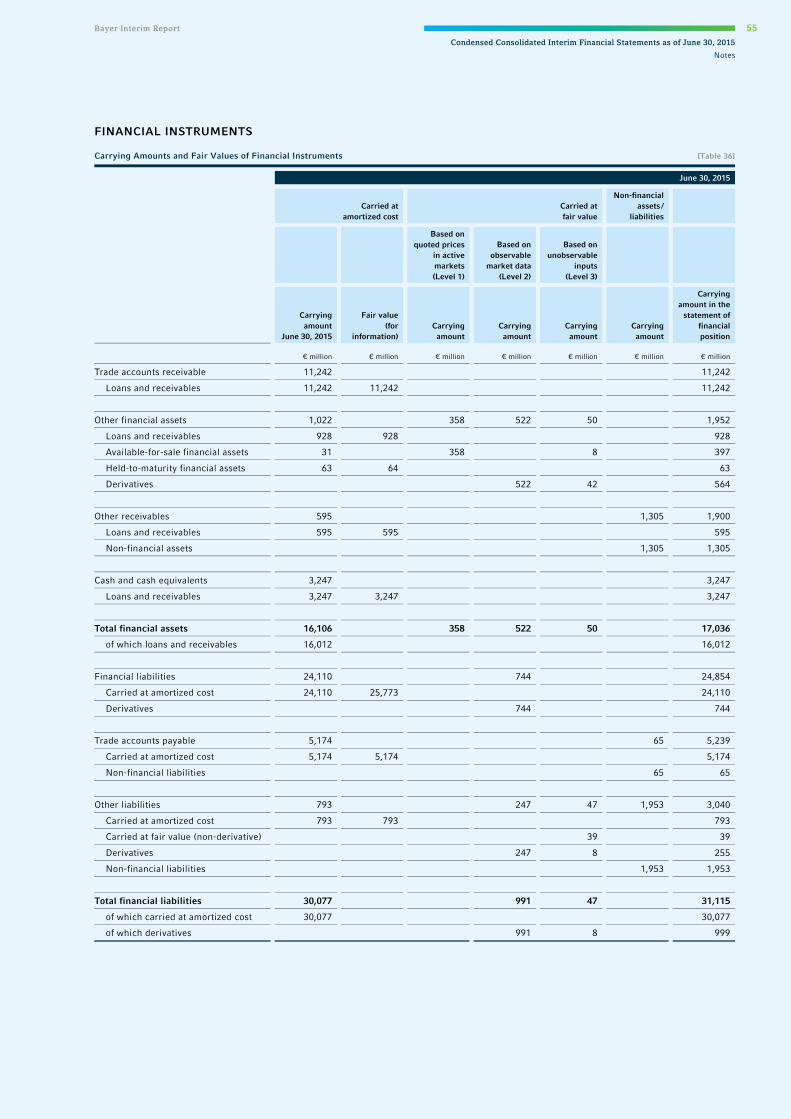
Bayer Interim Report 55
Condensed Consolidated Interim Financial Statements as of June 30, 2015
Notes
FINANCIAL INSTRUMENTS
Carrying Amounts and Fair Values of Financial Instruments [Table 36]
June 30, 2015
Carried at
amortized cost Carried at fair value
Non-financial assets /
liabilities
Based on quoted prices
in active markets (Level 1)
Based on observable
market data (Level 2)
Based on unobservable
inputs (Level 3)
Carrying amount
June 30, 2015
Fair value (for
information) Carrying amount
Carrying amount
Carrying amount
Carrying amount
Carrying amount in the
statement of financial position
€ million € million € million € million € million € million € million
Trade accounts receivable 11,242 11,242
Loans and receivables 11,242 11,242 11,242
Other financial assets 1,022 358 522 50 1,952
Loans and receivables 928 928 928
Available-for-sale financial assets 31 358 8 397
Held-to-maturity financial assets 63 64 63
Derivatives 522 42 564
Other receivables 595 1,305 1,900
Loans and receivables 595 595 595
Non-financial assets 1,305 1,305
Cash and cash equivalents 3,247 3,247
Loans and receivables 3,247 3,247 3,247
Total financial assets 16,106 358 522 50 17,036
of which loans and receivables 16,012 16,012
Financial liabilities 24,110 744 24,854
Carried at amortized cost 24,110 25,773 24,110
Derivatives 744 744
Trade accounts payable 5,174 65 5,239
Carried at amortized cost 5,174 5,174 5,174
Non-financial liabilities 65 65
Other liabilities 793 247 47 1,953 3,040
Carried at amortized cost 793 793 793
Carried at fair value (non-derivative) 39 39
Derivatives 247 8 255
Non-financial liabilities 1,953 1,953
Total financial liabilities 30,077 991 47 31,115
of which carried at amortized cost 30,077 30,077
of which derivatives 991 8 999

56 Bayer Interim Report
Condensed Consolidated Interim Financial Statements as of June 30, 2015
Notes
The table on the preceding page shows the carrying amounts and fair values of financial assets and liabilities by category of financial instrument and a reconciliation to the corresponding line item in the statements of financial position. Since the line items “Other receivables,” “Trade accounts payable” and “Other liabilities” contain both financial instruments and non-financial assets or liabilities (such as other tax receivables or advance payments for services to be received in the future), the reconciliation is shown in the column headed “Non-financial assets / liabilities.”
The loans and receivables reflected in other financial assets and the liabilities measured at amortized cost also include receivables and liabilities under finance leases in which Bayer is the lessor or lessee and which are therefore measured in accordance with ias 17.
Because of the short maturities of most trade accounts receivable and payable, other receivables and liabilities, and cash and cash equivalents, their carrying amounts at the closing date did not significantly differ from the fair values.
Receivables from government institutions and private customers in Greece are under special observa-tion in view of the government debt crisis. Although there were no material defaults on such receivables in 2015 or 2014, it is possible that future developments could result in payment delays and / or defaults. This could necessitate the recognition of impairment losses due to new occurrences. Receivables from government institutions and private customers in Greece as of June 30, 2015, totaled €138 million (June 30, 2014: €94 million).
Based on our assessment of the situation in Venezuela, we recognized impairment losses of €74 million on other receivables.
The fair value stated for noncurrent receivables, loans, held-to-maturity financial investments and non-derivative financial liabilities is the present value of the respective future cash flows. This was deter-mined by discounting the cash flows at a closing-date interest rate that takes into account the term of the assets or liabilities and the creditworthiness of the counterparty. Where a market price was availa-ble, however, this was deemed to be the fair value.
The fair values of available-for-sale financial assets correspond to quoted prices in active markets for identical assets (Level 1).
The fair values of derivatives for which no publicly quoted prices existed in active markets (Level 1) were determined using valuation techniques based on observable market data as of the end of the re-porting period (Level 2). In applying valuation techniques, credit value adjustments were determined to allow for the contracting party’s credit risk. The respective currency and commodity forward contracts were measured individually at their forward rates or forward prices on the closing date. These depend on spot rates or prices including time spreads. The fair values of interest-rate hedging instruments and cross-currency interest-rate swaps were determined by discounting future cash flows over the remain-ing terms of the instruments at market rates of interest, taking into account any foreign currency trans-lation as of the closing date.
Fair values measured using unobservable inputs are categorized within Level 3 of the fair value hierar-chy. This applies in some cases to the fair values of embedded derivatives or to obligations for contin-gent consideration in business combinations.
Embedded derivatives were separated from their respective host contracts. Such host contracts are generally sales or purchase agreements relating to the operational business. The embedded derivatives cause the cash flows from the contracts to vary with fluctuations in exchange rates, commodity prices or other prices, for example. The internal measurement of embedded derivatives is mainly performed using the discounted cash flow method, which is based on unobservable inputs (Level 3). These includ-ed planned sales and purchase volumes, and prices derived from market data. Regular monitoring is carried out based on these fair values as part of quarterly reporting.

Bayer Interim Report 57
Condensed Consolidated Interim Financial Statements as of June 30, 2015
Notes
The changes in the net amount of financial assets and liabilities recognized at fair value based on unob-servable inputs (Level 3) were as follows:
The changes recognized in profit or loss were included in other operating income or expenses.
LEGAL RISKS To find out more about the Bayer Group’s legal risks, please see Note 32 to the consolidated financial statements in the Bayer Annual Report 2014, which can be downloaded free of charge at www.bayer.com. Since the Bayer Annual Report 2014, the following significant changes have occurred in respect of the legal risks:
HEALTHCARE Yasmin™ / yaz™: As of July 17, 2015, the number of claimants in the pending lawsuits and claims in the United States totaled about 4,000 (excluding claims already settled). Claimants allege that they have suffered personal injuries, some of them fatal, from the use of Bayer’s drospirenone-containing oral contraceptive products such as Yasmin™ and / or yaz™ or from the use of Ocella™ and / or Gianvi™, ge-neric versions of Yasmin™ and yaz™, respectively, marketed by Barr Laboratories, Inc. in the United States.
As of July 17, 2015, Bayer had reached agreements, without admission of liability, to settle approximate-ly 9,900 claims in the u.s. for venous clot injuries (deep vein thrombosis or pulmonary embolism) for a total amount of about us$1.97 billion. Bayer will continue to consider the option of settling such claims after a case-specific analysis of medical records. At present, about 590 such claims are under review. In July 2015, Bayer reached an agreement in principle to settle, without admission of liability, lawsuits and claims in which plaintiffs allege an arterial thromboembolic injury (strokes and heart attacks) for a total maximum aggregate amount of us$56.9 million. Bayer may withdraw from the settlement if fewer than 97.5 percent of those who are eligible choose to participate. As of July 17, 2015, about 1,200 of the 4,000 above-mentioned claimants alleged arterial thromboembolic injuries.
Mirena™: As of July 17, 2015, lawsuits from approximately 3,350 users of Mirena™, an intrauterine system providing long-term contraception, had been served upon Bayer in the u.s. Additional lawsuits are anticipated. Plaintiffs allege personal injuries resulting from the use of Mirena™, including perfora-tion of the uterus, ectopic pregnancy, or idiopathic intracranial hypertension, and seek compensatory and punitive damages.
Xarelto™: As of July 17, 2015, lawsuits of approximately 1,200 recipients of Xarelto™, an oral anticoag-ulant for the treatment and prevention of blood clots, had been served upon Bayer in the u.s. Plaintiffs allege personal injuries from the use of Xarelto™, including cerebral, gastrointestinal or other bleeding and death, and seek compensatory and punitive damages. Additional lawsuits are anticipated. As of July 17, 2015, six lawsuits relating to Xarelto™ seeking class action certification had been served upon Bayer in Canada.
Changes in the Net Amount of Financial Assets and Liabilities Recognized at Fair Value Based on Unobservable Inputs [Table 37]
2015
€ million
Net carrying amounts, Jan. 1 (25)
Gains (losses) recognized in profit or loss 13
of which related to assets / liabilities recognized in the statement of financial position 7
Gains (losses) recognized outside profit or loss –
Additions of assets / (liabilities) –
Settlements of (assets) / liabilities 9
Reclassifications to “Liabilities directly related to assets held for sale and discontinued operations” 6
Net carrying amounts, June 30 3

58 Bayer Interim Report
Condensed Consolidated Interim Financial Statements as of June 30, 2015
Notes
Staxyn™: In Bayer’s patent infringement suit in a u.s. federal court against Watson Laboratories, Inc., the court ruled in April 2015 that both of Bayer’s compound patents are valid and infringed. Watson may appeal. Bayer’s erectile dysfunction treatment Staxyn™ is an orodispersible (orally disintegrating) formulation of Levitra™. Both drug products contain the same active ingredient, which is protected in the u.s. by the compound patents upheld by the court.
Bayer Pharma AG former shareholder litigation: In the special court proceedings initiated by former minority stockholders of Bayer Pharma AG (formerly named Bayer Schering Pharma AG), Berlin, Bayer still believes that the severance and compensation payments originally determined were adequate and that the decision that has since been taken by the District Court of Berlin in one such proceeding was incorrect. However, without acknowledging liability, Bayer has now offered a settlement providing for an increase of the compensation in both proceedings to a uniform amount. The offer is subject to all claimants in both proceedings agreeing to the settlement.
RELATED PARTIES Related parties as defined in ias 24 (Related Party Disclosures) are those legal entities and natural persons that are able to exert influence on Bayer AG and its subsidiaries or over which Bayer AG or its subsidiaries exercise control or have a significant influence. They include, in particular, non-consolidated subsidiaries, joint ventures, associates, post-employment benefit plans and the corpo-rate officers of Bayer AG. Sales to related parties were not material from the viewpoint of the Bayer Group. Goods and services to the value of €0.3 billion were procured from the associated company po jv, lp, Wilmington, Delaware, United States, mainly in the course of normal business operations. There was no significant change in receivables or payables vis-à-vis related parties compared with December 31, 2014.
OTHER INFORMATION The Annual Stockholders’ Meeting on May 27, 2015, approved the proposal by the Board of Man-agement and the Supervisory Board that a dividend of €2.25 per share be paid for the 2014 fiscal year.
The actions of the members of the Board of Management and the Supervisory Board were ratified.
One stockholder representative was elected to the Supervisory Board in accordance with the nomina-tion submitted by the Supervisory Board.
The object of the company stated in Section 2, Paragraph 1 of the Articles of Incorporation was amend-ed as proposed by the Board of Management and the Supervisory Board.
PricewaterhouseCoopers Aktiengesellschaft, Wirtschaftsprüfungsgesellschaft, Essen, was elected as auditor of the financial statements of Bayer AG and the consolidated financial statements of the Bayer Group for the fiscal year 2015 and to perform the audit review of the 2015 half-year financial report.
The Vice Chairman of the Supervisory Board, Thomas de Win, stepped down from the Supervisory Board, effective at the end of the day on June 30, 2015. He was succeeded as a member of the Super-visory Board by the respective replacement member elected by the employees, Heinz Georg Webers. The Supervisory Board elected Oliver Zühlke as its Vice Chairman.
Leverkusen, July 27, 2015 Bayer Aktiengesellschaft
The Board of Management
Dr. Marijn Dekkers Werner Baumann Johannes Dietsch Michael König Kemal Malik

Bayer Interim Report 59
Responsibility Statement
Responsibility Statement
To the best of our knowledge, and in accordance with the applicable reporting principles for interim financial reporting, the interim consolidated financial statements give a true and fair view of the assets, liabilities, financial position and profit or loss of the group, and the interim management re-port of the group includes a fair review of the development and performance of the business and the position of the group, together with a description of the principal opportunities and risks associated with the expected development of the group for the remaining months of the financial year.
Leverkusen, July 27, 2015 Bayer Aktiengesellschaft
The Board of Management
Dr. Marijn Dekkers Werner Baumann Johannes Dietsch Michael König Kemal Malik
60 Bayer Interim Report
Review Report
Review Report To Bayer AG, Leverkusen
We have reviewed the condensed consolidated interim financial statements – comprising the income statement, statement of comprehensive income, statement of financial position, statement of cash flows, condensed statement of changes in equity and selected explanatory notes – and the interim group management report of Bayer AG for the period from January 1, 2015 to June 30, 2015 which are part of the half-year financial report pursuant to § (Article) 37w Abs. (paragraph) 3 WpHG (“Wertpapierhandelsgesetz”: German Securities Trading Act). The preparation of the condensed consolidated interim financial statements in accordance with the ifrs applicable to interim financial reporting as adopted by the e.u. and of the interim group management report in accordance with the provisions of the German Securities Trading Act applicable to interim group management reports is the responsibility of the parent Company’s Board of Management. Our responsibility is to issue a review report on the condensed consolidated interim financial statements and on the interim group management report based on our review.
We conducted our review of the condensed consolidated interim financial statements and the interim group management report in accordance with German generally accepted standards for the review of financial statements promulgated by the Institut der Wirtschaftsprüfer (Institute of Public Auditors in Germany) (idw) and additionally observed the International Standard on Review Engagements “Review of Interim Financial Information Performed by the Independent Auditor of the Entity” (isre 2410). Those standards require that we plan and perform the review so that we can preclude through critical evaluation, with moderate assurance, that the condensed consolidated interim financial statements have not been prepared, in all material respects, in accordance with the ifrs applicable to interim financial reporting as adopted by the e.u. and that the interim group management report has not been prepared, in all material respects, in accordance with the provisions of the German Securi-ties Trading Act applicable to interim group management reports. A review is limited primarily to inquiries of company personnel and analytical procedures and therefore does not provide the assur-ance attainable in a financial statement audit. Since, in accordance with our engagement, we have not performed a financial statement audit, we cannot express an audit opinion.
Based on our review, no matters have come to our attention that cause us to presume that the con-densed consolidated interim financial statements have not been prepared, in all material respects, in accordance with the ifrs applicable to interim financial reporting as adopted by the e.u. nor that the interim group management report has not been prepared, in all material respects, in accordance with the provisions of the German Securities Trading Act applicable to interim group management reports.
Essen, July 28, 2015
PricewaterhouseCoopers Aktiengesellschaft Wirtschaftsprüfungsgesellschaft
Dr. Peter Bartels Eckhard Sprinkmeier Wirtschaftsprüfer Wirtschaftsprüfer

Investor RelationsPeter Dahlhoff, phone +49 214 30 33022Email: [email protected]
Date of publicationWednesday, July 29, 2015
Bayer on the Internetwww.bayer.com
ISSN 0343 / 1975
Forward-Looking Statements This Interim Report may contain forward-looking statements based on current assumptions and forecasts made by Bayer Group orsubgroup management. Various known and unknown risks, uncertainties and other factors could lead to material differences between theactual future results, financial situation, development or performance of the company and the estimates given here. These factors includethose discussed in Bayer’s public reports, which are available on the Bayer website at www.bayer.com. The company assumes no liabilitywhatsoever to update these forward-looking statements or to conform them to future events or developments.
Legal NoticeThe product names designated with ™ are brands of the Bayer Group or our distribution partners and are registered trademarksin many countries.
MASTHEAD
PublisherBayer A G, 51368 Leverkusen,Germany
EditorJörg Schäfer, phone +49 214 30 39136Email: [email protected]
English editionCurrenta GmbH & Co. OHGLanguage Service
Interim Group Management Report and Condensed Consolidated Interim Financial Statementsproduced in-house with FIRE.sys.
Financial Calendar
Q3 2015 Interim Report October 29, 2015
2015 Annual Report February 25, 2016
Q1 2016 Interim Report April 26, 2016
Annual Stockholders’ Meeting 2016 April 29, 2016
Q2 2016 Interim Report July 27, 2016
Q3 2016 Interim Report October 26, 2016