bay county community health assessment results – … assessment/bay... · top 10 leading causes...
TRANSCRIPT

P R E S E N T E D T O : B A Y C O U N T Y E X E C U T I V E A N D A D M I N I S T R A T I O N
D E C E M B E R 1 8 , 2 0 1 2
Bay County Community Health Assessment Results – 2012
Morbidity and Mortality
Morbidity - Hospitalizations

Diagnoses for Hospitalizations
2612
1719
1240 1155
756
554 502 473 447 427
0
500
1000
1500
2000
2500
3000
Michigan Department of Community Health - 2009

Heart Disease Diagnosis Hospitalization Trends Bay County 2005-2010
2,200
2,300
2,400
2,500
2,600
2,700
2,800
2,900
3,000
2005 2006 2007 2008 2009 2010
Heart Disease Trends Bay County 2005-2010
Michigan Department of Community Health - 2010

Heart Disease Diagnosis Hospitalization Trends Bay County 2005-2010
0
50
100
150
200
250
300
350
400
450
500
2005 2006 2007 2008 2009 2010
Heart Disease Trends Bay County 2005-2010
Cerebrovascular Diseases
Diseases of the Arteries
Hypertension/Hypertensive Heart Disease
Michigan Department of Community Health - 2010
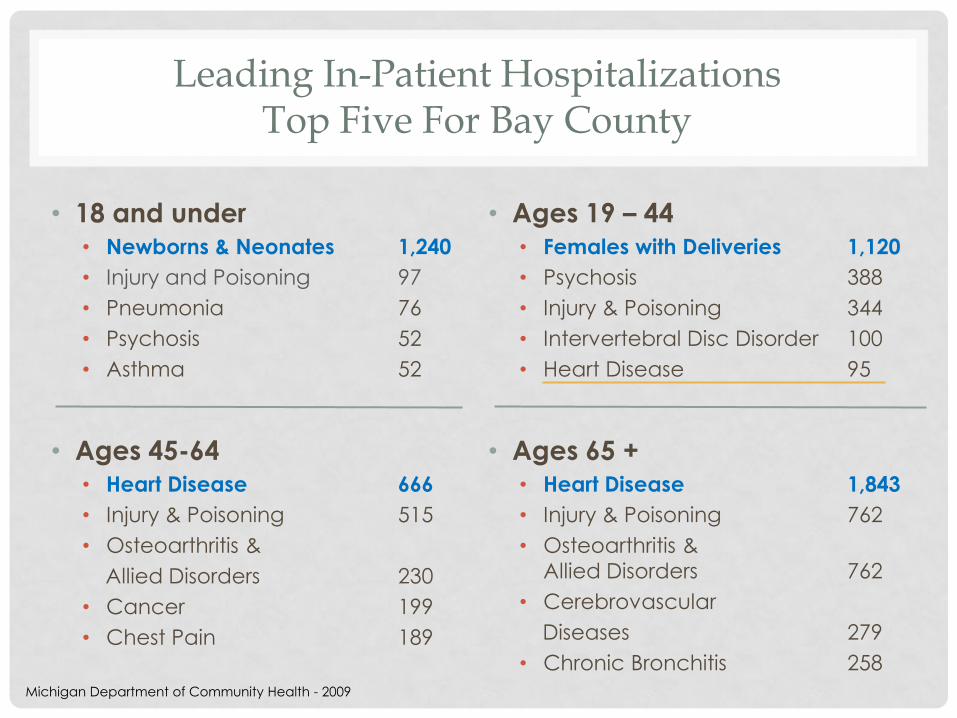
Leading In-Patient Hospitalizations Top Five For Bay County
• 18 and under • Newborns & Neonates 1,240
• Injury and Poisoning 97
• Pneumonia 76
• Psychosis 52
• Asthma 52
• Ages 45-64 • Heart Disease 666
• Injury & Poisoning 515
• Osteoarthritis &
Allied Disorders 230
• Cancer 199
• Chest Pain 189
• Ages 19 – 44 • Females with Deliveries 1,120
• Psychosis 388
• Injury & Poisoning 344
• Intervertebral Disc Disorder 100
• Heart Disease 95
• Ages 65 + • Heart Disease 1,843
• Injury & Poisoning 762
• Osteoarthritis &
Allied Disorders 762
• Cerebrovascular
Diseases 279
• Chronic Bronchitis 258
Michigan Department of Community Health - 2009

Mortality
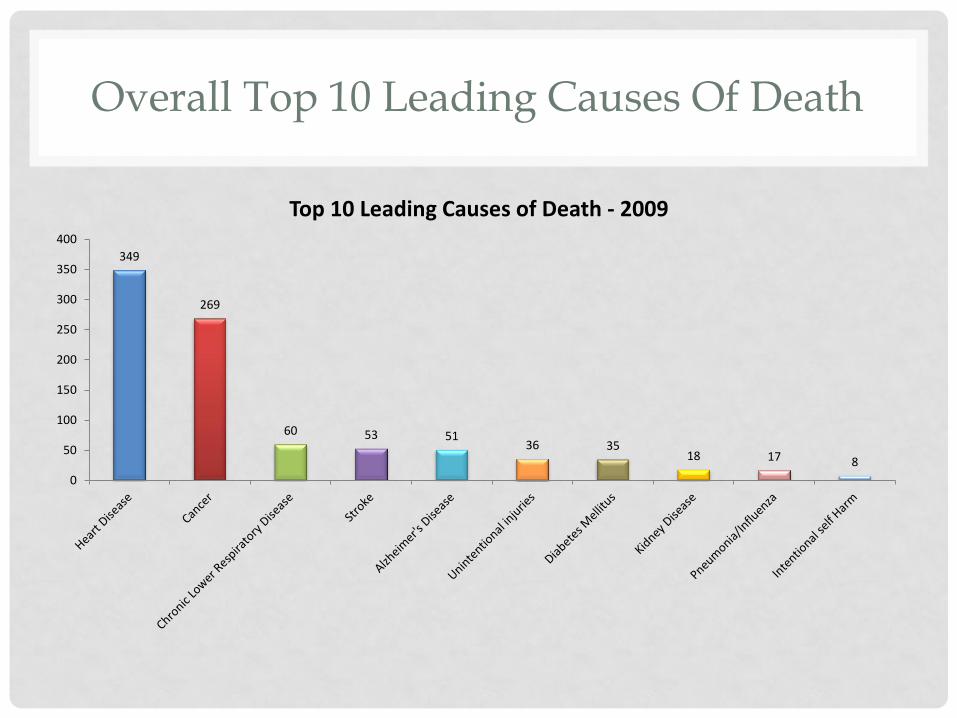
Overall Top 10 Leading Causes Of Death
349
269
60 53 51 36 35
18 17 8
0
50
100
150
200
250
300
350
400
Top 10 Leading Causes of Death - 2009
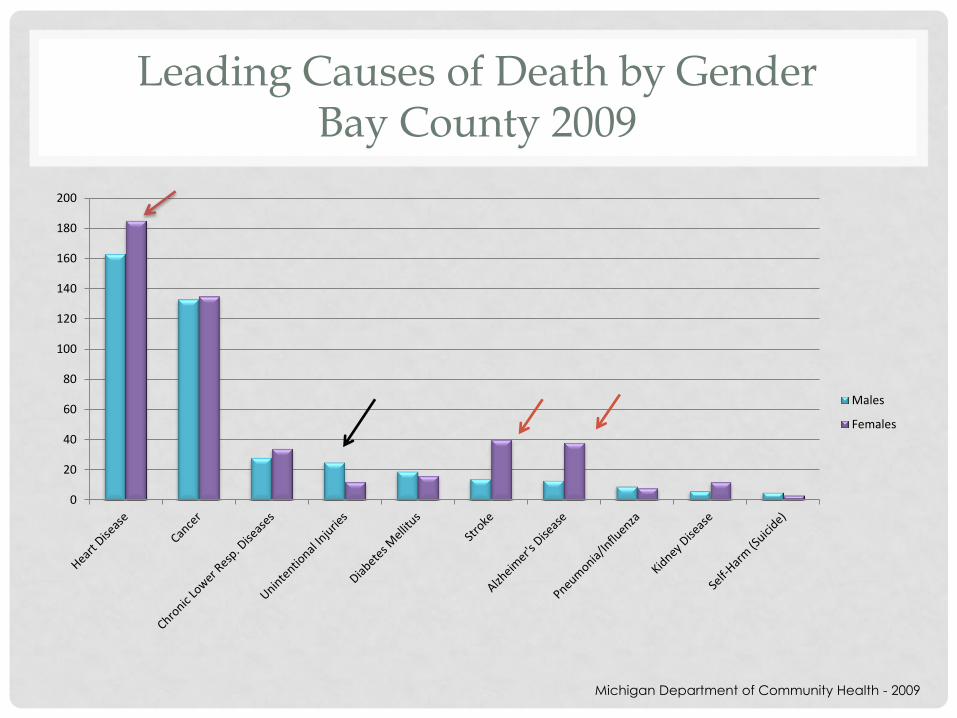
Leading Causes of Death by Gender Bay County 2009
0
20
40
60
80
100
120
140
160
180
200
Males
Females
Michigan Department of Community Health - 2009
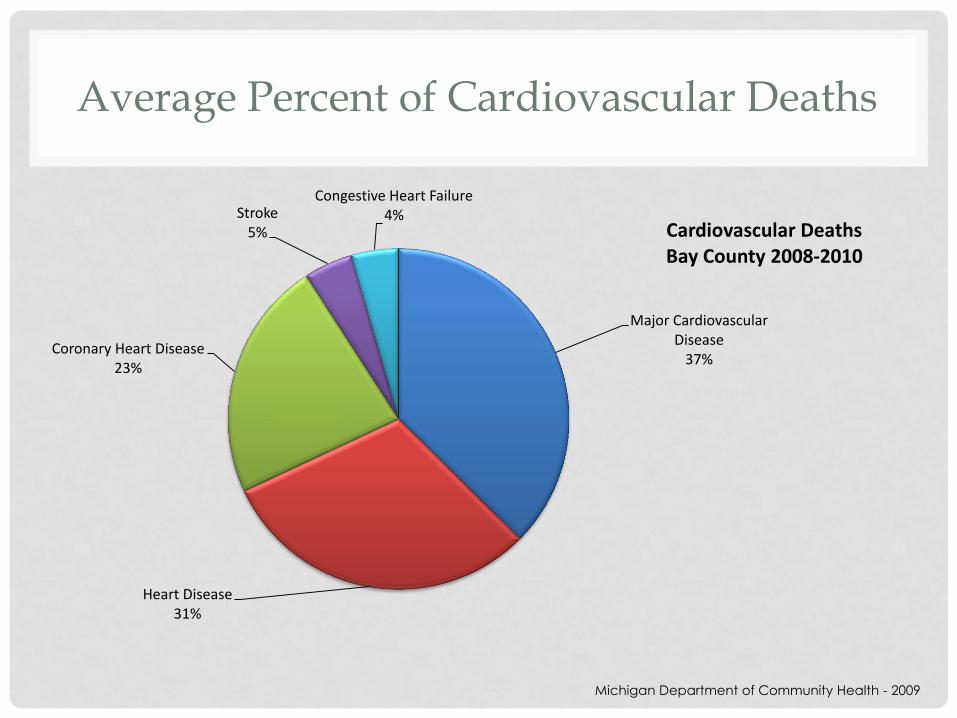
Average Percent of Cardiovascular Deaths
Major Cardiovascular Disease
37%
Heart Disease 31%
Coronary Heart Disease 23%
Stroke 5%
Congestive Heart Failure 4%
Cardiovascular Deaths Bay County 2008-2010
Michigan Department of Community Health - 2009

Heart Disease Death Rates (3 Year Trends)
320
325
330
335
340
345
350
355
360
365
370
2004-2006 2005-2007 2006-2008 2007-2009 2008-2010
Heart Disease Death Rate Trends Bay County
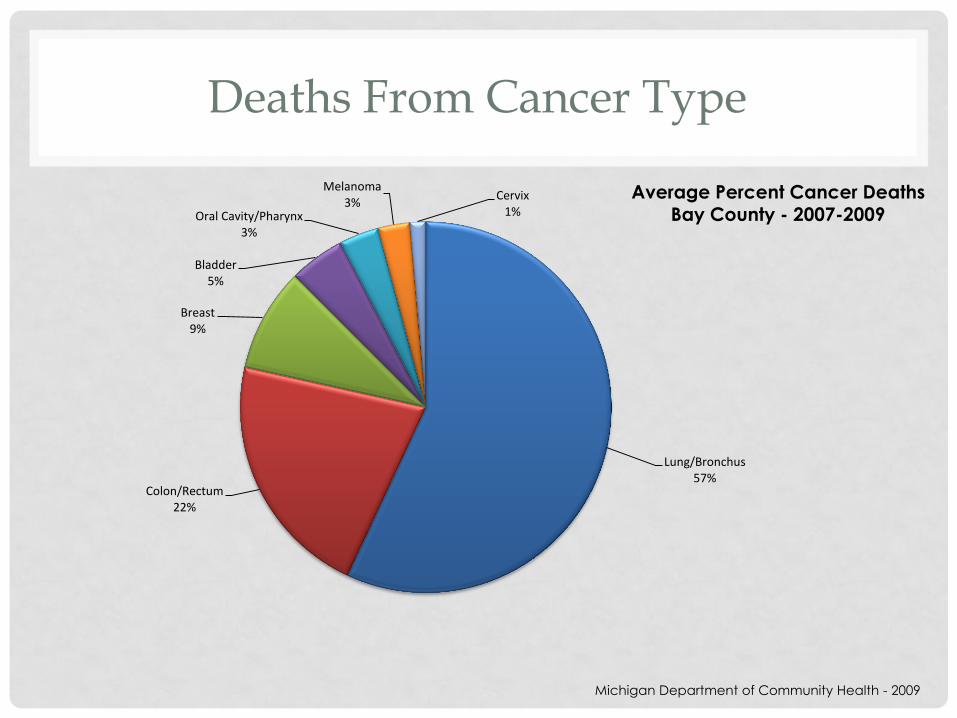
Deaths From Cancer Type
Lung/Bronchus 57%
Colon/Rectum 22%
Breast 9%
Bladder 5%
Oral Cavity/Pharynx 3%
Melanoma 3%
Cervix 1%
Average Percent Cancer Deaths Bay County - 2007-2009
Michigan Department of Community Health - 2009

Cancer Death Trends
Michigan Department of Community Health - 2010
230
235
240
245
250
255
260
265
270
275
280
2005 2006 2007 2008 2009 2010
Invasive Cancer Deaths Trends Bay County 2005-2010

Bronchitis Death Rates (3 Year Trends)
10
30
50
70
90
2004-2006 2005-2007 2006-2008 2007-2009 2008-2010
Average Rate - Chronic lower Respiratory Disease Deaths – Bay County
Michigan Department of Community Health - 2010
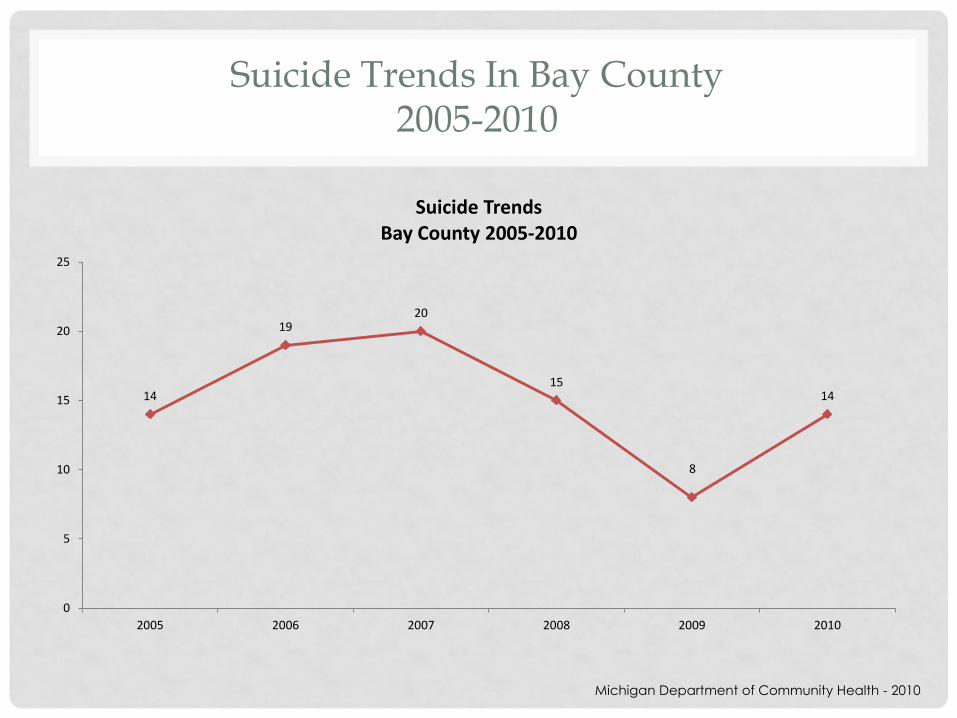
Suicide Trends In Bay County 2005-2010
14
19 20
15
8
14
0
5
10
15
20
25
2005 2006 2007 2008 2009 2010
Suicide Trends Bay County 2005-2010
Michigan Department of Community Health - 2010

What The Community Is Saying
• Most Important Healthcare Need
• Prevention and Wellness – 45%
(Includes annual checkups, health screenings and diet &
exercise)
• Primary Care – 9%
(Good doctors…That care…Listen…Don’t pass off my concerns as
me just getting older)
• Affordable Healthcare and Prescriptions – 8%
• Mental Health – 3%
2012 Bay County Web Survey

What The Community Is Saying
• What (Other) Services Would You Like to See in The
Community?
• Prevention and Education Services – 23%
• Free/Low Cost Dental Services or Clinics – 18%
• Mental Health Services – 13%
• Qualified Physicians – 7%
2012 Bay County Web Survey

What The Community Is Saying
“In the junior high, part of the junior high, they establish an office; a doctor’s office where families go, general practitioner…or even an urgent care that is centralized out of you know one of the schools.”
-Father
“I mean it’s amazing how many services are available through the county that not that many people know of to take advantage of.”
-Man
“I always thought the health department should come to the school for immunizations.”
-Teacher/Administrator

What The Community Is Saying
“I think the successes we’ve had, when we try alone as a school we fail and when the health department does an initiative, no offense, but they fail. But whenever we work together then it works. So that’s where we have the captive audience, you guys have the services. So come to our place and let’s work together on this.”
-Teacher/Administrator

What The Community Is Saying
“I think that um they need to show people how to cook. I don’t think people know how to cook anymore. They don’t know how to make homemade food and that is so much more healthier than going in the frozen food section and buying all that premade food.”
-Mother
“I agree with you on that. We had a friend that I gave one of our hams to when we had one of our pigs slaughtered, and she called me, she’s like there’s no directions.”
-Mother
What Are We Learning?
• Bay County has an aging population with the
largest growth among 55-74 year olds.
• More people are obtaining an associates or
bachelors degree.
• There was a significant increase in the number of
people below the poverty level.
• We are seeing a significant increase in people on state assistance.

What Are We Learning?
• There is a correlation between education and
receiving preventive health care.
• There is a correlation between income and
receiving preventive health care.
Higher Education = Better Employment = Higher Income =
Better/More Health Insurance = Better Health Outcomes
What Are We Learning?
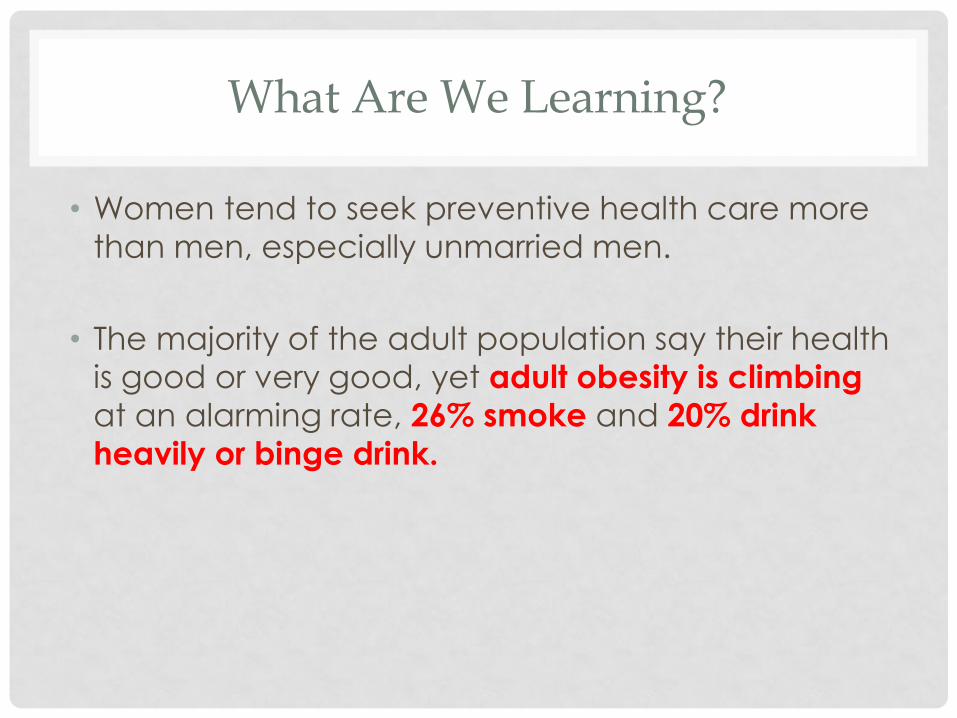
• Women tend to seek preventive health care more
than men, especially unmarried men.
• The majority of the adult population say their health
is good or very good, yet adult obesity is climbing
at an alarming rate, 26% smoke and 20% drink
heavily or binge drink.

What Are We Learning?
• Those who described their health as good or very
good had fewer poor mental health days.
• People are not seeking mental health treatment.
• Bay County does not have enough physicians or
mental health professionals.
• Prevention is priority for Bay County residents across
the spectrum.

What Are We Learning?
• Risk factors for the leading causes of death
• Obesity (inactivity, unhealthy eating)
• High Blood Pressure
• High Cholesterol
• High Blood Sugar
• Smoking
• The top 3 causes of death for Bay County (heart
Disease, Cancer and Chronic Lower Respiratory Disease, as well as
Diabetes and Kidney Disease) can be reduced by reduced
by taking preventive measures.
So…What Are We Going To Do About It???
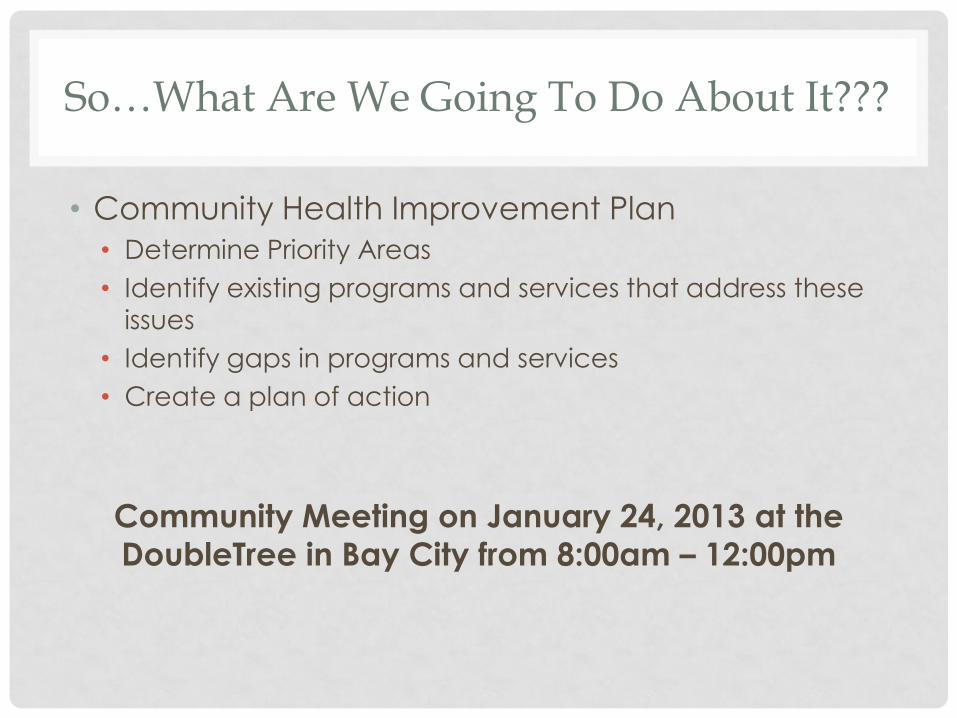
• Community Health Improvement Plan
• Determine Priority Areas
• Identify existing programs and services that address these
issues
• Identify gaps in programs and services
• Create a plan of action
Community Meeting on January 24, 2013 at the
DoubleTree in Bay City from 8:00am – 12:00pm