battery degradation in electric buses - trafikstyrelsen.dk/media/dokumenter/06 kollektiv...
TRANSCRIPT

Battery degradation
in electric buses
–

Danish Technological Institute
Title: Battery degradation in electric buses
Prepared for: Danish Transport and Construction Agency – journal id: TS200707-00017 Att.: Per Darger
Prepared by: Danish Technological Institute
Teknologiparken Kongsvang Allé 29 8000 Aarhus C Transport & Electric Systems
July 2016
Authors: Kjeld Nørregaard
Bjarne Johnsen Christian Hedegaard Gravesen

Danish Technological Institute
Page 3 of 41
Table of Contents
1. Purpose .......................................................................................................... 4
2. Short introduction to the BYD K9 electric bus ...................................................... 5
3. Preparation of test ........................................................................................... 7
3.1. List of equipment ..................................................................................... 7
3.2. Test setup .............................................................................................. 8
4. Characterization of vehicle battery via constant power discharge ........................... 9
4.1. Test procedure ........................................................................................ 9
4.2. Tested buses - overview ..........................................................................10
4.3. Test of Bus #1 .......................................................................................11
4.3.1. Bus #1 – first test, May 2014 .............................................................11
4.4. Test of Bus #2 .......................................................................................17
4.4.1. Bus #2 – First test, June 2014 ............................................................17
4.4.2. Bus #2 – Second test, December 2015 ................................................20
4.4.3. Bus #2 - comparison .........................................................................24
5. Basis for lifetime assessment ...........................................................................29
6. Lifetime assessment .......................................................................................31
7. Conclusion .....................................................................................................33
Appendix 1. Additional bus data from Bus #1 ......................................................36
Power curve ......................................................................................................36
Dynamo data .................................................................................................36
Appendix 2. Additional bus data from Bus #2 ......................................................37
Power curve ...................................................................................................37
Dynamo data .................................................................................................37
Appendix 3. Data from road test in Aarhus ..........................................................38

Danish Technological Institute
Page 4 of 41
1. Purpose
On behalf of the Danish Transport and Construction Agency, Danish Technological Institute
(DTI) is performing measurements of energy content in MOVIA’s BYD K9 electric buses
carrying around the citizens in the city of Copenhagen.
The main objective of this task is to verify the expected real battery lifetime of the electric
buses relative to the battery lifetime stated by the supplier – as best possible. For the
operator the battery life is a significant economic parameter for dissemination of electric
vehicles.
The buses were delivered to the traffic companies in November 2013. The buses were put
into operation during February and March 2014. The initial tests of the buses were per-
formed in Maj and June 2014 after a run-in period - A few thousand km and a number of
battery charging cycles ensures that all battery cells have found their normal balance. This
task only focus on the batteries in the buses, not range or other aspects like e.g. auxiliary
energy consumption.
Degradation of the battery is determined by two different methods. Primary method by
measuring any change in battery capacity and internal battery resistance at vehicle level
from start to end of test period (less than two years). Secondary method is a minor test
at battery cell level to validate consistence with BYD’s own test data at cell level. Expected
behavior of the actual Lithium Iron Phosphate chemistry is that a detectable energy con-
tent/capacity is lost with aging but only a marginal increase in internal resistance. The
actual rate of change vary significantly with the conditions of the application.
The energy content of the battery is determined by discharging and charging the battery
while measuring the amount of energy flowing to battery measuring current and voltage.
To be able to repeat the test, the discharge is performed at constant power. Temperature
has major influence on the batteries so to minimize impact on results all measurements
are performed in a room temperature laboratory on a heavy duty chassis dynamometer at
Danish Technological Institute in Aarhus.
Test at cell level is performed at a dedicated cell test facility at Danish Technological Insti-
tute in Aarhus using test setup similar to BYD. The measured results is compared to BYD
test data revealed to Danish Technological Institute only under a very strict NDA, that
prevent any publication of data or results.
For final lifetime assessment detailed logging of power, temperature, speed and distance
vs time was expected. The logging turned out to be too unstable, inconsistent and lacking
relevant battery data for any detailed prognosis. Instead general temperature observations
has been used.

Danish Technological Institute
Page 5 of 41
2. Short introduction to the BYD K9 electric bus
DTI tested two BYD K9 electric buses with the following specification:
Figure 1 BYD K9 electric bus specification.
The 324 kWh battery pack is actually three separate packs. One mounted behind the rear
axle, one mounted on the roof and one pack split in to two mounted over the front wheels.
Battery pack layout is illustrated in Figure 2.
Figure 2. Location of the batteries in the tested BYD electric buses.
Length 12000 mm
Width 2550 mm
Height 3360 mm
Wheelbase 5950 mm
Overhang (front/rear) 2600 mm / 3450 mm
Approach angle 7°
Departure angle 7°
Gradeability ≥15%
Top speed 70 km/h
Seats 29+2+1
Gross vehicle weight (GVW) 18000 kg
Type Permanent magnet synchronous in-wheel motor
Max power 2 x 90 kW
Rated power 2 x 75 kW
Max torque 2 x 350 Nm
Max speed 7500rpm
Ratio - final drive 17.7
BYD Fe battery FV200 A (540 V, 600 Ah)
Type Li-ion (Lithium Iron Phosphate battery)
Cell voltage 3.2 V
Capacity 324 kWh
Maximum charing power 2 x 30 kW
Charge time, approx. 4-5 h
Suspension Front & rear air suspension, ECAS system
Brakes Front & rear disc-braking, ABS
Steering Electric hydraulic power steering gear
Tires Michelin 275/70R 22.5
Chassis
Dimensions
Performance
Motor
Power Battery
Charger

Danish Technological Institute
Page 6 of 41
The electric motors are in wheel / wheel-hub motors integrated in the rear axle. See Fig-
ure 3.
Figure 3. Rear axle illustration. In wheel motors, disk brakes and final drive.

Danish Technological Institute
Page 7 of 41
3. Preparation of test
3.1. List of equipment
BYD standard wall-mounted charger for BYD K9 electric bus (delivered with bus)
- 3 phase AC, 50Hz, 400V, 125A, 60kW
Heavy duty chassis dynamometer
- Modified ELP 500 from AHS Prüftechnik Germany
- Modified Picaro data acquisition system from AHS Prüftechnik Germany
- Supplementary safety equipment
Analogue data acquisition:
- Agilent 34972A LXI data acquisition/switch unit (𝑓𝑠 = 0.5𝐻𝑧)
- Hameg differential voltage probe, 1 pcs.
- Fluke i1010 current clamp, 4 pcs.
Thermo elements:
- Thermocouple element type K, 4 pcs.
Forced cooling only on tractive wheels

Danish Technological Institute
Page 8 of 41
3.2. Test setup
To measure and calculate battery power and energy, battery current and voltage most be
logged simultaneously.
Current were measured at four different points, all current clamps were installed close to
the high voltage distribution box. Access to the high voltage distribution box was in the top
rear of the passenger compartment behind a cover. Current flow to the three individual
batteries were measured with the id’s I1, I2 and I3 in Figure 4 and the total current was
measured with the id I4.
Voltage was measured with an analogue differential voltage probe. The probe was installed
at the battery pack in the front of the bus, over the wheelhouses in the front. It was
possible to access this battery pack by removing two covers in the passenger compartment.
Figure 4. Block diagram of test setup.

Danish Technological Institute
Page 9 of 41
4. Characterization of vehicle battery via constant power discharge
4.1. Test procedure
The tests were carried out following this specific test procedure:
1. Preparation of the vehicle
a. Mounting of low friction tires with similar dimensions on the vehicle for safety
reasons
b. Preparation of vehicle in the chassis dynamometer (fixation, cooling etc.)
c. Locating suitable point for measurements
d. Mounting of equipment for data acquisition
e. Dynamometer compatibility test
f. Acclimatization of vehicle
g. Monitored charge until 100% state of charge
2. Performance
a. Calculation of load and speed for the constant power discharge test
i. 𝐶/4 = 324𝑘𝑊ℎ/4 = 81𝑘𝑊
b. Measurement of vehicle power curve
c. Measurement of drive train losses
d. Drivers training
e. Verification of acquired data
f. Measurement of battery step response
i. Accelerate to desired speed
ii. Shift to neutral
iii. Let vehicle roll-off and then stop for 10 seconds
iv. Accelerate with maximum power until desired speed
g. Stop driving
h. Monitored charge until 100% state of charge
3. C/4 constant power discharge – driving the vehicle at constant battery power until
the BMS ends the driving
a. Start driving at constant battery power
b. Measurement of battery step response at 98%
i. Shift to neutral
ii. Let vehicle roll-off and then stop for 10 seconds
iii. Accelerate with maximum power until desired speed
iv. Resume driving
c. Measurement of battery step response at 88%
d. Measurement of battery step response at 75%
e. Measurement of battery step response at 63%
f. Load calibration and break after driving 100km since start
g. Resume constant power discharge
h. Measurement of battery step response at 50%
i. Measurement of battery step response at 38%
j. Break after driving 200km since start
k. Resume constant power discharge
l. Measurement of battery step response at 25%
m. Measurement of battery step response at 5%
n. Driving until first BMS cut-off
o. Analysis of acquired data and calculation of energy content, capacity and
internal DC resistance.

Danish Technological Institute
Page 10 of 41
From an expectation of the driver being able to drive constantly throughout the whole test,
the test duration was prepared to finish after four hours of time, excluding two minor
breaks to let the tires of the vehicle to cool down and to hydrate the driver.
4.2. Tested buses - overview
Two BYD K9 electric buses were tested.
Keolis Danmark A/S (former: Citytrafik) operated bus #1, the bus had registration
XN94638. The first test was performed in May 2014. Due to a replacement of a battery
pack on this vehicle, the Keolis Danmark bus has only been tested once – no second test
was performed. DTI is informed that replacement was due to an unauthorized opening of
the battery packs. Sealing of the batteries have been broken and the batteries were sub-
sequently damaged by leaking water. This meant that BYD had to replace one of the bat-
tery packs.
Arriva Danmark A/S operated bus #2, the bus had registration XT93686. The first test was
performed in June 2014 and the second test was performed in December 2015.
Table 1. Bus id overview.
Bus id Registration Operator First test Second test
Bus #1 NX 94 639 Keolis Danmark A/S 2014 May Not performed
Bus #2 XT 93 686 Arriva 2014 June 2015 December

Danish Technological Institute
Page 11 of 41
4.3. Test of Bus #1
The constant power discharge test for Bus #1 was recorded according to the test described
in section 4.1.
The results from the constant power discharge test and the following charge are shown in
chapter 4.3.1 – only one test was performed for Bus #1. These values have been measured
at different points with focus on energy for comparison. The electricity meters were meas-
uring the energy drawn from the electric grid, which includes losses during charging.
4.3.1. Bus #1 – first test, May 2014
Test parameters listed in Table 2.
Discharge test Date 7th of May 2014
Odometer at test start km 10097
Number of active charge connectors # 2
Discharge test Driven distance km 212
Table 2. Test parameters: Bus #1, first test.
The values in Table 3 first column includes the base values for the battery efficiency, which
gives approximately 89% when calculating energy in and out of the battery and approxi-
mately 84% when calculating power drawn from the wall socket to energy of the battery.
Unit Measured at battery Measured inlet to charger
Discharge capacity Ah 531.2
Discharge energy kWh 282.8
Charge energy kWh 319.5 335.2 Table 3. Energy content and capacity measurements.
Figure 5 shows the complete constant power discharge. The discharge was performed at
constant speed and with a static load to match the desired battery power of 81 kW.
The discharge test was divided into parts of 100 km of driven distance and the total test
duration was approximately 6.5 hours. This included 1.5 hours of interruption for equip-
ment adjustments, preliminary test evaluation and lunch break.
The peaks in battery current in Figure 5 shows the battery step response.
The battery voltage was measured at the front battery inside the bus. The battery currents
were measured at the high voltage distribution box at the top rear end of the bus. The
battery temperatures were measured at the top of the battery cases, except with the roof
battery due to safety reasons.
The end of the graph indicates that the battery current did increase to keep the battery
power constant. This yields a constant vehicle performance, but a faster discharge at this
point.

Danish Technological Institute
Page 12 of 41
Figure 5. Overview of battery voltage, current and power during constant power dis-
charge.
All temperatures in Figure 6 increased during the test and decreased during breaks. The
rear battery temperature raised more than the other battery temperatures did, which was
probably caused by the proximity of the rear axle and motors.
Figure 6. Battery temperatures compared to discharge power.
The availability of the individual battery current at the high voltage distribution box made
it possible to measure the distribution of load to each battery. Figure 7 shows this distri-
bution throughout the discharge test.
Load steps Load steps

Danish Technological Institute
Page 13 of 41
Figure 7. Overview of distribution of load current between batteries.
In the first part of the discharge test, the battery currents were almost equal. Small vari-
ations were observed during load steps.
The second part of the discharge test showed abnormal behavior, as the rear battery cur-
rent was observed at 𝐼1 = 0𝐴, when resuming the test after the break, indicating that the
front and roof batteries must have drawn the full load without any warning. The graphs in
Figure 8 shows that the rear battery reconnected at 14:50 confirming that the rear battery
was disconnected. Suddenly a very high current (almost 550 A) was observed in the ana-
logue data. The current appeared between the three batteries as a result of different states
of charge between the batteries, which was caused by the disruption of the rear battery
for more than one hour. This data amounts to 𝑓𝑠 = 0.5𝐻𝑧, which does not include fast tran-
sients. This means that the actual value was probably even higher than the observed value.
Prior to the reconnection of the rear battery, the other batteries showed minor instability
in their currents, from the time 14:20.

Danish Technological Institute
Page 14 of 41
Figure 8. Distribution of load current between batteries. Zoom on driven distance 100 to
200km (middle part).
After the reconnection, the rear battery current was driving full load and charging the other
batteries for a period time, implying a rear battery current exceeding 100 A (Figure 9). At
the short break at around 15:30 the batteries had time balanced each other.
Figure 10 shows the last part of the test. The batteries are almost empty and beginning to
cut-out and in again, preserving full power until the end. Just after 15:53, all three batter-
ies disconnected at the same time, which was the end criteria.
With the throttle pedal still fully depressed for a few minutes, the driving was resumed five
times, not being able to drive more than a few meters. This indicated that the voltage in
each battery controlled the BMS cut-off. The cut-in/out-behavior may be a result of hyste-
resis in the voltage control.

Danish Technological Institute
Page 15 of 41
Figure 9. Battery reconnect and balancing charge between batteries.
Figure 10. Distribution of load current between batteries. Zoom on driven distance 200
to 212 km (last part).

Danish Technological Institute
Page 16 of 41
Figure 11. Distribution of energy and capacity in the over-night battery charge.
Results from data acquired during the over-night battery charge are shown in Figure 11.
The figure represents four separate battery capacity and battery energy measurements,
illustrated in Figure 4. The data indicates that the amount of electrons were equally trans-
ferred to each of the batteries. And the difference between the measured total and the
measured sum of rear, roof and front battery is well within the calculated tolerances.

Danish Technological Institute
Page 17 of 41
4.4. Test of Bus #2
The constant power discharge tests for Bus #2 were recorded according to the test de-
scribed in section 4.1.
The Bus #2 results from the constant power discharge and the following charge are shown
for the first test in chapter 4.4.1 and results from the second test in chapter 4.4.2. These
values have been measured at different points with focus on energy for comparison. The
electricity meters were measuring the energy drawn from the electric grid, which includes
losses during charging.
4.4.1. Bus #2 – First test, June 2014
Test parameters listed in Table 4.
Discharge test Date 17th of June 2014
Odometer at test start km 9233
Number of active charge connectors # 2
Discharge test Driven distance km 192
Table 4. Test parameters: Bus #2, first test.
The values in the first column of Table 5 includes the base values for the battery efficiency,
which gives approximately 93% when calculating energy in and out of the battery and
approximately 89% when calculating power drawn from the wall socket to energy of the
battery.
Unit Measured at battery Measured before charger
Discharge capacity Ah 561.5
Discharge energy kWh 306.8
Charge energy kWh 328.0 344.3 Table 5. Energy content and capacity measurements.
Figure 12 shows the view over the complete constant power discharge. The discharge was
performed at constant speed and with a static load to match the desired battery power of
81kW.
The discharge test was divided into parts of 100 km of driven distance and the total test
duration was approximately 5.5 hours. This included 1.5 hours of interruption for equip-
ment adjustments, preliminary test evaluation and lunch break.
The peaks in battery current in Figure 12 shows the battery step response performed dur-
ing the discharge test.

Danish Technological Institute
Page 18 of 41
Figure 12. Overview of battery voltage, current and power during constant power dis-
charge.
All temperatures in Figure 13 increased during the test and decreased during breaks. The
rear battery temperature raised more compared to the other battery temperatures during
the test, which was probably caused by the proximity of the rear axle and motors.
Figure 13. Battery temperatures compared to discharge power.
The availability of the individual battery current at the high voltage distribution box made
it possible to measure the distribution of load to each battery. Figure 14 shows this distri-
bution throughout the discharge test.
-100
0
100
200
300
400
500
600
7001
7-0
6-1
4 k
l. 0
8:1
61
7-0
6-1
4 k
l. 0
8:2
61
7-0
6-1
4 k
l. 0
8:3
61
7-0
6-1
4 k
l. 0
8:4
61
7-0
6-1
4 k
l. 0
8:5
61
7-0
6-1
4 k
l. 0
9:0
61
7-0
6-1
4 k
l. 0
9:1
61
7-0
6-1
4 k
l. 0
9:2
61
7-0
6-1
4 k
l. 0
9:3
61
7-0
6-1
4 k
l. 0
9:4
61
7-0
6-1
4 k
l. 0
9:5
61
7-0
6-1
4 k
l. 1
0:0
61
7-0
6-1
4 k
l. 1
0:1
61
7-0
6-1
4 k
l. 1
0:2
61
7-0
6-1
4 k
l. 1
0:3
61
7-0
6-1
4 k
l. 1
0:4
61
7-0
6-1
4 k
l. 1
0:5
61
7-0
6-1
4 k
l. 1
1:0
61
7-0
6-1
4 k
l. 1
1:1
61
7-0
6-1
4 k
l. 1
1:2
61
7-0
6-1
4 k
l. 1
1:3
61
7-0
6-1
4 k
l. 1
1:4
61
7-0
6-1
4 k
l. 1
1:5
61
7-0
6-1
4 k
l. 1
2:0
61
7-0
6-1
4 k
l. 1
2:1
61
7-0
6-1
4 k
l. 1
2:2
61
7-0
6-1
4 k
l. 1
2:3
61
7-0
6-1
4 k
l. 1
2:4
61
7-0
6-1
4 k
l. 1
2:5
61
7-0
6-1
4 k
l. 1
3:0
61
7-0
6-1
4 k
l. 1
3:1
61
7-0
6-1
4 k
l. 1
3:2
61
7-0
6-1
4 k
l. 1
3:3
61
7-0
6-1
4 k
l. 1
3:4
61
7-0
6-1
4 k
l. 1
3:5
61
7-0
6-1
4 k
l. 1
4:0
61
7-0
6-1
4 k
l. 1
4:1
61
7-0
6-1
4 k
l. 1
4:2
61
7-0
6-1
4 k
l. 1
4:3
61
7-0
6-1
4 k
l. 1
4:4
6
Vb_front [V] I_total [A] Power
-20
0
20
40
60
80
100
120
140
160
0
5
10
15
20
25
30
35
40
45
17
-06
-14
kl.
08
:36
17
-06
-14
kl.
08
:46
17
-06
-14
kl.
08
:56
17
-06
-14
kl.
09
:06
17
-06
-14
kl.
09
:16
17
-06
-14
kl.
09
:26
17
-06
-14
kl.
09
:36
17
-06
-14
kl.
09
:46
17
-06
-14
kl.
09
:56
17
-06
-14
kl.
10
:06
17
-06
-14
kl.
10
:16
17
-06
-14
kl.
10
:26
17
-06
-14
kl.
10
:36
17
-06
-14
kl.
10
:46
17
-06
-14
kl.
10
:56
17
-06
-14
kl.
11
:06
17
-06
-14
kl.
11
:16
17
-06
-14
kl.
11
:26
17
-06
-14
kl.
11
:36
17
-06
-14
kl.
11
:46
17
-06
-14
kl.
11
:56
17
-06
-14
kl.
12
:06
17
-06
-14
kl.
12
:16
17
-06
-14
kl.
12
:26
17
-06
-14
kl.
12
:36
17
-06
-14
kl.
12
:46
17
-06
-14
kl.
12
:56
17
-06
-14
kl.
13
:06
17
-06
-14
kl.
13
:16
17
-06
-14
kl.
13
:26
17
-06
-14
kl.
13
:36
17
-06
-14
kl.
13
:46
17
-06
-14
kl.
13
:56
17
-06
-14
kl.
14
:06
17
-06
-14
kl.
14
:16
17
-06
-14
kl.
14
:26
17
-06
-14
kl.
14
:36
17
-06
-14
kl.
14
:46
Bat
tery
po
wer
[kW
]
Bat
tery
tem
per
atu
res
[°C
]
T_Front T_ambient T_Top T_Rear Power
Load steps Load steps

Danish Technological Institute
Page 19 of 41
Figure 14. Overview of distribution of load current between batteries.
Figure 15. Distribution of energy and capacity in the over-night battery charge.
Results from data acquired during the over-night battery charge are shown in Figure 15.
The figure represents four separate battery capacity and battery energy measurements,
illustrated in Figure 4. The data indicates that the amount of electrons were equally trans-
ferred to each of the batteries. And the difference between the measured total and the
measured sum of rear, roof and front battery is well within the calculated tolerances.
-100
-50
0
50
100
150
200
250
300
17
-06
-14
kl.
08
:36
17
-06
-14
kl.
08
:46
17
-06
-14
kl.
08
:56
17
-06
-14
kl.
09
:06
17
-06
-14
kl.
09
:16
17
-06
-14
kl.
09
:26
17
-06
-14
kl.
09
:36
17
-06
-14
kl.
09
:46
17
-06
-14
kl.
09
:56
17
-06
-14
kl.
10
:06
17
-06
-14
kl.
10
:16
17
-06
-14
kl.
10
:26
17
-06
-14
kl.
10
:36
17
-06
-14
kl.
10
:46
17
-06
-14
kl.
10
:56
17
-06
-14
kl.
11
:06
17
-06
-14
kl.
11
:16
17
-06
-14
kl.
11
:26
17
-06
-14
kl.
11
:36
17
-06
-14
kl.
11
:46
17
-06
-14
kl.
11
:56
17
-06
-14
kl.
12
:06
17
-06
-14
kl.
12
:16
17
-06
-14
kl.
12
:26
17
-06
-14
kl.
12
:36
17
-06
-14
kl.
12
:46
17
-06
-14
kl.
12
:56
17
-06
-14
kl.
13
:06
17
-06
-14
kl.
13
:16
17
-06
-14
kl.
13
:26
17
-06
-14
kl.
13
:36
17
-06
-14
kl.
13
:46
17
-06
-14
kl.
13
:56
17
-06
-14
kl.
14
:06
17
-06
-14
kl.
14
:16
17
-06
-14
kl.
14
:26
17
-06
-14
kl.
14
:36
17
-06
-14
kl.
14
:46
Bat
tery
cu
rren
ts [
A]
I_1 [A] I_2 [A] I_3 [A] I_total [A]

Danish Technological Institute
Page 20 of 41
4.4.2. Bus #2 – Second test, December 2015
Test parameters listed in Table 6.
Discharge test Date 17th of December 2015
Odometer at test start km 53799
Number of active charge connectors # 1
Discharge test Driven distance km 186
Table 6. Test parameters: Bus #2, second test.
The values in Table 7 first column includes the base values for the battery efficiency, which
gives approximately 97% when calculating energy in and out of the battery and approxi-
mately 93% when calculating power drawn from the wall socket to energy of the battery.
Unit Measured at battery Measured before charger
Discharge capacity Ah 551.3
Discharge energy kWh 295.5
Charge energy kWh 303.3 316.8 Table 7 Energy content and capacity measurements.
Figure 16 shows the view over the complete constant power discharge. The discharge was
performed at constant speed and with a static load to match the desired battery power of
81 kW.
The duration of the discharge test was approximately 4 hours. This test was performed in
one session. Immediately after disconnecting the charger, the discharge test was started.
The peaks in battery current in Figure 16 is the measured battery step response. Subsys-
tems such as the internal compressor did not run prior to the start of the test. At approx-
imately 10:20 in Figure 16 the compressor cuts off. The load therefore had to be adjusted
to maintain a total battery power output of 81 kW at constant speed. As the voltage de-
creases towards the end of the test the battery current increases to keep a constant power
output.

Danish Technological Institute
Page 21 of 41
Figure 16. Overview of battery voltage, current and power during constant power dis-
charge.
-200
-100
0
100
200
300
400
500
6000
9:5
6:2
7
10
:05
:57
10
:15
:27
10
:24
:58
10
:34
:28
10
:43
:58
10
:53
:28
11
:02
:59
11
:12
:29
11
:21
:59
11
:31
:29
11
:41
:00
11
:50
:30
12
:00
:00
12
:09
:30
12
:19
:00
12
:28
:31
12
:38
:01
12
:47
:31
12
:57
:01
13
:06
:32
13
:16
:02
13
:25
:32
13
:35
:02
13
:44
:33
13
:54
:03
Vb_front[V] I_total[A] Power[kW]

Danish Technological Institute
Page 22 of 41
Temperatures increased during the test and since there was no break after 100 km it was
therefore necessary to lower the ambient temperature.
Figure 17. Battery temperatures compared to discharge power.
Figure 18 shows the distribution of load to each battery throughout the discharge test.
Figure 18 Overview of distribution of load current between batteries.
-80
-30
20
70
120
0
10
20
30
40
50
60
10
:07
:41
10
:17
:11
10
:26
:41
10
:36
:12
10
:45
:42
10
:55
:12
11
:04
:42
11
:14
:12
11
:23
:43
11
:33
:13
11
:42
:43
11
:52
:13
12
:01
:44
12
:11
:14
12
:20
:44
12
:30
:14
12
:39
:45
12
:49
:15
12
:58
:45
13
:08
:15
13
:17
:46
13
:27
:16
13
:36
:46
13
:46
:16
Bat
tery
po
wer
[kW
]
Bat
tery
tem
per
atu
res[
°C]
T_front[°C] T_rear[°C] T_top[°C] T_ambient[°C] Power[kW]
-200
-150
-100
-50
0
50
100
150
200
250
300
09
:56
:27
10
:05
:57
10
:15
:27
10
:24
:58
10
:34
:28
10
:43
:58
10
:53
:28
11
:02
:59
11
:12
:29
11
:21
:59
11
:31
:29
11
:41
:00
11
:50
:30
12
:00
:00
12
:09
:30
12
:19
:00
12
:28
:31
12
:38
:01
12
:47
:31
12
:57
:01
13
:06
:32
13
:16
:02
13
:25
:32
13
:35
:02
13
:44
:33
13
:54
:03
Bat
tery
cu
rren
ts[A
]
I_total[A] I_1[A] I_2[A] I_3[A]

Danish Technological Institute
Page 23 of 41
Figure 19 Distribution of energy and capacity in the over-night battery charge.
Results from data acquired during the over-night battery charge are shown in Figure 19.
The figure represents four separate battery capacity and battery energy measurements,
illustrated in Figure 4. The data indicates that the amount of electrons were equally trans-
ferred to each of the batteries. And the difference between the measured total and the
measured sum of rear, roof and front battery is well within the calculated tolerances.
Danish Technological Institute
Page 24 of 41
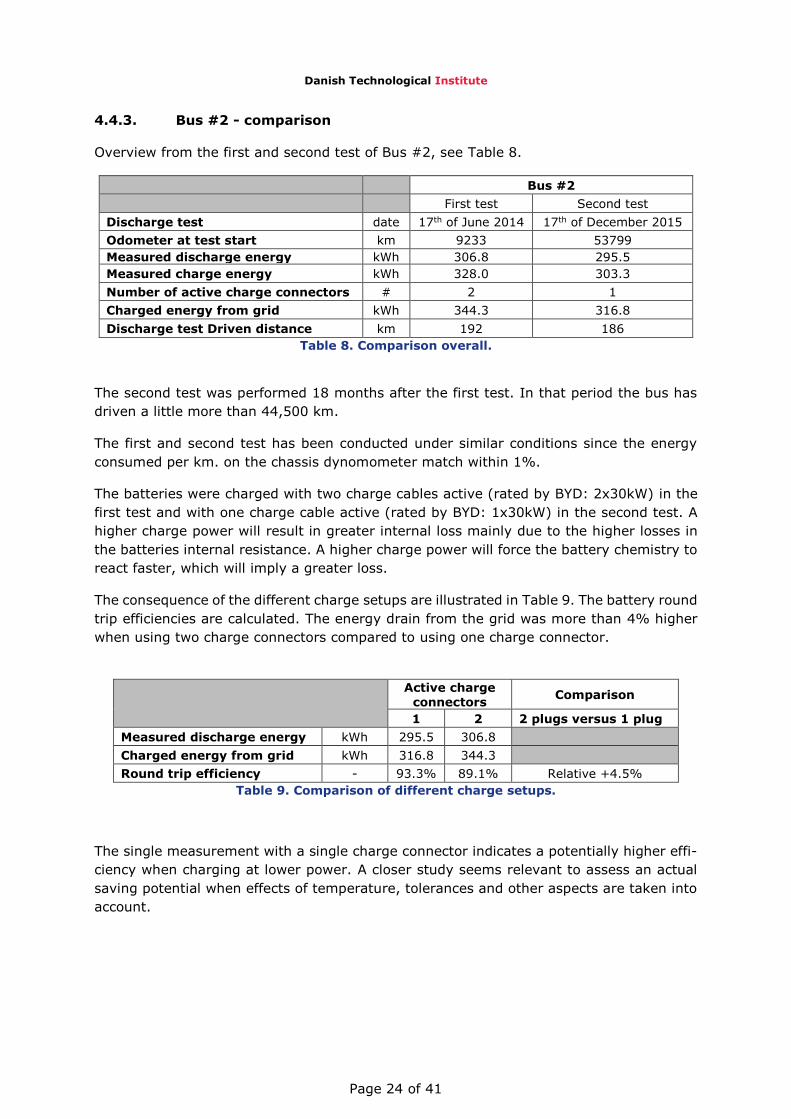
4.4.3. Bus #2 - comparison
Overview from the first and second test of Bus #2, see Table 8.
Bus #2
First test Second test
Discharge test date 17th of June 2014 17th of December 2015
Odometer at test start km 9233 53799
Measured discharge energy kWh 306.8 295.5
Measured charge energy kWh 328.0 303.3
Number of active charge connectors # 2 1
Charged energy from grid kWh 344.3 316.8
Discharge test Driven distance km 192 186
Table 8. Comparison overall.
The second test was performed 18 months after the first test. In that period the bus has
driven a little more than 44,500 km.
The first and second test has been conducted under similar conditions since the energy
consumed per km. on the chassis dynomometer match within 1%.
The batteries were charged with two charge cables active (rated by BYD: 2x30kW) in the
first test and with one charge cable active (rated by BYD: 1x30kW) in the second test. A
higher charge power will result in greater internal loss mainly due to the higher losses in
the batteries internal resistance. A higher charge power will force the battery chemistry to
react faster, which will imply a greater loss.
The consequence of the different charge setups are illustrated in Table 9. The battery round
trip efficiencies are calculated. The energy drain from the grid was more than 4% higher
when using two charge connectors compared to using one charge connector.
Active charge connectors
Comparison
1 2 2 plugs versus 1 plug
Measured discharge energy kWh 295.5 306.8
Charged energy from grid kWh 316.8 344.3
Round trip efficiency - 93.3% 89.1% Relative +4.5%
Table 9. Comparison of different charge setups.
The single measurement with a single charge connector indicates a potentially higher effi-
ciency when charging at lower power. A closer study seems relevant to assess an actual
saving potential when effects of temperature, tolerances and other aspects are taken into
account.

Danish Technological Institute
Page 25 of 41
Adapted internal resistance
Figure 20 shows an example of the step response measurement. Directly from the dis-
charge test, the vehicle was shifted into neutral (to avoid regeneration), rolled off until 0
km/h and waiting for 10 seconds giving the batteries time to stabilize zero load voltage.
This method was used to make comparable results, in respect to the fact that it takes much
longer time to get fully stabile open circuit voltage. From here the vehicle was accelerated
with the throttle fully applied until discharge test speed and the constant power discharge
was continued, as indicated with yellow circles in Figure 20.
Figure 20. Example on load step. The battery step response reflects the resistance inter-nally in the battery. Indication with yellow circles which values were used for calculation the internal resistance – Left axis represents Voltage and right axis represents both cur-
rent and power.

Danish Technological Institute
Page 26 of 41
Load steps were performed for every approximately 12.5% discharge in energy to deter-
mine the battery internal DC resistance, the results are shown in Figure 21. This value
varies with state of charge and therefore it needs to be recalculated along with the battery
discharge level.
Taking the gradient (dU/dI) between battery voltage and total current before and after
load step, the adapted internal resistance was calculated. Please see Figure 21.
Figure 21. Battery internal resistance compared to discharged energy.
Battery internal resistance is a very complex function and the actual measurements are
only a representation used for comparison under similar conditions – it cannot be used
directly to characterize the battery or to assess any specific change in the battery State
of Heath (SoH). The results from the adapted internal resistance test did not visualize
any significant change from first to second test. This indicates that the load step re-
sponse of the battery has not deteriorated from the first to the second test.

Danish Technological Institute
Page 27 of 41
Battery voltage compared to discharged energy
The graph in Figure 22 shows the battery voltage progress versus discharged energy during
constant power discharge. The end value showed the energy content of the total battery
at the time of the measurement. The two tests performed under similar conditions on the
Bus #2 indicated a 3.7% degradation of discharged capacity. There is no clear explanation
for a higher cut-of voltage at second test. It may be caused by a single battery cell reaching
minimum level slightly earlier due to a marginal unbalance or difference in cell capacity.
The “constant voltage”-plateau was lower under the second test. The lower voltage plateau
indicates a slight increase in battery impedance. The combined effect indicates a degra-
dation in energy content of the batteries comparing between first and second test.
Figure 22. Battery voltage compared to discharged energy.
BYD expect the impedance to increase around 10% during the first few hundred cycles but
then the impedance stabilizes at a constant level until end of useful life. This can explain
the lower voltage during discharge at second test. The change in impedance is considered
less critical since it will stabilize at a nearly constant level.
The critical degradation is the capacity fade that will continue until end of life. The capacity
fade is expected to continue at a slightly lower rate after the first years.
The battery degradation is clearly measurable but not excessive compared to the expected
levels suggested from battery data. The measured degradation consists of different mech-
anisms:
1. Capacity degradation – less available energy from the battery. From the Voltage
versus Ah curve it can be seen that further capacity fade will result in shorter
range. Capacity degradation is primarily the combined effects of
a. Calendar aging -
Lithium Ion batteries are known to degrade throughout life independent
of use. The degradation rate depends on temperature and increase expo-
nentially to increased temperature.
Danish Technological Institute
Page 28 of 41
b. Cycle aging -
Degradation resulting from the charge cycled through the battery.
i. Cycle degradation can increase with high C-rates, but the actual
electric bus has a large battery resulting in relatively low C-rates
both driving and charging. So adverse effects of high C-rate is
marginal.
ii. The cycle degradation is also influenced by the Depth of Discharge
(DoD) – the actual used range of the available range. It is nor-
mally recommended to keep DoD under 80% for long life applica-
tion and under 70% DoD should ensure a high number of available
cycles.
iii. There are no indication of a “State of Charge-window”. EV- manu-
factures are known to mask the real remaining battery capacity by
defining the battery empty when the nominal charge has been de-
livered rather than using minimum voltage as empty criteria. This
seems not to be the case in the bus.
iv. In the first test operation of the buses little more than half the
battery capacity have been used. As the battery capacity fade a
larger part of the available capacity will be used and this tend to
increase the degradation rate.
c. After an expected initial capacity fade of approximately 10% - 12% over
the first couple of years, the rate of the capacity degradation is expected
stabilize at a lower level around or even under 2% per year throughout the
remaining useful battery life, under stable load conditions and no exposure
to high temperatures for extended periods.
2. Increased DC impedance resulting in a slightly lower voltage during discharge.
a. The effect is negligible and only measurable consequence may be on effi-
ciency until end of useful battery life.
b. The rate of this degradation is expected to decrease to a stable level after
two to three years.

Danish Technological Institute
Page 29 of 41
5. Basis for lifetime assessment
Rather than making a full degradation test in the laboratory, a more simple approach was
agreed between Danish Traffic Agency and Danish Technological Institute (DTI). Since BYD
kindly made some of their confidential test data available for DTI (only), these data was
applied as the basis data in the DTI lifetime model.
To validate consistence between DTI results and BYD data, four cells were setup in the
laboratory for a reduced lifetime test using same test method as BYD (DTI normal test
practice is similar to BYD). Battery cells of same type as used in the bus was requested for
the test, but actual cell capacity in the laboratory were measured to 230 Ah cells still
claimed to be of the same chemistry and packaging as the cells applied in the bus. The
results measured by DTI matched the BYD data quite well as they yielded a very similar
capacity loss (close to 1% larger than the BYD data).
Based on a visit to BYD factory and BYD test facilities, meetings with BYD research people
and consistent test results DTI has no qualified reason to question BYD test data provided
under a strict NDA. The dataset from BYD is made at room temperature and temperatures
above. BYD had no relevant cold degradation data available for the specific chemistry at
that time but planned to start tests. No data from cold tests has been received at the
conclusion of this task.
Hence, the lifetime calculations are made on the basis of extrapolated data at temperatures
below room temperature.
In addition, the production, test and lifetime test facilitates at the BYD battery factory in
Shenzhen, China was assessed by DTI. The facilities appeared professional with a high
degree of automatic processing and quality assurance. The lifetime test facilities were well
equipped and capable of performing the lifetime tests – most equipment from well reputed
international high class equipment manufactories.
In the bus the total current drawn from the battery is not necessarily equally drawn from
each package (Top, front and rear) – it depends on the individual battery packs SoC (State
of Charge) and SoH (State of Health) and any possible bypass operation. Under one test
one of three packages was switched off by the bus battery management system for some
time while operating only on two packages. The load current is still relative low even with
a battery package switched off.
The total current drawn from the battery was measured during a real drive cycle and max-
imum was less than 300 A which implies a current draw less than 0.5C (1C = 600 A drawn
in one hour = total battery capacity). At a relatively low peak load like this, the C-rate has
only a negligible impact on the battery degradation, which is also confirmed by the BYD
lifetime data. Current draw example see Figure 23.

Danish Technological Institute
Page 30 of 41
Figure 23. Current draw during driving.
Public temperature data for Denmark provided by DMI (Danish Metrological Institute) for
the period 2001 to 2010 (http://www.dmi.dk/vejr/arkiver/normaler-og-ekstremer/klima-
normaler-dk/vejrnormal/) has been used as climate reference.

Danish Technological Institute
Page 31 of 41
6. Lifetime assessment
For a very rough lifetime assessment, some assumptions about the use pattern were made
initially.
The bus is used for 15 hours every day driving 200 km. Afterwards the batteries are
charged for 4.5 hours, and then resting for 5.5 hours. Charging take place when the bus
return to the depot and the batteries still have residual heat from driving. The resting is
done at evening and night times when the temperature is low.
Feeding the BYD data, the temperature data and the conditions above into the DTI lifetime
model yields a lifetime prediction as shown in Table 10.
Front package Top package Rear package Battery package
7 years 6 Years 7 years 6½ years Table 10. Estimated lifetime to 80% retained capacity – the uncertainty is substantial
due to limited data.
The number of years express the time when the total battery capacity is reduced to 80%
of the initial capacity if put into use from day one. The bus will still be able to drive on after
this point, but the range will decrease as the capacity decays further. The estimated ca-
pacity loss for the whole battery package is plotted in Figure 24, where it can be seen that
the degradation rate is larger in the first year compared to the following years.
Figure 24. Estimated battery package capacity loss versus lifetime – the uncertainty is
substantial due to limited data.

Danish Technological Institute
Page 32 of 41
Four uncertainty factors should be mentioned here:
The empirical data input to the lifetime model is extrapolated from the accessible
dataset and supported by other DTI experiences.
The temperature profile applied in the lifetime model is an average profile. If the
battery packs are exposed to a more moderate temperature profile, the lifetime will
be longer than estimated and if the battery packs are exposed to a more extreme
temperature profile, the lifetime will be shorter.
The temperature distribution inside each package was not measured by DTI and
some battery cells may be significantly warmer than the average temperature
measured. If so, the lifetime would be shorter than estimated.
The BYD dataset is based on full charge & discharge lifetime tests. Normally a dy-
namic load pattern, as the one the battery packages in the bus is exposed to, will
degrade the battery less severe than the full charge & discharge test. Therefore,
the actual lifetime is expected longer than the lifetime estimated.
Charging under cold conditions has not been considered but there might be a risk of in-
creased degradation or significant longer charging time. E.g. if Smart Grid control is con-
sidered for postponed charging of the bus it might be wise to assess risk of cold degradation
or need for preheating of batteries before charge.

Danish Technological Institute
Page 33 of 41
7. Conclusion
By request of Trafik- og Byggestyrelsen (The Danish Traffic Agency), the expected battery
lifetime of two BYD K9 electric buses has been assessed by DTI. The two buses is leased
from BYD by MOVIA and operated by Keolis Danmark A/S (former: Citytrafik) and Arriva
Danmark A/S respectively. The buses have been tested to assess whether the expected
battery lifetime stated by BYD seems realistic.
BYD statement on lifetime to MOVIA:
Warranty 8 years or 500.000 km
Degradation is expected to be higher the first year but decreasing to a stable low
level after a couple of more years
Two different approaches have been used to estimate expected lifetime of the batteries:
1. Measurement at vehicle level by DTI - Battery capacity, early (first) and late (sec-
ond) measurements.
2. Verification of battery technology and BYD data including stressed cycle tests at
cell level by DTI.
Battery capacity were measured on the buses shortly after the vehicles were put into op-
eration. Comparison tests were planned at the end project period for both buses. One bus
received a new battery pack halfway into the test period due to a failure of the housing.
Only the Arriva Danmark A/S bus was tested second time at the very end of the test period,
just before handing it back to BYD. First tests were performed during Maj and June 2014.
The second test was performed 18 months later in December 2015. In that period the bus
has driven a little more than 44,500 km. DTI focus has been on battery condition only and
no other criteria like e.g. range, efficiency etc. has been addressed.
BYD has provided limited test data to DTI under a strict NDA. DTI has found no qualified
reason to question the BYD data provided after the following activities:
a visit to BYD battery factory with extensive automated production and high level
of integrated quality assurance
a visit to BYD test facilities were extensive testing takes place to all major global
norms and standards using high quality test equipment.
meetings with BYD research people presenting their data and taking questions.
a few selected accelerated cell tests at DTI showing results consistent with BYD’s
data.
Lifetime assessment from analysis of BYD data and cell testing suggest an expected lifetime
of nearly 7 years to 80% remaining capacity in Danish temperature conditions.
The critical degradation is the capacity fade that will continue until end of life. The capacity
fade is expected to continue at a slightly lower rate after the first years.

Danish Technological Institute
Page 34 of 41
The battery degradation is clearly measurable but not excessive compared to the expected
levels suggested from battery data. The measured degradation consists of different mech-
anisms:
1. Capacity degradation – less available energy from the battery – will result in shorter
range. Capacity degradation is primarily the combined effects of
a. Calendar aging -
Lithium Ion batteries are known to degrade throughout life independent
of use. The degradation rate depends on temperature and increase expo-
nentially to increased temperature.
b. Cycle aging -
Degradation resulting from the charge cycled through the battery.
i. Cycle degradation can increase with high C-rates, but the actual
electric bus has a large battery resulting in relatively low C-rates
both driving and charging. Adverse effects of high C-rates is mar-
ginal.
ii. The cycle degradation is also influenced by the Depth of Discharge
(DoD) – the actual used range of the available range. It is nor-
mally recommended to keep DoD under 80% for long life applica-
tion and under 70% DoD should ensure a high number of available
cycles.
iii. Discharge seems to be stopped on a minimum voltage criteria
meaning that the full capacity seems to available for driving – ex-
cept for a marginal emergency charge. There are no indication of
a “State of Charge-window”.
iv. In the first test operation of the buses little more than half the
battery capacity have been used. As the battery capacity fade a
larger part of the available capacity will be used and this tend to
increase the degradation rate as the DoD increase.
a. After an expected initial capacity fade of approximately 10% - 12% over the
first couple of years, the rate of the capacity degradation is expected stabi-
lize at a lower level around or even under 2% per year throughout the re-
maining useful battery life, under stable load conditions and no exposure to
high temperatures for extended periods.
2. Increased DC impedance resulting in a slightly lower voltage during discharge.
c. The effect is negligible and only measurable consequence may be on effi-
ciency until end of useful battery life.
d. The rate of this degradation is expected to decrease to a stable level after
two to three years.
The resulting total degradation is expected to continue at a slightly lower but stable level
until end of useful life. The degradation after three years is expected to be on available
capacity only.
Even though predictions on such a limited information carries a substantial uncertainty,
operation of the buses in a similar load pattern down to e.g. 65% remaining capacity (with
a slight degradation of available range) seems realistic, since the degradation rate seems
fairly stable with no rapid trend towards end of life. The degradation rate must be expected
to increase if a larger share of the available remaining capacity is used.

Danish Technological Institute
Page 35 of 41
Essential factors increasing uncertainty of life assessment:
The empirical data input to the lifetime model is extrapolated from a very limited accessible
dataset but supported by other DTI experience.
Actual temperature for each of the three battery packs in each bus affects life and perfor-
mance significantly. The temperature profile applied in the lifetime model is only a Danish
average profile. Battery packs exposed to more extreme temperatures may experience
shorter lifetime. Different locations of the three battery packs on the bus makes it very
complex to assess temperature dependence – one pack on the roof are cooled well by wind
speed but heated by sun; one pack under floor are exposed to low temperatures but heated
by driveline and heat from road with poor cooling conditions. Third pack is inside the bus
will see a stable room temperature but has poor cooling conditions.
The temperature distribution inside each battery package could not be measured by DTI
and some battery cells may be significantly warmer than the average temperature meas-
ured. If so, the lifetime would be shorter than estimated.
The BYD dataset is based on full charge & discharge lifetime tests. Normally a dynamic
load pattern, as the one the battery packages in the bus is exposed to, will degrade the
battery less severe than the full charge & discharge test. Therefore, the actual lifetime is
expected longer than the lifetime estimated.
Data logging in the buses has not been as useful as expected due to lack of relevant battery
related data, and driveline data like e.g. power, speed and distance. Even attempts on
analysing available sample data has been overly labour intensive. Still detailed data logging
will be needed to compute better lifetime estimation on specific driving patterns.
Charging under cold conditions has not been considered but there might be a risk of in-
creased degradation or significant longer charging time. E.g. if Smart Grid control is con-
sidered for postponed charging of the bus it might be wise to assess risk of cold degradation
or need for preheating of batteries before charge.
The charge efficiency is generally good. During the second vehicle test, only one of two
charge plugs was active. The round trip efficiency of charging may be slightly affected by
doubling the charge power. Further measurements will be needed to decide statistical var-
iation and assess potential energy saving by lower charge power.

Danish Technological Institute
Page 36 of 41
Appendix 1. Additional bus data from Bus #1
Power curve
Dynamo data
Figure 2 Measurement of drive train loss. Power vs. speed.
Figure 1 Propulsion power (upper part) and regenerative power (lower part).

Danish Technological Institute
Page 37 of 41
Appendix 2. Additional bus data from Bus #2
Power curve
Dynamo data
Figure 4 Measurement of drive train loss. Power vs. velocity.
Figure 3 Propulsion power (upper part) and regenerative power (lower part).

Danish Technological Institute
Page 38 of 41
Appendix 3. Data from road test in Aarhus
Figure 25. Road test in Aarhus, part 1 of 4.

Danish Technological Institute
Page 39 of 41
Figure 26. Road test in Aarhus, part 2 of 4.

Danish Technological Institute
Page 40 of 41
Figure 27. Road test in Aarhus, part 3 of 4.

Danish Technological Institute
Page 41 of 41
Figure 28. Road test in Aarhus, part 4 of 4.