baton rouge real estate home sales existing and new april 2013 vs april 2014
TRANSCRIPT

Apr-2014171,000
Apr-2013173,900
%-2
Change-2,900
Apr-2013 vs Apr-2014: The median sold price is down -2%Median Sold Price by Month
Accurate Valuations Group
Apr-2013 vs. Apr-2014
William Cobb
Clarus MarketMetrics® 05/18/2014Information not guaranteed. © 2014 - 2015 Terradatum and its suppliers and licensors (www.terradatum.com/about/licensors.td).
1/2
MLS: GBRAR Bedrooms:AllAll
Construction Type:All1 Year Monthly SqFt:
Bathrooms: Lot Size:All All Square FootagePeriod:All
MLS Area:Property Types: : Residential
EBR MLS AREA 62, EBR MLS AREA 61, EBR MLS AREA 60, EBR MLS AREA 53, EBR MLS AREA 52, EBR MLS AREA 51, EBR MLS AREA 50, EBR MLS AREA 43, EBR MLS AREA 42, EBRPrice:

Median Sold Price by MonthApr-2013 vs Apr-2014: The median sold price is down -2%
Accurate Valuations GroupWilliam Cobb
Sold Median Price Units Avg DOMTime Period
Apr-14 171,000 425 93
Mar-14 188,000 342 89
Feb-14 159,000 311 100
Jan-14 159,500 268 93
Dec-13 182,500 349 85
Nov-13 183,125 296 86
Oct-13 174,727 372 89
Sep-13 170,000 366 83
Aug-13 177,217 466 82
Jul-13 182,000 465 79
Jun-13 178,000 503 82
May-13 178,950 492 94
Apr-13 173,900 428 99
Clarus MarketMetrics® 05/18/2014Information not guaranteed. © 2014 - 2015 Terradatum and its suppliers and licensors (www.terradatum.com/about/licensors.td).
22/
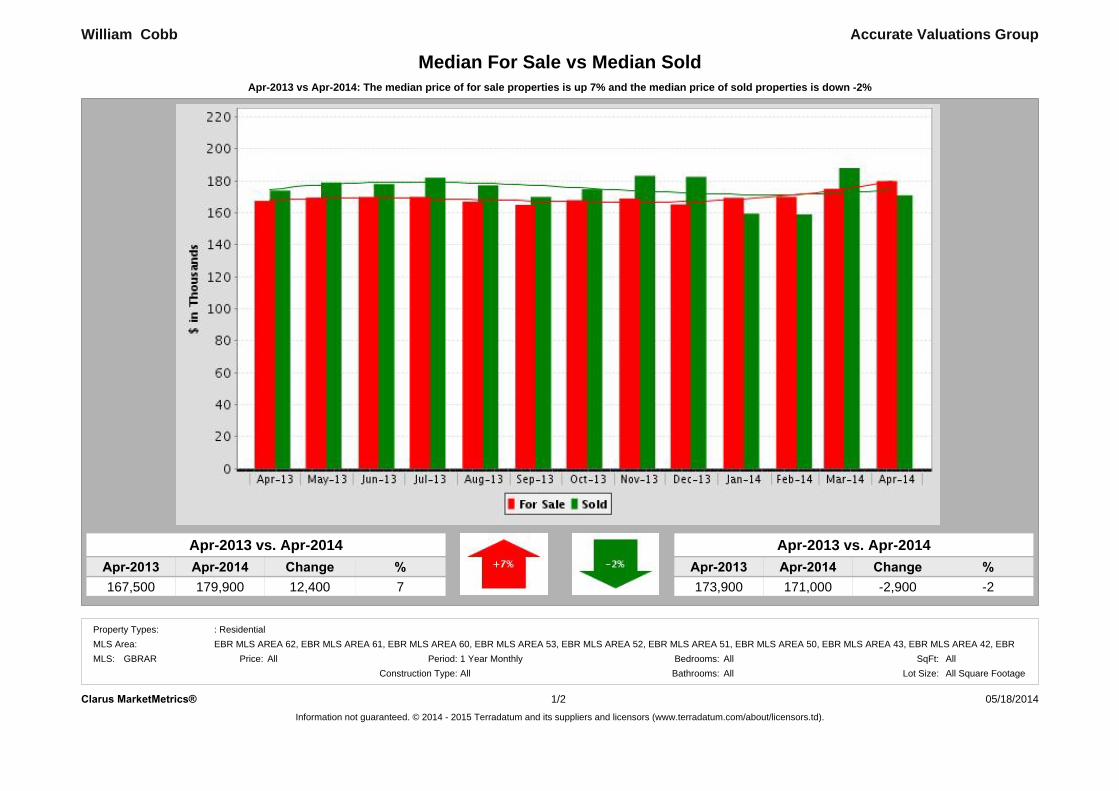
Apr-2013 vs Apr-2014: The median price of for sale properties is up 7% and the median price of sold properties is down -2%
Accurate Valuations Group
Apr-2013 vs. Apr-2014
167,500 7
William Cobb
179,900Apr-2014
Median For Sale vs Median Sold
ChangeApr-2013 %12,400
Apr-2013 Apr-2014 %173,900 -2
Apr-2013 vs. Apr-2014
171,000Change-2,900
Clarus MarketMetrics® 05/18/2014Information not guaranteed. © 2014 - 2015 Terradatum and its suppliers and licensors (www.terradatum.com/about/licensors.td).
1/2
MLS: GBRAR Bedrooms:AllAll
Construction Type:All1 Year Monthly SqFt:
Bathrooms: Lot Size:All All Square FootagePeriod:All
MLS Area:Property Types: : Residential
EBR MLS AREA 62, EBR MLS AREA 61, EBR MLS AREA 60, EBR MLS AREA 53, EBR MLS AREA 52, EBR MLS AREA 51, EBR MLS AREA 50, EBR MLS AREA 43, EBR MLS AREA 42, EBRPrice:

Median For Sale vs Median SoldApr-2013 vs Apr-2014: The median price of for sale properties is up 7% and the median price of sold properties is down -2%
Accurate Valuations GroupWilliam Cobb
For SaleMedian SoldMedianFor Sale # Properties # PropertiesSold Price Difference
Time Period
Apr-14 2,977 425179,900 171,000 -8,900Mar-14 2,879 342175,000 188,000 13,000Feb-14 2,853 311170,000 159,000 -11,000Jan-14 2,889 268169,400 159,500 -9,900Dec-13 2,828 349165,250 182,500 17,250Nov-13 2,941 296169,000 183,125 14,125Oct-13 3,058 372167,950 174,727 6,777Sep-13 3,034 366165,000 170,000 5,000Aug-13 3,073 466167,000 177,217 10,217Jul-13 3,084 465170,000 182,000 12,000Jun-13 3,064 503169,900 178,000 8,100May-13 3,102 492169,500 178,950 9,450Apr-13 3,137 428167,500 173,900 6,400
Clarus MarketMetrics®Information not guaranteed. © 2014 - 2015 Terradatum and its suppliers and licensors (www.terradatum.com/about/licensors.td).
05/18/201422/

Apr-2014425
Apr-2013428
%-1
Change-3
Apr-2013 vs Apr-2014: The number of Sold properties is down -1%Sold Properties by Month
Accurate Valuations Group
Apr-2013 vs. Apr-2014
William Cobb
Clarus MarketMetrics® 05/18/2014Information not guaranteed. © 2014 - 2015 Terradatum and its suppliers and licensors (www.terradatum.com/about/licensors.td).
1/2
MLS: GBRAR Bedrooms:AllAll
Construction Type:All1 Year Monthly SqFt:
Bathrooms: Lot Size:All All Square FootagePeriod:All
MLS Area:Property Types: : Residential
EBR MLS AREA 62, EBR MLS AREA 61, EBR MLS AREA 60, EBR MLS AREA 53, EBR MLS AREA 52, EBR MLS AREA 51, EBR MLS AREA 50, EBR MLS AREA 43, EBR MLS AREA 42, EBRPrice:

Sold Properties by MonthApr-2013 vs Apr-2014: The number of Sold properties is down -1%
Accurate Valuations GroupWilliam Cobb
Time Period Units Median Price Avg DOM
Apr-14 171,000425 93Mar-14 188,000342 89Feb-14 159,000311 100Jan-14 159,500268 93Dec-13 182,500349 85Nov-13 183,125296 86Oct-13 174,727372 89Sep-13 170,000366 83Aug-13 177,217466 82Jul-13 182,000465 79Jun-13 178,000503 82May-13 178,950492 94Apr-13 173,900428 99
Clarus MarketMetrics® 05/18/2014Information not guaranteed. © 2014 - 2015 Terradatum and its suppliers and licensors (www.terradatum.com/about/licensors.td).
22/

Apr-2014539
Apr-2013501
%8
Change38
Apr-2013 vs Apr-2014: The number of Under Contract properties is up 8%Under Contract Properties by Month
Accurate Valuations Group
Apr-2013 vs. Apr-2014
William Cobb
Clarus MarketMetrics® 05/18/2014Information not guaranteed. © 2014 - 2015 Terradatum and its suppliers and licensors (www.terradatum.com/about/licensors.td).
1/2
AllBathrooms: SqFt:All
: Residential
All Square FootageConstruction Type: Lot Size:GBRAR
EBR MLS AREA 62, EBR MLS AREA 61, EBR MLS AREA 60, EBR MLS AREA 53, EBR MLS AREA 52, EBR MLS AREA 51, EBR MLS AREA 50, EBR MLS AREA 43, EBR MLS AREA 42, EBR MLS
Period: 1 Year MonthlyPrice:MLS:
All AllAll
Property Types:
Bedrooms:
MLS Area:

Under Contract Properties by MonthApr-2013 vs Apr-2014: The number of Under Contract properties is up 8%
Accurate Valuations GroupWilliam Cobb
Units Avg DOMMedian PriceTime PeriodApr-14 175,000539 87Mar-14 180,000461 91Feb-14 190,950372 90Jan-14 172,900361 103Dec-13 167,000245 90Nov-13 185,000303 90Oct-13 176,700358 82Sep-13 189,900341 93Aug-13 179,900383 87Jul-13 189,900430 88Jun-13 175,000429 76May-13 179,900481 82Apr-13 184,000501 88
Clarus MarketMetrics® 05/18/2014Information not guaranteed. © 2014 - 2015 Terradatum and its suppliers and licensors (www.terradatum.com/about/licensors.td).
22/

Apr-2014733
Apr-2013675
%9
Change58
Apr-2013 vs Apr-2014: The number of New properties is up 9%New Properties by Month
Accurate Valuations Group
Apr-2013 vs. Apr-2014
William Cobb
Clarus MarketMetrics® 05/18/2014Information not guaranteed. © 2014 - 2015 Terradatum and its suppliers and licensors (www.terradatum.com/about/licensors.td).
1/2
MLS: GBRAR Bedrooms:AllAll
Construction Type:All1 Year Monthly SqFt:
Bathrooms: Lot Size:All All Square FootagePeriod:All
MLS Area:Property Types: : Residential
EBR MLS AREA 62, EBR MLS AREA 61, EBR MLS AREA 60, EBR MLS AREA 53, EBR MLS AREA 52, EBR MLS AREA 51, EBR MLS AREA 50, EBR MLS AREA 43, EBR MLS AREA 42, EBRPrice:

New Properties by MonthApr-2013 vs Apr-2014: The number of New properties is up 9%
Accurate Valuations GroupWilliam Cobb
Units Median PriceTime PeriodApr-14 186,900733Mar-14 193,900581Feb-14 179,900544Jan-14 179,950558Dec-13 171,900371Nov-13 169,950458Oct-13 186,000579Sep-13 159,900611Aug-13 173,000647Jul-13 175,000677Jun-13 179,900627May-13 180,000670Apr-13 185,900675
Clarus MarketMetrics® 05/18/2014Information not guaranteed. © 2014 - 2015 Terradatum and its suppliers and licensors (www.terradatum.com/about/licensors.td).
22/
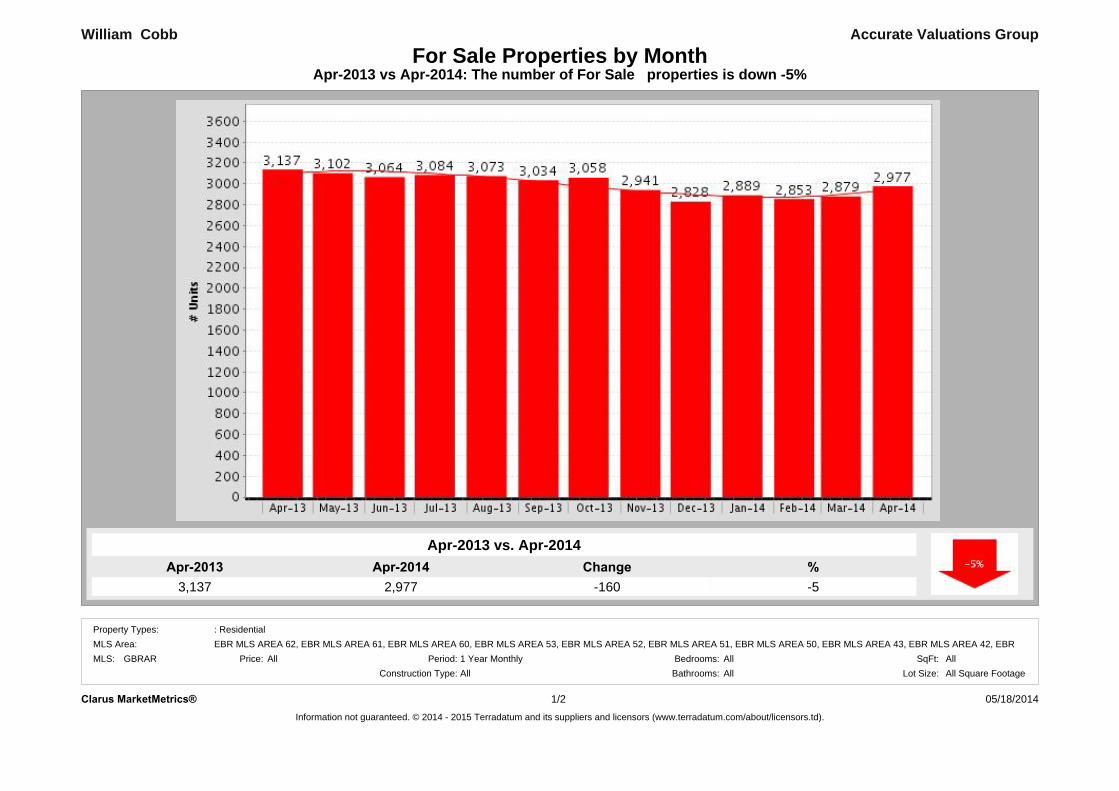
Apr-20142,977
Apr-20133,137
%-5
Change-160
Apr-2013 vs Apr-2014: The number of For Sale properties is down -5%For Sale Properties by Month
Accurate Valuations Group
Apr-2013 vs. Apr-2014
William Cobb
Clarus MarketMetrics® 05/18/2014Information not guaranteed. © 2014 - 2015 Terradatum and its suppliers and licensors (www.terradatum.com/about/licensors.td).
1/2
MLS: GBRAR Bedrooms:AllAll
Construction Type:All1 Year Monthly SqFt:
Bathrooms: Lot Size:All All Square FootagePeriod:All
MLS Area:Property Types: : Residential
EBR MLS AREA 62, EBR MLS AREA 61, EBR MLS AREA 60, EBR MLS AREA 53, EBR MLS AREA 52, EBR MLS AREA 51, EBR MLS AREA 50, EBR MLS AREA 43, EBR MLS AREA 42, EBRPrice:
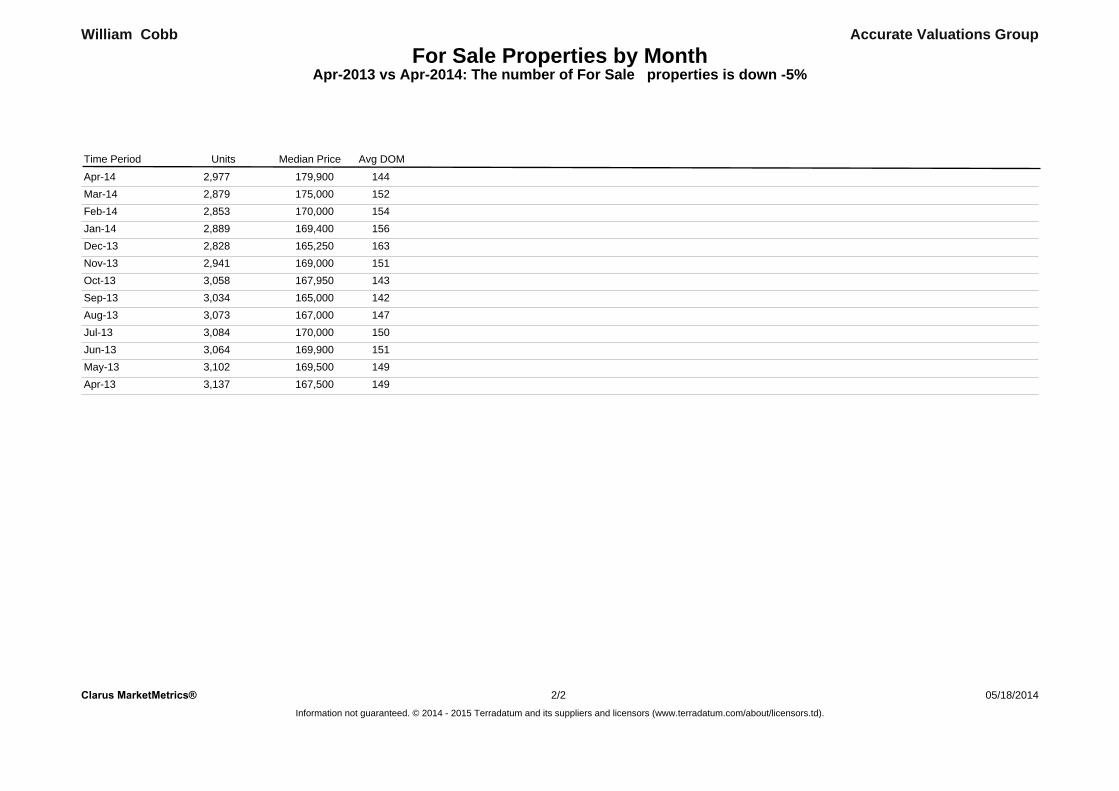
For Sale Properties by MonthApr-2013 vs Apr-2014: The number of For Sale properties is down -5%
Accurate Valuations GroupWilliam Cobb
Units Avg DOMMedian PriceTime Period
Apr-14 179,9002,977 144Mar-14 175,0002,879 152Feb-14 170,0002,853 154Jan-14 169,4002,889 156Dec-13 165,2502,828 163Nov-13 169,0002,941 151Oct-13 167,9503,058 143Sep-13 165,0003,034 142Aug-13 167,0003,073 147Jul-13 170,0003,084 150Jun-13 169,9003,064 151May-13 169,5003,102 149Apr-13 167,5003,137 149
Clarus MarketMetrics® 05/18/2014Information not guaranteed. © 2014 - 2015 Terradatum and its suppliers and licensors (www.terradatum.com/about/licensors.td).
22/

Apr-2014180
Apr-2013204
%-12
Change-24
Apr-2013 vs Apr-2014: The number of Expired properties is down -12%Expired Properties by Month
Accurate Valuations Group
Apr-2013 vs. Apr-2014
William Cobb
05/18/2014Clarus MarketMetrics® 1/2
MLS: GBRAR Bedrooms:AllAll
Construction Type:All1 Year Monthly SqFt:
Bathrooms: Lot Size:All All Square FootagePeriod:All
MLS Area:Property Types: : Residential
EBR MLS AREA 62, EBR MLS AREA 61, EBR MLS AREA 60, EBR MLS AREA 53, EBR MLS AREA 52, EBR MLS AREA 51, EBR MLS AREA 50, EBR MLS AREA 43, EBR MLS AREA 42, EBRPrice:
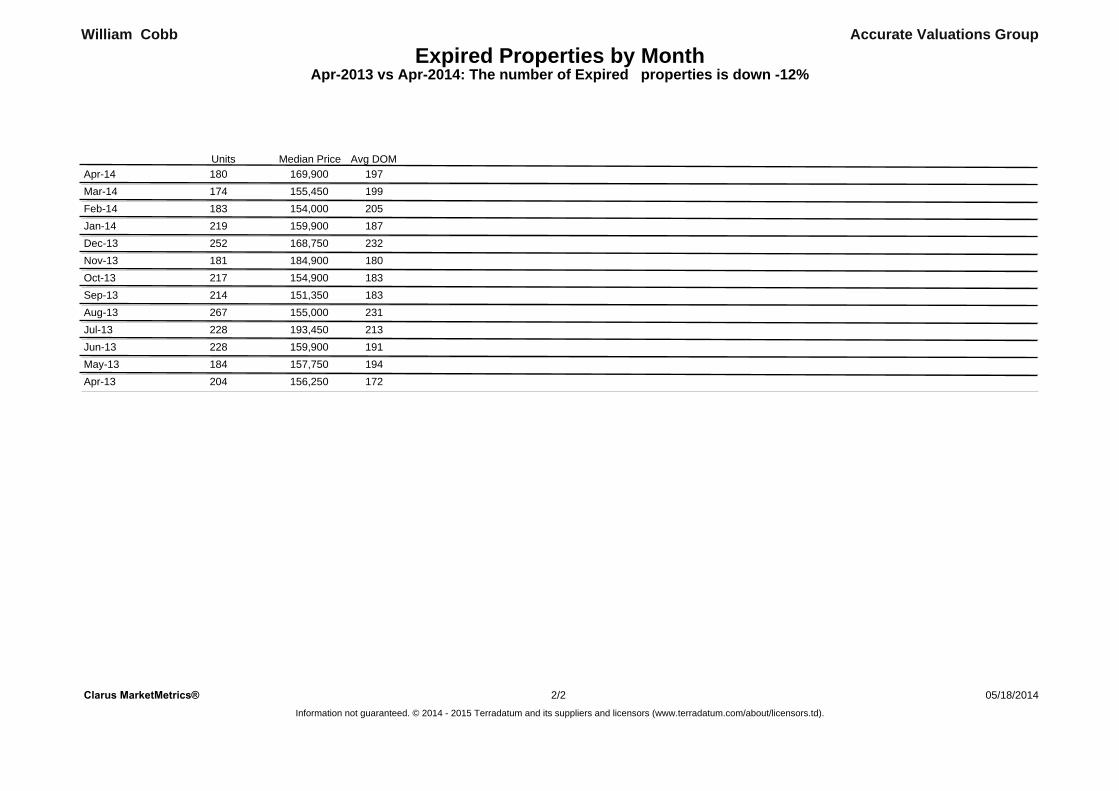
Expired Properties by MonthApr-2013 vs Apr-2014: The number of Expired properties is down -12%
Accurate Valuations GroupWilliam Cobb
Avg DOMUnits Median PriceApr-14 169,900180 197Mar-14 155,450174 199Feb-14 154,000183 205Jan-14 159,900219 187Dec-13 168,750252 232Nov-13 184,900181 180Oct-13 154,900217 183Sep-13 151,350214 183Aug-13 155,000267 231Jul-13 193,450228 213Jun-13 159,900228 191May-13 157,750184 194Apr-13 156,250204 172
Clarus MarketMetrics® 05/18/2014Information not guaranteed. © 2014 - 2015 Terradatum and its suppliers and licensors (www.terradatum.com/about/licensors.td).
22/
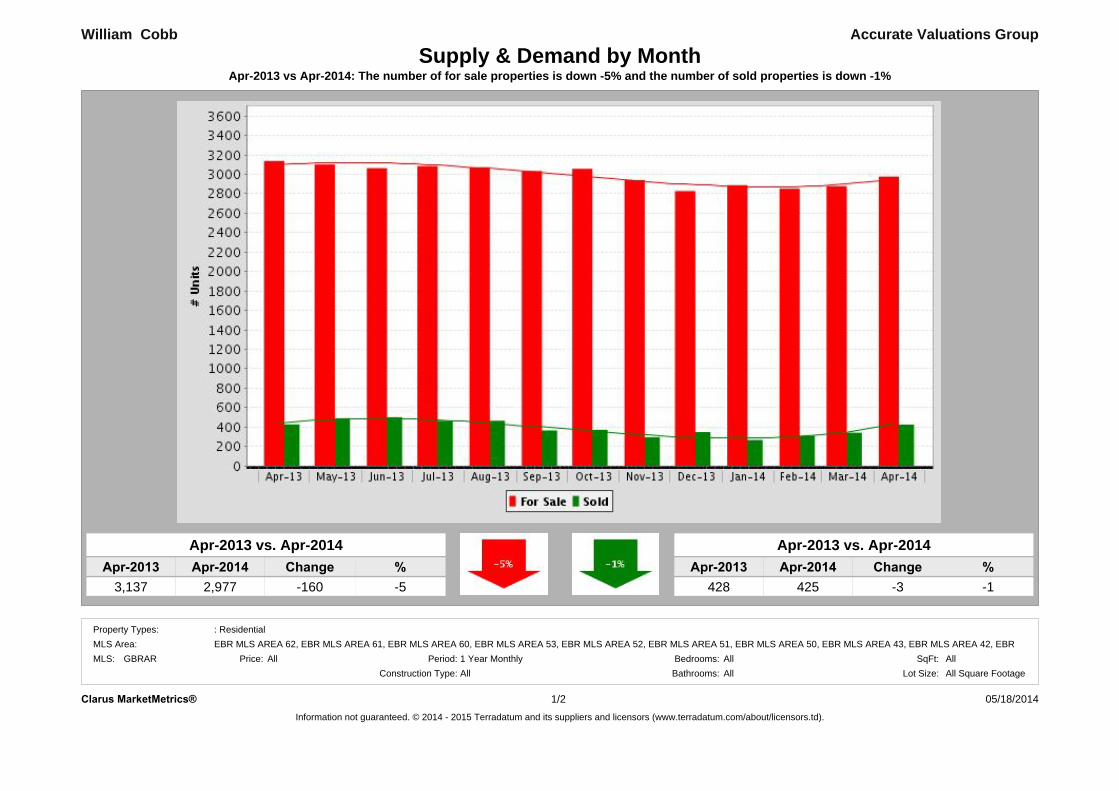
Apr-2013 vs Apr-2014: The number of for sale properties is down -5% and the number of sold properties is down -1%
Accurate Valuations Group
Apr-2013 vs. Apr-2014
3,137 -5
William Cobb
2,977Apr-2014
Supply & Demand by Month
ChangeApr-2013 %-160
Apr-2013 Apr-2014 %428 -1
Apr-2013 vs. Apr-2014
425Change
-3
Clarus MarketMetrics® 05/18/2014Information not guaranteed. © 2014 - 2015 Terradatum and its suppliers and licensors (www.terradatum.com/about/licensors.td).
1/2
MLS: GBRAR Bedrooms:AllAll
Construction Type:All1 Year Monthly SqFt:
Bathrooms: Lot Size:All All Square FootagePeriod:All
MLS Area:Property Types: : Residential
EBR MLS AREA 62, EBR MLS AREA 61, EBR MLS AREA 60, EBR MLS AREA 53, EBR MLS AREA 52, EBR MLS AREA 51, EBR MLS AREA 50, EBR MLS AREA 43, EBR MLS AREA 42, EBRPrice:

Supply & Demand by MonthApr-2013 vs Apr-2014: The number of for sale properties is down -5% and the number of sold properties is down -1%
William Cobb Accurate Valuations Group
For Sale Sold# Properties
Avg DOM Avg DOM# Properties
Time Period
Apr-14 144 932,977 425Mar-14 152 892,879 342Feb-14 154 1002,853 311Jan-14 156 932,889 268Dec-13 163 852,828 349Nov-13 151 862,941 296Oct-13 143 893,058 372Sep-13 142 833,034 366Aug-13 147 823,073 466Jul-13 150 793,084 465Jun-13 151 823,064 503May-13 149 943,102 492Apr-13 149 993,137 428
Clarus MarketMetrics® 05/18/2014Information not guaranteed. © 2014 - 2015 Terradatum and its suppliers and licensors (www.terradatum.com/about/licensors.td).
22/

Apr-201487
Apr-201388
%-1
Change-1
Apr-2013 vs Apr-2014: The average days on market is down -1%The Average Days on Market by Month
Accurate Valuations Group
Apr-2013 vs. Apr-2014
William Cobb
EBR MLS AREA 62, EBR MLS AREA 61, EBR MLS AREA 60, EBR MLS AREA 53, EBR MLS AREA 52, EBR MLS AREA 51, EBR MLS AREA 50, EBR MLS AREA 43, EBR MLS AREA 42, EBRAll 1 Year Monthly
MLS Area:Period:Price:
Property Types: : Residential
05/18/20141/2Clarus MarketMetrics®
All Square FootageBedrooms: All AllSqFt:
All Lot Size:Bathrooms:AllConstruction Type:MLS: GBRAR
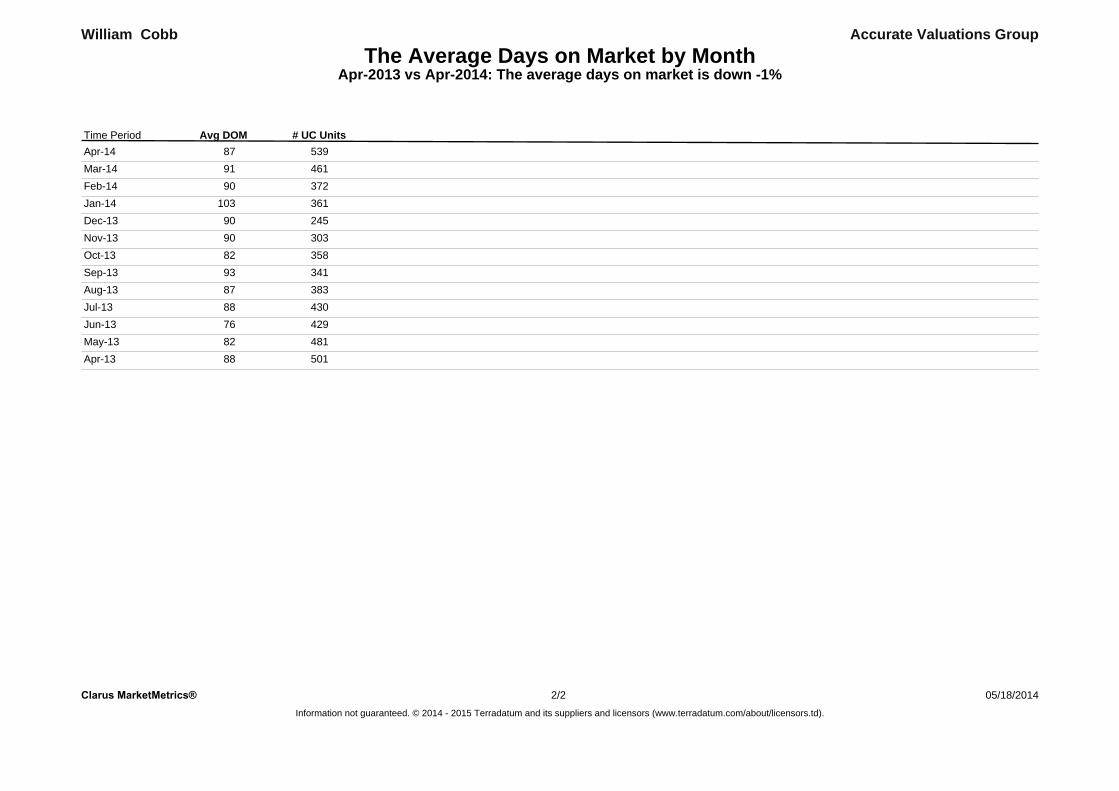
The Average Days on Market by MonthApr-2013 vs Apr-2014: The average days on market is down -1%
Accurate Valuations GroupWilliam Cobb
# UC UnitsAvg DOMTime PeriodApr-14 53987Mar-14 46191Feb-14 37290Jan-14 361103Dec-13 24590Nov-13 30390Oct-13 35882Sep-13 34193Aug-13 38387Jul-13 43088Jun-13 42976May-13 48182Apr-13 50188
Clarus MarketMetrics® 2/2 05/18/2014Information not guaranteed. © 2014 - 2015 Terradatum and its suppliers and licensors (www.terradatum.com/about/licensors.td).

Apr-2013 vs Apr-2014: The average months supply of inventory is down -14%
Accurate Valuations Group
Apr-2013 vs. Apr-2014
4.9 -14
William Cobb
4.2Apr-2014
Months Supply of Inventory
ChangeApr-2013 %-0.7
Clarus MarketMetrics® 05/18/2014Information not guaranteed. © 2014 - 2015 Terradatum and its suppliers and licensors (www.terradatum.com/about/licensors.td).
1/2
MLS: GBRAR Bedrooms:AllAll
Construction Type:All1 Year Monthly SqFt:
Bathrooms: Lot Size:All All Square FootagePeriod:All
MLS Area:Property Types: : Residential
EBR MLS AREA 62, EBR MLS AREA 61, EBR MLS AREA 60, EBR MLS AREA 53, EBR MLS AREA 52, EBR MLS AREA 51, EBR MLS AREA 50, EBR MLS AREA 43, EBR MLS AREA 42, EBRPrice:
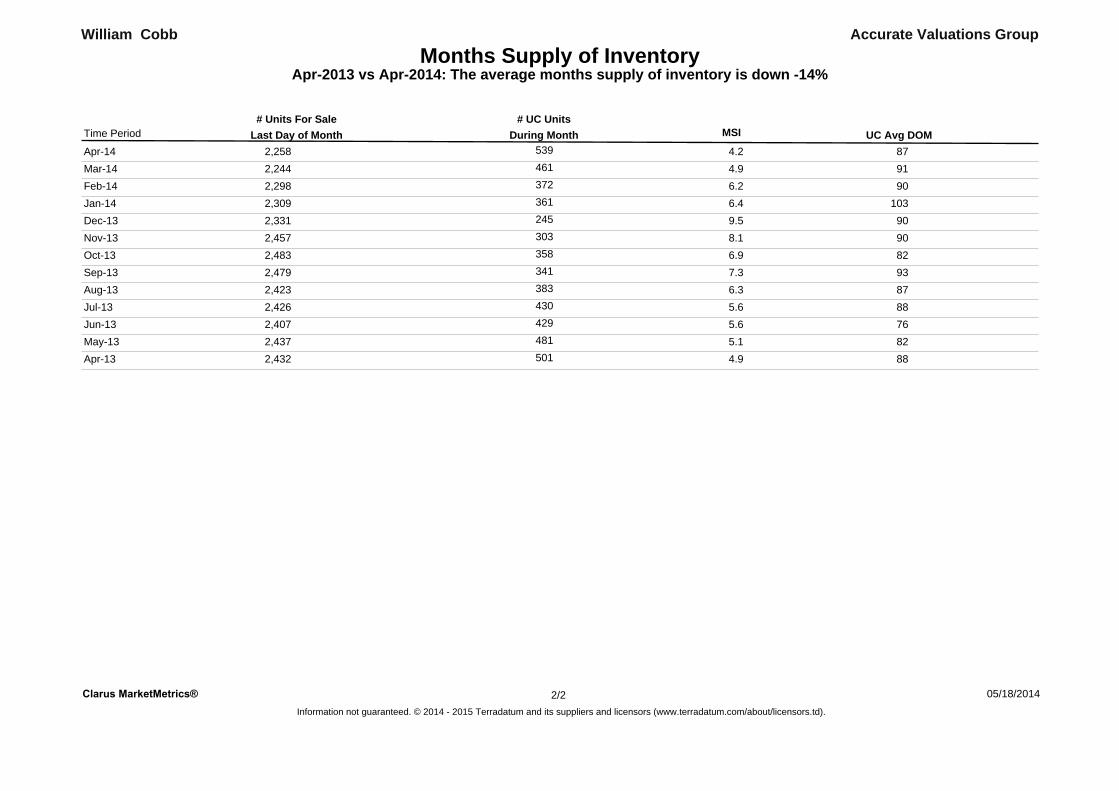
Months Supply of InventoryApr-2013 vs Apr-2014: The average months supply of inventory is down -14%
William Cobb Accurate Valuations Group
During MonthLast Day of Month MSI# Units For Sale # UC Units
UC Avg DOMTime Period
Apr-14 539 872,258 4.2Mar-14 461 912,244 4.9Feb-14 372 902,298 6.2Jan-14 361 1032,309 6.4Dec-13 245 902,331 9.5Nov-13 303 902,457 8.1Oct-13 358 822,483 6.9Sep-13 341 932,479 7.3Aug-13 383 872,423 6.3Jul-13 430 882,426 5.6Jun-13 429 762,407 5.6May-13 481 822,437 5.1Apr-13 501 882,432 4.9
Clarus MarketMetrics® 05/18/2014Information not guaranteed. © 2014 - 2015 Terradatum and its suppliers and licensors (www.terradatum.com/about/licensors.td).
22/