bathroom_scales
DESCRIPTION
ÂTRANSCRIPT

The Secret of
Weight Management
Or
Why you Weigh More
on Thick Carpet
Report by: Jon Pendergast ([email protected]) Supervisor: D. J. C. MacKay ([email protected]) Completed: May 2002

Abstract The effect of thick carpet on the accuracy of bathroom scales was investigated using two analogue scales and two digital strain gauge scales. A mass range of 0Kg – 104Kg was used. Loading history was found to have a significant effect on analogue scales, and the experiments were designed with this in mind. The mean spring constant of a Hanson analogue scale system was found to be 12.13±0.30KNm-1; this compares with a value of 36.52±1.34KNm-1 for a Hanson strain gauge system. Of the soft surfaces studied, only thick carpet (10-12%) and foam (8-10%) caused greater than 2% increase in analogue scale readings. These surfaces did not cause a substantial effect when placed only under the corners of the scale. Supporting the base of the scale on a hard surface caused a 13% increase in readings; by contrast, tilting the scale and moving the centre of mass on the scale had very little effect. Deflection of the base of the Hanson analogue scale was studied across the mass range using a DTI. The most deflection was found at the rear of the scale, for both analogue (−2.896±0.021mm) and digital (−0.752±0.012mm). Deflection of the scale base was found to be principally due to stress incurred from supporting the weight at the corners of the scale. Readings on a hard surface with the base supported showed no excess deflection of the test plate compared to hard surface readings. Since little movement of the test spring was found, it was concluded that there must be no substantial change in moment of the lever system when the base is supported. An excess downwards motion of the top plate was discovered when the base of the scale was supported, which implied excess movement of the levers (and thus test plate). Sharpening the levers was found to reduce the increase in Hanson analogue readings on carpet to 2.60±0.29%; thus, lever movement was found to be a principle cause of the increase. Thick carpet was found to cause an excess of +0.87±0.03mm vertical movement in the mechanism converting test plate movement into dial rotation; it was concluded that this movement was the principle cause of the increase in readings still present with the sharpened levers. Thick carpet was found to have virtually no effect on the digital scales studied, causing an increase in readings of 0.295±0.008% (Hanson) and 0.133±0.008% (Salter); this meant the strain gauge system was by far the best practical solution to the problem.
1. Introduction Many dieters know that they should always weigh themselves on a hard surface. Those that know why seem particularly keen to find a solid floor for their bathroom scales, even if this means weighing themselves outside! They have discovered that they appear to weigh more on carpet than on a hard floor, which is bad news for any dieter. Even so, the effect must be quite severe to justify such dedication to finding a hard surface. However, a search of the New Scientist and American Scientist archives reveals no information about this effect. Similarly, it seems that no scientific papers or review articles have been written on the subject. One might assume that this is because the effect is too small to warrant much attention; however, a quick demonstration using a set of analogue scales reveals that a seventy kilogram man registers ~70Kg on a hard lab floor – but an amazing 77Kg on a sample of thick-pile carpet. It is easy to see why some dieters are prepared to venture outside their house to find a hard surface! Manufacturers now routinely ship analogue bathroom scales with a warning that they should not be used on carpet; intriguingly, however, instructions shipped with modern digital scales state that they can be used on any surface, including thick carpet. This report studies the increase in readout of bathroom scales on carpet. It sets out to document the effect scientifically, shedding some light on possible causes and solutions. It aims to:
Accurately quantify the effect. Analyse its dependence on mass. Analyse its dependence on mass distribution on the scale. Find the internal causes of the effect, and thus suggest possible solutions. Compare the magnitude of the carpet effect on analogue and digital scales, and comment
on the manufacturer’s claim that modern digital scales can be used on thick carpet.
Section 2 gives a vital introduction to the mechanics of weighing scales; in addition, four appendices are provided to complement the main report. Detailed experimental data is presented in Appendix A. Appendix B provides a more detailed study of digital bathroom scales. A detailed discussion of the data from section 4.3 is presented in Appendix C. Appendix D contains detailed measurements which show the internal asymmetry of bathroom scales and allow the moments of the lever systems to be calculated. Numbers in square brackets correspond to references listed at the end of the report. Quoted error refers to measurement error unless otherwise stated.

2. The Mechanics of Scales The earliest accurate weighing technique can be traced back as far as the Egyptians and Babylonians. The simple pan balance,shown opposite in figure 2.1, essentially uses a lever supportedin the centre by a fulcrum. The object to be weighed is placed atone end of the lever (a known distance from the fulcrum), and aplate is mounted at the other end of the lever (the same distance from the fulcrum) on which objects of known weightcan be placed. When neither end of the lever touches the base,the scale is balanced and the known weight on the plate isequal to that of the object; a mechanical trick is employed to make the balance independent of where on the plate the
Figure 2.1: Simple Pan Balance [3]
weights are placed. Only in the 20th Century, however, was significant progress made in the evolution of weighing. It was recognised that the force on the other end of the lever did not need to be provided by weight; the restoring force of a spring, for example, would be a perfectly suitable substitute. Thus, the concept of the analogue spring scale was born. The analogue spring scale has taken many forms, from heavyweight industrial scales to accurate kitchen scales. The mechanical principles involved are the same, whatever the sizeand shape of the scale; they are illustrated in figure 2.2 opposite.The ancient principle of using a lever to compare forces has been retained, with the fulcrum moved from the centre to theend of the lever. The weight of the object is applied to the leverclose to the fulcrum (A), and the balancing force is supplied byextension of a spring at the other end (C). This mechanical
Figure 2.2: Modern Spring Scale [1]
set-up means that the spring need only supply a fraction of the weight of the object to balance the lever (B). In figure 2.2, the ratio of 1:12 means that that the spring is extended until the restoring force reaches only 1/13 of the weight applied. Figure 2.3: Internal Mechanism of a Modern Analogue Scale
This is extremely useful if scales are to be made compact; analogue bathroom scales are typically only 1cm thick, and so the spring will onlybe able to extend by a maximum of1cm. However, the range of a bathroom scale must be as high as120Kg to ensure that even the heaviest humans can be weighed. Amass of 120Kg corresponds to a weight of 1177N1; a coil spring thatcould provide such a restoring forcewith an extension of only 1cm would
Figure 2.4: Test Plate and Spring [1].
X
Point X is discussed in the text.
require a spring constant2 of 117.7KNm-1. Such a spring is unfeasible, and certainly would not allow the ±0.2Kg accuracy that dieters require; however, a restoring force of only (1177/13)N would require a more reasonable value of 9.05KNm-1. In a real analogue spring scale, four levers (with fulcrums at the corners) are used to spread the load on the base of the scale and minimise the effect of weight distribution. This is shown in figure 2.3. The rear3 levers couple to the front levers about half way along their length; the front levers then couple to a steel plate (referred to as the test plate in this report), which is connected to the bottom of a spring (referred to as the test spring). A close-up of this coupling is shown in figure 2.4.
1 W = mg - where W is the weight, m is the mass and the Earth’s gravitational constant g = 9.81NKg-1. 2 F = kx - where F is the restoring force, x is the extension of the spring and k is the spring constant. This is Hooke’s Law. The spring must be operating in this linear regime for the scales to be accurate, so large extensions must be avoided. 3 The rear levers are the two with fulcrums at the rear corners of the base. Throughout this report, the front of the scales is taken as the side where the reading is displayed, and the rear is taken as the side containing the spring.

The lid of the scales (referred to in the report as the top plate) connects to the four levers using four special mounting points, which are shown in figure 2.5. These metal mounting points are designed to fit snugly into depressions in the levers, and are fixed to the flat underside of the top plate. The top plate is attached to the base using stiff springs. Since the clamping force provided by these springs will change as the top plate moves vertically, all experiments were performed with the correct springs attaching the top plate to the base. It is worth noting that, due to the lever system, the top plate will only depress a few millimetres at maximum weight, since the test spring will only move about a centimetre. Vertical extension of the spring is converted to horizontal motion of a metal bar using a further lever mechanism (Point X in figure 2.4). The metal bar has a saw tooth cut in one side, and is connected to an extended spring (figure 2.6); it moves along a channel running front-back along the centre of the scale (figure 2.7). It is important to understand that downwards movement of the test plate does not directly drive the horizontal movement of the metal bar; rather, it is the job of the extended spring to pull point X downwards as the test plate moves downwards, keeping the two in contact as weight is applied. The upwards motion of the test plate then pushes point X back to its starting position when the weight is removed and the test spring contracts. This mechanism is discussed in more detail in section 5.2. Figure 2.6 also shows how horizontal motion of the saw tooth grooves drives the rotational motion of the dial. It is this rotational motion of the dial which indicates the weight applied. Since the test spring is operating in the Hooke’s Law regime, the extension of the test spring is linearly proportional to the weight applied. Assuming linear conversion from vertical to horizontal to rotational motion, the rotation of the dial should be linearly proportional to the weight applied, leading to the familiar regular spacing between marks on the dial.
Figure 2.5: Top Plate Mounting Figure 2.6: Close Up of Central
Mechanism [1] Figure 2.7: Analogue Scale with
the dial removed
A labelled photograph of the components of the lever and spring system is shown in figure 2.8. The rear levers are the outermost pair; the front levers are both welded to the steel plate, which is in turn welded to the bottom of the test spring (C). The top of the test spring rests on a groove in the top of the white peg (E); the bottom of the peg has screws into the black dial (D), which rests on the base of the scale. Rotation of the dial then moves the top of the test spring (and thus the test plate) vertically, allowing the scale to be zeroed. A A B B A A C D E Figure 2.8: Components of the Spring Scale Lever System
A: The top plate mounting points nestle in these grooves. B: The rear levers couple to the front levers at these points. C: Test spring and test plate. D: Zeroing dial. E: Plastic peg.

Calibration of analogue spring scales on a hard surface produces surprisingly accurate and repeatable results. At close range, the dial can be read to an accuracy of ±0.2Kg; when standing on the scales, however, the dial cannot be read so accurately, and so it was felt that the weak point in the design was the display. Thus, with the advance of digital electronics in the latter part of the 20th Century, it was not long before the first digital scales appeared on the market. The first digital scales had exactly the same internal mechanism as the analogue spring scales, with the dial replaced by a digital encoder wheel which was read optically. Unlike the analogue dial, the digital display was unambiguous, and the accuracy could be set electronically. As scale manufacturers were always looking for an edge over the competition, the design of bathroom scales continued to evolve. The next part of the mechanism to be replaced was the test spring, abandoned in favour of a small steel beam with a strain gauge attached (figure 2.9). A photograph of a digital strain gauge scale is included in figure 2.10. The scale retains the same lever mechanism as the analogue spring scale. The front levers still terminate in a steel plate, but the plate now pulls down on the end of a short metal beam (about 8cm in length, with a cross-sectional area of 0.5cm2). The other end of the beam is attached to a raised mount in the centre of the scale, and a small ‘neck’ is cut into the beam just beyond the fixed end. The strain gauge is attached to the neck, and measures the deflection of the beam when force is applied by the lever mechanism4. A strain gauge5 consists of a lengthy coil of fine wire. The resistance (R) of this wire depends on the resistivity ρ (a material property), length (L) and cross-sectional area (A):
ALR ρ=
The gauge is tightly bonded to the beam, and thus as the beam deforms, the coil of wire is stretched. This produces a very small change in the cross-sectional area, and thus resistance, of the wire. Since there is a large amount of wire in the coil, tiny changes can be measured; coupled with the use of a
Figure 2.9: A schematic showing a beam attached at the left hand end. The test plate rests on the other end; the strain gauge is shown in red. Figure 2.10: A photograph of a strain gauge scale without lid. The beam and test plate can be seen in the centre; the strain gauge is mounted under the blue shrink-wrap.
wheatstone bridge circuit (sensitive to resistance changes), this allows very small strains to be measured accurately. Indeed, the strain must be kept very small to avoid permanent deformation. This is crucial for bathroom scales, where the gauge will be re-used many times. The evolution of weighing technology has not ended with strain gauge technology. Recently, the lever mechanism has also been abandoned, along with the relatively new strain gauge measurement system. They have been replaced by small samples of piezoelectric material, contained within conducting channels. The piezoelectric material produces a charge which is dependant on the dynamic pressure applied, and has a wide range of sensitivity. Thus, the full weight applied to the scale can be transferred to the piezoelectric material, and the resulting charge signal is converted directly into a very accurate weight reading [6]. The technology is currently expensive, and beyond the scope of this investigation, but has proved extremely adaptable, allowing the fabrication of pocket weighing machines [4] and replacing mechanical systems for heavy-duty industrial applications such as truck weighbridges [2]. It is the driving force behind Weight-In-Motion, which allows calculation of a vehicle’s weight from sensors embedded in the road, without requiring the vehicle to stop or even slow down. This technology is already being installed in the USA, and should greatly facilitate traffic monitoring. 4 The applied force from the levers produces stress, and hence strain, in the beam. The behaviour for small strains is governed by Young’s Modulus (E). σ=Eε, where σ is the stress and ε is the strain. The neck is cut just beyond the fixed end, where simple cantilever theory suggests the stress will be greatest; it reduces the cross-sectional area under the strain gauge, further increasing the stress, and hence strain, at the gauge. 5 The reader is referred to [7] for detailed information on strain gauge load cells.
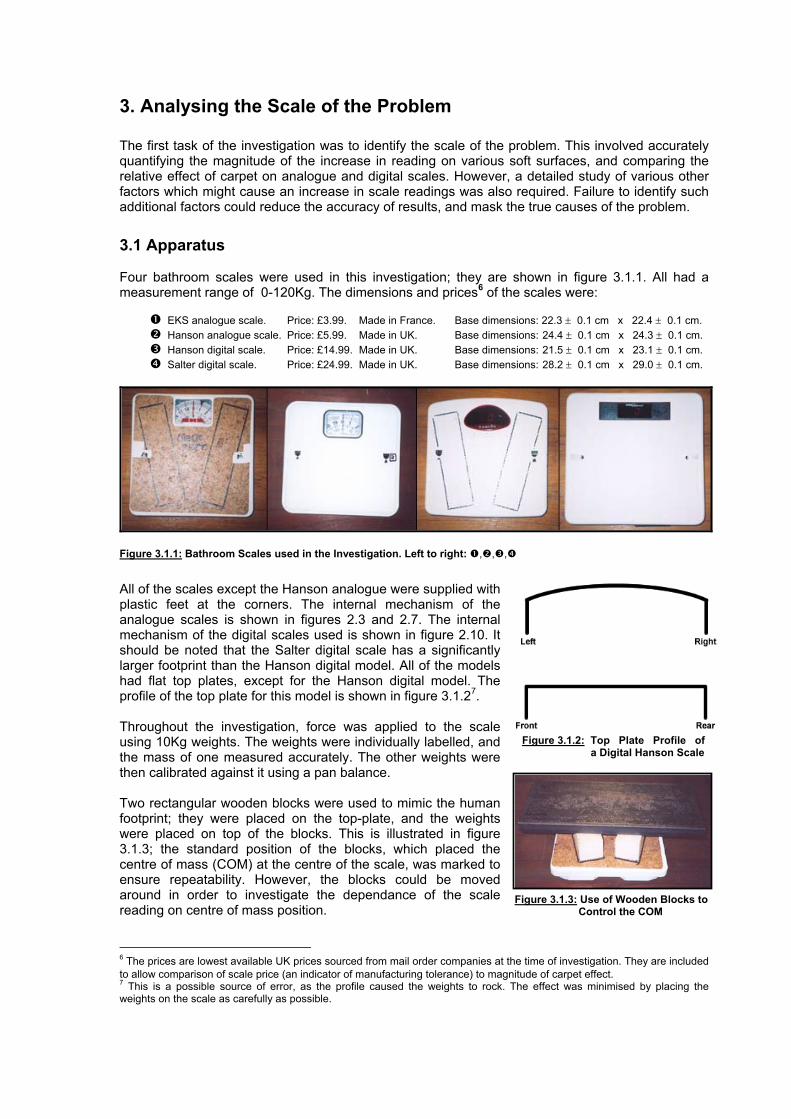
3. Analysing the Scale of the Problem The first task of the investigation was to identify the scale of the problem. This involved accurately quantifying the magnitude of the increase in reading on various soft surfaces, and comparing the relative effect of carpet on analogue and digital scales. However, a detailed study of various other factors which might cause an increase in scale readings was also required. Failure to identify such additional factors could reduce the accuracy of results, and mask the true causes of the problem. 3.1 Apparatus Four bathroom scales were used in this investigation; they are shown in figure 3.1.1. All had a measurement range of 0-120Kg. The dimensions and prices6 of the scales were:
EKS analogue scale. Price: £3.99. Made in France. Base dimensions: 22.3 ± 0.1 cm x 22.4 ± 0.1 cm. Hanson analogue scale. Price: £5.99. Made in UK. Base dimensions: 24.4 ± 0.1 cm x 24.3 ± 0.1 cm. Hanson digital scale. Price: £14.99. Made in UK. Base dimensions: 21.5 ± 0.1 cm x 23.1 ± 0.1 cm. Salter digital scale. Price: £24.99. Made in UK. Base dimensions: 28.2 ± 0.1 cm x 29.0 ± 0.1 cm.
Figure 3.1.1: Bathroom Scales used in the Investigation. Left to right: , , ,
All of the scales except the Hanson analogue were supplied with plastic feet at the corners. The internal mechanism of the analogue scales is shown in figures 2.3 and 2.7. The internal mechanism of the digital scales used is shown in figure 2.10. It should be noted that the Salter digital scale has a significantly larger footprint than the Hanson digital model. All of the models had flat top plates, except for the Hanson digital model. The profile of the top plate for this model is shown in figure 3.1.27. Throughout the investigation, force was applied to the scale using 10Kg weights. The weights were individually labelled, and the mass of one measured accurately. The other weights were then calibrated against it using a pan balance. Two rectangular wooden blocks were used to mimic the human footprint; they were placed on the top-plate, and the weights were placed on top of the blocks. This is illustrated in figure 3.1.3; the standard position of the blocks, which placed the centre of mass (COM) at the centre of the scale, was marked to ensure repeatability. However, the blocks could be moved around in order to investigate the dependance of the scale reading on centre of mass position.
Figure 3.1.2: Top Plate Profile of
a Digital Hanson Scale
Figure 3.1.3: Use of Wooden Blocks to
Control the COM
6 The prices are lowest available UK prices sourced from mail order companies at the time of investigation. They are included to allow comparison of scale price (an indicator of manufacturing tolerance) to magnitude of carpet effect. 7 This is a possible source of error, as the profile caused the weights to rock. The effect was minimised by placing the weights on the scale as carefully as possible.

Deflection of the base and internal parts of the scales was measured using two Dial Test Indicators (DTIs). DTIs consist of a dial and plunger. The plunger is placed in contact with the moving part; as it moves in, the reading on the dial increases. The full-scale deflections (FSD) of the two DTIs were 10mm and 25mm. Each full rotation of the dial represented 1mm, and so the dial markings gave an accuracy of 0.01mm (though careful reading could improve the accuracy to ±0.002mm). In order to measure deflections in both directions, a spring is included which acts to gently force the plunger back to its maximum extension. This force was measured to be 1N for the DTIs used.
Figure 3.1.4: A Dial Test Indicator [7]
Adding a DTI to the centre of the underside of the scales was found to cause a 0.2Kg increase in reading; adding a DTI to the test plate caused a 1.8Kg increase in reading. These effects were removed by re-zeroing the scales, which is valid as long as the DTIs exert a constant force across their measurement range. This was found to be approximately the case, but since the restoring force of springs depend on their extension, the force should vary significantly between extremes of the DTI range. Thus, the DTIs were always used in the centre of their range (4mm – 7mm, 9mm – 16mm) to minimise any errors due to the variation in plunger force. Other options for measuring the deflections of internal parts were considered, including strain gauges and laser rangefinders. Rangefinders are more accurate (±0.001mm), and do not interfere with the mechanics, but proved to be prohibitively expensive. Strain gauges cause much less interference than DTIs, but require accurate mounting and cannot be re-used. Complicated analysis would also be required to derive vertical deflection of the scale base from strain gauge readings. The chosen solution represents the best compromise between cost, simplicity and accuracy. The levers inside all four scales had a remarkable freedom of movement, both laterally and vertically. They were not clamped, even at the fulcrums; stable operation of the scales simply relied on the weight applied to the top plate to hold the levers in place. All of the groves cut in the levers (figure 2.8) were smooth, allowing the lever and top plate couplings a similar freedom of movement. Because the internal mechanism was potentially able to move around, the scales were tapped lightly after each change in applied mass, in order to gently settle the mechanism. All measurements were repeated a number of times, in order to reduce random error; the experiments were also interleaved in order to minimise systematic errors. Before the investigation began, the scales were analysed for accuracy and repeatability of readings. All scales displayed a repeatability of ±0.2Kg when making repeated measurements, except for the Salter digital scale which was limited to ±0.5Kg. The hard surface accuracy of the machines is plotted in Appendix A (3.1); the mean percentage difference between scale reading and applied mass on a hard surface is tabulated in figure 3.1.5.
EKS Analogue
Hanson Analogue
Hanson Digital
Salter Digital
-5.6±2.5% 0.34±2.26% 0.16±2.36% -1.8±2.4%
Figure 3.1.5: Mean Difference Between Scale Reading and Applied Mass (Hard Surface)
The soft surfaces used in the investigation included three types of carpet: thin pile carpet tile, medium pile (Embassy) and thick pile (Century Twist). 5” thick RX36/125 foam was also used. Samples of these surfaces are shown in figure 3.1.6.
Thin Pile Carpet Medium Pile Carpet Thick Pile Carpet 5” RX36/125 Foam
Figure 3.1.6: Samples of the Soft Surfaces used in the Investigation

Figure 3.2.1: Percentage Hysteresis in Scale Readings
0
1
2
3
4
5
6
7
0 20 40 60 80 100 120
Mass (Kg)
Perc
enta
ge In
Rea
ding
load
ing
Hanson Digital Salter Digital EKS Analogue
crea
se in
on
Un
Use of the weights allowed easy study of ten evenly spaced points across the mass range 0-100Kg; this could be achieved using two possible methods. The first involved applying all ten weights to the scale (100Kg), removing them one by one to reach the other points in the range. The second involved starting with no weights (0Kg) and adding them one by one. Before the investigation was begun in earnest, a study of these two methods was conducted (using analogue and digital scales on a hard surface) to discover whether they produced any differences in the readings
3.2 Hysteresis
at each point (hysteresis). In fact, substantial hysteresis was observed in the analogue scale studied, although the effect was much reduced in the digital scales. Figure 3.2.1 shows the percentage increase of readings when the weights were removed. The average hysteresis for the analogue scales was 2.36%±0.55%; for the digital scales, it was only 0.83%±0.27% (Hanson) and 0.15%±0.05% (Salter). The errors quoted are standard deviations. The average values do not tell the whole story; the errors hint that the digital scales displayed a much more constant level of hysteresis, whilst the analogue scales showed much more hysteresis at lower mass readings (peaking at 6.80%±0.02% for 10Kg). It is interesting the Salter digital scale shows by far the least hysteresis; it was the most expensive scale investigated, and might therefore be expected to be the most accurate. The hysteresis could be caused by various factors, including settling of the lever mechanism and measurement system (which should be in different directions depending on whether the weight change is positive or negative). There may also be a time delay between the weight change and full change in base deflection, which could contribute to the hysteresis. This is discussed further in section 4.1.
Weights Added Mass on Scale (Kg)None 0.00 A 10.387 ± 0.005 A+B 20.835 ± 0.011 A+B+C 31.075 ± 0.017 A+B+C+D 41.435 ± 0.024 A+B+C+D+E 51.924 ± 0.030 A+B+C+D+E+F 62.340 ± 0.037 A+B+C+D+E+F +G 72.703 ± 0.043
A+B+C+D+E+F +G+H 83.241 ± 0.050
A+B+C+D+E+F +G+H+I 93.656 ± 0.056
A+B+C+D+E+F +G+H+I+J 104.036 ± 0.062
As a result of this hysteresis, each experiment was started at 0Kg (which allowed the scales to be accurately zeroed at the start of each set of readings), and the weights were added. Since the weights were labelled (A-J), they were always added in the same order to further minimise the effect of scale hysteresis. Thus, every investigation comprised readings taken at the applied mass values given in figure 3.2.2. Note that the mass of each weight was known to an accuracy of ±0.005Kg. This is vastly more accurate than the scale readings, but retaining this accuracy throughout reduces the combined error at large mass, and means that horizontal error on plots can be largely ignored throughout the investigation.
Figure 3.2.2: The values of applied mass for which readings were taken

3.3 Spring Constant of the Measurement System A useful check on the analysis performed in section 2 is provided by studying the spring constants of the test spring (analogue scales) and test beam (digital scales). This can be easily achieved by measuring the displacement of the test plate with applied mass using a DTI. The lids of the scales used
Scale Spring Constant K (KNm-1)Hanson Analogue 12.13±0.30 Hanson Digital 36.52±1.34
Figure 3.3.1: Comparison of Mean Spring Constant for an
Analogue and a Digital Strain Gauge Scale.
in the investigation all had a number of pre-cut holes in them; these were initially masked by an aesthetic cushioned layer which also covers the springs that clamp the lid to the base8. Removal of the cushioned layer revealed that all of the scales had one of these holes above the test plate, which was used to place the DTI plunger in contact with the test plate. The relationship tested is Hooke’s Law (section 2); the spring constant is given by k=F/x. The extension of the test beam / spring (x) is given by the downwards movement of the test plate. The force (F) is the fraction of the weight on the top plate that is delivered to the test plate. The exact dimensions of the lever must be known to compute this fraction (see Appendix D). Two of the machines were studied; one analogue and one digital. The results are presented in figure 3.3.1. The experimental value for the analogue scale compares well with the discussion in section 2. As expected, the test beam in digital strain gauge scales is much stiffer than the test spring found in analogue scales; the experimental value of obtained for a test beam is three times higher than that obtained for a test spring. This means that the deflection of the end of the beam due to ten weights (104.04Kg) is only 2.092±0.005mm, which is much less than the 6.4±0.005mm found for the test spring9. Thus, the strain at the gauge will be tiny; it is clear why a neck must be cut into the test beam to ensure an accurate reading from the strain gauge. It is perplexing why the digital strain gauge scales retain the lever mechanism; more strain would be produced from the stiffer test beam if the full weight on the top plate was transferred to the beam. Presumably the precision of the strain gauge as a measuring device is such as to ensure an accurate reading with the lever mechanism; other explanations include the need of the manufacturers to modify the production line as little as possible when introducing a new product, in order to cut costs. The most likely explanation is that a strain gauge must only suffer very small strains if it is to be used many times to provide an accurate reading. Whether or not this provides a suitable level of accuracy will be discussed once all the results have been presented. Figure 3.3.2 shows how the measured spring constant varies over the mass range. It is interesting that the measured value rises very slowly as the mass increases. Since this is visible on both trends, which apply to very different physical objects, it is most likely a systematic error introduced by the measurement technique. Possible causes of this systematic include the bending of the base and squashing of the scale feet; these might cause the entire mechanism to move vertically as the weight increases. The value used for the deflection of the test plate at each point is the total vertical displacement since the last point; any vertical movement of the test spring / beam would be superimpose a systematic error on the Hooke’s Law relationship being tested. It can be seen that the overall magnitude of this systematic is small; thus its presence is not a significant problem, though the error given in figures 3.3.1 and 3.3.2 has been increased to one standard deviation of results.
Figure 3.3.2: Spring Constant of the Test Spring (Analogue) and Test Beam (Digital)
0
5000
10000
15000
20000
25000
30000
35000
40000
45000
0 200 400 600 800 1000 1200
Mass (Kg)
k (N
/m)
Hanson Digital Hanson Analogue 8 These holes are presumably cut in order for the manufacturers to test the scales prior to shipping, and the lowest cost solution for presentation and comfort is then to cover them with the cushioned layer. 9 The error quoted is a conservative estimate of random error due to reading of the DTI dial.

3.4 Detailed Study of Soft Surfaces Readings were taken using all of the soft surfaces presented in section 3.1. Since three of the scales had been supplied with plastic feet, it was necessary to test whether the increase in reading on carpet was due to its effect on the feet. Thus, readings were taken with each surface under the whole scale, and with small patches of each surface under the corners of the scale only. The EKS analogue scale was first studied in detail; the results are summarised in figure 3.4.1 and 3.4.5. The percentage increase given is the increase in scale readings above the hard surface (HS) value for that scale. The errors quoted are derived from scale measurement errors, which does not account for potential systematics. Thin Pile; Feet Only
Medium Pile; Feet Only
Thick Pile; Feet Only
Foam; Feet Only
Thin Pile; Full Cover
Medium Pile; Full Cover
Thick Pile; Full Cover
Foam; Full Cover
0.164±0.005 0.863±0.025 1.926±0.056 0.384±0.012 0.292±0.009 0.956±0.028 10.10±0.26 9.35±0.34
Figure 3.4.1: Summary of Percentage Increase in Reading for Soft Surfaces relative to HS value (EKS Analogue) This is represented graphically in figure 3.4.5. Interestingly, placing the soft surface purely under the feet of the scale produced very little effect. This suggests that, although the soft surface should allow the feet to move around, this is not the primary cause of the effect; section 4.2 deals with the effect of plastic feet in detail. Nonetheless, assuming that the principle source of error is measurement error, the results with soft surfaces under the feet suggest that feet movement does constitute a small contribution to the overall increase. However, the whole of the base must be covered in order to produce a noticeable effect. As expected from section 2, a 10% increase in readings was observed for the EKS analogue scale on thick carpet. However, the foam surface, which is much more deformable than thick carpet, did not produce a greater increase; this suggests that there is an optimum set of surface properties for the effect. The need for the whole base to be on a soft surface for a substantial effect implies that the roots of the problem lie in the sinking of the scale into the surface, which may be restricting base bending. Three of the scales are supported by feet, and the base of the Hanson analogue scale is lowered at the corners. Thus, all four of the scales only contact with a hard surface at the corners; it is therefore highly likely that the base of the scale bends when supporting large weight. If the corners sink into the soft surface, however, the whole base will be supported by the surface, reducing its deflection; since the carpet is less deformable than the foam, it should produce a greater support, and thus a larger effect. To test this theory, the EKS analogue scale was supported by four small sections of thick carpet at each corner; a fifth section was added to support the base of the scale at specific points. Readings were taken with this fifth section supporting the base at five points (A-E) shown in figure 3.4.2. The results are given in figure 3.4.3. It can be seen that the carpet has a marked effect on very specific regions of the base. Significantly, supporting position E (under the test spring) produces a large effect. Perhaps unsurprisingly, supporting the centre of the base produces the largest effect; since the base is supported at the corners, this is where the most base bending might be expected.
Figure 3.4.2: Schematic showing the points of the base studied in detail. The scale outline is in black. Corner carpet sections are red; blue sections show the positions studied.
Position of Fifth Carpet Section
% Increase in Reading
A 7.18 ± 0.18 B 2.15 ± 0.06 C 11.33 ± 0.28D 1.19 ± 0.03 E 8.975 ± 0.23
Figure 3.4.3: Supporting the base at different points with a small section of carpet produces dramatically different results (EKS Analogue).

The scales are calibrated by the manufacturers on a hard surface; thus, the calibration will take account of all the internal effects that are caused by the base bending freely in the space underneath created by the feet (or lowered corners, in the case of the Hanson analogue). Thus restriction of this bending, especially under the test spring mechanism10, does seem a likely cause. This conclusion is strengthened by the results for the digital scales; these are shown in figure 3.4.4. Figure 2.9 shows that there is no direct connection between the test plate and the base of the scale; thus one might expect that restriction of the base bending under the test beam and test plate should have no effect on digital scales. Sure enough, the experimental results show that these scales seem largely immune to the effect of carpet; the mean figures presented mask the fact that most of the readings across the weight range were identical on a hard surface and thick carpet. Those that were not differed by the smallest amount allowed by the accuracy of the machine11. This certainly supports the manufacturers’ claims that the digital strain gauge systems can be used on thick carpet; to an accuracy of ±0.4Kg (Hanson digital) / ±1Kg (Salter digital), every reading across the weight range was identical for carpet and hard surface. However, the results for foam imply that it might be rash to claim that they will work on any surface. The experiments were repeated a number of times over different days; again, not all readings differed between hard surface and foam surface, yet all those that did were lower on foam. This seems to imply thatexperimental error is unlikely, since the
Scale Thick Carpet Foam EKS Analogue 10.10 ± 0.26 9.35±0.24 Hanson Analogue 11.33 ± 0.24 10.62±0.25 Hanson Digital 0.295 ± 0.008 -0.819±0.022 Salter Digital 0.133 ± 0.008 -0.511±0.033
Figure 3.4.4: Mean percentage increase in readings on thick
carpet (full coverage) and foam (full coverage) weights were applied in exactly the same way as for carpet. Since the percentage change in readings for foam was very small, this effect was not investigated in detail; however, it is an interesting artefact, perhaps due to tilting of the scales on the much softer surface.
Figure 3.4.5: Average Increase in EKS Analogue Readings on Soft Surfaces
0 2 4 6 8 10
Thin Pile, full coverage
Thin pile; feet only
Meduim Pile, feet only
Medium Pile, full coverage
Thick Pile, feet only
Thick Pile, full coverage
Foam, feet only
Foam, full coverage
% Increase12
10 Section 2 explains how the top of the analogue test spring is connected to the base of the scale via a plastic peg (figure 2.8). Thus, the test spring may well move as the base deflects; this would also explain the systematic error observed in section 3.3. 11 0.2Kg for the Hanson model, 0.5KG for the Salter model. Fewer readings differed for the Salter model, giving rise to the smaller percentage effect quoted in figure 3.4.4.

3.5 Detailed Study of External Factors This section of the investigation looks at external factors which may effect the reading. For example, movement of the scale on carpet may be changing the centre of mass, or causing the scale to tilt. The effect of these factors was therefore analysed on a hard surface. Readings were taken with the centre of mass (COM) at the front and rear of the scale, and with the scale tilted forwards and backwards by 9.4°. It would have been difficult to achieve a significantly larger sloping angle than this without the stack of weights falling over at large mass values. The effect of supporting only three of the feet (front two and rear left), changing the distribution of stress throughout the scale, was also studied. Since section 3.4 revealed that the increase in readings on carpet was most likely due to the carpet supporting the base, it was also decided to test the effect of supporting the feet and the centre of the base with a hard surface (referred to in the report as hard surface; base supported or HSBS). Finally, readings taken with and without plastic feet were compared to determine whether feet were really necessary. These experiments were performed on a hard surface. All of the scales studied had lowered sections at the corners of the base; thus, even without plastic feet, only the corners of each scale were in contact with the surface. Figure 3.5.1: Percentage Increase over HS Readings (EKS Analogue)
-4 -2 0 2 4 6 8 10 12 14
Hard surface; BaseSupported
COM at Front
COM at Back
Three Feet Only
Sloping Forwards
Sloping Backwards
% Increase
The mean results are summarised in figure 3.5.1. Errors are not shown on the plot; the measurement errors are too small to be visible. The plot in Appendix A shows that the percentage increase in readings is fairly constant above 10Kg; thus, the error for the mean need not be increased significantly above the mean measurement error. At 10Kg, when only one weight has been added, the scale’s mechanism will be settling; thus, a larger error might be expected. This point was therefore largely ignored when calculating mean values in the report. Only one of the factors has a significant effect: supporting the base in the centre. This causes an increase of 13.20±0.34%. It provides further evidence that support of the base by the carpet is responsible for its effect on readings, and strengthens the theory that subsequent restriction of base bending is the key cause.

Varying the centre of mass has almost no effect at all; the levers seem to constitute a mechanical system which makes the scale operation virtually independent of the position of the weight on the top plate, similar to the trick used in a pan balance. All four levers are effectively coupled, so that an excess of force on one lever should redistribute among the system to cause an approximately equal downward motion of all of the levers. The
Scale HSBS Increase in Reading
EKS Analogue 13.20±0.34 Hanson Analogue 12.48±0.31
Figure 3.5.2: Increase in Analogue Scale Readings when the base is supported.
total force transmitted to the test plate should therefore be the same, wherever the mass is placed on the top plate. Interestingly, both directions of tilt produced a decrease in reading. This is most likely also due to the lever system; tilting introduces an increase in stress to the front or rear of the machine, which may well (since the lever coupling points are smooth) lead to deformation which changes the moments of the levers, leading to less force on the test plate for a given weight on the scale. This idea is discussed further in section 5. The fact that moving the COM to the front and back has opposite effects on the readings produced makes it unlikely that an imbalance of force on the front and rear levers is the cause of the effect due to tilting. Supporting only three of the scale’s feet has produced a small but significant effect; this is unexpected, since the COM was moved to a stable point between the three supported feet. Thus, the only physical effect should be a redistribution of the weight through the remaining three feet. Coupled with the removal of force at the fourth corner, this might cause a deformation in the scale base plate which changes the lever moments in a similar way to a tilt. The effect of removing the plastic feet is shown in figure 3.5.3. This was studied using the Hanson analogue scale, because the bottom of the adjustment knob on the EKS scale penetrated through the base of the scale; this caused unpredictable results when the feet were removed, as the knob contacted with the hard surface. There is only a ±0.70% difference between readings with and without feet. Thus, it seems that mounting the scale on plastic feet has very little effect on the accuracy of the scale. The similarity of readings on thick carpet for the EKS (with feet) and Hanson (without feet) analogue scales (figures 3.4.4 and 3.5.2) suggests that the feet do not substantially alter the effect of carpet either. Their advantage may, however, lie in stabilising the scales on uneven surfaces.
Figure 3.5.3: Comparison of Hanson Analogue Scale Accuracy With and Without Plastic Feet
0
20
40
60
80
100
120
0.000 20.000 40.000 60.000 80.000 100.000 120.000
Mass (Kg)
Rea
ding
(Kg)
Hard surface; weights added With feet added

Figure 4.1: Vertical Displacement of Hanson Analogue Scale on Carpet
-700
-600
-500
-400
-300
-200
-100
00 20 40 60 80 100
Mass (Kg)
First Second Third
Dis
plac
emen
t (x0
.01
mm
)
All of the readings taken on carpet throughout section 4 have been corrected by subtracting the mean vertical displacement of the base of the scale next to one of the feet. However, figure 4.1 shows that this will greatly increase the error in the results collected on carpet. Fortunately, section 3.5 has revealed that use of the scales on a hard surface with the base supported will also produce the required effect; thus, HSBS readings can be used to clarify the results collected on thick carpet.
4. Analysing the Scale Mechanism Before the results of this part of the investigation are presented, it should be noted that study of displacements within a scale is extremely difficult on carpet. This is because the scale sinks into carpet as the weight on the top plate is increased; unfortunately, the amount by which the scale sinks into the carpet does not accurately relate to the weight applied. This is illustrated in figure 4.112; a DTI was used to measure how the entire Hanson analogue scale sinks into thick carpet during three consecutive sets of readings. The shape of the curve is similar for each set of readings, but the magnitude of the displacement is different for each, and does not relate to the number of sets of readings which have already been taken on the carpet. That the shapes of the curves are similar is encouraging, since it suggests that the resistance of the carpet to deformation changes in a similar way each time. However, the large variation in magnitude makes correcting for the problem very difficult.
120
4.1 Study of Base Deflection The deflection of the base of the Hanson analogue scale (on a hard surface) was measured using a DTI; readings were taken across the available mass range. The scales were raised up from the bench, supported at the feet by wooden blocks. The DTI was then placed under the scale with the plunger in contact with the base; the eight positions shown in figure 4.1.1 were studied. Section 3.2 had concluded that base bending might be a factor responsible for the observed hysteresis in the scales. Thus, the first measurements were performed on the centre of the scale base; readings were taken across the weight range using the two methods outlined in section 3.2. The results are shown in figure 4.1.2. The mean level of hysteresis was:
g: 15.2 ± 3.9 % e: 26.2 ± 5.3 %
Figure 4.1.1: Positions of the DTI plunger for measurements of base deflection. Scale shown schematically in black, viewed from above.
This is, in fact, a much larger effect than that displayed by the scale readings. The results show that slow temporal response of the base to changes in stress may well cause the hysteresis observed in section 3.2; the shape of the curves are very similar. However, they also suggest that the scale reading is less dependant on base deflection than previously thought, since the scale readings display much smaller hysteresis than the base bending. Once the level of hysteresis had been established, all eight positions were studied in detail. The results are shown in figure 4.1.3. Note that measurement error is too small to display on the plot.
12 Note that all negative displacements in this report refer to downwards movement.

Figure 4.1.2: Hysteresis in the Base Deflection of the Hanson Analogue Scale
-90
-80
-70
-60
-50
-40
-30
-20
-10
0
10
0 20 40 60 80 100 120
Mass (Kg)
Def
lect
ion
(x0.
g, weights added g, weights removed e, weights added e, weights removed
01 m
m)
The relationship shows remarkable linearity, as might be expected for small strains within the base plate. Surprisingly, however, the base bends most at the rear, not the centre, of the machine; the total deflection at 10 weights was –2.896±0.021mm (point b). Significantly, this is under the test plate, which is one of two positions where the carpet was found to cause a considerable increase in readings. The bending at the centre (h) is only 23% of the magnitude found under the test spring.
Figure 4.1.4: Base Deflection at Point b on Thick Carpet
-350
-300
-250
-200
-150
-100
-50
00 20 40 60 80 100 120
Mass (Kg)
lect
ion
(x0.
Deflecton Under Test Plate on Thick Carpet Deflecton Under Test Plate on Hard Surface
Def
01 m
m)
It is interesting that figure 4.1.4 suggests the base bends more on carpet at low weight. However, this is the region of greatest uncertainty in the amount by which the scale sinks into the carpet. Thus, the anomaly at low weight values is most likely due to the error in subtracting the vertical movement of the whole scale from the measured movement at point d.
Figure 4.1.3: Cumulative Base Deflection Across the Mass Range (Hanson Analogue)
-350
-300
-250
-200
-150
-100
-50
00 20 40 60 80 100 120
Mass (Kg)
ectio
n (x
0.
a b c d e f g h
Tota
l Def
l01
mm
)
The base deflection of the Hanson digital machine is plotted in Appendix A. As expected from the results of section 3, the base is much stiffer than that of the analogue scale. The most deflection is again seen at point b (-0.986±0.011mm at 10 weights). The reading at h is now 76% that at b.
The front of the base bends more than the sides, which seem remarkably stiff (mean 10-weight deflection −0.455±0.063mm). The least bending is found at point e.
Figure 4.1.4 shows the mean base deflection of the Hanson analogue scale on thick carpet. The readings were taken at point b, where the presence of carpet has a large effect on the reading. Errors are much increased, as discussed at the beginning of the section; despite this, however, the bending is markedly reduced at high weight, as expected.
This constitutes strong evidence that the initial theory is correct, and that the carpet causes scale readings to increase by restricting the amount by which the scale can bend.

4.2 Investigating the Causes of Base Deflection The findings in section 4.1 add significant weight to the theory that restriction of base bending under the test spring is the cause of the increase in analogue scale readings on carpet. However, they also suggest that the effect of carpet on scale readings might be much smaller than the actual restriction of the bending. Knowledge of the mechanical causes of the bending may help clarify the situation, and some experiments were performed to this end. The weight supported by the scale is supported only by the corners; this will lead to substantial horizontal stresses in the base of the scale, which will inevitably cause strain, and thus vertical displacement. However, section 2 reveals that the fulcrums supporting the lever system are not aligned vertically with the plastic feet; the weight from the fulcrums is transferred to the very edge of the base, whilst the feet are set in from the sides by an amount dependant on the scale manufacturer. Yet the forces supported by these points are equal and opposite13, and so there should be a couple generated by this misalignment; this is illustrated in figure 4.2.1. The couples at the four feet should generate horizontal force on the feet. The theory then suggests that on a hard surface, the forces created by the couples remain, causing extra strain in the base; however, when the scale is placed on a soft surface, the feet should be able to move horizontally, reducing the strain due to couples.
Figure 4.2.1: Weight from the fulcrum is balanced by the normal force through the foot. The perpendicular distance between them causes a couple (blue arrow), which acts to cause rotation around the blue cross. This manifests as a horizontal force on the foot. Figure 4.2.2: Schematic showing four configurations of thin wooden blocks (red) designed to change the magnitude of the couples generated by the feet.
Evidence gathered already seems to suggest that these moments will have little effect; the presence of plastic feet did not seem to affect the analogue scale reading on carpet at all (section 3.5), and the Hanson analogue is shipped without feet, suggesting that Hanson believe their presence is not necessary as long as only the corners of the base are in contact with the surface. Nonetheless, the theory certainly seemed plausible. The original idea for the study involved supporting the feet of the scale on four spikes. Placing the spikes at the outer and inner edges of the feet should produce different moments due to the change in distance between the fulcrums and the points of support. However, this technique was not used because pressure on the feet due to the spikes caused damage at higher masses. 14 Thus, the theory was studied using two other techniques. The first involved using thin wooden blocks instead of spikes, in order to spread the load. Five sets of readings were taken; one with all of the feet supported by the blocks, and four with the blocks supporting the edges of the feet in different configurations. These configurations are illustrated schematically in figure 4.2.2. The EKS analogue scale was used in this technique, which required plastic feet; the results are plotted in Appendix A. The table in figure 4.2.3 shows percentage increase of each configuration over the first set of readings; the errors are standard deviation of results.
a b c d Mean % Increase in Reading 0.15 ± 0.52 0.65 ± 1.02 0.05 ± 1.18 3.49 ± 0.92
Figure 4.2.3: Percentage Increase in Readings due to Moments
13 Newton’s third law; the downwards force on the fulcrum must be balanced by an upwards force through the feet. 14 Also, since the Hanson analogue scale was not shipped with feet, this did not seem a fair test.

Only one configuration (d) shows significant increase in reading. This configuration has the maximum distance between fulcrum and axis of support, and thus the largest horizontal force on the feet. The effect is much smaller than the effect of carpet on the accuracy of the scale. This suggests that the moments generated by the area in contact with the surface are too small to contribute significantly to the carpet effect. The second technique involved placing squash balls under the corners of the scale. The squash balls became extremely soft and malleable under the applied weight, allowing the corners of the scale total freedom of horizontal movement without allowing the rest of the base to contact with a hard surface. Results were obtained using the Hanson analogue scale; they are shown graphically in Appendix A. The squash balls had no discernable effect; the mean percentage increase in readings with squash balls was 0.13±0.17%, which is zero to well within experimental error. The combined results of both measurement techniques, coupled with the results from section 3.5, provide strong evidence that moments due to misalignment of the fulcrums and axis of support do not contribute significantly to base deflection. Thus, the deflection must be principally due to stress from supporting the weight on the scale at the four corners. 4.3 Movement of the Test Plate The final task of this section was to find whether the extra increase in analogue scale readings on carpet was due to excess downwards movement of the test plate, or excess upwards movement of the test spring. Readings were taken on thick carpet and on a hard surface with the base supported using the Hanson analogue scale; the results are shown in figures C1 and C2 (Appendix C). Both test plate and top plate movement was measured. Interpretation of the results, however, depends on whether the plastic peg that supports the test spring moves downwards as the base deflects underneath it. That this occurs is not as obvious as it may seem; the adjustment dial supports the bottom of the peg, but this rests not on the scale base, but on a metal channel lying just above the base. This is the rear end of the metal channel discussed in section 2, which contains the mechanisms converting the vertical motion of the test plate into rotational motion of the dial. A close-up photograph of this section of the scale is shown in figure 4.3.1. There is no physical attachment between the bottom of this channel and the base, except at the front of the scale. There is a small protrusion from the base at the centre of the scale which penetrates a hole in the bottom of the channel; its purpose appears to be prevention of horizontal movement of the channel without clamping it to the base. However, there is no discernable gap between the bottom of this channel (under the adjustment knob) and the base of the scale when the scale is open and supporting no weight. Nonetheless, there is no guarantee that there is contact between the two as the applied weight increases.
Figure 4.3.1: Close up of the central metal channel, which terminates directly underneath the test spring.
Detailed analysis has been performed on the experimental results, and this is included in Appendix C. The results appear contradictory. Figures C3 and C4 show clearly that there is no difference in vertical HS and HSBS test plate movement relative to the hard surface on which the scale rests. Correcting the true deflection of the test plate by subtracting the HS and HSBS base bending under the test plate reveals a change in ratio of top plate and test plate movement of 10.1±0.6%, which could mean a change in fraction of the weight transmitted by the levers (lever moment) of the same amount. This compares well to the observed HSBS increase in scale readings of 12.48±0.25%. However, this correction may not be false. The digital strain gauge scales retain the analogue lever mechanism, yet are immune to the carpet effect; this in itself is strong evidence against change in lever moments when the base of the scale is supported. The correction also gives a HSBS:HS corrected test plate deflection ratio of 0.61±0.08, which suggests a change in lever moment of ~40%. The disagreement of this value with that derived from the change in top:test plate ratios also suggests that the correction is invalid.

Figure 4.3.2: Excess Top Plate Movement on Carpet
-400
-350
-300
50
-200
-150
-100
-50
00 20 40 60 80 100 120
Mass (Kg)
Figure 4.3.3: Vertical Displacement of Top of Test Spring
-60
-50
-40
-30
-20
-10
00 20 40 60 80 100
Mass (Kg)
lace
HS HSBS
Dis
pm
ent (
x0.0
1 m
m)
The easiest way to clear up the doubt over the corrections applied in Appendix C was to measure the vertical movement of the spring using a DTI. This was done, though reliable readings were difficult due to the lack of a flat surface to place the DTI plunger against; consequently, different sets of readings showed fairly wide variation. The mean results are shown in figure 4.3.3; the test spring does indeed appear to move vertically as weight is applied, and this movement is different for HS and HSBS. The movement is not quite linear, showing an increase in gradient at 40Kg in a similar manner
-2
Dis
plac
emen
t (x0
.01
mm
)
What cannot be refuted is that figures C4 and 4.3.2 show that excess top plate movement is observed for both HSBS and thick carpet, suggesting a strong link between this and the increase in scale readings. Figure 4.3.2 shows a linear increase in excess deflection with mass, though the gradient appears to change at 40Kg. The gradient change is substantial, and could be interpreted as a change in moment of the lever system above 40Kg. However, the highly non-linear form of the ratio of top plate movement on HS to HSBS, compared to the approximately linear
form of both corrected and uncorrected test plate movement (figure C4), suggests very strongly that the excess top plate movement is translated into something other than vertical test plate movement. This would mean the gradient change in figure 4.3.2 did not correspond to a change in lever moment. This is discussed further in section 6, which takes the results of section 5 into account.
120
to figure 4.3.2; this suggests a possible link between the two effects. The magnitude of the spring movement does not compare at all with the magnitude of base bending. The difference between the two displacements at 10 weights is +0.16±0.02mm, which compares to a difference in base bending of +2.55±0.08mm. Thus, although the test spring does move as weight is added, it does not follow the base bending. The difference between the spring displacements corresponds to an increase in reading of 2.51%, which is enough to explain the very slight discrepancy in HS and HSBS test plate readings. If this is the case, the HS and HSBS vertical test plate displacements are equal. All of the results in figure C4 (except the top plate ratio and HS plate deflection ratio) show a very slight increase with mass; this increase is also displayed by the difference between plate deflection ratios. This points to small vertical movements which have not been corrected for, and could well be due to the force of the DTI plunger on the test plate changing with extension; however, the results are certainly accurate enough to indicate the behaviour of the scale with this source of unknown error included. Appendix A (4.3) confirms that the actual readings are remarkably constant across the mass range.

5. Identifying the Internal Causes of the Problem The data gathered so far suggests that carpet restricts bending of the scale base; the remaining problem which must be solved is how the bending of the base actually affects the internal mechanism to cause an increase in readings. Section 4 gives rise to three strong possibilities. Restriction of base bending by carpet may be:
Moving the test spring vertically relative to its HS position. Moving the levers, and thus changing the moment of the lever system. Moving the central channel, and crucially the system which changes vertical motion of the
test plate into horizontal motion (point X in figure 2.4), vertically. Evidence in section 4.3 has shown that test spring movement is unlikely to be the cause; however, there was difficulty in obtaining reliable DTI measurements, and some results suggested that a much larger test spring movement than that observed might be possible; thus, section 5.1 includes further tests for spring movement. The second possibility seems the most likely given the results of section 4.3; observations made in section 2 confirmed that it is possible, since the depressions in the levers are smooth and gradual. Figure 5.1 shows a simplified schematic of the analogue lever system. The force (F) transferred to the test plate is given by:
Wba
aF
+=
Figure 5.1: Schematic of the lever system in an analogue scale
where W is the weight on the top plate. If, for example, the corners of the scale move outwards because of the extra stress due to restriction of bending (strain), the levers also move outwards. For each lever, the distance between the fulcrum and top plate coupling (a) increases15; however, the levers are a finite length, and so the distance between the top plate coupling and the test plate (b) must decrease. These changes tend to increase the fraction of the applied weight transmitted to the test plate,and would therefore increase the scale reading. See Appendix D for a detailed discussion. The third possibility arises because of the way that the system which converts the test plate motion works (section 2); the lever at point X in figure 2.4 rests on top of the test plate, and follows it downwards as weight is applied. Thus, any upwards motion of the lever supports at point X would have the same effect on the lever as downward motion of the test plate, increasing the scale readings. Further close-up photographs of the central mechanism of the scale are shown in figures 5.2 and 5.3.
Figure 5.2 (above): Internal mech-anism of an analogue scale
Figure 5.3: Photo-graphs showing the central mech-anism of an analogue scale
15 This assumes the top plate couplings cannot move relative to each other. This seems a reasonable assumption, since the top plate will not easily deform.
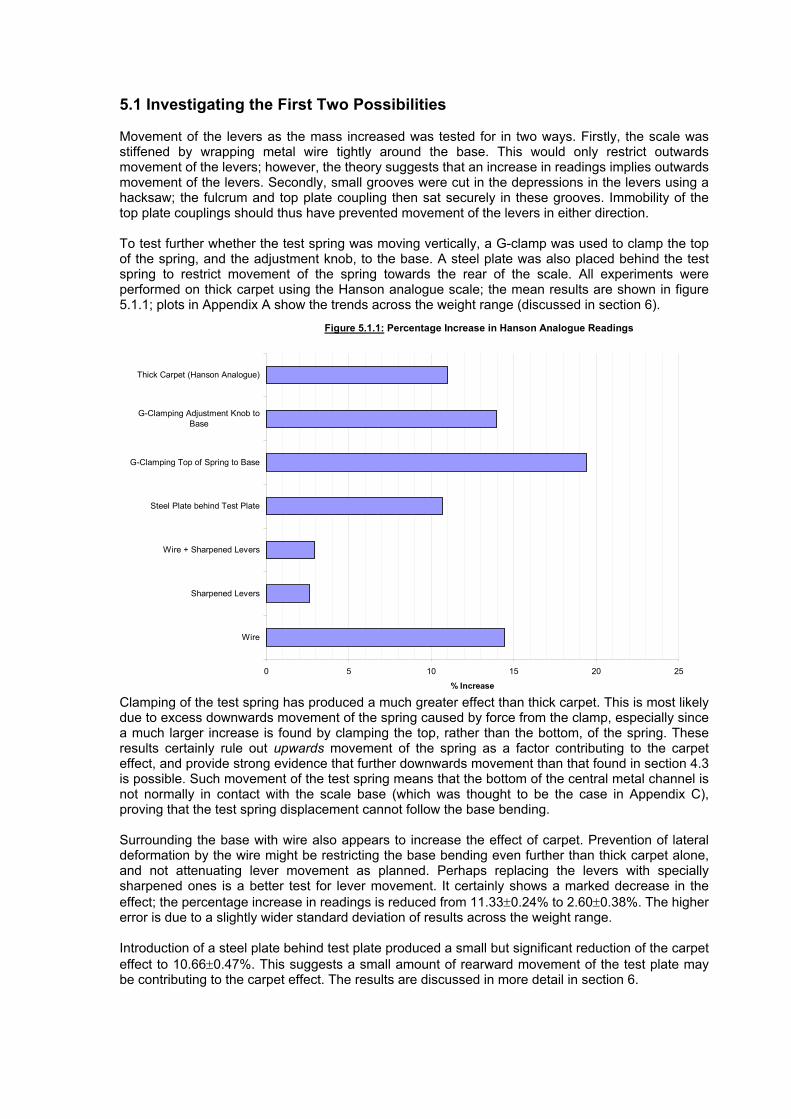
5.1 Investigating the First Two Possibilities Movement of the levers as the mass increased was tested for in two ways. Firstly, the scale was stiffened by wrapping metal wire tightly around the base. This would only restrict outwards movement of the levers; however, the theory suggests that an increase in readings implies outwards movement of the levers. Secondly, small grooves were cut in the depressions in the levers using a hacksaw; the fulcrum and top plate coupling then sat securely in these grooves. Immobility of the top plate couplings should thus have prevented movement of the levers in either direction. To test further whether the test spring was moving vertically, a G-clamp was used to clamp the top of the spring, and the adjustment knob, to the base. A steel plate was also placed behind the test spring to restrict movement of the spring towards the rear of the scale. All experiments were performed on thick carpet using the Hanson analogue scale; the mean results are shown in figure 5.1.1; plots in Appendix A show the trends across the weight range (discussed in section 6). Figure 5.1.1: Percentage Increase in Hanson Analogue Readings
0 5 10 15 20 25
Wire
Sharpened Levers
Wire + Sharpened Levers
Steel Plate behind Test Plate
G-Clamping Top of Spring to Base
G-Clamping Adjustment Knob toBase
Thick Carpet (Hanson Analogue)
% Increase
Clamping of the test spring has produced a much greater effect than thick carpet. This is most likely due to excess downwards movement of the spring caused by force from the clamp, especially since a much larger increase is found by clamping the top, rather than the bottom, of the spring. These results certainly rule out upwards movement of the spring as a factor contributing to the carpet effect, and provide strong evidence that further downwards movement than that found in section 4.3 is possible. Such movement of the test spring means that the bottom of the central metal channel is not normally in contact with the scale base (which was thought to be the case in Appendix C), proving that the test spring displacement cannot follow the base bending. Surrounding the base with wire also appears to increase the effect of carpet. Prevention of lateral deformation by the wire might be restricting the base bending even further than thick carpet alone, and not attenuating lever movement as planned. Perhaps replacing the levers with specially sharpened ones is a better test for lever movement. It certainly shows a marked decrease in the effect; the percentage increase in readings is reduced from 11.33±0.24% to 2.60±0.38%. The higher error is due to a slightly wider standard deviation of results across the weight range. Introduction of a steel plate behind test plate produced a small but significant reduction of the carpet effect to 10.66±0.47%. This suggests a small amount of rearward movement of the test plate may be contributing to the carpet effect. The results are discussed in more detail in section 6.

5.2 Displacement of the Central Mechanism Displacement of the analogue scale’s central mechanism (point X in figure 2.4) was measured using a DTI; the Hanson scale was used with the sharpened levers, in order to asses whether this displacement might account for the remaining 2.6% increase in readings on thick carpet. The measurements are shown in figure 5.2.1. The mechanism moves vertically even on a hard surface; this movement increases approximately linearly with mass, reaching -0.50±0.01mm at 104Kg. Supporting the base, however, reverses the direction of this movement. Substituting thick carpet increases the amount by which the mechanism moves in the opposite direction to +0.37±0.01mm at 104Kg. Figure 5.2.1: Deflection of Central Mechanism on Three Surfaces
-60
-50
-40
-30
-20
-10
0
10
20
30
40
50
0 20 40 60 80 100
Mass (Kg)
Def
leci
on (x
0.01
mm
)
Hard Surface Carpet Base Supported
120 Comparison of the gradients of lines of best fit is shown in figure 5.2.2. It shows that the HS and HSBS rates of movement are virtually equal in magnitude, and the rate of movement on thick carpet is 14% greater. The maximum difference between the HS and carpet movement is +0.87±0.03mm at 104Kg. If the theory given at the beginning of the section 5 is correct, this should have a similar effect to 0.87mm extra downwards deflection of the test pate. The rate of test plate movement with mass was found to be –0.612mm/Kg (section 4.3). Thus, an increase in test plate deflection of 0.87mm should cause an excess reading of +14.3Kg (13.5%). However, this assumes that upwards movement of the central mechanism corresponds to an equal downwards movement of the test plate. In practise, the arrangement of the central mechanism means that its movement probably causes a much smaller change in reading than similar movement of the test plate.
HS HSBS Thick Carpet -0.28±0.02 0.23±0.02 0.32±0.03
Figure 5.2.2: Rates of vertical movement of the analogue central mechanism (x0.01 mm/Kg)
Section 5.1 limits the possible effect of this movement to the remaining 2.6% still present with sharpened levers (rather than the maximum possible 13.5%).

6. Discussion Section 3.1 shows that all of the scales studied were accurate to within 5% of the true applied mass; this is particularly impressive given the complex mechanism inside the analogue scales. The analogue machines displayed a greater dependance on the loading history, and a far greater increase in readings on carpet. Since the hysteresis depends on the latency in the internal mechanism, the carpet effect is likely to also be due to this latency. Lack of hysteresis in the digital scales rules out the lever system as a prime causes of hysteresis; thus, base bending seems the most likely cause, suggesting that the bases of the digital scales are stiffer than those of the analogue scales studied (found in section 4.1). Section 3.4 found that digital scale readings were slightly reduced on foam, and tilting of the scale was mooted as a possible cause. This is supported by the discovery in section 3.5 that tilting analogue scales forwards or backwards reduces the reading by a small amount. Readings were increased further on thick carpet than on foam, suggesting that there exists an optimum set of surface properties which would produce a maximum increase in readings. Carpet has a low initial resistance to deformation, allowing the scale to sink until the entire base is supported. The resistance of the carpet to deformation then increases as the deformation increases, and so the carpet exerts a higher force on the base (and thus a lower force on the feet) at high mass. The investigation has shown that increase in readings on carpet depends on the relative amount of weight supported by the base, rather than the feet16, of the scale. A slight percentage increase was observed with thick carpet under the corners of the scale (section 3.4), and a further increase obtained by using the configuration in section 4.2 designed to cause maximum couple on the feet. However, no increase was observed when squash balls were placed under the corners. Thus, the increase in readings on carpet may at most owe a very small contribution to torque on the feet. Plots in Appendix A for sections 4.3, 3.5, and 5.1 show a small but significant reduction of % increase as the weight increases, becoming noticeable at about 40Kg. Plots of top plate and test plate deflection with weight (Appendix A, 4.3) also show this slight decrease with increasing weight. A change in gradient was also noticeable in figures 4.3.2 and 4.3.3 at 40Kg. This suggests that a real effect (rather than a systematic error) is occurring at 40Kg. However, the spring constant does not show a sharp change here. There is no obvious explanation for a real effect, which provides a good basis for a follow-up investigation. In any case, it is small enough not to significantly off-set the mean values used in the investigation. The slight rise in spring constant across the mass range is likely to be a systematic error, and is discussed in detail in section 3.3. The main sources of error in this investigation depend on the surface used. Measurements made on a hard surface might involve systematic errors as the weight increases from unknown movements within the scale mechanism. The observed linearity when testing for relationships like Hooke’s Law (sections 3 and 4) is a good indication that these errors, if present, were not restrictive. Measurements were repeated a number of times in order to try and minimise the effect of random errors; they were also interleaved to try and reduce systematics. The results presented are in this report are mean values of these repeated measurements. On soft surfaces, the largest source of error in measurements of displacements was the sinking of the scale; the magnitude, and to some extent the trend, of this error was random, making correction very difficult (section 4). The moment of the lever system in the Hanson analogue scale is found to be 0.0768 (almost exactly 1/13) in Appendix D. This is indeed the 1:12 ratio proposed in section 2, allowing the spring constant of the test spring (12.130±0.296 KNm-1) to be close to that expected (9KNm-1); the maximum extension of the test spring (0.72cm) was found to be less than that suggested in section 2 (1cm), which accounts for the difference. Significant asymmetry was found in Appendix D. The dimensions of the lowered sections of base plate, the position of the top plate couplings and the lengths of the levers all displayed differences between the front, rear, left and right of the scale.
16 Feet is used here to describe the parts of the base usually in contact with the hard floor, whether special plastic items or merely the lower sections of the base plate at the corners.

Nonetheless, section 3.5 found that these differences caused little effect on the scale readings when the centre of mass was moved or the scale tilted. A spreadsheet model based on measurements from the Hanson analogue scale in Appendix D confirmed that these asymmetries should have little practical effect when the weight distribution (factors x and y in Appendix D) was changed. The drastic reduction of the carpet effect with sharpened levers suggests very strongly that lever movement is the prime cause. It is interesting that using the sharp levers and surrounding the base with wire increased the effect from 2.60±0.29% to 2.92±0.38%. Though these results could be considered equal to within deviational error, the plot in Appendix A (5.1) shows that the results with wire are visibly greater than the set without wire across the weight range. This suggests that lateral movement of the test plate may be the cause; stress, and the resulting deformation, in the sides of the scale might be forcing the levers inwards, not outwards as the theory in section 5 suggests. The taut wire at the corners may be pulling the levers inwards, whether or not sharpened levers are used. Section 4.3 showed that the moment of the lever system most probably does not change on carpet; this leaves the question of how the levers may be responsible for the carpet effect, especially since the digital machines with the same lever system show very little increase in readings on carpet. The grooves cut in the levers in section 5.1 made the lever system rigid; even with the top plate removed, the levers could not be moved laterally. Since the front levers are welded to the test plate, lateral movement of the levers would cause lateral movement of the test plate – and thus excess extension of the test spring. Suppression of this lateral movement could be the cause of the impressive reduction in the carpet effect when sharpened levers are used; this is supported by the reduction observed when a steel plate is placed behind the test plate to halt any movement of the plate towards the rear of the scale.
Figure 6.1: Close-up photograph of the end of the test beam (Hanson digital)
A wire cage around the test plate was attempted which would theoretically prevent lateral movement; unfortunately, it was impossible to prevent the cage impeding the vertical movement of the plate. However, clamping of the test spring should increase the effect (which was observed), since it would not allow the spring to follow the lateral movement of the test plate, further increasing the excess extension. This would also explain why digital scales are not affected by carpet; figure 6.1 shows a groove in the top of the test beam. The test plate pushes down on the bottom of a wide metal frame (figure 6.2), the top of which sits in this grove. This innovative coupling of the test plate to the beam means that sideways movement of the plate will have no effect on the beam deflection.
Figure 6.2: Schematic showing the metal frame that couples the test beam and plate
The proposed lateral movement of the test plate does not contradict the excess top and test plate movements on carpet discovered in section 4. In fact, it constitutes an explanation for why the un-corrected HS and HSBS vertical test plate movements appeared to by identical, yet the HSBS vertical top plate displacement was greater. The extra top plate movement would then be caused by sideways movement of the test plate, explaining the slight reduction in HS and HSBS top:test plate deflection ratios (figure 4.4.1) with increasing mass. The fraction of the weight delivered to the test spring would not change significantly, explaining how digital scales, which incorporate the same lever system, are not affected by carpet. The weak point in the analogue scale system is the central mechanism, which converts vertical motion into horizontal, and then rotational motion. Inappropriate motion of parts of this mechanism is incorrectly interpreted as further extension of the test spring. The simplest and most effective improvement to the this system would be to sharpen the levers; however, this would require a substantial increase in both manufacturing time and manufacturing cost, since the levers would have to be individually cut with a saw after production. Presumably there is substantial demand for scales which sacrifice high accuracy and surface tolerance in favour of low cost.

7. Conclusions The principle conclusions of the report are listed below:
Households with carpeted bathrooms are strongly advised to use a set of digital strain gauge scales. Carpet causes a 10 – 12 percent increase in readings on analogue scales, but has virtually no effect on digital strain gauge scales (less than 0.5% increase).
This percentage increase is roughly constant across the mass range, diminishing slightly at higher mass.
The increase in readings on carpet is due to restriction of bending of the scale base. This chiefly causes lateral movement of the lever system and vertical movement of the mechanism which converts extension of the spring into rotation of the dial. Both of these effects cause extra rotation of the dial.
The most effective modification to the analogue scale mechanism is to cut sharp grooves at the bottom of depressions in the levers. This reduces the effect of carpet to a 2.60±0.38% increase in readings (Hanson analogue).
The position of the centre of mass has very little effect (maximum 0.6%) on analogue scale readings; it has no effect at all on digital strain gauge scales.
Base bending is far higher at the rear of scales; for the Hanson analogue, it was roughly six times greater than in the centre of the base.
Both the base bending and carpet effect in analogue scales showed significant dependance on loading history, which should not affect the scales under normal operating conditions. Digital strain gauge scales showed very little dependance on loading history.
The spring constant of the analogue measuring system was found to be 12.13±0.30KNm-1 (Hanson analogue). This compares with a much stiffer 36.52±1.34KNm-1 for the digital strain gauge system.
The plastic feet supplied with many scales have little effect on scale accuracy. The lever lengths, top plate coupling positions and base dimensions of analogue scales
show significant asymmetry; this does not appear to degrade scale accuracy. This investigation has provided an exhaustive probe into the mechanisms of analogue and digital strain gauge scales. Through a set of experiments which eliminate possible causes, the investigation has reached firm conclusions regarding the ways in which thick carpet affects the analogue scale mechanism. Follow-up investigations might test these conclusions further, or perhaps investigate the latest generation of piezoelectric scales. Scale manufacturers have already solved the problem through the introduction of the digital strain gauge system. This requires as little modification to the production line as possible, keeping costs down; the levers are retained, but the central mechanism is replaced by the strain gauge system which converts vertical deflection of the test beam directly into a weight reading. The beam is mounted at the centre of the scale base, where bending is small, and the base plates have been processed17 to increase their stiffness. Innovative coupling of the test bam and plate means that lateral movement of the plate is not erroneously converted into an excess weight. All of these factors combine to produce a system which is virtually immune to the effect of thick carpet, and which represents the best compromise between increase in accuracy and increase in cost. In conclusion, the effect of carpet on analogue scales has been found to be very substantial, identifying a real need to find a hard surface in order to use these scales. This will become less important as digital technology continues to reduce in price; analogue scales may soon be consigned to history as the strain gauge technology becomes similarly inexpensive to produce. The investigation has verified the manufacturers’ claim that strain gauge scales can be used on thick carpet without a significant loss in accuracy (though the loss in accuracy on foam suggests that they are perhaps not tolerant of every surface). Overall, the inexpensive digital strain gauge systems have performed so well in this investigation that it would be interesting to discover quite where the advantages lie in the new generation of piezoelectric scales. 17 Careful analysis of figure 2.10 reveals depressions in the base to either side of the test beam and around the edge of the scale. These depressions appear to be responsible for the increased stiffness.

References [1] http://www.howstuffworks.com/inside-scale.htm [2] http://howstuffworks.lycoszone.com/question626.htm [3] http://www.mathsyear2000.org/museum/floor3/gallery8/gal1_3p4.html [4] http://myweigh.com/PocketMiniScales.html [5] http://www.scalesexpress.com [6] http://www.pcb.com/tech_pres.html [7] http://www.mini-lathe.com/Measurement/Dial_indicators/Dial_indicators.htm [8] J. Johnson and K. Koffey. SENSORS, May 2000. (Published by AVANSTAR)