batagnspectroscopicsurvey-iii.anobservedlink...
TRANSCRIPT

arX
iv:1
609.
0862
5v1
[as
tro-
ph.G
A]
27
Sep
2016
MNRAS 000, 1–9 (2016) Preprint 29 September 2016 Compiled using MNRAS LATEX style file v3.0
BAT AGN Spectroscopic Survey-III. An observed link
between AGN Eddington ratio and narrow emission line
ratios
Kyuseok Oh1⋆, Kevin Schawinski1, Michael Koss1,11, Benny Trakhtenbrot1,12,
Isabella Lamperti1, Claudio Ricci2, Richard Mushotzky3, Sylvain Veilleux3,
Simon Berney1, D. Michael Crenshaw4, Neil Gehrels5, Fiona Harrison6,
Nicola Masetti7,8, Kurt T. Soto1, Daniel Stern9, Ezequiel Treister2, Yoshihiro Ueda101Institute for Astronomy, Department of Physics, ETH Zurich, Wolfgang-Pauli-Strasse 27, CH-8093 Zurich, Switzerland2Instituto de Astrofısica, Facultad de Fısica, Pontificia Universidad Catolica de Chile, Casilla 306, Santiago 22, Chile3Astronomy Department and Joint Space-Science Insitute, University of Maryland, College Park, MD, USA4Department of Physics and Astronomy, Georgia State University, Astronomy Offices, One Park Place South SE, Suite 700, Atlanta, GA 30303, USA5NASA Goddard Space Flight Center, Greenbelt, MD 20771, USA6Cahill Center for Astronomy and Astrophysics, California Institute of Technology, Pasadena, CA 91125, USA7INAF - Istituto di Astrofisica Spaziale e Fisica Cosmica di Bologna, via Gobetti 101, 40129 Bologna, Italy8Departamento de Ciencias Fısicas, Universidad Andres Bello, Fernandez Concha 700, Las Condes, Santiago, Chile9Jet Propulsion Laboratory, California Institute of Technology, 4800 Oak Grove Drive, MS 169-224, Pasadena, CA 91109, USA10Department of Astronomy, Kyoto University, Kyoto 606-8502, Japan11Ambizione fellow12Zwicky fellow
Accepted XXX. Received YYY; in original form ZZZ
ABSTRACT
We investigate the observed relationship between black hole mass (MBH), bolo-metric luminosity (Lbol), and Eddington ratio (λEdd) with optical emission lineratios ([N ii] λ6583/Hα, [S ii] λλ6716, 6731/Hα, [O i] λ6300/Hα, [O iii] λ5007/Hβ,[Ne iii] λ3869/Hβ, and He ii λ4686/Hβ) of hard X-ray-selected AGN from the BATAGN Spectroscopic Survey (BASS). We show that the [N ii] λ6583/Hα ratio exhibitsa significant correlation with λEdd (RPear = −0.44, p-value=3× 10⁻¹³, σ = 0.28 dex),and the correlation is not solely driven by MBH or Lbol. The observed correlation be-tween [N ii] λ6583/Hα ratio and MBH is stronger than the correlation with Lbol, butboth are weaker than the λEdd correlation. This implies that the large-scale narrowlines of AGN host galaxies carry information about the accretion state of the AGNcentral engine. We propose that the [N ii] λ6583/Hα is a useful indicator of Eddingtonratio with 0.6 dex of rms scatter, and that it can be used to measure λEdd and thusMBH from the measured Lbol, even for high redshift obscured AGN. We briefly dis-cuss possible physical mechanisms behind this correlation, such as the mass-metallicityrelation, X-ray heating, and radiatively driven outflows.
Key words: galaxies: active – galaxies: nuclei – quasars: general – black hole physics
1 INTRODUCTION
Nebular emission lines are a powerful tool for diagnos-ing the physical state of ionized gas and studying cen-tral nuclear activity. Optical emission line ratios can beused to discriminate between emission from the star for-mation in galaxies and harder radiation such as from
⋆ E-mail: [email protected]
the central nuclear activity around a supermassive blackholes (e.g., Baldwin et al. 1981; Veilleux & Osterbrock 1987;Kewley et al. 2001; Kauffmann et al. 2003). Compared tostar forming galaxies, active galactic nuclei (AGN) producegreater numbers of higher energy photons (e.g., UV and X-rays) and, therefore drive higher ratios of the collisionallyexcited forbidden lines compared to the photoionization-induced Balmer emission lines. Although such line ratiosprovide useful AGN diagnostics, even for obscured AGN
c© 2016 The Authors

2 K. Oh et al.
(Reyes et al. 2008; Yuan et al. 2016), they may not be effec-tive in selecting all heavily obscured AGN and/or AGN thatlack significant amounts of low density gas (Elvis et al. 1981;Iwasawa et al. 1993; Griffiths et al. 1995; Barger et al. 2001;Comastri et al. 2002; Rigby et al. 2006; Caccianiga et al.2007).
With the recent advent of hard X-ray (> 10 keV) fa-cilities, such as INTEGRAL (Winkler et al. 2003), Swift
(Gehrels et al. 2004) and NuSTAR (Harrison et al. 2013),it is now possible to study samples of AGN that are less bi-ased to obscuration and include even Compton thick sources(NH > 1024cm−2, Ricci et al. 2015; Koss et al. 2016). In par-ticular, the Burst Alert Telescope (BAT, Barthelmy et al.2005) on board the Swift satellite has been observing thesky in the 14-195 keV energy band since 2005, reaching sen-sitivities of 1.3×10⁻¹¹erg cm−2 s−1 over 90% of the sky. The70 month Swift-BAT all-sky hard X-ray survey1 detected1210 objects, of which 836 are AGN (Baumgartner et al.2013). While the BAT detection is relatively unabsorbed upto Compton thick levels (e.g., NH < 1024cm−2, Koss et al.2016) heavily Compton thick AGN (NH > 1025cm−2) aremissed by X-ray surveys but may sometimes be detected us-ing optical emission line diagnostics and strong [O iii] λ5007emission lines (e.g., Maiolino et al. 1998).
The relationship between Eddington ratio (λEdd ≡L/LEdd, where LEdd ≡ 1.3 × 1038MBH/M⊙) and the po-sition of AGN in emission-line diagrams is an importanttopic of study because of the difficulty in measuring blackhole mass (MBH) from velocity dispersion in high redshiftAGN. Kewley et al. (2006) investigated host properties ofnearby emission-line galaxies (0.04 < z < 0.1) from theSDSS. They found that the λEdd (inferred from L[OIII]/σ⋆
4,where σ⋆ is a stellar velocity dispersion) shows an increasewith φ, a measure of distance from the LINER regime inthe [O iii] λ5007/Hβ vs. [O i] λ6300/Hα diagram. Similarly,an SDSS study of unobscured AGN by Stern & Laor (2013)found a dependence of emission-line diagnostics on the λEdd.However, the estimation of λEdd and the introduced rela-tionship between the angle φ and L[OIII]/σ⋆
4 were both de-pendent on the strength of [O iii] λ5007. Also, the previousstudies did not take into account X-ray selection focusingon the large sample of optically selected AGN. Both highlyionized optical emission lines and X-rays are thought to be ameasure of the AGN bolometric luminosity. However, hardX-rays are less biased against dust obscuration and the con-tribution from star-forming activity than optical emissionlines.
The BAT AGN Spectroscopic Survey (BASS) Data Re-lease 1 (Koss et al., in submitted) compiled 642 optical spec-tra of nearby AGN (〈z〉 ∼ 0.05) from public surveys (SDSS,6dF; Abazajian et al. 2009; Jones et al. 2009; Alam et al.2015) and dedicated follow-up observations (e.g., from tele-scopes at the Kitt Peak, Gemini, Palomar, and SAAO obser-vatories). The data release provided emission line measure-ments as well as MBH and λEdd estimates for the majorityof obscured and un-obscured AGN (74%, 473/642), includ-ing 340 AGN with MBH measurements reported for the firsttime.
In this paper, we use the BASS measurements to in-
1 http://heasarc.gsfc.nasa.gov/docs/swift/results/bs70mon/
vestigate the observed relationship between black hole mass(MBH), bolometric luminosity (Lbol), and Eddington ratio(λEdd) with optical emission line ratios ([N ii] λ6583/Hα,[S ii] λλ6716, 6731/Hα, [O i] λ6300/Hα, [O iii] λ5007/Hβ,[Ne iii] λ3869/Hβ, and He ii λ4686/Hβ) for both obscuredand unobscured AGN.
We assume a cosmology with h = 0.70, ΩM = 0.30, andΩΛ = 0.70 throughout this work.
2 SAMPLE SELECTION, DATA, AND
MEASUREMENTS
In this section, we briefly summarize the measurement pro-cedures for optical emission lines,MBH, and λEdd. The BASSDR1 measured nebular emission line strengths by perform-ing a power-law fit with Gaussian components to model thecontinuum and emission lines. For unobscured AGN, twoGaussian components are allowed in the Hα and Hβ emis-sion line regions to account for both broad (FWHM > 1000km s−1) and narrow (FWHM < 1000 km s−1) compo-nents. When broad Hβ is detected, MBH is measured usingthe single-epoch method following Trakhtenbrot & Netzer(2012). If no broad Hβ is detected, MBH is measured basedon the line width and luminoisty of broad Hα (equation 9from Greene & Ho 2005). For obscured AGN, the estimationof MBH relies on the close correlations between MBH and thestellar velocity dispersion (σ⋆, e.g., Kormendy & Ho 2013).Stellar velocity dispersion is derived from the penalised pixelfitting method (pPXF, Cappellari & Emsellem 2004) by im-plementing a modified version of the masking procedure in-troduced for the analysis of SDSS DR7 (Abazajian et al.2009) galaxy spectra (the OSSY catalog2, Sarzi et al. 2006;Oh et al. 2011, 2015).
Since the obscuration mostly affect the estimation ofLbol for Compton thick AGN (NH > 1024cm−2), we es-timated Lbol from the intrinsic (i.e., absorption and k-corrected) 14-150 keV luminosities reported in Ricci et al.(2015) and Ricci et al. (in prep.), transforming them into14-195 keV luminosities assuming a power-law continuumwith a photon index of Gamma=1.9. After converting the14-195 keV luminosity to the intrinsic 2-10 keV luminositythe procedure described by following Rigby et al. (2009), wethen applied the median bolometric correction introduced byVasudevan et al. (2009). It is noteworthy to mention thatthe estimation of Lbol comes solely from hard X-ray band(14-195 keV) and its constant conversion factor (k = 8).We briefly discuss the effect of different Lbol estimationin Section 3. We then combined the measured MBH withthe Lbol to calculate λEdd (λEdd ≡ Lbol/LEdd) assumingLEdd ≡ 1.3× 1038(MBH/M⊙). For more details, refer to thefirst data release (Koss et al., in submitted).
We focus on the sub-sample of the 642 optical spectrafrom the BASS DR1. We consider only non-beamed AGN,which were selected by cross-matching the BASS sourceswith the Roma blazar catalog (BZCAT) v5.0 (Massaro et al.2009). We then restricted our samples to redshifts of 0.01 <z < 0.40 to have coverage of the Hβ and Hα region.Berney et al. (2015) investigated the effect of slit size for the
2 http://gem.yonsei.ac.kr/ossy/
MNRAS 000, 1–9 (2016)

BASS-III: Emission lines vs. Eddington ratio 3
Figure 1. Emission line diagnostic diagrams for the BASS sources with signal-to-noise (S/N) ratio > 3. Left: The [N ii] λ6583/Hα versus[O iii] λ5007/Hβ diagnostic diagram. Colour filled circles and triangles indicate type 1 AGNs (including type 1.9) and type 2 AGNs,respectively. The empirical star-formation curve obtained from Kauffmann et al. (2003) (dashed curve) and the theoretical maximumstarburst model of Kewley et al. (2001) (solid curve) are used. The solid-straight line is the empirical demarcation of Schawinski et al.(2007) distinguishing the Seyfert AGN from the LINERs. The Eddington ratio of BASS sources is shown with color-filled dots. Middle:The [S ii] λλ6716, 6731/Hα versus [O iii] λ5007/Hβ diagnostic diagram. Right: The [O i] λ6300/Hα versus [O iii] λ5007/Hβ diagnosticdiagram. Demarcation lines from Kewley et al. (2001, 2006) are used. In all panels we also show more than 180,000 SDSS emission-linegalaxies with filled contours chosen from the OSSY catalog (z < 0.2) with S/N > 3 for [N ii] λ6583, Hα, [O iii] λ5007, Hβ, [Sii] λ6716,[Sii] λ6731, and [Oi] λ6300.
Table 1. Bayesian linear regression fit.
line ratio N α β RMSD RPear(p-value) RPear,unobs(p-value) RPear,obs(p-value)(1) (2) (3) (4) (5) (6) (7) (8)
[N ii] λ6583/Hα 297 −0.42± 0.04 −0.19± 0.02 0.28 -0.44 (3× 10⁻¹³) -0.34 (0.00002) -0.28 (0.00128)[S ii] λλ6716, 6731/Hα 288 −0.48± 0.03 −0.11± 0.02 0.25 -0.29 (9× 10⁻⁷) -0.26 (0.00080) 0.11 (0.56180)[O i] λ6300/Hα 205 · · · · · · · · · (0.03314) (0.02777) (0.36499)[O iii] λ5007/Hβ 286 · · · · · · · · · (0.32877) (0.38456) (0.34875)[Ne iii] λ3869/Hβ 125 · · · · · · · · · (0.87141) (0.38163) (0.78629)He ii λ4686/Hβ 107 · · · · · · · · · (0.87516) (0.56490) (0.08583)
Note. (1) optical emission line ratio; (2) size of sample; (3) intercept; (4) slope; (5) rms deviation; (6) Pearson R coefficientand p-value; (7) Pearson R coefficient and p-value for unobscured AGN; (8) Pearson R coefficient and p-value for obscuredAGN.
BASS DR1 sources and showed that the ratio between ex-tinction corrected L[O iii] and L14−195keV is constant whenexcluding the nearest galaxies (z < 0.01) while the scatterslightly decreases towards larger slit sizes. We used the sameredshift range following this approach. However, it should benoted that aperture effect does not change our results shownin Section 3. We tested whether sources with large physicalcoverage (> 2 kpc) still found a significant correlation in asmaller sample size suggesting that slit size is not impor-tant for this study. We also selected only spectral fits witha good quality as listed in the DR1 tables (Koss et al., insubmitted). We note that sources with spectra taken fromthe 6dF Galaxy Survey (Jones et al. 2009) are only used toderive emission line ratios and to measure stellar velocity dis-persions (e.g., Campbell et al. 2014) due to the lack of fluxcalibration as necessary for broad line black hole mass mea-surements. Samples sizes for each emission line ratio used inthis paper are listed in Table 1.
3 RELATIONS BETWEEN OPTICAL
EMISSION LINE RATIOS AND BASIC AGN
PROPERTIES
Fig. 1 shows the emission-line diagnostic diagrams for theBASS sources according to λEdd (colour-coded). The major-ity of the BASS sources (> 90%) are found in the Seyfertregion in each panel.
In order to study the statistical significance of any cor-relations with λEdd, we show optical emission line ratios asa function of λEdd in Fig. 2. We performed Bayesian linearregression fit (equation 1) to all points using the methodof Kelly (2007) which accounts for measurement errors inboth axes. The relation between λEdd and optical emissionline ratio (black solid line in Fig. 2) is determined by tak-ing the median of 10,000 draws from the posterior probabil-ity distribution of the converged parameters (intercept andslope). The errors of intercept and slope are reported from
MNRAS 000, 1–9 (2016)
4 K. Oh et al.
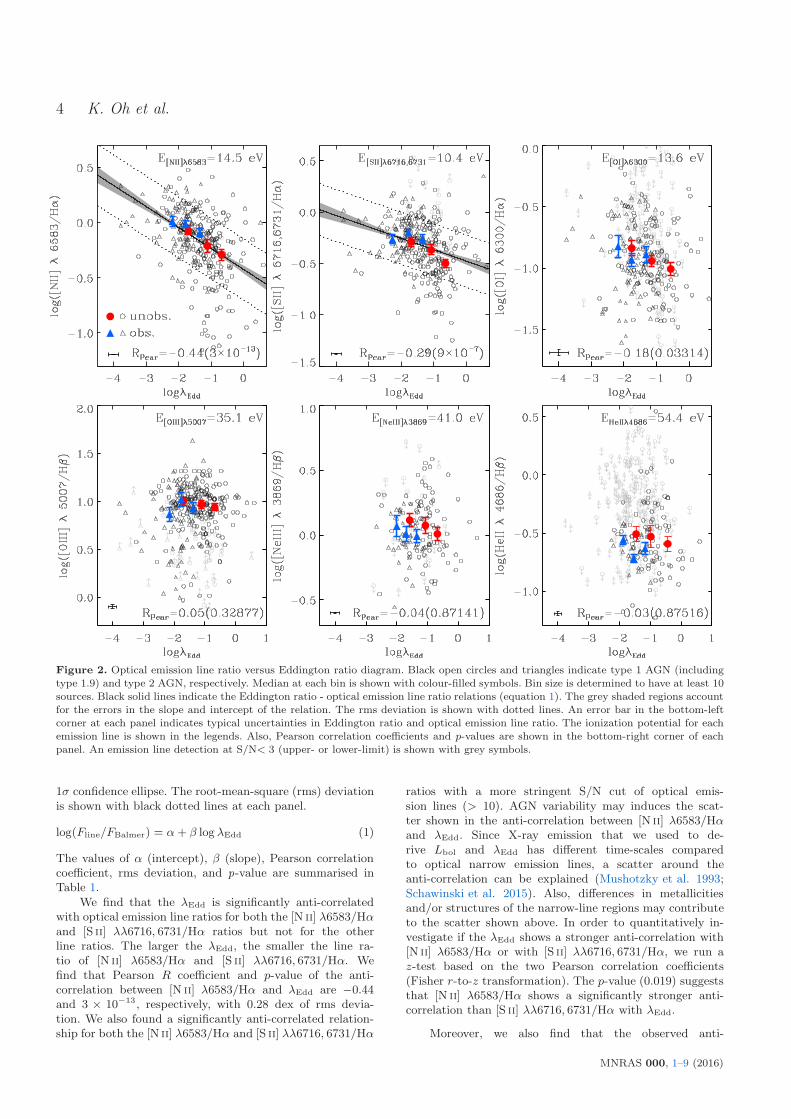
Figure 2. Optical emission line ratio versus Eddington ratio diagram. Black open circles and triangles indicate type 1 AGN (includingtype 1.9) and type 2 AGN, respectively. Median at each bin is shown with colour-filled symbols. Bin size is determined to have at least 10sources. Black solid lines indicate the Eddington ratio - optical emission line ratio relations (equation 1). The grey shaded regions accountfor the errors in the slope and intercept of the relation. The rms deviation is shown with dotted lines. An error bar in the bottom-leftcorner at each panel indicates typical uncertainties in Eddington ratio and optical emission line ratio. The ionization potential for eachemission line is shown in the legends. Also, Pearson correlation coefficients and p-values are shown in the bottom-right corner of eachpanel. An emission line detection at S/N< 3 (upper- or lower-limit) is shown with grey symbols.
1σ confidence ellipse. The root-mean-square (rms) deviationis shown with black dotted lines at each panel.
log(Fline/FBalmer) = α+ β log λEdd (1)
The values of α (intercept), β (slope), Pearson correlationcoefficient, rms deviation, and p-value are summarised inTable 1.
We find that the λEdd is significantly anti-correlatedwith optical emission line ratios for both the [N ii] λ6583/Hαand [S ii] λλ6716, 6731/Hα ratios but not for the otherline ratios. The larger the λEdd, the smaller the line ra-tio of [N ii] λ6583/Hα and [S ii] λλ6716, 6731/Hα. Wefind that Pearson R coefficient and p-value of the anti-correlation between [N ii] λ6583/Hα and λEdd are −0.44and 3 × 10⁻¹³, respectively, with 0.28 dex of rms devia-tion. We also found a significantly anti-correlated relation-ship for both the [N ii] λ6583/Hα and [S ii] λλ6716, 6731/Hα
ratios with a more stringent S/N cut of optical emis-sion lines (> 10). AGN variability may induces the scat-ter shown in the anti-correlation between [N ii] λ6583/Hαand λEdd. Since X-ray emission that we used to de-rive Lbol and λEdd has different time-scales comparedto optical narrow emission lines, a scatter around theanti-correlation can be explained (Mushotzky et al. 1993;Schawinski et al. 2015). Also, differences in metallicitiesand/or structures of the narrow-line regions may contributeto the scatter shown above. In order to quantitatively in-vestigate if the λEdd shows a stronger anti-correlation with[N ii] λ6583/Hα or with [S ii] λλ6716, 6731/Hα, we run az-test based on the two Pearson correlation coefficients(Fisher r-to-z transformation). The p-value (0.019) suggeststhat [N ii] λ6583/Hα shows a significantly stronger anti-correlation than [S ii] λλ6716, 6731/Hα with λEdd.
Moreover, we also find that the observed anti-
MNRAS 000, 1–9 (2016)
BASS-III: Emission lines vs. Eddington ratio 5
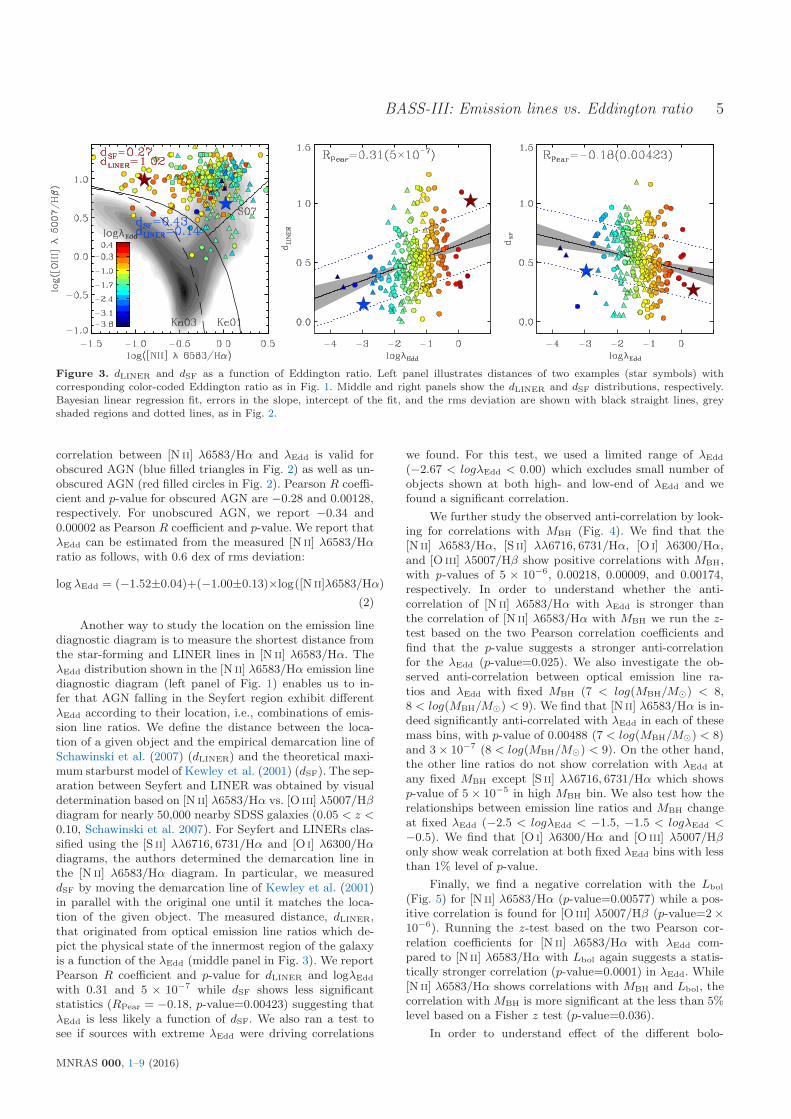
Figure 3. dLINER and dSF as a function of Eddington ratio. Left panel illustrates distances of two examples (star symbols) withcorresponding color-coded Eddington ratio as in Fig. 1. Middle and right panels show the dLINER and dSF distributions, respectively.Bayesian linear regression fit, errors in the slope, intercept of the fit, and the rms deviation are shown with black straight lines, greyshaded regions and dotted lines, as in Fig. 2.
correlation between [N ii] λ6583/Hα and λEdd is valid forobscured AGN (blue filled triangles in Fig. 2) as well as un-obscured AGN (red filled circles in Fig. 2). Pearson R coeffi-cient and p-value for obscured AGN are −0.28 and 0.00128,respectively. For unobscured AGN, we report −0.34 and0.00002 as Pearson R coefficient and p-value. We report thatλEdd can be estimated from the measured [N ii] λ6583/Hαratio as follows, with 0.6 dex of rms deviation:
log λEdd = (−1.52±0.04)+(−1.00±0.13)×log([N ii]λ6583/Hα)
(2)
Another way to study the location on the emission linediagnostic diagram is to measure the shortest distance fromthe star-forming and LINER lines in [N ii] λ6583/Hα. TheλEdd distribution shown in the [N ii] λ6583/Hα emission linediagnostic diagram (left panel of Fig. 1) enables us to in-fer that AGN falling in the Seyfert region exhibit differentλEdd according to their location, i.e., combinations of emis-sion line ratios. We define the distance between the loca-tion of a given object and the empirical demarcation line ofSchawinski et al. (2007) (dLINER) and the theoretical maxi-mum starburst model of Kewley et al. (2001) (dSF). The sep-aration between Seyfert and LINER was obtained by visualdetermination based on [N ii] λ6583/Hα vs. [O iii] λ5007/Hβdiagram for nearly 50,000 nearby SDSS galaxies (0.05 < z <0.10, Schawinski et al. 2007). For Seyfert and LINERs clas-sified using the [S ii] λλ6716, 6731/Hα and [O i] λ6300/Hαdiagrams, the authors determined the demarcation line inthe [N ii] λ6583/Hα diagram. In particular, we measureddSF by moving the demarcation line of Kewley et al. (2001)in parallel with the original one until it matches the loca-tion of the given object. The measured distance, dLINER,that originated from optical emission line ratios which de-pict the physical state of the innermost region of the galaxyis a function of the λEdd (middle panel in Fig. 3). We reportPearson R coefficient and p-value for dLINER and logλEdd
with 0.31 and 5 × 10⁻⁷ while dSF shows less significantstatistics (RPear = −0.18, p-value=0.00423) suggesting thatλEdd is less likely a function of dSF. We also ran a test tosee if sources with extreme λEdd were driving correlations
we found. For this test, we used a limited range of λEdd
(−2.67 < logλEdd < 0.00) which excludes small number ofobjects shown at both high- and low-end of λEdd and wefound a significant correlation.
We further study the observed anti-correlation by look-ing for correlations with MBH (Fig. 4). We find that the[N ii] λ6583/Hα, [S ii] λλ6716, 6731/Hα, [O i] λ6300/Hα,and [O iii] λ5007/Hβ show positive correlations with MBH,with p-values of 5 × 10⁻⁶, 0.00218, 0.00009, and 0.00174,respectively. In order to understand whether the anti-correlation of [N ii] λ6583/Hα with λEdd is stronger thanthe correlation of [N ii] λ6583/Hα with MBH we run the z-test based on the two Pearson correlation coefficients andfind that the p-value suggests a stronger anti-correlationfor the λEdd (p-value=0.025). We also investigate the ob-served anti-correlation between optical emission line ra-tios and λEdd with fixed MBH (7 < log(MBH/M⊙) < 8,8 < log(MBH/M⊙) < 9). We find that [N ii] λ6583/Hα is in-deed significantly anti-correlated with λEdd in each of thesemass bins, with p-value of 0.00488 (7 < log(MBH/M⊙) < 8)and 3× 10⁻⁷ (8 < log(MBH/M⊙) < 9). On the other hand,the other line ratios do not show correlation with λEdd atany fixed MBH except [S ii] λλ6716, 6731/Hα which showsp-value of 5× 10⁻⁵ in high MBH bin. We also test how therelationships between emission line ratios and MBH changeat fixed λEdd (−2.5 < logλEdd < −1.5, −1.5 < logλEdd <−0.5). We find that [O i] λ6300/Hα and [O iii] λ5007/Hβonly show weak correlation at both fixed λEdd bins with lessthan 1% level of p-value.
Finally, we find a negative correlation with the Lbol
(Fig. 5) for [N ii] λ6583/Hα (p-value=0.00577) while a pos-itive correlation is found for [O iii] λ5007/Hβ (p-value=2×10⁻⁶). Running the z-test based on the two Pearson cor-relation coefficients for [N ii] λ6583/Hα with λEdd com-pared to [N ii] λ6583/Hα with Lbol again suggests a statis-tically stronger correlation (p-value=0.0001) in λEdd. While[N ii] λ6583/Hα shows correlations with MBH and Lbol, thecorrelation with MBH is more significant at the less than 5%level based on a Fisher z test (p-value=0.036).
In order to understand effect of the different bolo-
MNRAS 000, 1–9 (2016)

6 K. Oh et al.
metric correction, we estimate Lbol and λEdd followingMarconi et al. (2004) who uses bolometric correction thatdepends on 2-10 keV luminosity (equation 21 in their pa-per). The mean difference between the newly estimated Lbol
and the one derived by our prescription is 0.03 dex with 0.33dex of scatter, which gives a mean difference in λEdd of 0.03dex (0.33 dex of scatter). We find that [N ii] λ6583/Hα (p-value=10−12) and [S ii] λλ6716, 6731/Hα (p-value=1×10⁻⁶)show significant anti-correlation with λEdd.
If we adopt more steep bolometric correction curvethat varies with 2-10 keV luminosity (see Figure 3 inMarconi et al. 2004) covering wide range of bolometric cor-rection, we may get flattened relationship in [N ii] λ6583/Hαand λEdd as sources in low λEdd and high λEdd move to-ward each end. However, we find that the application ofsuch extreme case of bolometric correction does not signifi-cantly change the Pearson R coefficient (−0.43) and p-value(10−12) but shows slightly moderate slope (−0.10± 0.01).
4 DISCUSSION
We have presented the observed relationship between theλEdd and optical emission line ratios ([N ii] λ6583/Hα,[S ii] λλ6716, 6731/Hα, [O i] λ6300/Hα, [O iii] λ5007/Hβ,[Ne iii] λ3869/Hβ, and He ii λ4686/Hβ) using local obscuredand unobscured AGN (〈z〉 = 0.05, z < 0.40) from the 70-month Swift-BAT all-sky hard X-ray survey with follow-upoptical spectroscopy. We show that there is a significant anti-correlation between [N ii] λ6583/Hα emission line ratio andλEdd, and this correlation is stronger than trends with MBH
or Lbol or with other line ratios. The observed trend suggeststhat optical emission line ratios, which are widely used toclassify sources as AGN, can also be an indicator of λEdd.The use of [N ii] λ6583 and Hα emission lines as a λEdd in-dicator has potential implications for high redshift obscuredAGN whose MBH and λEdd are difficult to estimate. Thiswould require to additionally assume that any relevant phys-ical relations that might affect our λEdd - [N ii] λ6583/Hαrelation (e.g., the stellar mass-metallicity, AGN outflows),do not evolve significantly with redshift. The relationshipshown in this work may serve as a basis for future studiestoward measuring MBH and λEdd of individual AGN.
A number of complications arise when measuring Lbol
and MBH from a large (N > 100) sample of galaxies. Themajority of the total luminosity is emitted from the accretiondisk in the extreme ultraviolet and ultraviolet energy bands(Shields 1978; Malkan & Sargent 1982; Mathews & Ferland1987). While we used a fixed bolometric correction fromthe X-ray, this correction has been observed to vary de-pending on λEdd (Vasudevan et al. 2009) and Lbol (e.g.,Just et al. 2007; Green et al. 2009). This issue deserves fur-ther study, though we would expect any biases to affect allline ratios whereas we find a much stronger correlation with[N ii] λ6583/Hα. Another complication is the use of sep-arate methods of BH mass estimates. We note, however,that these two methods are tied to reproduce similar massesfor systems where both are applicable (Graham et al. 2011;Woo et al. 2013), and that we find significant correlationsfor both type 1 and type 2 AGN, separately (Table 1). Wewill explore MBH measurements for both types of AGN viadifferent methods in a future study.
There are several possible physical mechanisms thatmight lead to the trends found between λEdd and emis-sion line ratios such as [N ii] λ6583/Hα. Groves et al. (2006)and Stern & Laor (2013) found a dependence of emission-line diagnostics, particularly of the [N ii] λ6583/Hα, withhost galaxy stellar mass. They postulated that thiswas a result of the mass metallicity relationship withmore massive galaxies having more metals (Lequeux et al.1979; Tremonti et al. 2004; Erb et al. 2006; Lee et al. 2006;Ellison et al. 2008; Maiolino et al. 2008; Mannucci et al.2010; Lara-Lopez et al. 2010). As more massive galaxieshave more massive black holes, this follows the correlationfound here with [N ii] λ6583/Hα being positively correlatedwithMBH and negatively correlated with Lbol. Stern & Laor(2013) showed that [O iii] λ5007/Hβ mildly decreases withstellar mass since reduced [O iii] λ5007 emission is expectedfrom higher metallicity and massive systems as [O iii] λ5007is a main coolant and the temperature will be lower inmassive systems. The less significant correlation between[O iii] λ5007/Hβ and MBH shown in Fig. 4 as compared tothe [N ii] λ6583/Hα which scales strongly with metallicitycan be explained in this context. Another interesting possi-bility affecting this correlation could be from higher λEdd
AGN have relatively weaker [O iii] λ5007 lines, as foundby the “Eigenvector 1” relationships (e.g., Boroson & Green1992).
A further possibility is that X-ray heating is inducingsome of the negative correlation found between Lbol and the[N ii] λ6583/Hα ratio. Ionizing ultraviolet photons producea highly ionized zone on the illuminated face of the gas cloudwhile deeper in the cloud penetrating X-rays heat the gasand maintain an extended partially ionized region. Higherenergy photons such as Lyα are destroyed by multiple scat-terings ending in collisional excitation which enhances theBalmer lines (Weisheit et al. 1981; Krolik & Kallman 1983;Maloney et al. 1996). Strong X-rays (i.e., harder SEDs) thatheat up hot electrons in partially ionized region also enhancecollisional excitation of O0, N+, and S+. As a result, it is ex-pected to see high [N ii] λ6583/Hα, [S ii] λλ6716, 6731/Hα,and [O i] λ6300/Hα.
Alternatively, the observed anti-correlation be-tween emission line ratios ([N ii] λ6583/Hα and[S ii] λλ6716, 6731/Hα) and λEdd may be due to ra-diatively driven outflows in high λEdd systems. Radiativelyaccelerated wind is predicted to be proportional to λEdd
(Shlosman et al. 1985; Arav et al. 1994; Murray et al.1995; Hamann 1998; Proga et al. 2000; Chelouche & Netzer2001). This is consistent with the observed blueshift ofbroad as well as narrow absorption lines (Misawa et al.2007) often seen in quasars. In the context of a prevalentoutflow in high λEdd AGN, the optical-UV SED of theaccretion disk is expected to be softer when λEdd is & 0.3(King & Pounds 2003; Pounds et al. 2003; Reeves et al.2003; Tombesi et al. 2010, 2011; Slone & Netzer 2012;Veilleux et al. 2016; Woo et al. 2016). As hot accreting gasis removed by ejecting outflows, the formation of collision-ally excited emission lines is expected to be suppressed. Itis important to note, however, that the anti-correlation be-tween optical emission line ratio and λEdd is only appearedin [N ii] λ6583/Hα and [S ii] λλ6716, 6731/Hα but not inother line ratios.
MNRAS 000, 1–9 (2016)

BASS-III: Emission lines vs. Eddington ratio 7
Figure 4. Optical emission line ratio versus black hole mass. The format is the same as that of Fig. 2
Figure 5. Optical emission line ratio versus bolometric luminosity. The format is the same as that of Fig. 2
MNRAS 000, 1–9 (2016)

8 K. Oh et al.
5 SUMMARY
We present observed correlations between AGN Eddingtonratio (λEdd), black hole mass (MBH), and bolomet-ric luminosity (Lbol) and narrow emission line ratios([N ii] λ6583/Hα, [S ii] λλ6716, 6731/Hα, [O i] λ6300/Hα,[O iii] λ5007/Hβ, [Ne iii] λ3869/Hβ, and He ii λ4686/Hβ)for hard X-ray selected AGN from the BASS. The resultsof this study are:
• λEdd is anti-correlated with both the [N ii] λ6583/Hαand [S ii] λλ6716, 6731/Hα ratios, but not with other lineratios.
• [N ii] λ6583/Hα exhibits a significantly stronger anti-correlation with λEdd than [S ii] λλ6716, 6731/Hα.
• The correlation shown in [N ii] λ6583/Hα with MBH ismore significant than with Lbol.
• The correlation appeared in [N ii] λ6583/Hα with MBH
might be a result of the mass metallicity relationship.• The observed relationship between λEdd and
[N ii] λ6583/Hα ratio could be explained by consider-ing X-ray heating processes and removal of material due toenergetic outflow in the high λEdd state.
• The [N ii] λ6583/Hα ratio could in principle be used tomeasure accretion efficiencies and black hole masses of highredshift obscured AGN (equation 2).
ACKNOWLEDGEMENTS
K.O. and K.S. acknowledge support from the Swiss Na-tional Science Foundation (SNSF) through Project grant200021 157021. M. K. acknowledges support from the SNSFthrough the Ambizione fellowship grant PZ00P2 154799/1.M.K. and K. S. acknowledge support from SNFS Pro-fessorship grant PP00P2 138979/1. C.R. acknowledges fi-nancial support from the CONICYT-Chile “EMBIGGEN”Anillo (grant ACT1101), FONDECYT 1141218 and Basal-CATA PFB–06/2007. E.T. acknowledges support from theCONICYT-Chile “EMBIGGEN” Anillo (grant ACT1101),FONDECYT 1160999 and Basal-CATA PFB–06/2007. Thework of DS was carried out at the Jet Propulsion Labo-ratory, California Institute of Technology, under a contractwith NASA. This research has made use of NASA’s ADSService.
Facilities: Swift, UH:2.2m, SDSS, KPNO:2.1m,FLWO:1.5m (FAST), Shane (Kast Double spectrograph),CTIO:1.5m, Hale, Gemini:South, Gemini:North, Rad-cliffe,Perkins
REFERENCES
Abazajian K. N., et al., 2009, ApJS, 182, 543Alam S., et al., 2015, ApJS, 219, 12Arav N., Li Z.-Y., Begelman M. C., 1994, ApJ, 432, 62Baldwin J. A., Phillips M. M., Terlevich R., 1981, PASP, 93, 5Barger A. J., Cowie L. L., Mushotzky R. F., Richards E. A., 2001,
AJ, 121, 662
Barthelmy S. D., et al., 2005, Space Sci. Rev., 120, 143Baumgartner W. H., Tueller J., Markwardt C. B., Skinner G. K.,
Barthelmy S., Mushotzky R. F., Evans P. A., Gehrels N., 2013,ApJS, 207, 19
Berney S., et al., 2015, MNRAS, 454, 3622
Boroson T. A., Green R. F., 1992, ApJS, 80, 109
Caccianiga A., Severgnini P., Della Ceca R., Maccacaro T., Car-rera F. J., Page M. J., 2007, A&A, 470, 557
Campbell L. A., et al., 2014, MNRAS, 443, 1231
Cappellari M., Emsellem E., 2004, PASP, 116, 138Chelouche D., Netzer H., 2001, MNRAS, 326, 916
Comastri A., et al., 2002, ApJ, 571, 771
Ellison S. L., Patton D. R., Simard L., McConnachie A. W., 2008,ApJ, 672, L107
Elvis M., Schreier E. J., Tonry J., Davis M., Huchra J. P., 1981,ApJ, 246, 20
Erb D. K., Shapley A. E., Pettini M., Steidel C. C., Reddy N. A.,Adelberger K. L., 2006, ApJ, 644, 813
Gehrels N., et al., 2004, ApJ, 611, 1005
Graham A. W., Onken C. A., Athanassoula E., Combes F., 2011,MNRAS, 412, 2211
Green P. J., et al., 2009, ApJ, 690, 644
Greene J. E., Ho L. C., 2005, ApJ, 630, 122
Griffiths R. E., Georgantopoulos I., Boyle B. J., Stewart G. C.,Shanks T., della Ceca R., 1995, MNRAS, 275, 77
Groves B. A., Heckman T. M., Kauffmann G., 2006, MNRAS,371, 1559
Hamann F., 1998, ApJ, 500, 798Harrison F. A., et al., 2013, ApJ, 770, 103
Iwasawa K., Koyama K., Awaki H., Kunieda H., Makishima K.,Tsuru T., Ohashi T., Nakai N., 1993, ApJ, 409, 155
Jones D. H., et al., 2009, MNRAS, 399, 683Just D. W., Brandt W. N., Shemmer O., Steffen A. T., Schneider
D. P., Chartas G., Garmire G. P., 2007, ApJ, 665, 1004
Kauffmann G., et al., 2003, MNRAS, 346, 1055Kelly B. C., 2007, ApJ, 665, 1489
Kewley L. J., Dopita M. A., Sutherland R. S., Heisler C. A.,Trevena J., 2001, ApJ, 556, 121
Kewley L. J., Groves B., Kauffmann G., Heckman T., 2006,MNRAS, 372, 961
King A. R., Pounds K. A., 2003, MNRAS, 345, 657
Kormendy J., Ho L. C., 2013, ARA&A, 51, 511Koss M. J., et al., 2016, ApJ, 825, 85
Krolik J. H., Kallman T. R., 1983, ApJ, 267, 610Lara-Lopez M. A., et al., 2010, A&A, 521, L53
Lee H., Skillman E. D., Cannon J. M., Jackson D. C., Gehrz R. D.,Polomski E. F., Woodward C. E., 2006, ApJ, 647, 970
Lequeux J., Peimbert M., Rayo J. F., Serrano A., Torres-PeimbertS., 1979, A&A, 80, 155
Maiolino R., Salvati M., Bassani L., Dadina M., della Ceca R.,Matt G., Risaliti G., Zamorani G., 1998, A&A, 338, 781
Maiolino R., et al., 2008, A&A, 488, 463Malkan M. A., Sargent W. L. W., 1982, ApJ, 254, 22
Maloney P. R., Hollenbach D. J., Tielens A. G. G. M., 1996, ApJ,466, 561
Mannucci F., Cresci G., Maiolino R., Marconi A., Gnerucci A.,2010, MNRAS, 408, 2115
Marconi A., Risaliti G., Gilli R., Hunt L. K., Maiolino R., SalvatiM., 2004, MNRAS, 351, 169
Massaro E., Giommi P., Leto C., Marchegiani P., Maselli A., PerriM., Piranomonte S., Sclavi S., 2009, A&A, 495, 691
Mathews W. G., Ferland G. J., 1987, ApJ, 323, 456
Misawa T., Charlton J. C., Eracleous M., Ganguly R., Tytler D.,Kirkman D., Suzuki N., Lubin D., 2007, ApJS, 171, 1
Murray N., Chiang J., Grossman S. A., Voit G. M., 1995, ApJ,
451, 498Mushotzky R. F., Done C., Pounds K. A., 1993, ARA&A, 31, 717
Oh K., Sarzi M., Schawinski K., Yi S. K., 2011, ApJS, 195, 13Oh K., Yi S. K., Schawinski K., Koss M., Trakhtenbrot B., Soto
K., 2015, ApJS, 219, 1
Pounds K. A., King A. R., Page K. L., O’Brien P. T., 2003,MNRAS, 346, 1025
MNRAS 000, 1–9 (2016)

BASS-III: Emission lines vs. Eddington ratio 9
Proga D., Stone J. M., Kallman T. R., 2000, ApJ, 543, 686
Reeves J. N., O’Brien P. T., Ward M. J., 2003, ApJ, 593, L65Reyes R., et al., 2008, AJ, 136, 2373Ricci C., Ueda Y., Koss M. J., Trakhtenbrot B., Bauer F. E.,
Gandhi P., 2015, ApJ, 815, L13Rigby J. R., Rieke G. H., Donley J. L., Alonso-Herrero A., Perez-
Gonzalez P. G., 2006, ApJ, 645, 115Rigby J. R., Diamond-Stanic A. M., Aniano G., 2009, ApJ,
700, 1878Sarzi M., et al., 2006, MNRAS, 366, 1151Schawinski K., Thomas D., Sarzi M., Maraston C., Kaviraj S.,
Joo S.-J., Yi S. K., Silk J., 2007, MNRAS, 382, 1415Schawinski K., Koss M., Berney S., Sartori L. F., 2015, MNRAS,
451, 2517Shields G. A., 1978, Nature, 272, 706Shlosman I., Vitello P. A., Shaviv G., 1985, ApJ, 294, 96Slone O., Netzer H., 2012, MNRAS, 426, 656Stern J., Laor A., 2013, MNRAS, 431, 836Tombesi F., Cappi M., Reeves J. N., Palumbo G. G. C., Yaqoob
T., Braito V., Dadina M., 2010, A&A, 521, A57Tombesi F., Cappi M., Reeves J. N., Palumbo G. G. C., Braito
V., Dadina M., 2011, ApJ, 742, 44Trakhtenbrot B., Netzer H., 2012, MNRAS, 427, 3081Tremonti C. A., et al., 2004, ApJ, 613, 898Vasudevan R. V., Mushotzky R. F., Winter L. M., Fabian A. C.,
2009, MNRAS, 399, 1553Veilleux S., Osterbrock D. E., 1987, ApJS, 63, 295Veilleux S., Melendez M., Tripp T. M., Hamann F., Rupke
D. S. N., 2016, ApJ, 825, 42Weisheit J. C., Tarter C. B., Shields G. A., 1981, ApJ, 245, 406Winkler C., et al., 2003, A&A, 411, L1Woo J.-H., Schulze A., Park D., Kang W.-R., Kim S. C., Riechers
D. A., 2013, ApJ, 772, 49Woo J.-H., Bae H.-J., Son D., Karouzos M., 2016, ApJ, 817, 108Yuan S., Strauss M. A., Zakamska N. L., 2016, MNRAS, 462, 1603
This paper has been typeset from a TEX/LATEX file prepared bythe author.
MNRAS 000, 1–9 (2016)