basic verification concepts...miscellaneous issues • in order to be verified, forecasts must be...
TRANSCRIPT

Basic Verification Concepts
Tressa L. Fowler
National Center for Atmospheric ResearchBoulder Colorado USA

Basic concepts - outline
• What is verification?• Why verify?• Identifying verification goals• Forecast “goodness”• Designing a verification study• Types of forecasts and observations• Matching forecasts and observations• Verification attributes• Miscellaneous issues• Questions to ponder: Who? What? When? Where? Which?
Why?
2Copyright 2015, University Corporation for Atmospheric Research, all rights reserved
How do you do verification?
• Using MET is the easy part, scientifically speaking.
• Good verification depends mostly on what you do before and after MET.– What do you want to know?– Good forecasts.– Good observations.– Well matched.– Appropriate selection of
methods– Thorough and correct
interpretation of results.
3Copyright 2015, University Corporation for Atmospheric Research, all rights reserved

What is verification?
• Verification is the process of comparing forecasts to relevant observations– Verification is one aspect of measuring forecast goodness
• Verification measures the quality of forecasts (as opposed to their value)
• For many purposes a more appropriate term is “evaluation”
4Copyright 2015, University Corporation for Atmospheric Research, all rights reserved

Why verify?
• Purposes of verification (traditional definition)
– Administrative purpose• Monitoring performance• Choice of model or model configuration
(has the model improved?)
– Scientific purpose• Identifying and correcting model flaws• Forecast improvement
– Economic purpose• Improved decision making• “Feeding” decision models or decision support systems
5Copyright 2015, University Corporation for Atmospheric Research, all rights reserved
Why verify?
• What are some other reasons to verifyweather forecasts?– Help operational forecasters understand model
biases and select models for use in different conditions
– Help “users” interpret forecasts (e.g., “What does a temperature forecast of 0 degrees really mean?”)
– Identify forecast weaknesses, strengths, differences
6Copyright 2015, University Corporation for Atmospheric Research, all rights reserved

Identifying verification goals
What questions do we want to answer?• Examples:
üIn what locations does the model have the best performance?
üAre there regimes in which the forecasts are better or worse?
üIs the probability forecast well calibrated (i.e., reliable)?
üDo the forecasts correctly capture the natural variability of the weather?
Other examples?
7Copyright 2015, University Corporation for Atmospheric Research, all rights reserved

Identifying verification goals (cont.)
• What forecast performance attribute should be measured?• Related to the question as well as the type of forecast
and observation
• Choices of verification statistics, measures, graphics• Should match the type of forecast and the attribute
of interest• Should measure the quantity of interest (i.e., the
quantity represented in the question)
8Copyright 2015, University Corporation for Atmospheric Research, all rights reserved

Forecast “goodness”
• Depends on the quality of the forecast
AND
• The user and his/her application of the forecast information
9Copyright 2015, University Corporation for Atmospheric Research, all rights reserved

Good forecast or bad forecast?
F O
10Copyright 2015, University Corporation for Atmospheric Research, all rights reserved

Good forecast or Bad forecast?
F OIf I’m a water manager for this watershed, it’s a
pretty bad forecast…
11Copyright 2015, University Corporation for Atmospheric Research, all rights reserved

Good forecast or Bad forecast?
If I’m an aviation traffic strategic planner…It might be a pretty good forecast
OA B
OFFlight Route
Different users have different ideas about
what makes a forecast good
Different verification approaches can measure different types of
“goodness”12Copyright 2015, University Corporation for Atmospheric Research,
all rights reserved

Forecast “goodness”• Forecast quality is only one aspect of forecast “goodness”
• Forecast value is related to forecast quality through complex, non-linear relationships– In some cases, improvements in forecast quality (according to certain measures)
may result in a degradation in forecast value for some users!
• However - Some approaches to measuring forecast quality can help understand goodness– Examples
ü Diagnostic verification approaches
ü New features-based approaches
ü Use of multiple measures to represent more than one attribute of forecast performance
ü Examination of multiple thresholds
13Copyright 2015, University Corporation for Atmospheric Research, all rights reserved

Basic guide for developing verification studies
Consider the users…– … of the forecasts– … of the verification information
• What aspects of forecast quality are of interest for the user?– Typically (always?) need to consider multiple aspects
Develop verification questions to evaluate those aspects/attributes
• Exercise: What verification questions and attributes would be of interest to …– … operators of an electric utility?– … a city emergency manager?– … a mesoscale model developer?– … aviation planners?
14Copyright 2015, University Corporation for Atmospheric Research, all rights reserved

Basic guide for developing verification studies
Identify observations that represent the event being forecast, including the
– Element (e.g., temperature, precipitation)– Temporal resolution
– Spatial resolution and representation
– Thresholds, categories, etc.
15Copyright 2015, University Corporation for Atmospheric Research, all rights reserved

Observations are not truth• We can’t know the complete “truth”.• Observations generally are more “true” than a
model analysis (at least they are relatively more independent)
• Observational uncertainty should be taken into account in whatever way possible üIn other words, how well do adjacent observations
match each other?
16Copyright 2015, University Corporation for Atmospheric Research, all rights reserved

Observations might be garbage if
• Not Independent (of forecast or each other)• Biased
– Space– Time– Instrument– Sampling– Reporting
• Measurement errors• Not enough of them
17Copyright 2015, University Corporation for Atmospheric Research, all rights reserved

Basic guide for developing verification studies
Identify multiple verification attributes that can provide answers to the questions of interest
Select measures and graphics that appropriately measure and represent the attributes of interest
Identify a standard of comparison that provides a reference level of skill (e.g., persistence, climatology, old model)
18Copyright 2015, University Corporation for Atmospheric Research, all rights reserved

Types of forecasts, observations• Continuous
– Temperature– Rainfall amount– 500 mb height
• Categorical– Dichotomous
ü Rain vs. no rainü Strong winds vs. no strong windü Night frost vs. no frostü Often formulated as Yes/No
– Multi-categoryü Cloud amount categoryü Precipitation type
– May result from subsetting continuous variables into categoriesü Ex: Temperature categories of 0-10, 11-20, 21-30, etc.
19Copyright 2015, University Corporation for Atmospheric Research, all rights reserved

Types of forecasts, observations• Probabilistic
– Observation can be dichotomous, multi-category, or continuousl Precipitation occurrence – Dichotomous (Yes/No)l Precipitation type – Multi-categoryl Temperature distribution - Continuous
– Forecast can be l Single probability value (for dichotomous events) l Multiple probabilities (discrete probability distribution
for multiple categories)l Continuous distribution
– For dichotomous or multiple categories, probability values may be limited to certain values (e.g., multiples of 0.1)
• Ensemble– Multiple iterations of a continuous or
categorical forecastl May be transformed into a probability
distribution– Observations may be continuous,
dichotomous or multi-category
2-category precipitation forecast (PoP) for US
ECMWF 2-m temperature meteogram for Helsinki 20Copyright 2015, University Corporation for Atmospheric Research, all rights
reserved

Matching forecasts and observations
• May be the most difficult part of the verification process!
• Many factors need to be taken into account- Identifying observations that represent the forecast
eventüExample: Precipitation accumulation over an hour at a
point- For a gridded forecast there are many options for
the matching process• Point-to-grid
• Match obs to closest gridpoint• Grid-to-point
• Interpolate?• Take largest value?
21Copyright 2015, University Corporation for Atmospheric Research, all rights reserved

Matching forecasts and observations
• Point-to-Grid and
Grid-to-Point
• Matching approach can impact the results of the verification
22Copyright 2015, University Corporation for Atmospheric Research, all rights reserved

Matching forecasts and observations
Example:
– Two approaches:• Match rain gauge to
nearest gridpoint or• Interpolate grid values
to rain gauge location– Crude assumption:
equal weight to each gridpoint
– Differences in results associated with matching:
“Representativeness” differenceWill impact most verification scores
10
0
20
20
20
Obs=10
Fcst=0
10
0
20
20
20
Obs=10
Fcst=15
23Copyright 2015, University Corporation for Atmospheric Research, all rights reserved

24Copyright 2015, University Corporation for Atmospheric Research, all rights reserved

Matching forecasts and observations
Final point:
• It is not advisable to use the model analysis as the verification “observation”.
• Why not??
• Issue: Non-independence!!
25Copyright 2015, University Corporation for Atmospheric Research, all rights reserved

Comparison and inferenceUncertainty in scores and measures should
be estimated whenever possible!– Uncertainty arises from
• Sampling variability• Observation error• Representativeness differences• Others?
– Erroneous conclusions can be drawn regarding improvements in forecasting systems and models
– Methods for confidence intervals and hypothesis tests
• Parametric (i.e., depending on a statistical model)
• Non-parametric (e.g., derived from re-sampling procedures, often called “bootstrapping”)
26Copyright 2015, University Corporation for Atmospheric Research, all rights reserved

Verification attributes
• Verification attributes measure different aspects of forecast quality– Represent a range of characteristics that should
be considered
– Many can be related to joint, conditional, and marginal distributions of forecasts and observations
27Copyright 2015, University Corporation for Atmospheric Research, all rights reserved

28
Joint : The probability of two events in conjunction.
Pr (Tornado forecast AND Tornado observed) = 30 / 2800 = 0.01
Conditional : The probability of one variable given that the second is already determined.
Pr (Tornado Observed | Tornado Fcst) = 30/50 = 0.60
Tornado forecast
Tornado Observedyes no Total fc
yes 30 70 100no 20 2680 2700
Total obs 50 2750 2800
Marginal : The probability of one variable without regard to the other.
Pr(Yes Forecast) = 100/2800 = 0.04Pr(Yes Obs) = 50 / 2800 = 0.02
Copyright 2015, University Corporation for Atmospheric Research, all rights reserved

Verification attribute examples
• Bias - (Marginal distributions)
• Correlation- Overall association (Joint distribution)
• Accuracy- Differences (Joint distribution)
• Calibration- Measures conditional bias (Conditional
distributions)• Discrimination- Degree to which forecasts discriminate between
different observations (Conditional distribution)
29Copyright 2015, University Corporation for Atmospheric Research, all rights reserved

Miscellaneous issues• In order to be verified, forecasts must be
formulated so that they are verifiable!– Corollary: All forecasts should be verified – if
something is worth forecasting, it is worth verifying
• Stratification and aggregation– Aggregation can help increase sample sizes and
statistical robustness but can also hide important aspects of performanceüMost common regime may dominate results, mask
variations in performance.– Thus it is very important to stratify results into
meaningful, homogeneous sub-groups30Copyright 2015, University Corporation for Atmospheric Research, all rights
reserved

Some key things to think about …
Who…– …wants to know?
What… – … does the user care about?– … kind of parameter are we evaluating? What are its
characteristics (e.g., continuous, probabilistic)?– … thresholds are important (if any)?– … forecast resolution is relevant (e.g., site-specific, area-
average)?– … are the characteristics of the obs (e.g., quality,
uncertainty)? – … are appropriate methods?
Why…– …do we need to verify it?
31Copyright 2015, University Corporation for Atmospheric Research, all rights reserved

Some key things to think about…
How…– …do you need/want to present results (e.g.,
stratification/aggregation)?
Which…– …methods and metrics are appropriate?
– … methods are required (e.g., bias, event frequency, sample size)
32Copyright 2015, University Corporation for Atmospheric Research, all rights reserved

What you can do with MET verification software
depends on what type of data you have.

The format (grid, point) of your data determines your MET tool(s).
The type (continuous, binary) of your data determines the analyses to
use within each tool.

Gridded Forecasts(2D or 3D)
copyright 2015, UCAR, all rights reserved.

Point Observations(2D or 3D)
copyright 2015, UCAR, all rights reserved.

Time
• If your forecasts and observations are not at the same time, you may need to define a time window for your observations.
Forecast Timeê
é éObservation Window
Obs Obs

Gridded Observations(2D or 3D)

Matching Grids to Grids
• Must use some converter to put forecasts and observations on the same grid.
– Example: copygb
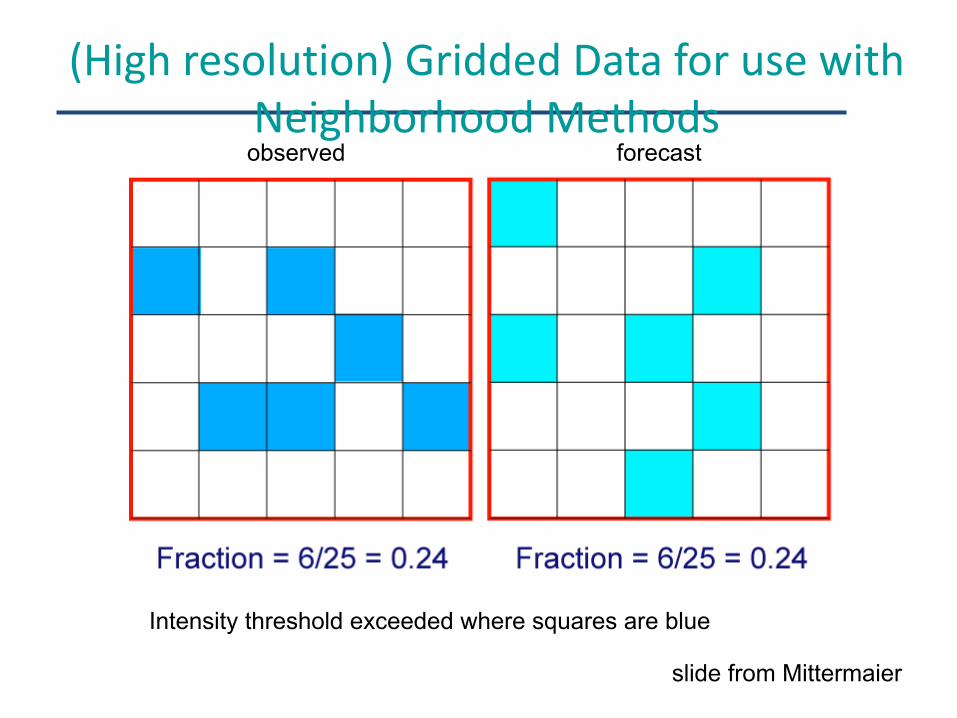
(Highresolution)GriddedDataforusewithNeighborhood Methods
Intensity threshold exceeded where squares are blue
observed forecast
slide from Mittermaier

Gridded data to transform into Objects
copyright 2015, UCAR, all rights reserved.
REAL- observed
Forecast1 Forecast2

Pixels (traditional Verification) or
Pictures (Object Verification)?

REAL- observed Forecast1
Forecast2
• Humans can pick out which objects exist and go together.
• In object based verification, we use software to mimic this process.

Examine spatial error field
at different scales using wavelets
Decompose with Wavelet

Data MET Tool
Gridded Forecasts Gridded Observations
Grid stat (traditional or neighborhood)
Series AnalysisWavelet StatMODEEnsemble Tool
Gridded Forecasts Point Observations
Point StatEnsemble Tool
Tropical Cyclone A decks and B decks (both point observations)
MET - TC

46
Resources
Verification Methods FAQ: http://www.cawcr.gov.au/projects/verification/
Verification Discussion Group:Subscribe at http://mail.rap.ucar.edu/mailman/listinfo/vx-discuss
Copyright 2015, University Corporation for Atmospheric Research, all rights reserved