basic statistics for counselling _ edg 1503v2
TRANSCRIPT

7/27/2019 Basic Statistics for Counselling _ EDG 1503V2
http://slidepdf.com/reader/full/basic-statistics-for-counselling-edg-1503v2 1/23
Basic Statistics for Counselling – EDG 150Introduction – Dr. Madihah Khalid

7/27/2019 Basic Statistics for Counselling _ EDG 1503V2
http://slidepdf.com/reader/full/basic-statistics-for-counselling-edg-1503v2 2/23
Nature of Statistics
“Statistics” First appeared in the English language in1787.
Statistical Thinking Will One Day Be As NecessaryFor Efficient Citizenship as The Ability To Read &Write. ~ H. G. Wells
Lies, Damn Lies, & Statistics - frequently attributedto British Prime Minister Benjamin Disraeli [1] and later popularized in America by author Mark Twain : "Thremark attributed to Disraeli would often apply with
justice and force: "There are three kinds of lies: lies,damned lies, and statistics".
What do you think of these 2 quotes?

7/27/2019 Basic Statistics for Counselling _ EDG 1503V2
http://slidepdf.com/reader/full/basic-statistics-for-counselling-edg-1503v2 3/23
Example of Task 3
The scatter plot below shows records of 50m running and the respectivesalary of businessman aged 30 to 50 years old. Why are the slow runnersearning high salary?
Low
fas
t
slow
salary
high
Time for running 50m
7/27/2019 Basic Statistics for Counselling _ EDG 1503V2
http://slidepdf.com/reader/full/basic-statistics-for-counselling-edg-1503v2 4/23

7/27/2019 Basic Statistics for Counselling _ EDG 1503V2
http://slidepdf.com/reader/full/basic-statistics-for-counselling-edg-1503v2 5/23
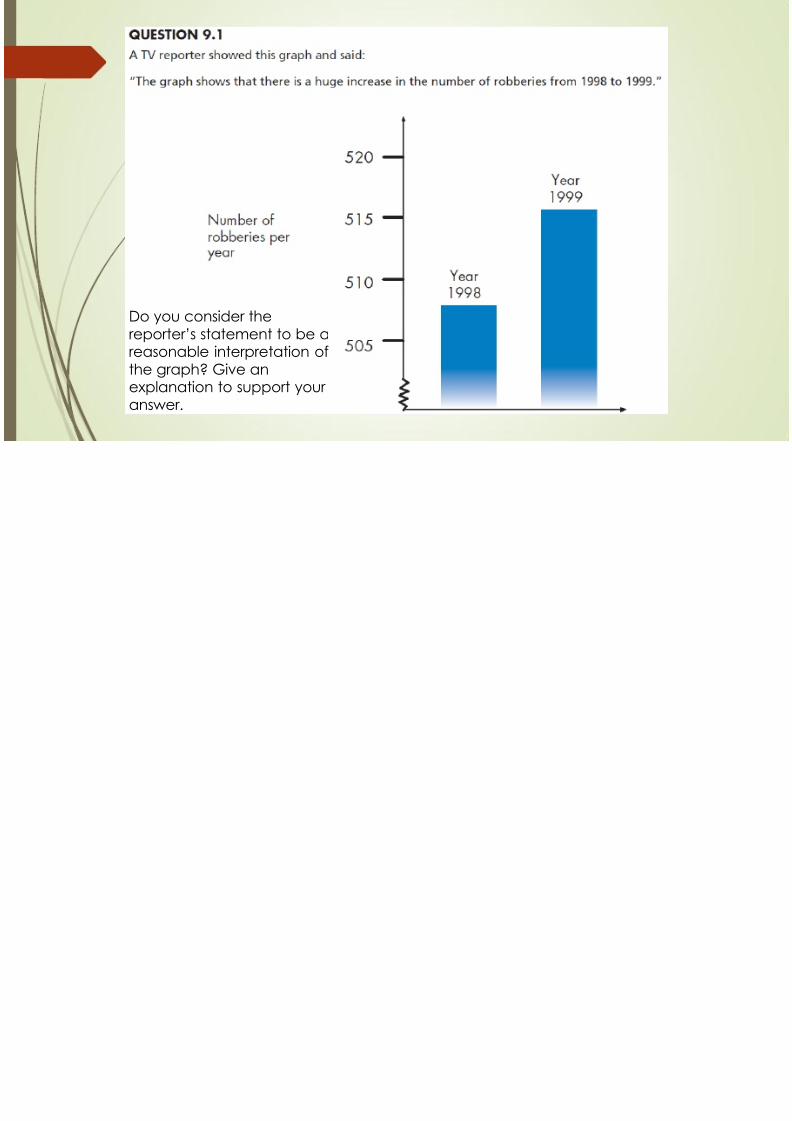
Do you consider thereporter’s statement to be areasonable interpretation ofthe graph? Give anexplanation to support your answer.
7/27/2019 Basic Statistics for Counselling _ EDG 1503V2
http://slidepdf.com/reader/full/basic-statistics-for-counselling-edg-1503v2 6/23
What do you think of when you hear the word statistics ?
Think of a general question that could beanswered with statistics. How would you carryout the process in order to answer your question? Be as specific as possible.Make a list of the topics and ideas that come tomind when you think of probability, including
both everyday uses of probability andmathematical or school uses.What does probability have to do with statistics?Think about ways that statistics might useprobability, and vice versa.
7/27/2019 Basic Statistics for Counselling _ EDG 1503V2
http://slidepdf.com/reader/full/basic-statistics-for-counselling-edg-1503v2 7/23
History of statistics
The history of statistics can be said to start around 17Over time, there have been changes to theinterpretation of what the word statistics meanstimes, the meaning was restricted to information aboutstates. This was later extended to include all collections
of information of all types, and later still it was extendedto include the analysis and interpretation of such data.In modern terms, "statistics" means both sets of collectedinformation, as in income distribution and temperaturerecords, and analytical work which requires stainference .
7/27/2019 Basic Statistics for Counselling _ EDG 1503V2
http://slidepdf.com/reader/full/basic-statistics-for-counselling-edg-1503v2 8/23
The relation between statistics and probability theory developedrather late, however. In the 19th century, statistics increasingly usedprobability theory , whose initial results were found in the 17th and18th centuries, particularly in the analysis of games of chance (gambling).
By 1800, astronomy used probability models and statistical theories,particularly the method of least squares.
Early probability theory and statistics was systematized and extendedby Laplace ; following Laplace, probability and statistics have been incontinual development.
In the 19th century, social scientists used statistical reasoning andprobability models to advance the new sciences of experimentalpsychology and sociology ; physical scientists used statisticalreasoning and probability models to advance the new sciences ofthermodynamics and statistical mechanics .
The development of statistical reasoning was closely associated withthe development of inductive logic and the scientific method .
RELATION WITH PROBABILITY

7/27/2019 Basic Statistics for Counselling _ EDG 1503V2
http://slidepdf.com/reader/full/basic-statistics-for-counselling-edg-1503v2 9/23
Statistics in everyday life
1. Weather Forecasts – Do you watch the weather forecast sometime duthe day? How do you use that information? Have you ever heard the
forecaster talk about weather models? These computer models are builtusing statistics that compare prior weather conditions with current weather topredict future weather.
2. Emergency Preparedness – What happens if the forecast indicates hurricane is imminent or that tornadoes are likely to occur? Emergencymanagement agencies move into high gear to be ready to rescue people.Emergency teams rely on statistics to tell them when danger may occur.
3. Predicting Disease – Lots of times on the news reports, statistics aboudisease are reported. If the reporter simply reports the number of people whoeither have the disease or who have died from it, it's an interesting fact but itmight not mean much to your life. But when statistics become involved, youhave a better idea of how that disease may affect you.
7/27/2019 Basic Statistics for Counselling _ EDG 1503V2
http://slidepdf.com/reader/full/basic-statistics-for-counselling-edg-1503v2 10/23
4. Medical Studies – Scientists must show a statistically validrate of effectiveness before any drug can be prescribed.Statistics are behind every medical study you hear about.
5. Political Campaigns – Whenever there's an election, thenews organizations consult their models when they try topredict who the winner is. Candidates consult voter polls todetermine where and how they campaign. Statistics play apart in who your elected government officials will be
6. Insurance – You know that in order to drive your car you arerequired by law to have car insurance. If you have amortgage on your house, you must have it insured as well. The
rate that an insurance company charges you is based uponstatistics from all drivers or homeowners in your area.
7. Stock Market – Another topic that you hear a lot about inthe news is the stock market. Stock analysts also use statisticalcomputer models to forecast what is happening in theeconomy.
Note: Try to think where do YOU encounter statistics in YOURlife
7/27/2019 Basic Statistics for Counselling _ EDG 1503V2
http://slidepdf.com/reader/full/basic-statistics-for-counselling-edg-1503v2 11/23
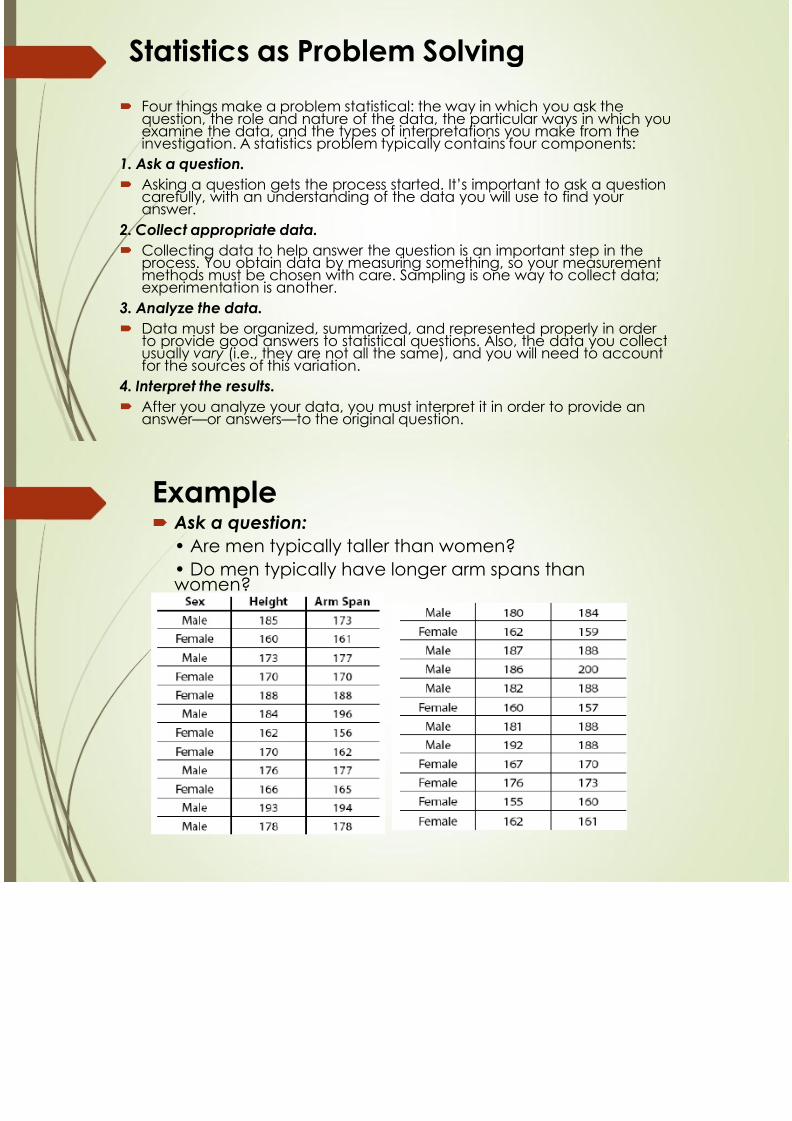
Statistics as Problem Solving
Four things make a problem statistical: the way in which you ask thequestion, the role and nature of the data, the particular ways in which youexamine the data, and the types of interpretations you make from theinvestigation. A statistics problem typically contains four components:
1. Ask a question.Asking a question gets the process started. It’s important to ask a questioncarefully, with an understanding of the data you will use to find your answer.
2. Collect appropriate data.Collecting data to help answer the question is an important step in theprocess. You obtain data by measuring something, so your measurementmethods must be chosen with care. Sampling is one way to collect data;experimentation is another.
3. Analyze the data.Data must be organized, summarized, and represented properly in order to provide good answers to statistical questions. Also, the data you collectusually vary (i.e., they are not all the same), and you will need to accountfor the sources of this variation.
4. Interpret the results.After you analyze your data, you must interpret it in order to provide ananswer — or answers — to the original question.

7/27/2019 Basic Statistics for Counselling _ EDG 1503V2
http://slidepdf.com/reader/full/basic-statistics-for-counselling-edg-1503v2 12/23
Example Ask a question:• Are men typically taller than women? • Do men typically have longer arm spans thanwomen?
7/27/2019 Basic Statistics for Counselling _ EDG 1503V2
http://slidepdf.com/reader/full/basic-statistics-for-counselling-edg-1503v2 13/23
a. Examine the 24 measurements for heightand arm span. You’ll notice that they are notall the same. What is the source of thisvariation? Can you explain why there aredifferences?b. Suppose your goal was to prove that men
are typically taller than women. Does thisdata prove that conclusion? Why or whynot?Talk about error and bias. What can you doto reduce these? Sampling?
7/27/2019 Basic Statistics for Counselling _ EDG 1503V2
http://slidepdf.com/reader/full/basic-statistics-for-counselling-edg-1503v2 14/23
STATISTICAL REASONING―The way people reason with statistical ideas and make sense of statistical
info‖.You should be able to do the following:
• Formulate questions that can be addressed with data and collect, organize,and display relevant data to answer them• Select and use appropriate statistical methods to analyze data• Develop and evaluate inferences and predictions that are based on data• Understand and apply basic concepts of probability For data analysis and statistics, students are expected to do the following:
• Formulate questions, design studies, and collect data about a characteristicshared by two populations or different characteristics within one population• Select, create, and use appropriate graphical representations of data• Find, use, and interpret measures of center and spread, including mean andinterquartile range• Discuss and understand the correspondence between datacorrelating and regressing● Understand and use statistical inference to make decisions.

7/27/2019 Basic Statistics for Counselling _ EDG 1503V2
http://slidepdf.com/reader/full/basic-statistics-for-counselling-edg-1503v2 15/23
7/27/2019 Basic Statistics for Counselling _ EDG 1503V2
http://slidepdf.com/reader/full/basic-statistics-for-counselling-edg-1503v2 16/23
7/27/2019 Basic Statistics for Counselling _ EDG 1503V2
http://slidepdf.com/reader/full/basic-statistics-for-counselling-edg-1503v2 17/23
TYPES of DATANot all data is created equally. Some is quantitative , and someis qualitative . Some is continuous and some is discrete.
Another way to separate data is to look at what is being measured. To dothis there are four levels of measurement: nominal, ordinal, interval andratio. Different levels of measurement call for different statistical techniques.For example, it makes no sense whatsoever to find the meanand median of a list of IC numbers.

7/27/2019 Basic Statistics for Counselling _ EDG 1503V2
http://slidepdf.com/reader/full/basic-statistics-for-counselling-edg-1503v2 18/23
Nominal Level of Measurement The nominal level of measurement is the lowest of the four ways tocharacterize data. Nominal means "in name only" and that shouldhelp to remember what this level is all about. Nominal data dealswith names, categories, or labels.
Data at the nominal level is qualitative. Colors of eyes, yes or noresponses to a survey, and favorite breakfast cereal all deal with thenominal level of measurement. Even some things with numbersassociated with them, such as a number on the back of a football
jersey, are nominal since it is used to "name" an individual player onthe field.
Data at this level can't be ordered in a meaningful way, and itmakes no sense to calculate things such as means anddeviations .
7/27/2019 Basic Statistics for Counselling _ EDG 1503V2
http://slidepdf.com/reader/full/basic-statistics-for-counselling-edg-1503v2 19/23
Ordinal Level of Measurement
The next level is called the ordinal level of measurement. Data at
this level can be ordered, but no differences between the data canbe taken that are meaningful.
Here you should think of things like a list of the top ten cities to live.The data, here ten cities, are ranked from one to ten, butdifferences between the cities don't make much sense. There's noway from looking at just the rankings to know how much better life isin city number 1 than city number 2.
Another example of this are letter grades. You can order things sothat A is higher than a B, but without any other information, there isno way of knowing how much better an A is from a B.
As with the nominal level, data at the ordinal level should not beused in calculations.

7/27/2019 Basic Statistics for Counselling _ EDG 1503V2
http://slidepdf.com/reader/full/basic-statistics-for-counselling-edg-1503v2 20/23
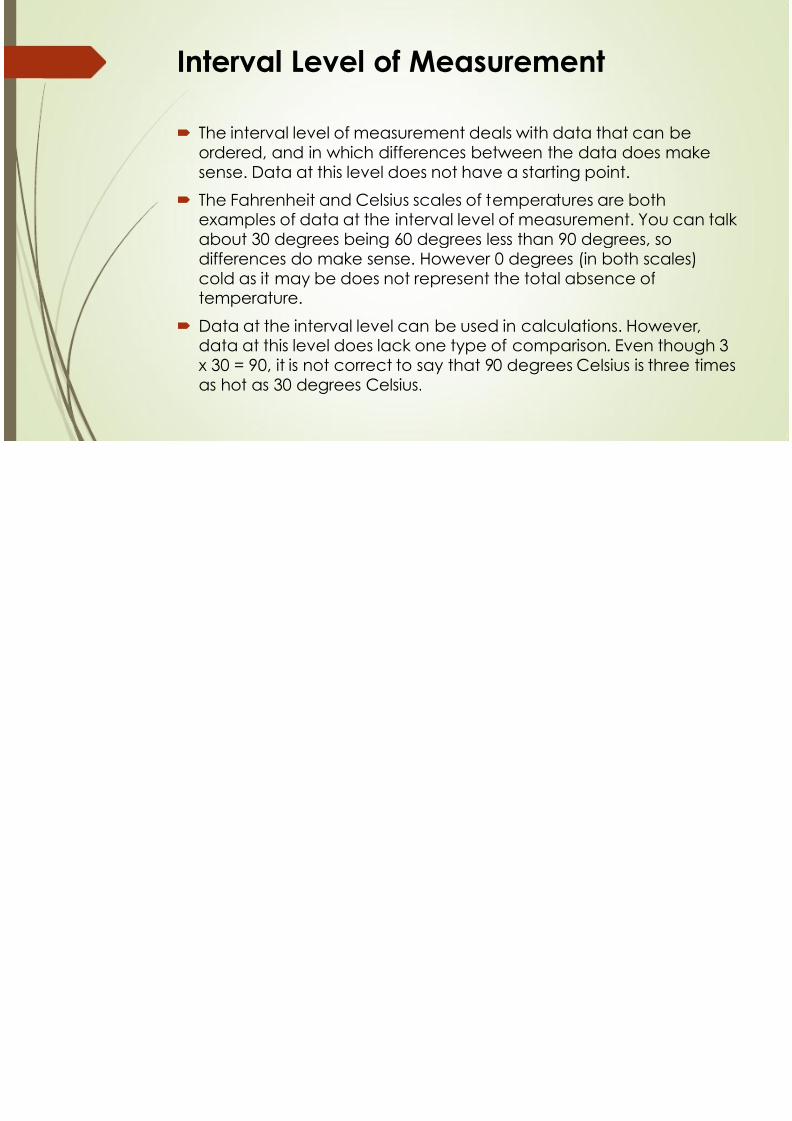
Interval Level of Measurement
The interval level of measurement deals with data that can beordered, and in which differences between the data does makesense. Data at this level does not have a starting point.
The Fahrenheit and Celsius scales of temperatures are bothexamples of data at the interval level of measurement. You can talk about 30 degrees being 60 degrees less than 90 degrees, sodifferences do make sense. However 0 degrees (in both scales)
cold as it may be does not represent the total absence oftemperature.
Data at the interval level can be used in calculations. However,data at this level does lack one type of comparison. Even though 3
x 30 = 90, it is not correct to say that 90 degrees Celsius is three timeas hot as 30 degrees Celsius.

7/27/2019 Basic Statistics for Counselling _ EDG 1503V2
http://slidepdf.com/reader/full/basic-statistics-for-counselling-edg-1503v2 21/23
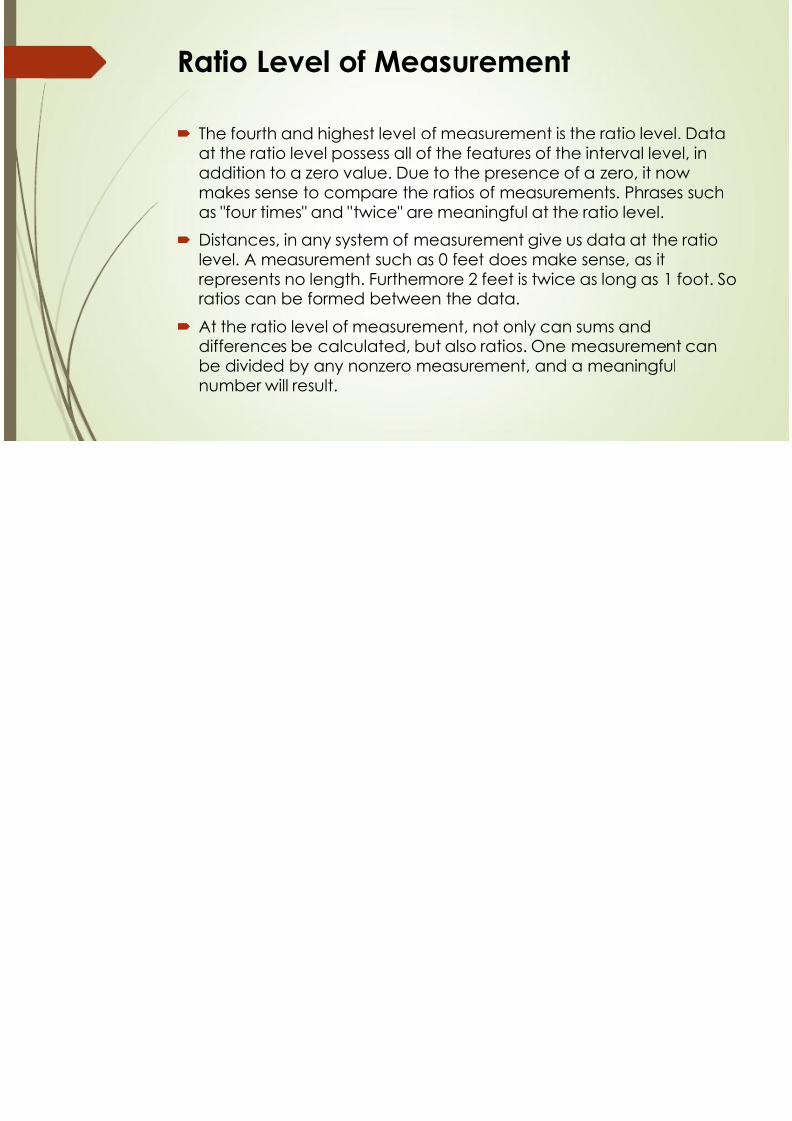
Ratio Level of Measurement
The fourth and highest level of measurement is the ratio level. Dataat the ratio level possess all of the features of the interval level, inaddition to a zero value. Due to the presence of a zero, it nowmakes sense to compare the ratios of measurements. Phrases suchas "four times" and "twice" are meaningful at the ratio level.
Distances, in any system of measurement give us data at the ratiolevel. A measurement such as 0 feet does make sense, as it
represents no length. Furthermore 2 feet is twice as long as 1 foot. Soratios can be formed between the data.
At the ratio level of measurement, not only can sums anddifferences be calculated, but also ratios. One measurement canbe divided by any nonzero measurement, and a meaningfulnumber will result.

7/27/2019 Basic Statistics for Counselling _ EDG 1503V2
http://slidepdf.com/reader/full/basic-statistics-for-counselling-edg-1503v2 22/23

7/27/2019 Basic Statistics for Counselling _ EDG 1503V2
http://slidepdf.com/reader/full/basic-statistics-for-counselling-edg-1503v2 23/23
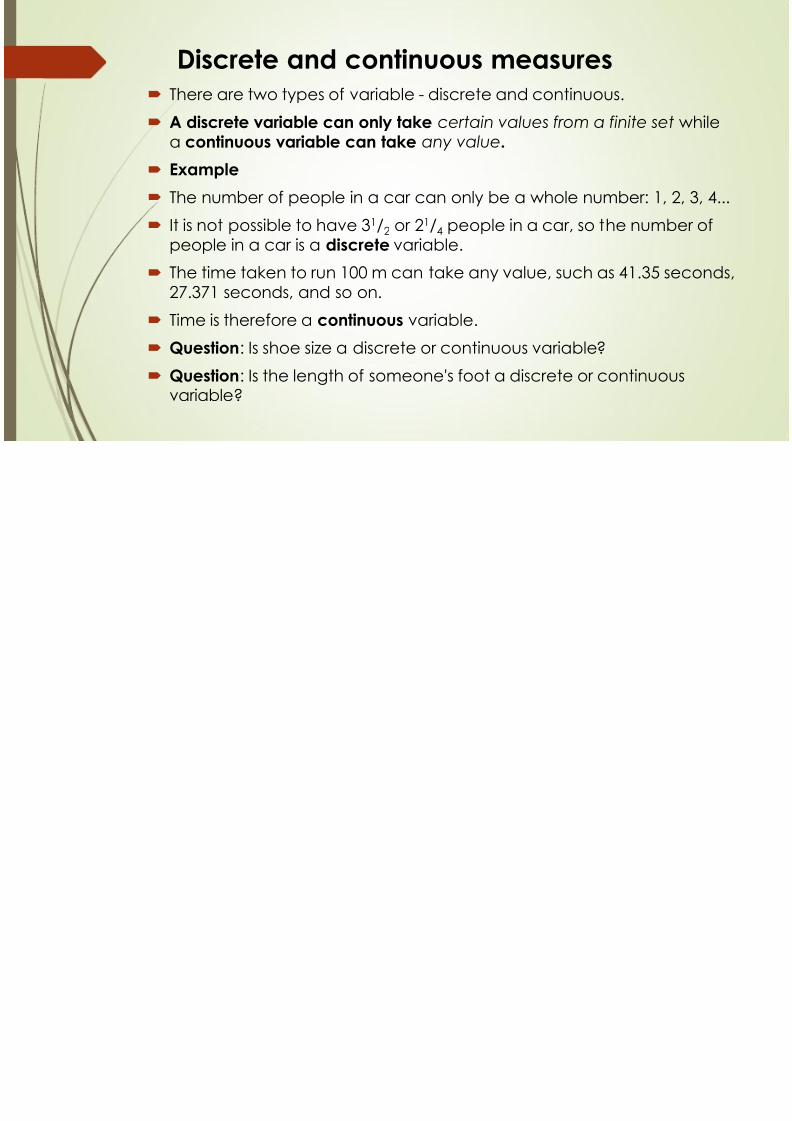
Discrete and continuous measures There are two types of variable - discrete and continuous.
A discrete variable can only take certain values from a finite set
a continuous variable can take any value .Example
The number of people in a car can only be a whole number: 1, 2, 3, 4...
It is not possible to have 3 1/ 2 or 2 1/ 4 people in a car, so the numbepeople in a car is a discrete variable.
The time taken to run 100 m can take any value, such as 41.35 seconds,27.371 seconds, and so on.
Time is therefore a continuous variable.
Question : Is shoe size a discrete or continuous variable?
Question : Is the length of someone's foot a discrete or continuousvariable?