basic principle of financial statement analysis
TRANSCRIPT

BASIC PRINCIPLE OF FINANCIAL STATEMENT ANALYSIS
KHOMSATUN (7101413011)NUR MAIZAH RAHMAWATI (7101413052)

Analysis’s purpose
to select, evaluate, interpreting and compare financial data, along with other pertinent information, in order to formulate an assessment of a company’s present and future financial condition and performance.

Method of financial statement analysis
1. Horizontal common-size analysis uses the amounts in accounts in a specified year as the base, and subsequent years’ amounts are stated as a percentage of the base value.
• Useful when comparing growth of different accounts over time.
2. Vertical common-size analysis uses the aggregate value in a financial statement for a given year as the base, and each account’s amount is restated as a percentage of the aggregate.
• Balance sheet: Aggregate amount is total assets.
• Income statement: Aggregate amount is revenues or sales.
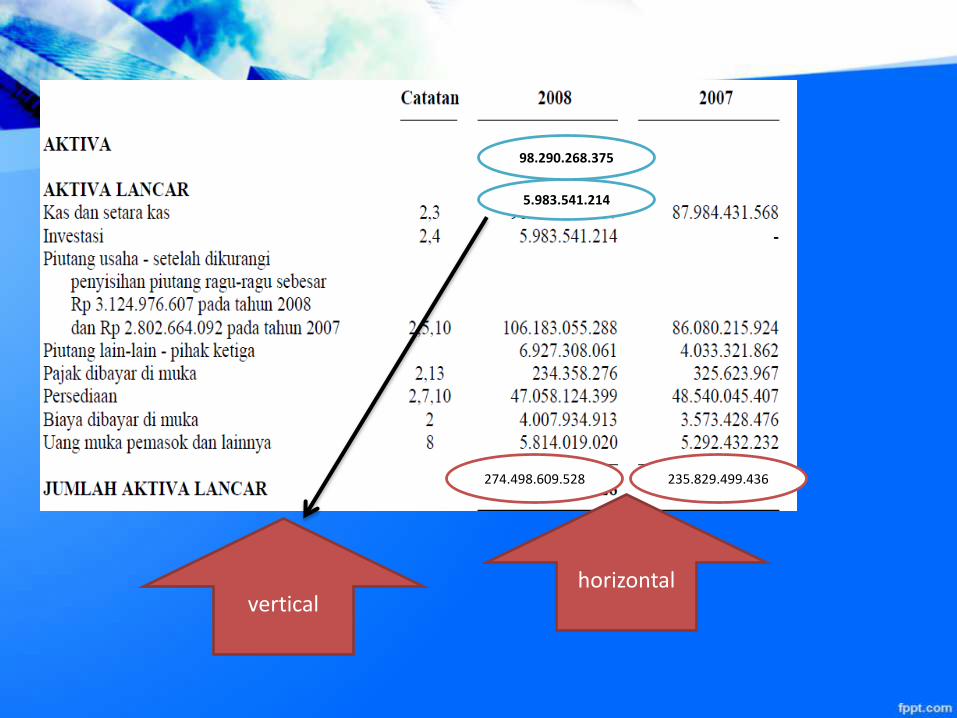
235.829.499.436274.498.609.528
horizontal
5.983.541.214
98.290.268.375
vertical

1. LIQUIDITY• Liquidity is the ability to satisfy the company’s short-term obligations using
assets that can be most readily converted into cash.

SOLVENCY
Solvency is a measure of the long-term financial viability of a business which means its ability to pay off its long-term obligations such as bank loans, bonds payable, etc
Total Liability• Total Debt to Equity Ratio = ------------------ x 100 %.
equity
Total liability• Total Debt to capital Assets = ------------------- x 100 %.
Total Asset
long term liability• Long Term Debt to = -------------------------------- x 100 %
Equity Ratio equity

Profitability
Profitability is the ability of a business to earn profit for its owners. While liquidity ratios and solvency ratios are relationships that explain the financial position of a business profitability ratios are relationships that explain the financial performance of a business. Key profitability ratios include net profit margin, gross profit margin, operating profit margin, return on assets, return on capital, return on equity, etc.
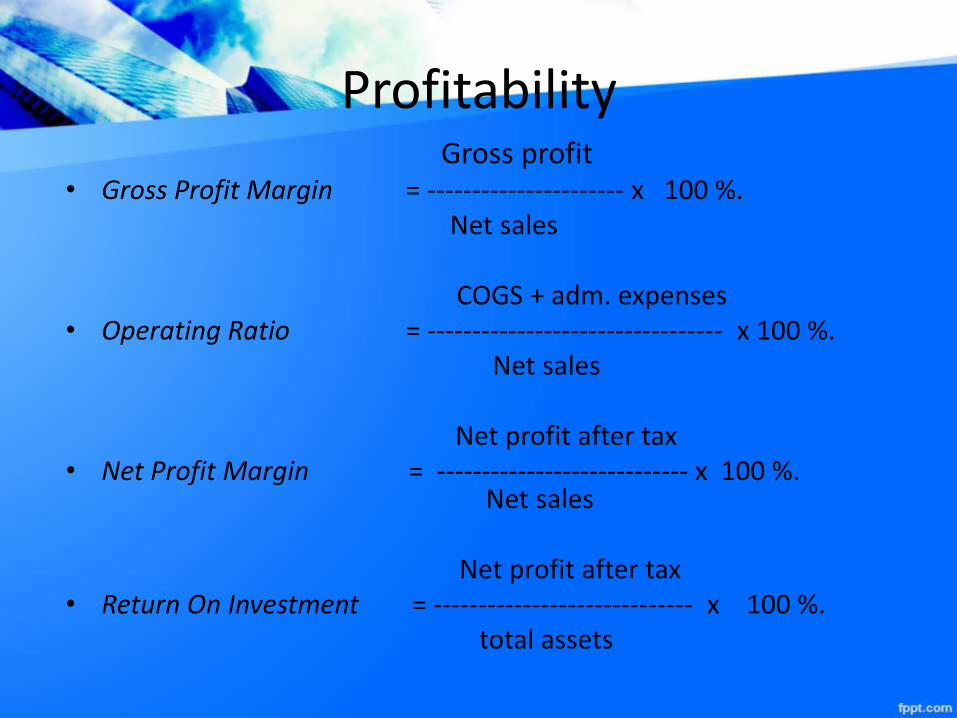
Profitability Gross profit
• Gross Profit Margin = ---------------------- x 100 %.Net sales
COGS + adm. expenses• Operating Ratio = --------------------------------- x 100 %.
Net sales
Net profit after tax• Net Profit Margin = ---------------------------- x 100 %.
Net sales
Net profit after tax• Return On Investment = ----------------------------- x 100 %.
total assets
ACTIVITY RATIO
Activity ratios explain the level of efficiency of a business. Key activity ratios include inventory turnover, days sales in inventory, accounts receivable turnover, days sales in receivables, etc.

net sales
– Total Assets = ------------------------- x 1 kali.
Turn Over Total assets
sales on credit
– Receivable Turnover = -------------------------- x 1 kali.
receivable
receivable average x 360
– Average Collection = ----------------------------- x 1 hari.
Periode sales on credit

cost of good soldInventory Turnover = ----------------------------- x 1 kali.
Inventory
Inventory x 360Average day’s = ----------------------------- x 1 hari.
Inventory cost of goods sold
net salesWorking Capital = ------------------------------------- x 1 kali.Turnover current assets – current liability

Technic of financial statement analysis
Comparing of financial
statement
Trend
Common size statement
Cash flow statement
Working capital analysis
Ratio analysis
Gross profit analysis
Break even analysis

Financial statement comparing analysis
Is an analysis method to compare financial statement for 2 period or over the period that shown :
a. Absolut data
b. Fluctuating value in rupiah
c. Fluctuating value in precentage
d. Comparing value in ratio
e. Total of precentage

Example: Income Statement PT Telkom
Periode2011 (Rp)
Periode 2012 (Rp)
Berkurang-Bertambah(Rp)
Berkurang-Bertambah (%)
Income 71.253 77.143
Salary Exp 8.555 9.786
Depreciation Exp 14.863 14.456
Adv. Exp 3.278 3.094
Admin Exp 2.935 3.036
Other Exp 192 1.973
Gross profit 41.430 44.798
Income tax 5.387 5.866
Net profit 36.043 38.932

Balance sheet compare
2011(RP) 2012(RP) +/- (RP) +/- (%)
Cash 9.634 13.118 3484 36
acc. Receivable 406 701 295 72
Inventory 758 579 179* 23,6*
Fixed asset 74.897 77.047 2150 2,9
Total aktiva 85.695 91.445 9420 11
Current liability 22.187 24.107 1920 8,6
Long term liab. 19.884 20.284 400 2
Capital 43.624 47.054 7100 16,3
Total pasiva 85.695 91.445 9420 11

Analysis…????

TREND PERCENTAGE ANALYSIS
calculates the percentage change for one account over a period of time of two years or more.
• Percentage change To calculate the percentage change between two
periods:• Calculate the amount of the increase/(decrease) for
the period by subtracting the earlier year from the later year. If the difference is negative, the change is a decrease and if the difference is positive, it is an increase.
• Divide the change by the earlier year's balance. The result is the percentage change.

Common size statement
A company financial statement that displays all items as percentages of a common base figure. This type of financial statement allows for easy analysis between companies or between time periods of a company.
Working capital analysis
An analysis to determine changes in working capital is to compare its sources with its uses. Recall that transactions involving only current asset and current liability accounts have no net effect on working capital.

Cash flow statement analysis
to determine how a company uses its cash assets. The choice to use cash to acquire an asset, to meet a liability, or to retire a debt is a process of investment and disinvestment, and a manager always has choices to make, some smart and some maladroit. It’s important to keep track of how well a company’s management is making these choices.

Ratio analysis
It's comparing the number against previous years, other companies, the industry or even the economy in general. Ratios look at the relationships between individual values and relate them to how a company has performed in the past, and how it might perform in the future.

Gross profit analysis
is designed to pick apart the reasons why the gross profit margin changes from period to period, so that management can take steps to bring the gross margin in line with expectations. A decline in gross profits can be an indicator of serious problems, so the figure is closely watched.

Break even analysis
An analysis to determine the point at which revenue received equals the costs associated with receiving the revenue. Break-even analysis calculates what is known as a margin of safety, the amount that revenues exceed the break-even point. This is the amount that revenues can fall while still staying above the break-even point.