basic- nmr- experiments · book: “150 and more basic nmr experiments” written by s. braun,...
TRANSCRIPT
150
Basic-
NMR-
Experiments
MMO January 2000 Version 2.0
2
CONTENTS
INTRODUCTION 8
CHAPTER 2 - DETERMINATION OF THE PULSE-DURATION 9
SUMMARY 9
Experiment 2.1 - Determination of the 90° 1H Transmitter Pulse Duration 9
Experiment 2.2 - Determination of the 90° 13C Transmitter Pulse Duration 10
Experiment 2.3 - Determination of the 90° 1H Decoupler Pulse Duration 10
Experiment 2.4 - The 90° 1H Pulse with Inverse Spectrometer Configuration 11
Experiment 2.5 - The 90° 13C Decoupler Pulse with Inverse Configuration 11
Experiment 2.6 - Composite Pulses 12
Experiment 2.7 - Radiation Damping 13
Experiment 2.8 - Pulse and Receiver Phases 13
Experiment 2.9 - Determination of Radiofrequency Power 14
CHAPTER 3 - ROUTINE NMR SPECTROSCOPY AND STANDARD TESTS 15
SUMMARY 15
Experiment 3.1 - The Standard 1H NMR Experiment 15
Experiment 3.2 - The Standard 13C NMR Experiment 16
Experiment 3.3 - The Application of Window Functions 16
Experiment 3.4 - Computer-aided Spectral Analysis 17
Experiment 3.5 - Line-Shape Test for 1H NMR Spectroscopy 17
Experiment 3.6 - Resolution Test for 1H NMR Spectroscopy 18
Experiment 3.7 - Sensitivity Test for 1H NMR Spectroscopy 18
Experiment 3.8 - Line-Shape Test for 13C NMR Spectroscopy 19
Experiment 3.9 - ASTM Sensitivity Test for 13C NMR Spectroscopy 20
Experiment 3.10 - Sensitivity Test for 13C NMR Spectroscopy 20
Experiment 3.11 - Quadrature Image Test 21
Experiment 3.12 - Dynamic Range Test for Signal Amplitudes 21
Experiment 3.13 – 13° Phase Stability Test 22
CHAPTER 4 - DECOUPLING TECHNIQUES 23
SUMMARY 23
Experiment 4.1 - Decoupler Calibration for Homonuclear Decoupling 23
Experiment 4.2 - Decoupler Calibration for Heteronuclear Decoupling 24
3
Experiment 4.3 - Low Power Calibration for Heteronuclear Decoupling 25
Experiment 4.4 - Homonuclear Decoupling 25
Experiment 4.5 - Homonuclear Decoupling at Two Frequencies 26
Experiment 4.6 - The Homonuclear SPT Experiment 26
Experiment 4.7 - The Heteronuclear SPT Experiment 27
Experiment 4.8 - 1D Nuclear Overhauser Difference Spectroscopy 27
Experiment 4.9 - 1D NOE Spectroscopy with Multiple Selective Irradiation 28
Experiment 4.10 - 1H Off-Resonance Decoupled 13C NMR Spectra 29
Experiment 4.11 - The Gated 1H-Decoupling Technique 29
Experiment 4.12 - The Inverse Gated 1H-Decoupling Technique 30
Experiment 4.13 - 1H Single Frequency Decoupling of 13C NMR Spectra 30
Experiment 4.14 - 1H Low Power Decoupling of 13C NMR Spectra 31
Experiment 4.15 - Measurement of the Heteronuclear Overhauser Effect 32
CHAPTER 5 - DYNAMIC NMR SPECTROSCOPY 33
SUMMARY 33
Experiment 5.1 - Low Temperature Calibration with Methanol 33
Experiment 5.2 - High Temperature Calibration with 1,2-Ethandiol 33
Experiment 5.3 - Dynamic 1H NMR Spectroscopy on Dimethylformamid 34
Experiment 5.4 - The Saturation Transfer Experiment 34
Experiment 5.5 - Measurement of the Rotating Frame Relaxation Time T1p 35
CHAPTER 6 - 1D MULTIPULSE SEQUENCES 36
SUMMARY 36
Experiment 6.1 - Measurement of the Spin-Lattice Relaxation Time T1 36
Experiment 6.2 - Measurement of the Spin-Spin Relaxation Time T2 37
Experiment 6.3 - 13C NMR Spectra with SEFT 38
Experiment 6.4 - 13C NMR Spectra with APT 38
Experiment 6.5 - The Basic INEPT Technique 39
Experiment 6.6 - INEPT+ 40
Experiment 6.7 - Refocused INEPT 40
Experiment 6.8 - Reverse INEPT 41
Experiment 6.9 - DEPT-135 42
Experiment 6.10 - Editing 13C NMR Spectra with DEPT 42
Experiment 6.11 - Multiplicity Determination with PENDANT 43
Experiment 6.12 - 1D-INADEQUATE 44
Experiment 6.13 - The BIRD Filter 45
Experiment 6.14 - TANGO 45
4
Experiment 6.15 - The Heteronuclear Double Quantum Filter 46
Experiment 6.16 - Purging with a Spin-Lock Pulse 46
Experiment 6.17 - Water Suppression by Presaturation 47
Experiment 6.18 - Water Suppression by the Jump and Return Method 48
CHAPTER 7 - NMR SPECTROSCOPY WITH SELECTIVE PULSES 49
SUMMARY 49
Experiment 7.1 - Determination of a Shaped 90o 1H Transmitter Pulse 49
Experiment 7.2 - Determination of a Shaped 90o 1H Decoupler Pulse 50
Experiment 7.3 - Determination of a Shaped 90o 13C Decoupler Pulse 50
Experiment 7.4 - Selective Excitation with DANTE 51
Experiment 7.5 - SELCOSY 52
Experiment 7.6 - SELINCOR: Selective Inverse H,C Correlation via 1J (C,H) 52
Experiment 7.7 - SELINQUATE 53
Experiment 7.8 - Selective TOCSY 54
Experiment 7.9 - INAPT 55
Experiment 7.10 - Determination of Long-Range C,H Coupling Constants 56
Experiment 7.11 - SELRESOLV 57
Experiment 7.12 - SERF 57
CHAPTER 8 - AUXILIARY REAGENTS, QUANTITATIVE DETERMINATIONS ANDREACTION MECHANISM 59
SUMMARY 59
Experiment 8.1 - Signal Separation Using a Lanthanide Shift Reagent 59
Experiment 8.2 - Signal Separation of Enantiomers Using a Chiral Shift Reagent 60
Experiment 8.3 - Signal Separation of Enantiomers Using a Chiral Solvating Agent 60
Experiment 8.4 - Determination of Enantiomeric Purity with Pirkle’s Reagent 61
Experiment 8.5 - Determination of Enantiomeric Purity by 31P NMR 61
Experiment 8.6 - Determination of Absolute Configuration by the Advanced Mosher Method 62
Experiment 8.7 - Aromatic Solvent-Induced Shift (ASIS) 62
Experiment 8.8 - NMR Spectroscopy of OH-Protons and H/D Exchange 63
Experiment 8.9 - Isotope Effects on Chemical Shielding 64
Experiment 8.10 - pKa Determination with 13C NMR 64
Experiment 8.11 - The Relaxation Reagent Cr(acac)3 65
Experiment 8.12 - Determination of Paramagnetic Susceptibility by NMR 65
Experiment 8.13 - 1H and 13C NMR of Paramagnetic Compounds 66
Experiment 8.14 - The CIDNP Effect 67
Experiment 8.15 - Quantitative 1H NMR Spectroscopy: Determination of the Alcohol Content ofPolish Vodka 67
5
Experiment 8.16 - Quantitative 13C NMR Spectroscopy with Inverse Gated 1H-Decoupling 68
Experiment 8.17 - NMR Using Liquid-Crystal Solvents 68
CHAPTER 9 - HETERONUCLEAR NMR SPECROSCOPY 70
SUMMARY 70
Experiment 9.1 - 1H-Decoupled 15N NMR Spectra with DEPT 70
Experiment 9.2 - 1H-Coupled 15N NMR Spectra with DEPT 71
Experiment 9.3 - 19F NMR Spectroscopy 71
Experiment 9.4 - 29Si NMR Spectroscopy with DEPT 72
Experiment 9.5 - 29Si NMR Spectroscopy with Spin-Lock Polarization 73
Experiment 9.6 - 119Sn NMR Spectroscopy 73
Experiment 9.7 - 2H NMR Spectroscopy 74
Experiment 9.8 - 11B NMR Spectroscopy 74
Experiment 9.9 - 17O NMR Spectroscopy with RIDE 75
Experiment 9.10 - 47/49Ti NMR Spectroscopy with ARING 76
CHAPTER 10 - THE SECOND DIMENSION 77
SUMMARY 77
Experiment 10.1 - 2D J-Resolved 1H NMR Spectroscopy 77
Experiment 10.2 - 2D J-Resolved 13C NMR Spectroscopy 78
Experiment 10.3 - The Basic H,H-COSY-Experiment 79
Experiment 10.4 - Long-Range COSY 79
Experiment 10.5 - Phase-Sensitive COSY 80
Experiment 10.6 - Phase-Sensitive COSY-45 81
Experiment 10.7 - E.COSY 82
Experiment 10.8 - Double Quantum Filtered COSY with Presaturation 82
Experiment 10.9 - Fully Coupled C,H Correlation (FUCOUP) 83
Experiment 10.10 - C,H Correlation by Polarization Transfer (HETCOR) 84
Experiment 10.11 - Long-Range C,H Correlation by Polarization Transfer 85
Experiment 10.12 - C,H Correlation via Long-Range Couplings (COLOC) 86
Experiment 10.13 - The Basic HMQC Experiment 86
Experiment 10.14 - Phase-Sensitive HMQC with BIRD Filter and GARP Decoupling 87
Experiment 10.15 - Poor Man’s Gradient HMQC 88
Experiment 10.16 - Phase-Sensitive HMBC with BIRD Filter 89
Experiment 10.17 - The Basic HSQC Experiment 90
Experiment 10.18 - The HOHAHA or TOCSY Experiment 91
Experiment 10.19 - The NOESY Experiment 92
Experiment 10.20 - The CAMELSPIN or ROESY Experiment 93
6
Experiment 10.21 - The HOESY Experiment 94
Experiment 10.22 - 2D-INADEQUATE 94
Experiment 10.23 - The EXSY Experiment 95
Experiment 10.24 - X, Y Correlation 96
CHAPTER 11 - NMR SPECTROSCOPY WITH PULSED FIELD GRADIENTS 98
SUMMARY 98
Experiment 11.1 - Calibration of Pulsed Field Gradients 98
Experiment 11.2 - Gradient Preemphasis 99
Experiment 11.3 - Gradient Amplifier Test 99
Experiment 11.4 - Determination of Pulsed Field Gradient Ring-Down Delays 100
Experiment 11.5 - The Pulsed Gradient Spin-Echo Experiment 100
Experiment 11.6 - Excitation Pattern of Selective Pulses 101
Experiment 11.7 - The Gradient zz-Filter 102
Experiment 11.8 - gs-SELCOSY 102
Experiment 11.9 - gs-SELTOCSY 103
Experiment 11.10 - DPFGSE-NOE 104
Experiment 11.11 - gs-SELINCOR 105
Experiment 11.12 - GRECCO 106
Experiment 11.13 - WATERGATE 106
Experiment 11.14 - Water Suppression by Excitation Sculpting 107
CHAPTER 12 - 2D NMR SPECTROSCOPY WITH FIELD GRADIENTS 108
SUMMARY 108
Experiment 12.1 - gs-COSY 108
Experiment 12.2 - Phase-Sensitive gs-DQF-COSY 109
Experiment 12.3 - gs-HMQC 110
Experiment 12.4 - gs-HMBC 110
Experiment 12.5 - ACCORD-HMBC 111
Experiment 12.6 - Phase-Sensitive gs-HSQC with Sensitivity Enhancement 112
Experiment 12.7 - gs-TOCSY 113
Experiment 12.8 - gs-HMQC-TOCSY 114
Experiment 12.9 - 2Q-HMBC 115
Experiment 12.10 - Gradient-Selected 1H-Detected 2D INEPT-INADEQUATE 116
Experiment 12.11 - gs-NOESY 117
Experiment 12.12 - gs-HSQC-NOESY 118
Experiment 12.13 - gs-HOESY 119
Experiment 12.14 - 1H, 15N Correlation with gs-HMQC 119

7
CHAPTER 13 - THE THIRD DIMENSION 121
SUMMARY 121
Experiment 13.1 - 3D HMQC-COSY 121
Experiment 13.2 - 3D gs-HSQC-TOCSY 122
Experiment 13.3 - 3D H,C,P-Correlation 122
Experiment 13.4 - 3D HMBC 123
CHAPTER 14 - SOLID-STATE NMR SPECTROSCOPY 124
SUMMARY 124
Experiment 14.1 - Shimming Solid-State Probe-Heads 124
Experiment 14.2 – Adjusting the Magic Angle 125
Experiment 14.3 - Hartmann-Hahn Matching 126
Experiment 14.4 – The Basic CP/MAS Experiment 127
Experiment 14.5 - TOSS 127
Experiment 14.6 - SELTICS 128
Experiment 14.7 - Multiplicity Determination in the Solid-State 129

8
,QWURGXFWLRQ
Here you will find some information about the Bruker pulse programs andparameters, which are needed to repeat the experiments shown in thebook: “150 and More Basic NMR Experiments” written by S. Braun, H.-O.Kalinowski, S. Berger, VCH Weinheim, Germany.
First you will find the experiment number, followed by the Bruker pulseprogram, the settings of the different channels and a list of the acquisitionand processing parameters.
The number of the chapters are identically with the number of thechapters in the book.
The book contains a lot of very interesting experiments. If you want torepeat such experiments with a BRUKER Avance instrument you needthe pulse program and the parameters belonging to the pulse program.The needed parameters are sometimes different or more then mentionedin the book. BRUKER has its own nomenclature for the parameters,which is different from the book. For example the 90° transmitter pulse isalways P1, D2 is a delay depending on the coupling constant (1/2 J) andso on.
It is possible that the needed pulse program isn’t yet in your library, in thatcase send me an e-mail: [email protected].

9
Chapter 2
- Determination of the Pulse-Duration
Summary
Experiment Pulse program Description
2.1 zg0 Determination of the 90° 1HTransmitter Pulse-Duration
2.2 zg0dc Determination of the 90° 13CTransmitter Pulse-Duration
2.3 decp90 Determination of the 90° 1HDecoupler Pulse-Duration
2.4 zg0 The 90° 1H Pulse with InverseSpectrometer Configuration
2.5 decp90 The 90° 13C Decoupler Pulsewith Inverse Configuration
2.6 exp2_6a.mo andexp2_6b.mo
Composite Pulses
2.7 zg0 Radiation Damping
2.8 zg Pulse and Receiver Phases
2.9 zg Determination of RadiofrequencyPower
Experiment 2.1- Determination of the 90° 1H Transmitter Pulse Duration
pulse program: zg01D-sequence, using p0 for any flip angle. Result is a routine proton NMRspectrum.
Setting of the needed channels: F1: 1HF2: off
Acquisition parametersPL1 : F1 channel - high power level for 1H
transmitter pulse, here 3dB was usedP0 : F1 channel - 1H transmitter pulse, to be
varied, 1 usec as initial value andincrease by 2 usec
D1 : 30 sec - relaxation delay TD : 4 KSW : 500 Hz O1 : on resonance of CHCl3 signalNS : 1 RG : receiver gain for correct ADC input
Processing parametersSI :2 K BC_mod :quadWDW :EM LB :1 HzFT :fourier transformation phase correction :adjust the phase of the
first spectrum to pureabsorption and for all otherexperiments use the samevalues for the phasecorrection (PK)
baseline correction :ABS plot :use XWINPLOT
10
Experiment 2.2- Determination of the 90° 13C Transmitter Pulse Duration
pulse program: zg0dc1D-sequence with F2 decoupling, using p0 for any flip angle. Result is a standard13C NMR spectrum with proton broad-band decoupling.
Setting of the needed channels: F1: 13CF2: 1H
Acquisition parametersPL1 :F1 channel - high power level for 13C
transmitter pulse, here 3 dB was usedP0 :F1 channel - 13C transmitter pulse, 7 usec
for experiment a and 14 usec forexperiment b
PL12 :F2 channel - power level for CPDdecoupling
PCPD2 :F2 channel – 90° pulse fordecoupling sequence
CPD2 :WALTZ16 - CPD decouplingsequence, defined by cpdprg2
D1 :60 sec - relaxation delay D11 :30 msec - delay for disk I/OTD :4 K SW :500 HzO1 :on resonance of 13C signal O2 :middle of 1H NMR spectrumNS :1 RG :receiver gain for correct ADC input
Processing parametersSI :2 K BC_mod :quadWDW :EM LB :1 HzFT :fourier transformation phase correction :adjust the phase of the
first spectrum to pureabsorption and for allother experiments use thesame values for thephase correction (PK)
baseline correction : ABS plot : use XWINPLOT
Experiment 2.3- Determination of the 90° 1H Decoupler Pulse Duration
pulse program: decp901D-sequence to determine the 90° decoupler pulse-duration
Setting of the needed channels: F1: 13CF2: 1H
Acquisition parametersPL1 :F1 channel - high power level for 13C
transmitter pulseP1 :F1 channel - 90° 13C transmitter pulse
PL2 :F2 channel - high power level for 1Hdecoupler pulse, here 0 dB was used
P3 :F2 channel - 1H decoupler pulse, use 1usec as starting value, to be varied
D1 :60 sec - relaxation delay D2 :1/[2J(C,H)]= 2.36 msec, calculated from1J(C,H)=212 Hz
TD :4 K SW :500 HzO1 :on resonance of 13C signal O2 :on resonance of 1H NMR signalNS :1 RG :receiver gain for correct ADC input
11
In a second set of experiments use high decoupler attenuation (PL2=22 dB) and vary it so thatP3 is in the region of 100 usec (for WALTZ).
Processing parametersSI :2 K BC_mod :quadWDW :EM LB :2 HzFT :fourier transformation phase correction :adjust the doublet in
antiphase and use thesame values for the otherphase corrections (PK).
baseline correction :ABS plot :use XWINPLOT
Experiment 2.4- The 90° 1H Pulse with Inverse Spectrometer Configuration
pulse program: zg0compare with Experiment 2.1
Setting of the needed channels: F1: 1HF2: off
Acquisition parametersPL1 :F1 channel - high power level for 1H
transmitter pulseP0 :F1 channel - 1H transmitter pulse, near
360° as starting value, to be variedD1 :5 sec - relaxation delayTD :4 K SW :500 HzO1 :100 Hz towards higher frequency of
CHCl3 signalNS :8 RG : receiver gain for correct ADC input
Processing parametersNo signal processing is required, since the FID is directly observed.
Experiment 2.5- The 90° 13C Decoupler Pulse with Inverse Configuration
pulse program: decp90compare with Experiment 2.3
Setting of the needed channels: F1: 1HF2: 13C
Acquisition parametersPL1 :F1 channel - high power level for 1H
transmitter pulseP1 :F1 channel - 90° 1H transmitter pulse
PL2 :F2 channel - high power level for 13Cdecoupler pulse, here 0 dB was used
P3 :F2 channel - 13C decoupler pulse, 1 usecas starting value, to be varied.
D1 :20 sec - relaxation delay D2 :1/[2J(C,H)]= 2.33 msec, calculated from1J(C,H)=215 Hz
TD :4 K SW :500 HzO1 :on resonance of 1H signal O2 :on resonance of 13C NMR signal
12
NS :1 RG :receiver gain for correct ADC inputIn a second set of experiments use high decoupler attenuation (PL2) and vary it so that P3becomes in the range of 70 usec (for GARP).
Processing parametersSI :2 K BC_mod :quadWDW :EM LB : 1 HzFT :fourier transformation phase correction :adjust the phase of the big
signal descended from theprotons bound to 12C indispersion: look for a cleananti phase pattern of the 13Csatellites and use the samevalues for the next phasecorrection (PK).
baseline correction :ABS plot :use XWINPLOT
Experiment 2.6- Composite Pulses
a)pulse program: exp2_6a.moSequence with a normal 180° pulse to compensate pulse imperfections.
Setting of the needed channels: F1: 1HF2: off
Acquisition parametersPerform two experiments, one with the pulse program exp2_6.mo and one with exp2_2b.mo.Use the same parameters for both experiments.PL1 :F1 channel - high power level for 1H
transmitter pulse, 3dB was used hereP1 :F1 channel – 90° 1H transmitter pulse
P2 :F1 channel – 180° 1H transmitter pulseD1 :30 sec - relaxation delay D15 :10 msec - fixed delayTD :64 K SW :80 ppmO1 :10 kHz towards higher frequencies from
the resonance of the CHCl3 signalNS :8 RG : receiver gain for correct ADC input
Processing parametersUse the same processing parameters for both experimentsSI :32 K BC_mod :quadWDW :EM LB :1 HzFT :fourier transformation phase correction :adjust the phase of the
CHCl3 signal to benegative
baseline correction :ABS plot :use XWINPLOT
b)pulse program: exp2_6b.moA sequence with a 180o composite pulse to compensate pulse imperfections.
Setting of the needed channels: F1: 1HF2: off
13
Acquisition parametersPL1 :F1 channel - high power level for 1H
transmitter pulse, 3dB was used hereP1 :F1 channel – 90° 1H transmitter pulse
P2 :F1 channel – 180° 1H transmitter pulseD1 :30 sec - relaxation delay D15 :10 msec - fixed delayTD :64 K SW :80 ppmO1 :10 kHz towards higher frequencies from
the resonance of the CHCl3 signalNS :8 RG : receiver gain for correct ADC input
Processing parametersUse the same processing parameters for both experimentsSI :32 K BC_mod :quadWDW :EM LB :1 HzFT :fourier transformation phase correction :adjust the phase of the
CHCl3 signal to benegative
baseline correction :ABS plot :use XWINPLOT
Experiment 2.7- Radiation Damping
pulse program: zg0compare with Experiment 2.1
Setting of the needed channels: F1: 1HF2: off
Acquisition parametersPerform two experiments with different pulses.PL1 :F1 channel - high power level for 1H
transmitter pulse (3 dB)P0 :F1 channel - 1H transmitter pulse, a) 360°
and b) 180°D1 :2 sec - relaxation delayTD :4 K SW :500 HzO1 :on resonance of H2O signalNS :1 RG : receiver gain for correct ADC input
Processing parametersprocess the two FIDs with the sameparametersSI :2 K BC_mod :quadWDW :EM LB :0.3 HzFT :fourier transformation phase correction :adjust the phase to pure
absorptionbaseline correction :ABS plot :use XWINPLOT, both traces should be
plotted on the same vertical scale
Experiment 2.8- Pulse and Receiver Phases
pulse program: zg1D-sequence, using a 90o pulse. Result is a routine proton NMR spectrum
14
Setting of the needed channels: F1: 1HF2: off
Acquisition parametersDisplay both quadrature channels of the receiver. Record an FID with the offset on resonanceand change the transmitter phase in the pulse program so that only the left quadrature channelreceives a signal. Then set the offset 50 Hz off resonance and repeat the experiment. Nowchange the transmitter phase in 90o steps and observe the changes on both FID channels andon the spectrum.PL1 :F1 channel - high power level for 1H
transmitter pulse (3 dB)P1 :F1 channel – 90° 1H transmitter pulse
D1 :1 sec - relaxation delayTD :4 K SW :500 HzO1 :50 Hz off resonance of CHCl3 signal NS :1RG : receiver gain for correct ADC input
Processing parametersSI :2 K BC_mod :quadWDW :EM LB :1 HzFT :fourier transformation phase correction :adjust the phase of the first
spectrum for pureabsorption and use thesame values for the otherphase corrections (PK).
baseline correction :ABS plot :use XWINPLOT
Experiment 2.9- Determination of Radiofrequency Power
pulse program: zgcompare with Experiment 2.8
Setting of the needed channels: F1: 1HF2: off
Acquisition parametersPL1 :F1 channel - high power level for 1H
transmitter pulse, 0 dB initial value, to beincreased in 3 dB steps.
P1 :F1 channel - 90° 1H transmitter pulse, to bedeterminred for each attenuation level.
D1 :60 sec - relaxation delayTD :4 K SW :500 HzO1 :on resonance of 1H signalNS :1 RG :receiver gain for correct ADC input
Processing parametersSI :2 K BC_mod :quadWDW : EM LB :1 HzFT :fourier transformation phase correction :adjust the phase to pure
absorption and use the samevalues for the next phasecorrection (PK)..
baseline correction :ABS
15
Chapter 3
- Routine NMR Spectroscopy and Standard Tests
SummaryExperiment Pulse program Description
3.1 zg30 The Standard 1H NMRExperiment
3.2 zgdc30 The Standard 13C NMRExperiment
3.3 zg The Application of WindowFunctions
3.4 zg Computer-aided SpectralAnalysis
3.5 zg Line-Shape Test for 1H NMRSpectroscopy
3.6 zg Resolution Test for 1H NMRSpectroscopy
3.7 zg Sensitivity Test for 1H NMRSpectroscopy
3.8 zgcw Line-Shape Test for 13C NMRSpectroscopy
3.9 zg ASTM Sensitivity Test for 13CNMR Spectroscopy
3.10 zgdc Sensitivity Test for 13C NMRSpectroscopy
3.11 zg Quadrature Image Test
3.12 zg Dynamic Range Test for SignalAmplitudes
3.13 zgphase.mo 13o Phase Stability Test
Experiment 3.1- The Standard 1H NMR Experiment
pulse program: zg301D-sequence, using a 30° flip angle. Result is a routine proton NMR spectrum.
Setting of the needed channels: F1: 1HF2: off
Acquisition parametersPL1 :F1 channel - high power level for 1H
transmitter pulseP1 :F1 channel - 90° 1H transmitter pulse
D1 : 0.1 sec - relaxation delayTD : 32 K SW : 20 ppmO1 : middle of the 1H NMR spectrumNS :8 RG : receiver gain for correct ADC input
Processing parametersSI :16 K BC_mod :quadWDW :EM LB :0.1 Hz
16
FT :fourier transformation phase correction :adjust the phase to pureabsorption.
integration :is done with ABS or can be donemanual
referencing : set the TMS signal to 0 ppm.
baseline correction :ABS peak picking :choose the desired levelplot :use XWINPLOT
Experiment 3.2- The Standard 13C NMR Experiment
pulse program : zgdc301D-sequence with decoupling, using a 30° flip angle. Result is a standard 13C NMRspectrum with proton broad-band decoupling.
Setting of the needed channels: F1: 13CF2: 1H
Acquisition parametersPL1 :F1 channel - high power level for 13C
transmitter pulseP1 :F1 channel - 90° 13C transmitter pulse
PL12 :F2 channel - power level for CPDdecoupling
PCPD2 :F2 channel – 90° pulse for decouplingsequence
CPD2 :WALTZ16 - CPD decoupling sequence,defined by cpdprg2
D1 :0.4 sec - relaxation delay D11 :30 msec - delay for disk I/OTD :32 K SW :250 ppmO1 :middle of the 13C NMR spectrum O2 :middle of 1H NMR spectrumNS :128 DS :2RG :receiver gain for correct ADC input
Processing parametersSI :16 K BC_mod :quadWDW :EM LB :2 HzFT :fourier transformation phase correction :adjust the phases to pure
absorption.referencing :set the TMS signal to 0 ppm. baseline correction :ABSpeak picking :choose the desired level plot :use XWINPLOT
Experiment 3.3- The Application of Window Functions
pulse program: zgcompare with Experiment 2.8
Setting of the needed channels: F1: 1HF2: off
Acquisition parametersPL1 :F1 channel - high power level for 1H
transmitter pulseP1 :F1 channel - 90° 1H transmitter pulse
D1 : 1 sec - relaxation delayTD : 32 K SW : 1 ppm
17
O1 : center of ODCB multipletNS :1 RG : receiver gain for correct ADC input
Processing parametersa) transform FID without any weighting functionb) transform FID with EMc) transform FID with GMSI :16 K BC_mod :quadWDW :EM LB :0.07 HzWDW :GM LB :-0.06 Hz
GB :0.25 HzFT :fourier transformation phase correction :adjust the phase to pure
absorption.plot :use XWINPLOT referencing : set the TMS signal to 0 ppm.
Experiment 3.4- Computer-aided Spectral Analysis
pulse program: zgcompare with Experiment 2.8
Setting of the needed channels: F1: 1HF2: off
Acquisition parametersPL1 :f1 channel - high power level for 1H
transmitter pulseP1 :f1 channel - 90° 1H transmitter pulse
D1 :1 sec - relaxation delayTD :32 K SW :1 ppmO1 :center of ODCB multiplet spinning rate :20 HzNS :1 RG :receiver gain for correct ADC input
Processing parametersSI :32 K BC_mod :quadWDW :noFT :Fourier transformation phase correction :adjust the phase to
pure absorption.baseline correction :ABS plot :use XWINPLOTTransfer the spectrum to a PC. The procedure shown in the book was performed withthe CALM software, obtainable on the Internet.
Experiment 3.5- Line-Shape Test for 1H NMR Spectroscopy
pulse program: zgcompare with Experiment 2.8
Setting of the needed channels: F1: 1HF2: off
18
Acquisition parametersPL1 :f1 channel - high power level for 1H
transmitter pulseP1 :f1 channel - 90° 1H transmitter pulse
D1 :60 sec - relaxation delayTD :32 K SW :500 HzO1 :on resonance of 1H signal spinning rate :20 HzNS :1 RG :receiver gain for correct ADC input
Processing parametersSI :32 K BC_mod :quadWDW :noFT :Fourier transformation phase correction :adjust the phase to
pure absorption.referencing :set the TMS signal to 0 ppm CY :1000 and check, whether the satellites
have a height of 5.5.plot :use XWINPLOT
Experiment 3.6- Resolution Test for 1H NMR Spectroscopy
pulse program: zgcompare with Experiment 2.8
Setting of the needed channels: F1: 1HF2: off
Acquisition parametersPL1 :f1 channel - high power level for 1H
transmitter pulseP1 :f1 channel - 90° 1H transmitter pulse
D1 :1 sec - relaxation delayTD :32 K SW :1 ppmO1 :center of ODCB multiplet spinning rate :20 HzNS :1 RG :receiver gain for correct ADC input
Processing parametersSI :32 K BC_mod :quadWDW :noFT :Fourier transformation phase correction :adjust the phase to
pure absorption.baseline correction :ABS plot :use XWINPLOT
Experiment 3.7- Sensitivity Test for 1H NMR Spectroscopy
pulse program: zgcompare with Experiment 2.8
Setting of the needed channels: F1: 1HF2: off
Acquisition parametersPL1 :f1 channel - high power level for 1H P1 :f1 channel - 90° 1H transmitter pulse
19
transmitter pulseD1 :60 sec - relaxation delayTD :32 K SW :10 ppmO1 :middle of the 1H NMR spectrumNS :1 RG :receiver gain for correct ADC input
Processing parametersSI 32 K BC_mod :quadWDW :EM LB :1 HzFT :Fourier transformation phase correction :adjust the phase to
pure absorption.baseline correction :ABS plot :use XWINPLOT: the full spectrum
should be plotted and the noisebetween 3 ppm and 5 ppm enlargedto allow a correct peak to peak noisemeasurement.
Experiment 3.8- Line-Shape Test for 13C NMR Spectroscopy
pulse program: zgcw1D-sequence with CW decoupling, using 90° flip angle. Depending where O2 isset, different results are possible like an 1H off-resonance decoupled 13C NMRspectrum (O2 on resonance of 1H TMS signal) or an 1H single frequency decoupled13C NMR pectrum (O2 on resonance on a special 1H group).
Setting of the needed channels: F1: 13CF2: 1H
Acquisition parametersPL1 :f1 channel - high power level for 13C
transmitter pulseP1 :f1 channel - 90° 13C transmitter pulse
PL14 :f2 channel - low power level for 1Hdecoupler pulse
decoupler attenuation for continous wavedecoupling
D1 :1 sec - relaxation delay D11 :30 msec - delay for disk I/OTD :16 K SW :200 HzO1 :on resonance of 13C signal O2 :on resonance of 1H signalNS :1 RG :receiver gain for correct ADC inputspinning rate :20 Hz
Processing parametersSI :16 K BC_mod :quadWDW :noFT :Fourier transformation phase correction :adjust the phase to
pure absorption.baseline correction :ABS referencing :set the TMS signal to 0 ppmCY :set the intensity of the main signal to
1000 and check the line-width atheights 500, 5.5 and 1.1.
plot :use XWINPLOT
20
Experiment 3.9- ASTM Sensitivity Test for 13C NMR Spectroscopy
pulse program: zgcompare with Experiment 2.8
Setting of the needed channels: F1: 13CF2: off
Acquisition parametersPL1 :f1 channel - high power level for 13C
transmitter pulseP1 :f1 channel - 90° 13C transmitter pulse
D1 :300 sec - relaxation delayTD :32 K SW :200 ppmO1 :middle of 13C NMR spectrum decoupler :offNS :1 RG :receiver gain for correct ADC input
Processing parametersSI :64 K BC_mod :quadWDW :EM LB :3.5 HzFT :Fourier transformation phase correction :adjust the phase to
pure absorption.baseline correction :ABS plot :use XWINPLOT: the full spectrum
should be plotted and the noisebetween 120 ppm and 80 ppmenlarged to allow a correct peak topeak noise measurement.
Experiment 3.10- Sensitivity Test for 13C NMR Spectroscopy
pulse program: zgdc1D-sequence with F2 decoupling, using 90° flip angle. Result is a standard 13CNMR spectrum with proton broad-band decoupling.
Setting of the needed channels: F1: 13CF2: 1H
Acquisition parametersPL1 :f1 channel - high power level for 13C
transmitter pulseP1 :f1 channel - 90° 13C transmitter pulse
PL12 :f2 channel - power level for CPDdecoupling
PCPD2 :f2 channel – 90° pulse fordecoupling sequence
CPD2 :WALTZ16 - CPD decouplingsequence, defined by cpdprg2
D1 :300 sec – relaxation delay D11 :30 msec - delay for disk I/OTD :64 K SW :200 ppmO1 :middle of 13C NMR spectrum O2 :middle of 1H NMR spectrumNS :1 RG :receiver gain for correct ADC input
Processing parametersSI :64 K BC_mod :quad
21
WDW :EM LB :0.3 HzFT :Fourier transformation phase correction :adjust the phase to
pure absorption.referencing :set the TMS signal to 0 ppmbaseline correction :ABS plot :use XWINPLOT: the full spectrum
should be plotted and the noisebetween 120 ppm and 80 ppmenlarged to allow a correct peak topeak noise measurement.
Experiment 3.11- Quadrature Image Test
pulse program: zgcompare with Experiment 2.8
Setting of the needed channels: F1: 1HF2: off
Acquisition parametersPL1 :f1 channel - high power level for 1H
transmitter pulseP1 :f1 channel - 90° 1H transmitter pulse
D1 :1 sec – relaxation delayTD :8 K SW :1000 HzO1 :250 Hz towards high frequency of
CHCl3 signalNS :1 RG :receiver gain for correct ADC input
Processing parametersSI :4 K BC_mod :quadWDW :EM LB :1 HzFT :Fourier transformation phase correction :adjust the phase to
pure absorption.CY :set the intensity of the CHCl3 signal to
1000 and enlarge the quadratureimage signal, which is found 250 Hztowards higher frequencies from theoffset position.
baseline correction :ABS plot :use XWINPLOT
Experiment 3.12- Dynamic Range Test for Signal Amplitudes
pulse program: zgcompare with Experiment 2.8
Setting of the needed channels: F1: 1HF2: off
Acquisition parametersPL1 :f1 channel - high power level for 1H
transmitter pulseP1 :f1 channel - 90° 1H transmitter pulse
22
D1 :5 sec – relaxation delayTD :32 K SW :10 ppmO1 :middle of 1H NMR spectrumNS :1 RG :receiver gain for correct ADC input
Processing parametersSI :16 K BC_mod :quadWDW :EM LB :0.2 HzFT :Fourier transformation phase correction :carefully correct the
phase of the watersignal, try to detect thevery small signal of t-butanol at 1.28 ppm,and adjust the phaseof this signal as well.
integration :integrate the four relevantsignals and check theintegrals for consistency withthe molar ratios of the fourcompounds in the sample.
baseline correction :ABS plot :use XWINPLOT
Experiment 3.13– 13° Phase Stability Test
pulse program: zgphase.moThe 13° phase stability test shown here transforms phase stability into signalamplitudes and measures the phase stability between two r.f. pulses.
Setting of the needed channels: F1: 1HF2: off
Acquisition parametersUse an automation routine which performs this experiment 64 times in sequencePL1 :f1 channel - high power level for 1H
transmitter pulse, 3dB was usedP1 :f1 channel - 90° 1H transmitter pulse
D1 :20 sec – relaxation delay D20 :1 msec - fixed delayTD :4 K SW :500 HzO1 :37 Hz to higher frequencies from
CHCl3 signalNS :1 RG :receiver gain for correct ADC input
Processing parametersSI :2 K BC_mod :quadWDW :EM LB :1 HzFT :Fourier transformation phase correction :Adjust the phse of the
first spectrum roughlyfor dispersion andalways use the samedigital phase correction(PK)
baseline correction :ABS plot :use XWINPLOT
23
Chapter 4
- Decoupling Techniques
SummaryExperiment Pulse program Description
4.1 zg0hd Decoupler Calibration forHomonuclear Decoupling
4.2 zg0cw Decoupler Calibration forHeteronuclear Decoupling
4.3 zg0cw Low Power Calibration forHeteronuclear Decoupling
4.4 zg0hd Homonuclear Decoupling4.5 Homonuclear Decoupling at Two
Frequencies4.6 zgspt.mo The Homonuclear SPT
Experiment4.7 zgndspt.mo The Heteronuclear SPT
Experiment4.8 zgf2pr.mo 1D Nuclear Overhauser
Difference Spectroscopy4.9 noemul 1D NOE Spectroscopy with
Multiple Selective Irradiation4.10 zg0cw 1H Off-Resonance Decoupled
13C NMR Spectra4.11 zg0gd The Gated 1H-Decoupling
Technique4.12 zg0ig The Inverse Gated 1H-
Decoupling Technique4.13 zg0cw 1H Single Frequency Decoupling
of 13C NMR Spectra4.14 zg0cw2.mo 1H Low Power Decoupling of 13C
NMR Spectra4.15 hetnoe.mo Measurement of the
Heteronuclear OverhauserEffect
Experiment 4.1- Decoupler Calibration for Homonuclear Decoupling
pulse program: zg0hd1D-sequence with homodecoupling, using p0 for any flip angle.By this techniqueresidual multiplets are obtained in which the spin coupling to the irradiated proton ismissing.
Setting of the needed channels: F1: 1HF2: 1H
Acquisition parametersPL1 :f1 channel - high power level for 1H
transmitter pulseP0 :f1 channel - 45° 1H transmitter pulse
PL24 :f2 channel - power level for hd/hc
24
decoupling, to be variedD1 :2 sec – relaxation delay D12 :20 usec - delay for power switchingTD :4 K SW :500 HzO1 :on resonance of 1H signal O2 :50 Hz towards lower frequency from
O1digmod :homodecoupling-digitalNS :1 RG :receiver gain for correct ADC input
Processing parametersSI :4 K or more, use zero-filling to ensure
enough data points for the relativelysmall Bloch-Siegert shifts
BC_mod :quad
WDW :EM LB :0.1 HzFT :Fourier transformation phase correction :adjust the phase to
pure absorption.baseline correction :ABS
Experiment 4.2- Decoupler Calibration for Heteronuclear Decoupling
pulse program: zg0cw1D-sequence with CW decoupling, using p0 for any flip angle. Depending whereO2 is set, different results are possible like an 1H off-resonance decoupled 13CNMR spectrum (O2 on resonance of 1H TMS signal) or an 1H single frequencydecoupled 13C NMR pectrum (O2 on resonance on a special 1H group).
Setting of the needed channels: F1: 13CF2: 1H
Acquisition parametersPL1 :f1 channel - high power level for 13C
transmitter pulseP0 :f1 channel - 45° 13C transmitter pulse
PL14 :f2 channel - power level for cw/hddecoupling, to be varied
D1 :2 sec – relaxation delay D11 :30 msec - delay for disk I/OTD :4 K SW :500 HzO1 :on resonance of 13C signal O2 :50 Hz offset from 1H signalNS :1 RG :receiver gain for correct ADC input
Processing parametersSI :4 K or more, use zero-filling to ensure
enough data points to obtain accuratevalues for the residual splittings
BC_mod :quad
WDW :EM LB :2 HzFT :Fourier transformation phase correction :adjust the phase to
pure absorption.baseline correction :ABS referencing :set the TMS signal to 0 ppm

25
Experiment 4.3- Low Power Calibration for Heteronuclear Decoupling
pulse program: zg0cwcompare with Experiment 4.2
Setting of the needed channels: F1: 13CF2: 1H
Acquisition parametersPL1 :f1 channel - high power level for 13C
transmitter pulseP0 :f1 channel - 45° 13C transmitter pulse
PL14 :f2 channel - power level for cw/hddecoupling, to be varied
D1 :2 sec – relaxation delay D11 :30 msec - delay for disk I/OTD :2 K SW :100 HzO1 :on resonance for carboxyl 13C nucleus
of acetic acidO2 :25 Hz offset from the 1H resonance of
the CH3 group of acetic acidNS :1 RG :receiver gain for correct ADC input
Processing parametersSI :4 K or more, use zero-filling to ensure
enough data points for the reducedsplittings
BC_mod :quad
WDW :EM LB :0.3 HzFT :Fourier transformation phase correction :adjust the phase to
pure absorption.baseline correction :ABS
Experiment 4.4- Homonuclear Decoupling
pulse program: zg0hdcompare with Experiment 4.1
Setting of the needed channels: F1: 1HF2: 1H
Acquisition parametersPL1 :f1 channel – high power level for 1H
transmitter pulseP0 :f1 channel - 45° 1H transmitter pulse
PL14 :f2 channel - power level for cw/hddecoupling
D1 :1 sec – relaxation delay D12 :20 usec - delay for power switchingTD :32 K SW :10 ppmO1 :middle of the 1H NMR spectrum O2 :on resonance of irradiated protonNS :8 digmod :homodecoupling-digitalRG :receiver gain for correct ADC input
Processing parametersSI :16 K BC_mod :quadWDW :EM LB :0.3 Hz
26
FT :Fourier transformation phase correction :adjust the phase topure absorption.
baseline correction :ABS plot :use XWINPLOT
Experiment 4.5- Homonuclear Decoupling at Two Frequencies
pulse program:
Setting of the needed channels: F1: 1HF2: 1H
Acquisition parameters
Processing parameters
Experiment 4.6- The Homonuclear SPT Experiment
pulse program: zgspt.mo1D-sequence, using selective population transfer to provides the relative signinformation of spin coupling constants.
Setting of the needed channels: F1: 1HF2: off
Acquisition parametersPL1 :f1 channel - high power level for 1H
transmitter pulse, 3 dB was usedhere
P0 :f1 channel - 30° 1H transmitter pulse
PL21 :f1 channel - low power level, here90 dB was used (see Exp. 2.6)
P28 :f1 channel - 180° 1H transmitter lowpower pulse, here 0.8 sec was used
D1 :5 sec – relaxation delay D12 :20 usec - delay for power switchingTD :8 K SW :2.5 ppmO1 :on resonance of a chosen multiplet
line of the sampleNS :1 RG :receiver gain for correct ADC input
Processing parametersSI :4 K BC_mod :quadWDW :EM LB :0.1 HzFT :Fourier transformation phase correction :adjust the phase to
pure absorption.baseline correction :ABS plot :use XWINPLOT

27
Experiment 4.7- The Heteronuclear SPT Experiment
pulse program: zgndspt.mo1D-sequence with no decoupling. The heteronuclear selective population transferexperiment is especially able for determining the relative sign of long-range spincoupling constants.
Setting of the needed channels: F1: 13CF2: 1H
Acquisition parametersPL1 :f1 channel - high power level for 13C
transmitter pulseP0 :f1 channel - 45° 13C transmitter pulse
PL14 :f2 channel - power level fordecoupling, γB2=1 Hz, 90 dB wasused here
P10 :f2 channel - 180° 1H decoupler pulse,here 0.4 sec was used
D1 :2 sec – relaxation delay D11 :30 msec - delay for disk I/OD12 :20 usec - delay for power switchingTD :64 K SW :200 ppmO1 :middle of the 13C NMR spectrum O2 :exact transition frequency of a 13C
satellite: adjust O2 to a frequency 2Hzabove that of the left-most line of theproton doublet at 7.5 ppm.
NS :8 RG :receiver gain for correct ADC input
Processing parametersSI :32 K BC_mod :quadWDW :EM LB :0.2 HzFT :Fourier transformation phase correction :use the same values
as for the coupled 13Cspectra (PK)
baseline correction :ABS plot :use XWINPLOT
Experiment 4.8- 1D Nuclear Overhauser Difference Spectroscopy
pulse program: zgf2pr.mo1D-sequence with presaturation in F2. The presaturation of different signals andlater building of differences (substraction of spectra: one with presaturation outsideand one with presaturation of a signal of interest) gives information about the NOE.
Setting of the needed channels: F1: 1HF2: 1H
Acquisition parametersPL1 :f1 channel – high power level for 1H
transmitter pulseP1 :f1 channel - 90° 1H transmitter pulse
PL14 :f2 channel – low power level forcw/hd decoupling, here 70 dB wasused
D1 :0.1 sec – relaxation delay D13 :3 usec - short delayD20 :6 sec - fixed delay

28
TD :32 K SW :10 ppmO1 :middle of the 1H NMR spectrum O2 :on resonance for the methyl protons in
the first experiment and on resonanceof the residual 1H signal of CHCl3 in thereference spectrum
NS :16 DS :4RG :receiver gain for correct ADC input
Processing parametersNOE difference spectra can be processed in different ways. Since one wants toobserve signal intensity changes of 2% to 10%, one should use an exponential windowfunction with LB=2 Hz to minimize artefacts of substraction. One can either transformthe two spectra separatly using a digitally indentical phase correction and substract thetwo spectra, or, more conveniently, substract the two FIDs directly from each other. Inthe difference spectrum, adjust the phase of the methyl group signal to be negative andthe phase of the reference signal (CHCl3) to be positive. Evaluate only signals whichhave correct phase and have therefore not been affected by inadequate spectrometerstability.
Experiment 4.9- 1D NOE Spectroscopy with Multiple Selective Irradiation
pulse program: noemulThis experiment is a technical variant of the NOE difference experiment. Instead ofirradiating the center of a broad multiplet, in the experiment each line of themultiplet is irradiated for a short time with a bandwidth of ca. 1-2 Hz and theirradiating frequency is cycled repeatedly in a stepwise manner through the entiremultiplet during the pre-irradiation time.
Setting of the needed channels: F1: 1HF2: 1H
Acquisition parametersPL1 :f1 channel – high power level for 1H
transmitter pulseP1 :f1 channel - 90° 1H transmitter pulse
PL14 :f2 channel – power level forpresaturation (85 dB)
D1 :0.1 sec – relaxation delay D11 :30 msec - delay for disk I/OD12 :20 usec – delay for power switching D20 :irradiation time per frequency, here
400 msec was usedL4 :overall irradiation time: D20*L4, here 3TD :32 K SW :10 ppmO1 :middle of the 1H NMR spectrum O2 :lists of frequencies within the
multiplets to be irradiatedNS :8 DS :4au-program :noemult for each signal, which should be irradiated
an own list has to be created (noedif.1,noedif.2 ...)
FQ2LIST :noedif.1 average cycles :ns*number of averagecycles, here 4 was used
RG :receiver gain for correct ADC input
Processing parametersNOE difference spectra can be processed in different ways. Since one wants to

29
observe signal intensity changes of 2% to 10%, one should use an exponential windowfunction with LB=2 Hz to minimize artefacts of substraction. One can either transformthe two spectra separatly using a digitally indentical phase correction and substract thetwo spectra, or, more conveniently, substract the two FIDs directly from each other.
Experiment 4.10- 1H Off-Resonance Decoupled 13C NMR Spectra
pulse program: zg0cwcompare with Experiment 4.3
Setting of the needed channels: F1: 13CF2: 1H
Acquisition parametersPL1 :f1 channel - high power level for 13C
transmitter pulseP0 :f1 channel - 45° 13C transmitter pulse
PL14 :f2 channel – power level for cw/hddecoupling, γB2=3500 Hz (see Exp.2.6 and 4.2)
D1 :0.5 sec – relaxation delay D11 :30 msec - delay for disk I/OTD :64 K SW :200 ppmO1 :middle of the 13C NMR spectrum O2 :on resonance of 1H TMS signalNS :512 RG :receiver gain for correct ADC input
Processing parametersSI :32 K BC_mod :quadWDW :EM LB :1 HzFT :Fourier transformation phase correction :adjust the phase to
pure absorption.baseline correction :ABS plot :use XWINPLOT
Experiment 4.11- The Gated 1H-Decoupling Technique
pulse program: zg0gd1D-sequence with gated decoupling, using p0 for any flip angle. This experiment isused for determining C,H spin-spin coupling constants without loosing nuclearOverhauser enhancement.
Setting of the needed channels: F1: 13CF2: 1H
Acquisition parametersPL1 :f1 channel - high power level for 13C
transmitter pulseP0 :f1 channel - 45° 13C transmitter pulse
PL12 :f2 channel - power level for CPDdecoupling
PCPD2 :f2 channel – 90° pulse fordecoupling sequence
PL13 :f2 channel - power level for secondCPD decoupling
CPD2 :WALTZ16 - CPD decouplingsequence, defined by cpdprg2
30
D1 :2 sec – relaxation delay D11 :30 msec - delay for disk I/OTD :64 K SW :200 ppmO1 :middle of the 13C NMR spectrum O2 :middle of 1H NMR spectrumNS :512 RG :receiver gain for correct ADC input
Processing parametersSI :32 K BC_mod :quadWDW :EM (or GM is also possible) LB :0.3 HzFT :Fourier transformation phase correction :adjust the phase to
pure absorption.baseline correction :ABS plot :use XWINPLOT
Experiment 4.12- The Inverse Gated 1H-Decoupling Technique
pulse program: zg0ig1D-sequence with gated decoupling, using p0 for any flip angle. This experimentyields 1H-decoupled NMR spectra of X-nuclei without signal enhancement by thenuclear Overhauser effect.
Setting of the needed channels: F1: 13CF2: 1H
Acquisition parametersPL1 :f1 channel - high power level for 13C
transmitter pulseP0 :f1 channel - 45° 13C transmitter pulse
PL12 :f2 channel - power level for CPDdecoupling
PCPD2 :f2 channel – 90° pulse fordecoupling sequence
CPD2 :WALTZ16 - CPD decouplingsequence, defined by cpdprg2
D1 :10 sec – relaxation delay D11 :30 msec - delay for disk I/OTD :32 K SW :200 ppmO1 :middle of the 13C NMR spectrum O2 :middle of 1H NMR spectrumNS :512 RG :receiver gain for correct ADC input
Processing parametersSI :64 K BC_mod :quadWDW :EM LB :1 HzFT :Fourier transformation phase correction :adjust the phase to
pure absorption.baseline correction :ABS plot :use XWINPLOT
Experiment 4.13- 1H Single Frequency Decoupling of 13C NMR Spectra
pulse program: zg0cwcompare with Experiment 4.2
Setting of the needed channels: F1: 13CF2: 1H

31
Acquisition parametersPL1 :f1 channel - high power level for 13C
transmitter pulseP0 :f1 channel - 45° 13C transmitter pulse
PL14 :f2 channel - power level for cw/hddecoupling, γB2=150 Hz (45 dB wasused here)
D1 :1 sec – relaxation delay D11 :30 msec - delay for disk I/OTD :64 K SW :200 ppmO1 :middle of the 13C NMR spectrum O2 :center of methyl group 1H resonance
at 1.6 ppmNS :8 RG :receiver gain for correct ADC input
Processing parametersSI :32 K BC_mod :quadWDW :EM LB :2 HzFT :Fourier transformation phase correction :adjust the phase to
pure absorption.baseline correction :ABS plot :use XWINPLOT
Experiment 4.14- 1H Low Power Decoupling of 13C NMR Spectra
pulse program: zg0cw2.mo1D-sequence with CW decoupling, using p0 for any flip angle. This techniquecorrelates an 1H signal with 13C signals which are separated by two, three or morebonds.
Setting of the needed channels: F1: 13CF2: 1H
Acquisition parametersPL1 :f1 channel - high power level for 13C
transmitter pulseP0 :f1 channel - 45° 13C transmitter pulse
PL12 :f2 channel - power level for CPDdecoupling
PCPD2 :f2 channel – 90° pulse fordecoupling sequence
PL14 :f2 channel - power level fordecoupler attenuation duringacquisition, γB2=15 Hz (70 dB wasused here)
CPD2 :WALTZ16 - CPD decouplingsequence, defined by cpdprg2
D1 :1 sec – relaxation delay D11 :30 msec - delay for disk I/OD12 :20 usec – delay for power switchingTD :64 K SW :200 ppmO1 :middle of the 13C NMR spectrum O2 :center of 1H signal of the upfield
olefinic protonNS :8 RG :receiver gain for correct ADC input
Processing parametersSI :32 K BC_mod :quadWDW :EM LB :2 HzFT :Fourier transformation phase correction :adjust the phase to
pure absorption.baseline correction :ABS plot :use XWINPLOT
32
Experiment 4.15- Measurement of the Heteronuclear Overhauser Effect
pulse program: hetnoe.moExperiment to measure the heteronuclear Overhauser effect.
Setting of the needed channels: F1: 13CF2: 1H
Acquisition parametersPL1 :f1 channel - high power level for 13C
transmitter pulseP1 :f1 channel - 90° 13C transmitter pulse
PL14 :f2 channel -- power level for cw/hddecoupling
D1 :200 sec – relaxation delay D11 :30 msec - delay for disk I/OD12 :20 usec – delay for power switchingTD :1 K SW :500 HzO1 :on resonance of 13C signal of
cyclohexaneO2 :list of frequencies
Parmod :2D FQ2LIST :freqlist, contains two differentvalues: first value 200 kHz offresonance, second value onresonance of 1H signal ofcyclohexane
NS :8 RG :receiver gain for correct ADC input
Processing parametersau-program :splitser, to get 1D filesSI :1 K BC_mod :quadWDW :EM LB :3 HzFT :Fourier transformation phase correction :adjust the phase of to
pure absorption anduse the same valuesfor the secondexperiment.
baseline correction :ABS integration :is done manual using wmiscand rmisc, measure the twointegrals and divide one bythe other to obtain n+1.
plot :use XWINPLOT
33
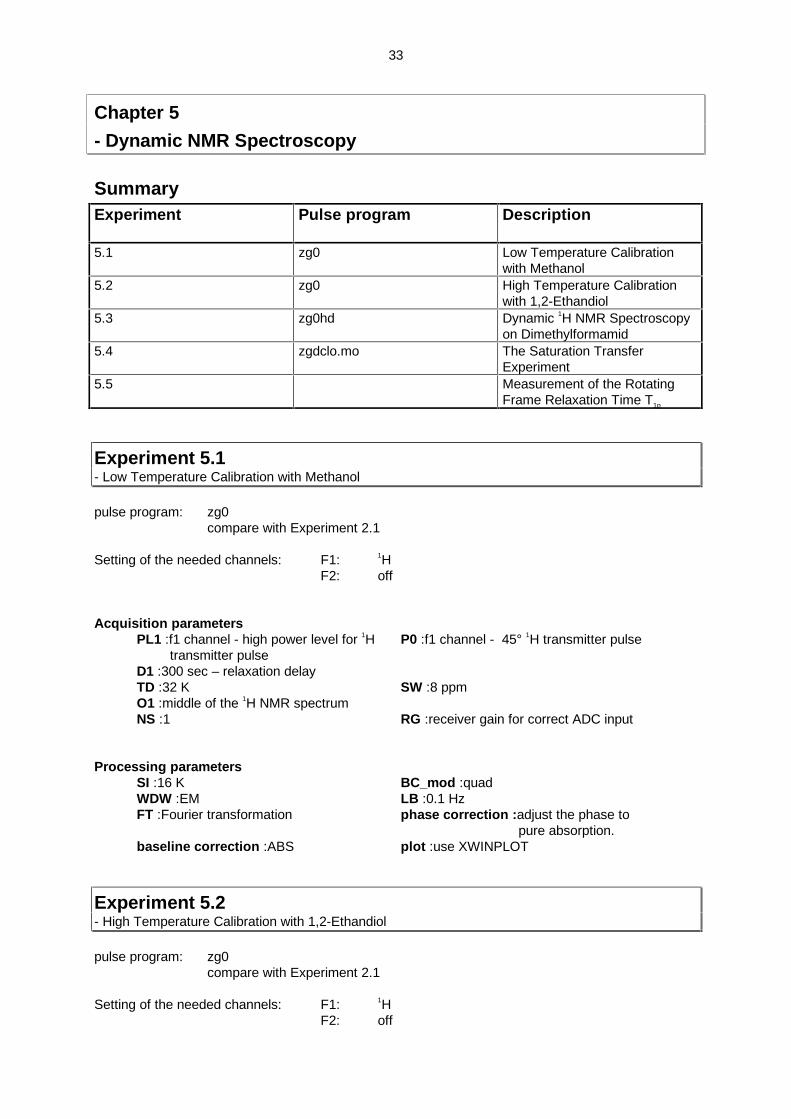
Chapter 5
- Dynamic NMR Spectroscopy
SummaryExperiment Pulse program Description
5.1 zg0 Low Temperature Calibrationwith Methanol
5.2 zg0 High Temperature Calibrationwith 1,2-Ethandiol
5.3 zg0hd Dynamic 1H NMR Spectroscopyon Dimethylformamid
5.4 zgdclo.mo The Saturation TransferExperiment
5.5 Measurement of the RotatingFrame Relaxation Time T1p
Experiment 5.1- Low Temperature Calibration with Methanol
pulse program: zg0compare with Experiment 2.1
Setting of the needed channels: F1: 1HF2: off
Acquisition parametersPL1 :f1 channel - high power level for 1H
transmitter pulseP0 :f1 channel - 45° 1H transmitter pulse
D1 :300 sec – relaxation delayTD :32 K SW :8 ppmO1 :middle of the 1H NMR spectrumNS :1 RG :receiver gain for correct ADC input
Processing parametersSI :16 K BC_mod :quadWDW :EM LB :0.1 HzFT :Fourier transformation phase correction :adjust the phase to
pure absorption.baseline correction :ABS plot :use XWINPLOT
Experiment 5.2- High Temperature Calibration with 1,2-Ethandiol
pulse program: zg0compare with Experiment 2.1
Setting of the needed channels: F1: 1HF2: off
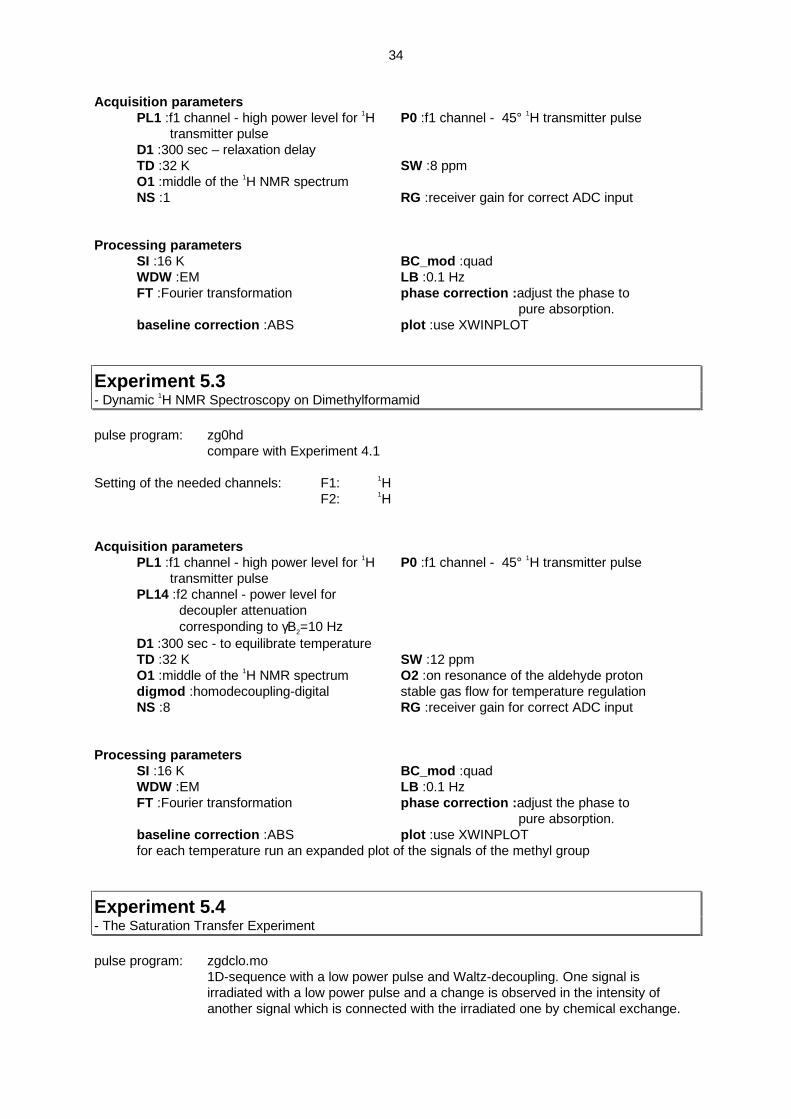
34
Acquisition parametersPL1 :f1 channel - high power level for 1H
transmitter pulseP0 :f1 channel - 45° 1H transmitter pulse
D1 :300 sec – relaxation delayTD :32 K SW :8 ppmO1 :middle of the 1H NMR spectrumNS :1 RG :receiver gain for correct ADC input
Processing parametersSI :16 K BC_mod :quadWDW :EM LB :0.1 HzFT :Fourier transformation phase correction :adjust the phase to
pure absorption.baseline correction :ABS plot :use XWINPLOT
Experiment 5.3- Dynamic 1H NMR Spectroscopy on Dimethylformamid
pulse program: zg0hdcompare with Experiment 4.1
Setting of the needed channels: F1: 1HF2: 1H
Acquisition parametersPL1 :f1 channel - high power level for 1H
transmitter pulseP0 :f1 channel - 45° 1H transmitter pulse
PL14 :f2 channel - power level fordecoupler attenuationcorresponding to γB2=10 Hz
D1 :300 sec - to equilibrate temperatureTD :32 K SW :12 ppmO1 :middle of the 1H NMR spectrum O2 :on resonance of the aldehyde protondigmod :homodecoupling-digital stable gas flow for temperature regulationNS :8 RG :receiver gain for correct ADC input
Processing parametersSI :16 K BC_mod :quadWDW :EM LB :0.1 HzFT :Fourier transformation phase correction :adjust the phase to
pure absorption.baseline correction :ABS plot :use XWINPLOTfor each temperature run an expanded plot of the signals of the methyl group
Experiment 5.4- The Saturation Transfer Experiment
pulse program: zgdclo.mo1D-sequence with a low power pulse and Waltz-decoupling. One signal isirradiated with a low power pulse and a change is observed in the intensity ofanother signal which is connected with the irradiated one by chemical exchange.
35
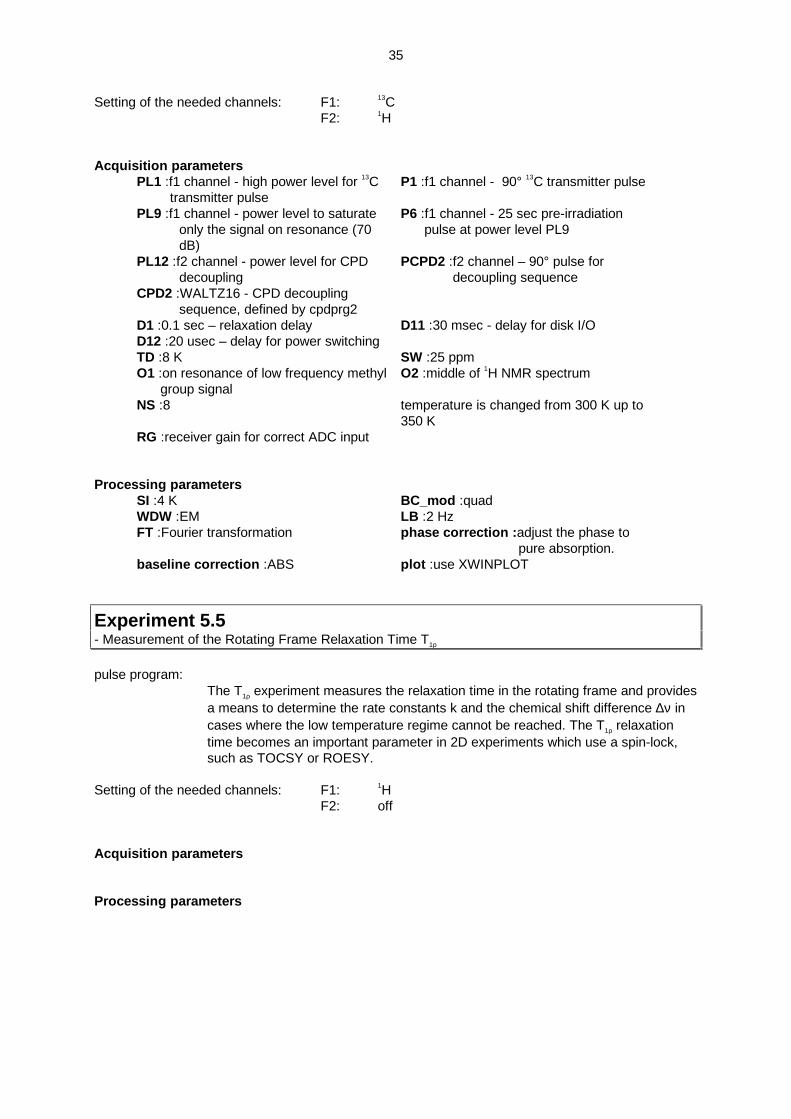
Setting of the needed channels: F1: 13CF2: 1H
Acquisition parametersPL1 :f1 channel - high power level for 13C
transmitter pulseP1 :f1 channel - 90° 13C transmitter pulse
PL9 :f1 channel - power level to saturateonly the signal on resonance (70dB)
P6 :f1 channel - 25 sec pre-irradiationpulse at power level PL9
PL12 :f2 channel - power level for CPDdecoupling
PCPD2 :f2 channel – 90° pulse fordecoupling sequence
CPD2 :WALTZ16 - CPD decouplingsequence, defined by cpdprg2
D1 :0.1 sec – relaxation delay D11 :30 msec - delay for disk I/OD12 :20 usec – delay for power switchingTD :8 K SW :25 ppmO1 :on resonance of low frequency methyl
group signalO2 :middle of 1H NMR spectrum
NS :8 temperature is changed from 300 K up to350 K
RG :receiver gain for correct ADC input
Processing parametersSI :4 K BC_mod :quadWDW :EM LB :2 HzFT :Fourier transformation phase correction :adjust the phase to
pure absorption.baseline correction :ABS plot :use XWINPLOT
Experiment 5.5- Measurement of the Rotating Frame Relaxation Time T1p
pulse program:The T1ρ experiment measures the relaxation time in the rotating frame and providesa means to determine the rate constants k and the chemical shift difference ∆ν incases where the low temperature regime cannot be reached. The T1ρ relaxationtime becomes an important parameter in 2D experiments which use a spin-lock,such as TOCSY or ROESY.
Setting of the needed channels: F1: 1HF2: off
Acquisition parameters
Processing parameters
36
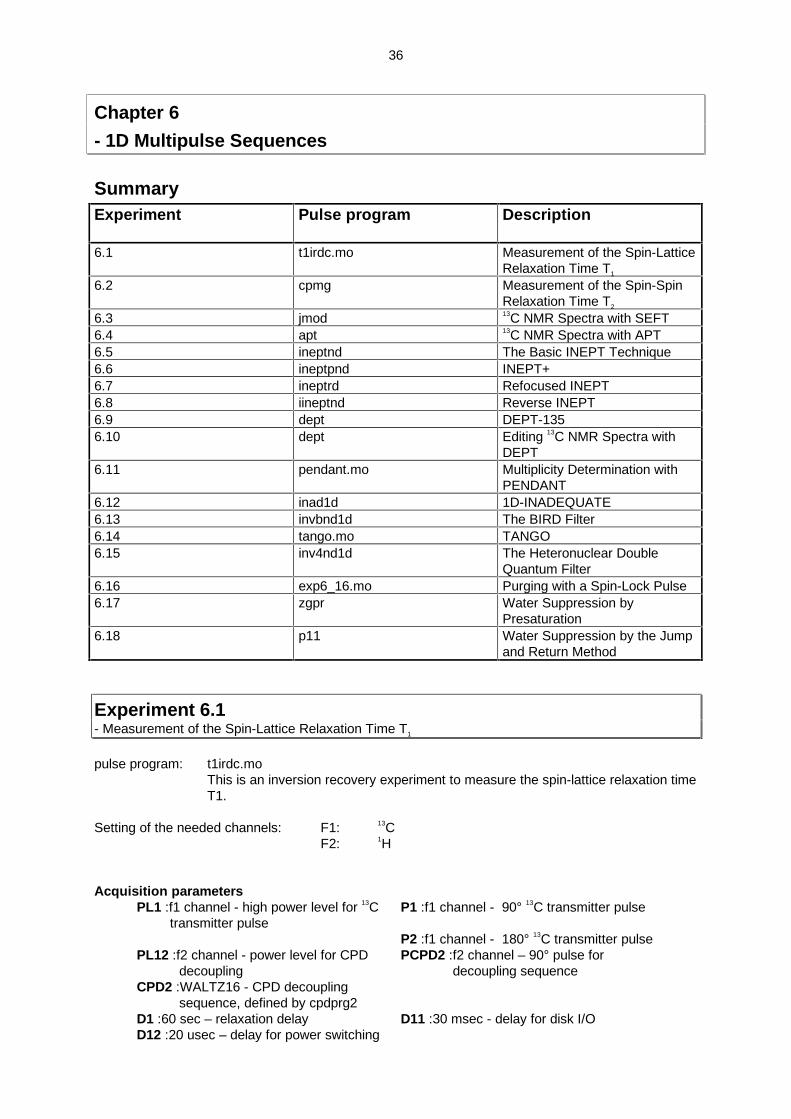
Chapter 6
- 1D Multipulse Sequences
SummaryExperiment Pulse program Description
6.1 t1irdc.mo Measurement of the Spin-LatticeRelaxation Time T1
6.2 cpmg Measurement of the Spin-SpinRelaxation Time T2
6.3 jmod 13C NMR Spectra with SEFT6.4 apt 13C NMR Spectra with APT6.5 ineptnd The Basic INEPT Technique6.6 ineptpnd INEPT+6.7 ineptrd Refocused INEPT6.8 iineptnd Reverse INEPT6.9 dept DEPT-1356.10 dept Editing 13C NMR Spectra with
DEPT6.11 pendant.mo Multiplicity Determination with
PENDANT6.12 inad1d 1D-INADEQUATE6.13 invbnd1d The BIRD Filter6.14 tango.mo TANGO6.15 inv4nd1d The Heteronuclear Double
Quantum Filter6.16 exp6_16.mo Purging with a Spin-Lock Pulse6.17 zgpr Water Suppression by
Presaturation6.18 p11 Water Suppression by the Jump
and Return Method
Experiment 6.1- Measurement of the Spin-Lattice Relaxation Time T1
pulse program: t1irdc.moThis is an inversion recovery experiment to measure the spin-lattice relaxation timeT1.
Setting of the needed channels: F1: 13CF2: 1H
Acquisition parametersPL1 :f1 channel - high power level for 13C
transmitter pulseP1 :f1 channel - 90° 13C transmitter pulse
P2 :f1 channel - 180° 13C transmitter pulsePL12 :f2 channel - power level for CPD
decouplingPCPD2 :f2 channel – 90° pulse for
decoupling sequenceCPD2 :WALTZ16 - CPD decoupling
sequence, defined by cpdprg2D1 :60 sec – relaxation delay D11 :30 msec - delay for disk I/OD12 :20 usec – delay for power switching
37
TD :32 K SW :200 ppmO1 :middle of the 13C NMR spectrum O2 :middle of 1H NMR spectrumNS :8 DS :4VD :variable delay, taken from VD-LIST
(0.5;1;3;6;10;16;24;50 [s])L4 :number of experiments=number of
delays in VD-LIST, here 8TD1 :8 - number of experiments Parmod :2Ddefine VD-LIST RG :receiver gain for correct ADC input
Processing parametersau-program :splitser SI :16 KWDW :EM LB :2 HzXF2 :transformation is only performed in
the F2 directionphase correction :to adjust phase, read
spectrum number 8, inwhich all signals havepositive phase, andtransfer this phasecorrection to all otherspectra (PH_mod: pk)
plot :use XWINPLOT
Experiment 6.2- Measurement of the Spin-Spin Relaxation Time T2
pulse program: cpmg1D-sequence to measure the relaxation time T2 using the Carr-Purcell-Meiboom-Gill sequence.
Setting of the needed channels: F1: 1HF2: off
Acquisition parametersPL1 :f1 channel - high power level for 1H
transmitter pulseP1 :f1 channel - 90° 1H transmitter pulse
P2 :f1 channel - 180° 1H transmitter pulseD1 :150 sec – relaxation delay D11 :30 msec - delay for disk I/OD20 :10 msec – fixed echo time to allow
elimination of diffusion and J-mod.effects
TD :1 K SW :500 HzO1 :on 1H resonanceNS :8 DS :16VC :variable loop counter, taken from vc-
list (2; 20; 50; 100; 200; 300; 400; 500;750; 1000)
L4 :number of experiments = number ofvalues in vc-list (10)
Parmod :2D define VCLISTTD1 :10 – number of experiments RG :receiver gain for correct ADC inputDE :as short as possible
Processing parametersSI(F2) :512 W WDW(F2) :EMLB(F2) :2 Hz XF2 :transformation in F2 directionXF2P :phase correction only for the rows plot :use XWINPLOT
38
Experiment 6.3- 13C NMR Spectra with SEFT
pulse program: jmodThis experiment uses the SEFT (Spin-Echo Fourier Transform) technique. It is thesimplest method of encoding the multiplicity of a 13C signal into the phase of a fullydecoupled 13C NMR spectrum.
Setting of the needed channels: F1: 13CF2: 1H
Acquisition parametersPL1 :f1 channel - high power level for 13C
transmitter pulseP1 :f1 channel - 90° 13C transmitter pulse
P2 :f1 channel - 180° 13C transmitter pulsePL12 :f2 channel - power level for CPD
decouplingPCPD2 :f2 channel – 90° pulse for
decoupling sequenceCPD2 :WALTZ16 - CPD decoupling
sequence, defined by cpdprg2D1 :4 sec – relaxation delay D13 :3 usec - short delayD20 :1/[J(C,H)]= 7 msec, calculated from
1J(C,H)=140 HzTD :64 K SW :200 ppmO1 :middle of the 13C NMR spectrum O2 :middle of 1H NMR spectrumNS :16 DS :4DE :as short as possible RG :receiver gain for correct ADC input
Processing parametersSI :32 K BC_mod :quadWDW :EM LB :2 HzFT :Fourier transformation phase correction :adjust the phase for
the signals of themethyl groups to bepositive and for thecarboxyl nucleusnegative
baseline correction :ABS plot :use XWINPLOT
Experiment 6.4- 13C NMR Spectra with APT
pulse program: aptThe ATP (Attached Proton Test) technique differentiates between C, CH, CH2 andCH3 groups.
Setting of the needed channels: F1: 13CF2: 1H
Acquisition parametersPL1 :f1 channel - high power level for 13C
transmitter pulseP0 :f1 channel - 45° 13C transmitter pulse
P2 :f1 channel - 180° 13C transmitter pulsePL12 :f2 channel – power level for CPD PCPD2 :f2 channel – 90° pulse for
39
decoupling decoupling sequenceCPD2 :WALTZ16 – CPD decoupling
sequence, defined by cpdprg2D1 :2 sec – relaxation delay D11 :30 msec - delay for disk I/OD20 :1/[J(C,H)]= 7 msec, calculated from
1J(C,H)=140 HzD12 :20 usec - delay for power switching
D21 :set equal to preacquisition delay DETD :64 K SW :200 ppmO1 :middle of the 13C NMR spectrum O2 :middle of 1H NMR spectrumNS :512 DS :8RG :receiver gain for correct ADC input
Processing parametersSI :32 K BC_mod :quadWDW :EM LB :2 HzFT :Fourier transformation phase correction :adjust the phase for
the TMS signalpositive and for thecarboxyl nucleusnegative
referencing :set the TMS signal to 0 ppmbaseline correction :ABS plot :use XWINPLOT
Experiment 6.5- The Basic INEPT Technique
pulse program: ineptndThe INEPT (Insensitive Nuclei Enhanced by Polarization Transfer) experimentincrease the sensitivity of hetero nuclei by a polarization transfer from protons viaX, H spin coupling. The result is a coupled X-nucleus NMR spectrum.
Setting of the needed channels: F1: 13CF2: 1H
Acquisition parametersPL1 :f1 channel - high power level for 13C
transmitter pulseP1 :f1 channel - 90° 13C transmitter pulse
P2 :f1 channel - 180° 13C transmitter pulsePL2 :f2 channel - high power level for 1H
decoupler pulseP3 :f2 channel - 90° 1H decoupler pulse
P4 :f2 channel - 180° 1H decoupler pulseD1 :10 sec – relaxation delay D4 :1/[4J(C,H)]= 1.18 msec, calculated
from 1J(C,H)=212 HzTD :4 K SW :500 HzO1 :on resonance of 13C NMR signal O2 :on resonance of 1H NMR signalNS :1 for the first and 4 for the second
experimentDS :16
RG :receiver gain for correct ADC input
Processing parametersSI :2 K BC_mod :quadWDW :EM LB :2 HzFT :Fourier transformation phase correction :adjust the phase for
the signals positive
40
and negativebaseline correction :ABS plot :use XWINPLOT
Experiment 6.6- INEPT+
pulse program: ineptpndThis INEPT version yields coupled polarization-enhanced NMR spectra of X-nucleiwith correct intensities within the multiplets.
Setting of the needed channels: F1: 13CF2: 1H
Acquisition parametersPL1 :f1 channel - high power level for 13C
transmitter pulseP1 :f1 channel - 90° 13C transmitter pulse
P2 :f1 channel - 180° 13C transmitter pulsePL2 :f2 channel - high power level for 1H
decoupler pulseP3 :f2 channel - 90° 1H decoupler pulse
P4 :f2 channel - 180° 1H decoupler pulseD1 :2 sec – relaxation delay D3 :0.375/[J(C,H)]= 2.68 msec, calculated
from 1J(C,H)=140 HzD4 :1/[4J(C,H)]= 1.78 msec, calculated
from 1J(C,H)=140 HzTD :64 K SW :200 ppmO1 :middle of the 13C NMR spectrum O2 :middle of 1H NMR spectrumNS :128 DS :16RG :receiver gain for correct ADC input
Processing parametersSI :32 K BC_mod :quadWDW :EM LB :2 HzFT :Fourier transformation phase correction :adjust the phase for
the signals positiveand negative
baseline correction :ABS plot :use XWINPLOT
Experiment 6.7- Refocused INEPT
pulse program: ineptrdThis variant of INEPT spectroscopy yields proton-decoupled and polarization-enhanced NMR spectra of X-nuclei.
Setting of the needed channels: F1: 13CF2: 1H
Acquisition parametersPL1 :f1 channel - high power level for 13C
transmitter pulseP1 :f1 channel - 90° 13C transmitter pulse
P2 :f1 channel - 180° 13C transmitter pulsePL2 :f2 channel - high power level for 1H P3 :f2 channel - 90° 1H decoupler pulse
41
decoupler pulseP4 :f2 channel - 180° 1H decoupler pulse
PL12 :f2 channel - power level for CPDdecoupling
PCPD2 :f2 channel – 90° pulse fordecoupling sequence
CPD2 :WALTZ16 - CPD decouplingsequence, defined by cpdprg2
D1 :2 sec – relaxation delay D3 :1/[3J(C,H)]= 2.38 msec, calculatedfrom 1J(C,H)=140 Hz
D4 :1/[4J(C,H)]= 1.78 msec, calculatedfrom 1J(C,H)=140 Hz
D12 :20 usec - delay for power switching
TD :64 K SW :200 ppmO1 :middle of the 13C NMR spectrum O2 :middle of 1H NMR spectrumNS :128 DS :16RG :receiver gain for correct ADC input
Processing parametersSI :32 K BC_mod :quadWDW :EM LB :2 HzFT :Fourier transformation phase correction :adjust the phase for
the signals positiveand negative
baseline correction :ABS plot :use XWINPLOT
Experiment 6.8- Reverse INEPT
pulse program: iineptndThis experiment is an inverse INEPT sequence without decoupling. Starting fromX-nucleus magnetization, the X, H spin coupling is observed by proton detection.
Setting of the needed channels: F1: 1HF2: 13C
Acquisition parametersPL1 :f1 channel - high power level for 1H
transmitter pulseP1 :f1 channel - 90° 1H transmitter pulse
P2 :f1 channel - 180° 1H transmitter pulsePL2 :f2 channel - high power level for 13C
decoupler pulseP3 :f2 channel - 90° 13C decoupler pulse
P4 :f2 channel - 180o 13C decoupler pulseD1 :30 sec – relaxation delay D4 :1/[4J(C,H)]= 1.19 msec, calculated
from 1J(C,H)=214 HzTD :4 K SW :500 HzO1 :on resonance of 1H NMR signal O2 :on resonance of 13C NMR signalNS :8 DS :16RG :receiver gain for correct ADC input
Processing parametersSI :2 K BC_mod :quadWDW :EM LB :0.5 HzFT :Fourier transformation phase correction :adjust the phase for
the satellites positiveand negative
baseline correction :ABS plot :use XWINPLOT
42
Experiment 6.9- DEPT-135
pulse program: deptThe DEPT (Distortionless Enhancement by Poarization Transfer) experiment usesa polarization transfer from protons to an X-nucleus to increase the signal strength.
Setting of the needed channels: F1: 13CF2: 1H
Acquisition parametersPL1 :f1 channel - high power level for 13C
transmitter pulseP0 :f1 channel - 135° 13C transmitter pulse
P1 :f1 channel - 90° 13C transmitter pulseP2 :f1 channel - 180° 13C transmitter pulse
PL2 :f2 channel - high power level for 1Hdecoupler pulse
P3 :f2 channel - 90° 1H decoupler pulse
P4 :f2 channel - 180° 1H decoupler pulsePL12 :f2 channel - power level for CPD
decouplingPCPD2 :f2 channel – 90° pulse for
decoupling sequenceCPD2 :WALTZ16 - CPD decoupling
sequence, defined by cpdprg2D1 :2 sec – relaxation delay D2 :1/[2J(C,H)]= 3.5 msec, calculated from
1J(C,H)=140 HzD12 :20 usec – delay for power switchingTD :64 K SW :200 ppmO1 :middle of the 13C NMR spectrum O2 :middle of 1H NMR spectrumNS :512 DS :8RG :receiver gain for correct ADC input
Processing parametersSI :32 K BC_mod :quadWDW :EM LB :2 HzFT :Fourier transformation phase correction :adjust the phase for
the TMS signalpositive
baseline correction :ABS plot :use XWINPLOT
Experiment 6.10- Editing 13C NMR Spectra with DEPT
pulse program: deptcompare with Experiment 6.9
Setting of the needed channels: F1: 13CF2: 1H
Acquisition parametersPL1 :f1 channel - high power level for 13C
transmitter pulseP1 :f1 channel - 90° 13C transmitter pulse
P2 :f1 channel - 180° 13C transmitter pulsePL2 :f2 channel - high power level for 1H
decoupler pulseP3 :f2 channel - 90° 1H decoupler pulse
43
P4 :f2 channel - 180° 1H decoupler pulseP0 :f1 channel – use 45°, 90° and 135° 1H decoupler pulse for three successive spectra
a, b and c. Spectrum a will give the signals of CH, CH2 and CH3 groups positive; bgives only the signals of CH groups, and c gives the signals of CH and CH3 groupspositive and the signals of CH2 groups negative. The second spectrum b gives aclear indication whether the decoupler pulse is determined correctly.
PL12 :f2 channel - power level for CPDdecoupling
PCPD2 :f2 channel – 90° pulse fordecoupling sequence
CPD2 :WALTZ16 - CPD decouplingsequence, defined by cpdprg2
D1 :2 sec – relaxation delay D2 :1/[2J(C,H)]= 3.5 msec, calculated from1J(C,H)=140 Hz
D12 :20 usec – delay for power switchingTD :64 K SW :200 ppmO1 :middle of the 13C NMR spectrum O2 :middle of 1H NMR spectrumNS :512 DS :8RG :receiver gain for correct ADC input
Processing parametersSI :32 K BC_mod :quadWDW :EM LB :2 HzFT :Fourier transformationphase correction :adjust the phase for spectrum a to pure absorption, for spectrum b
also and for spectrum c adjust the phase of the CH and the CH3
groups positive and the CH2 groups negative. For editing purposesthe three spectra have to be further manipulated. This is done in thedual mode. Substraction of b from a yields spectrum d, where thesignals of CH2 and CH3 groups both remain positive. Substractionof b from c yields spectrum e, where the signals of CH2 are negativeand those of the CH3 groups remain positive. Substraction of e fromd yields f with only signals of CH2 groups, whereas addition of e to dyields spectrum g with only signals of the CH3 groups.
baseline correction :ABS plot :use XWINPLOT
Experiment 6.11- Multiplicity Determination with PENDANT
pulse program: pendant.moThe PENDANT (Polarization Enhancement During Attached Nucleus Testing)method is a method for distinguishing CH, CH2, CH3 and quaternary carbons withthe same sensitivity like DEPT.
Setting of the needed channels:F1: 13CF2: 1H
Acquisition parametersPL1 :f1 channel - high power level for 13C
transmitter pulseP1 :f1 channel - 90° 13C transmitter pulse
P2 :f1 channel - 180° 13C transmitter pulsePL2 :f2 channel - high power level for 1H
decoupler pulseP3 :f2 channel - 90° 1H decoupler pulse
P4 :f2 channel - 180° 1H decoupler pulsePL12 :f2 channel - power level for CPD
decouplingPCPD2 :f2 channel – 90° pulse for
decoupling sequenceCPD2 :WALTZ16 - CPD decoupling
44
sequence, defined by cpdprg2D1 :2 sec – relaxation delay D4 :1/[4J(C,H)]= 1.72 msec, calculated
from 1J(C,H)=145 HzD12 :20 usec – delay for power switching D15 :5/[8J(C,H)]= 4.31 msec, calculated
from 1J(C,H)=145 HzTD :64 K SW :250 ppmO1 :middle of 13C NMR spectrum O2 :middle of 1H NMR spectrumNS :16 DS :8RG :receiver gain for correct ADC input DE :as short as possible
Processing parametersSI :32 K BC_mod :quadWDW :EM LB :2 HzFT :Fourier transformation phase correction :adjust the phase for
the signals of themethyl groups to bepositive and for thecarcoxyl nucleusnegative.
baseline correction :ABS plot :use XWINPLOT
Experiment 6.12- 1D-INADEQUATE
pulse program: inad1dThis is a 1D-INADEQUATE sequence.
Setting of the needed channels: F1: 13CF2: 1H
Acquisition parametersPL1 :f1 channel - high power level for 13C
transmitter pulseP1 :f1 channel - 90° 13C transmitter pulse
P2 :f1 channel - 180° 13C transmitter pulsePL12 :f2 channel - power level for CPD
decouplingPCPD2 :f2 channel – 90° pulse for
decoupling sequenceCPD2 :WALTZ16 - CPD decoupling
sequence, defined by cpdprg2D1 :3 sec – relaxation delay D4 :1/[4J(C,C)]= 7.6 msec, calculated from
1J(C,C)=33 HzD11 :30 msec – delay for disk I/O D13 :3 usec - short delayTD :32 K SW :60 ppm (spectral range for C6H13OH)O1 :40 ppm downfield from TMS (middle of
that range)O2 :middle of 1H NMR spectrum
NS :512 DS :16RG :receiver gain for correct ADC input
Processing parametersSI :64 K BC_mod :quadWDW :EM LB :0.5 HzFT :Fourier transformation phase correction :adjust the signals
positive and negativebaseline correction :ABS plot :use XWINPLOT
45
Experiment 6.13- The BIRD Filter
pulse program: invbnd1dWith this experiment a suppression for signals from protons bond to 12C isperformed with a BIRD (Bilinear Rotation Decoupling) sandwich. It rotates themagnetization of the protons attached to 12C into the -z direction of the rotatingframe, but leaves the magnetization of the 13C- bond protons unchanged. If onewaits a suitable time after the BIRD sandwich, the signals of the protons bond to12C are at the null point and therefore not excited during the following pulsesequence. The sequence is without decoupling.
Setting of the needed channels: F1: 1HF2: 13C
Acquisition parametersPL1 :f1 channel - high power level for 1H
transmitter pulseP1 :f1 channel - 90° 1H transmitter pulse
P2 :f1 channel - 180° 1H transmitter pulsePL2 :f2 channel - high power level for 13C
decoupler pulseP4 :f2 channel - 180° 13C decoupler pulse
D1 :60 sec – relaxation delay D2 :1/[2J(C,H)]= 2.38 msec, calculatedfrom 1J(C,H)=214 Hz
D7 :20 sec - to be varied D13 :3 usec - short delayTD :4 K SW :500 HzO1 :on 1H resonance O2 :on 13C resonanceNS :4 DS :4RG :receiver gain for correct ADC input
Processing parametersSI :2 K BC_mod :quadWDW :EM LB :1 HzFT :Fourier transformation phase correction :correct the satellites
positivebaseline correction :ABS plot :use XWINPLOT
Experiment 6.14- TANGO
pulse program: tango.moThe TANGO (Testing for Adjacent Nuclei with a Gyration Operator) sequenceintroduces a 90o phase angle between the protons bond to 13C and the protonsbond to 12C.
Setting of the needed channels: F1: 1HF2: 13C
Acquisition parametersPL1 :f1 channel - high power level for 1H
transmitter pulseP1 :f1 channel - 90° 1H transmitter pulse
P2 :f1 channel - 180° 1H transmitter pulsePL2 :f2 channel - high power level for 13C
decoupler pulseP4 :f2 channel - 180° 13C decoupler pulse
46
D1 :20 sec – relaxation delay D2 :1/[2J(C,H)]= 2.38 msec, calculatedfrom 1J(C,H)=214 Hz
D12 :20 usec – delay for power switchingTD :4 K SW :500 HzO1 :on 1H resonance O2 :on 13C resonanceNS :8 DS :8RG :receiver gain for correct ADC input
Processing parametersSI :2 K BC_mod :quadWDW :EM LB :1 HzFT :Fourier transformation phase correction :correct the satellites
positive.baseline correction :ABS plot :use XWINPLOT
Experiment 6.15- The Heteronuclear Double Quantum Filter
pulse program : inv4nd1dThis experiment suppress the main signal of protons attached to 12C or 14N using adouble quantum filter, where single quantum magnetization is filtered out by thephase cycle.
Setting of the needed channels: F1: 1HF2: 13C
Acquisition parametersPL1 :f1 channel - high power level for 1H
transmitter pulseP1 :f1 channel - 90° 1H transmitter pulse
PL2 :f2 channel - high power level for 13Cdecoupler pulse
P3 :f2 channel - 90° 13C decoupler pulse
D1 :200 sec – relaxation delay D2 :1/[2J(C,H)]= 2.38 msec, calculatedfrom 1J(C,H)=214 Hz
D12 :20 usec – delay for power switching D13 :3 usecTD :4 K SW :500 HzO1 :on 1H resonance O2 :on 13C resonanceNS :8 DS :8RG :receiver gain for correct ADC input
Processing parametersSI :2 K BC_mod :quadWDW :EM LB :0.1 HzFT :Fourier transformation phase correction :correct the satellites
positivebaseline correction :ABS plot :use XWINPLOT
Experiment 6.16- Purging with a Spin-Lock Pulse
pulse program : exp6_16.moThis experiment uses a spin-lock pulse to select protons attached to 13C.

47
Setting of the needed channels: F1: 1HF2: 13C
Acquisition parametersPL1 :f1 channel - high power level for 1H
transmitter pulse, 3 dB was usedhere
P1 :f1 channel - 90° 1H transmitter pulse
P2 :f1 channel - 180° 1H transmitter pulseP28 :f1 channel - spin-lock pulse, 2 msec, be sure, that your power is not to high!The transmitter pulse with power level pl1should be not shorter than 6 usec.
PL2 :f2 channel - high power level for 13Cdecoupler pulse
P4 :f2 channel - 180° 13C decoupler pulse
D1 :10 sec – relaxation delay D4 :1/[4J(C,H)]= 1.16 msec, calculatedfrom 1J(C,H)=215 Hz
TD :4 K SW :500 HzO1 :on 1H resonance O2 :on 13C resonanceNS :1 DS :4RG :receiver gain for correct ADC input
Processing parametersSI :2 K BC_mod :quadWDW :EM LB :0.1 HzFT :Fourier transformation phase correction :correct the satellites up
and downbaseline correction :ABS plot :use XWINPLOT
Experiment 6.17- Water Suppression by Presaturation
pulse program: zgpr1D-sequence with F1 presaturation. Sometimes, there is a need to suppress thehuge solvent signal.
Setting of the needed channels: F1: 1HF2: off
Acquisition parametersPL1 :f1 channel - high power level for 1H
transmitter pulseP1 :f1 channel - 90° 1H transmitter pulse
PL9 :f1 channel - power level forpresaturation
D1 :2 sec – relaxation delay D12 :20 usec - delay for power switchingD13 :3 usec – short delayTD :32 K SW :10 ppmO1 :on resonance of water signal DS :2NS :8 RG :receiver gain for correct ADC inputfor inverse probeheads: spinner off
Processing parametersSI :16 K BC_mod :quad
48
WDW :no FT :Fourier transformationphase correction :adjust the phase to
pure absorption.referencing :set the TMS signal to 0 ppm
baseline correction :ABS plot :use XWINPLOT
Experiment 6.18- Water Suppression by the Jump and Return Method
pulse program: p11Water suppression with the jump and return method which does not affectexchangeable protons.
Setting of the needed channels: F1: 1HF2: off
Acquisition parametersPL1 :f1 channel - high power level for 1H
transmitter pulseP0 :f1 channel - 90° 1H transmitter pulse
P1 :f1 channel - 90° 1H transmitter pulseD1 :2 sec – relaxation delay D19 :125 usec - delay for binominal water
suppression (D19=(1/2*d),d=distance of next null (in Hz))
TD :32 K SW :10 ppmO1 :on resonance of water signal DS :2NS :8 RG :receiver gain for correct ADC input
Processing parametersSI :16 K BC_mod :quadWDW :EM LB :0.1 HzFT :Fourier transformation phase correction :adjust the phase of the
small signals to bepositive, the watersignal is in dispersion
baseline correction :ABS referencing :set the TMS signal to 0 ppmplot :use XWINPLOT

49
Chapter 7
- NMR Spectroscopy with Selective Pulses
SummaryExperiment Pulse program Description
7.1 selzg Determination of a Shaped 90o
1H Transmitter Pulse7.2 decp90sp.mo Determination of a Shaped 90o
1H Decoupler Pulse7.3 decp90sp.mo Determination of a Shaped 90o
13C Decoupler Pulse7.4 dante.mo Selective Excitation with DANTE7.5 selco SELCOSY7.6 selincor.mo SELINCOR: Selective Inverse
H,C Correlation via 1J (C,H)7.7 selina SELINQUATE7.8 selmlzf Selective TOCSY7.9 selinapt.mo INAPT7.10 sellr.mo Determination of Long-Range
C,H Coupling Constants7.11 selreso.mo SELRESOLV7.12 serf.mo SERF
Experiment 7.1- Determination of a Shaped 90o 1H Transmitter Pulse
pulse program: selzgAn experiment to determine the 90o shaped pulse. It must be determined byvarying the attenuation of the transmitter and not the pulse duration.
Setting of the needed channels: F1: 1HF2: off
Acquisition parametersPL1 :f1 channel - high power level for 1H
transmitter pulseP1 :f1 channel - 90° 1H transmitter pulse
P2 :f1 channel - 180° 1H transmitter pulseSP1 :f1 channel - power level for shaped
pulse, to be varied in steps of 2 dB,initial value 90 dB
P11 :f1 channel – 90° (or 270°) shapedpulse, 50 msec was used here
D1 :20 sec – relaxation delayTD :4 K SW :500 HzO1 :on 1H resonance NS :1PHCOR :difference in phases between
power level SP1 and PL1Gaussian shape with 1024 data points wasused
RG :receiver gain for correct ADC input
Processing parametersSI :2 K BC_mod :quadWDW :EM LB :0.1 Hz
50
FT :Fourier transformation phase correction :adjust the phase topure absorption.
baseline correction :ABS
Experiment 7.2- Determination of a Shaped 90o 1H Decoupler Pulse
pulse program: decp90sp.moThis experiment is used to calibrate the shaped 90o decoupler pulse duration.
Setting of the needed channels: F1: 13CF2: 1H
Acquisition parametersPL1 :f1 channel - high power level for 13C
transmitter pulseP1 :f1 channel - 90° 13C transmitter pulse
PL2 :f2 channel - high power level for 1Hdecoupler pulse
P3 :f2 channel - leave at 0 for thedetermination of the correctattenuation of the shaped pulse. Forphase determination set to hard 90° 1Hdecoupler pulse.
PL21 :f1 channel - low power level, 15 dBwas used here
P28 :f1 channel - spin-lock pulse,length=P13
SP2 :2 channel - power level for shapedpulse, initial value 80 dB, to be varied
P13 :f2 channel – 90° shaped pulse, 30msec
D1 :10 sec – relaxation delay D2 :1/[2J(C,H)]= 2.36 msec, calculatedfrom 1J(C,H)=212 Hz
TD :4 K SW :500 HzO1 :on 13C resonance O2 :on 1H resonanceNS :1 Gaussian shape with 1024 data points was
usedRG :receiver gain for correct ADC input
Processing parametersSI :2 K BC_mod :quadWDW :EM LB :2 HzFT :Fourier transformation phase correction :adjust the satellites up
and downbaseline correction :ABS plot :use XWINPLOT
Experiment 7.3- Determination of a Shaped 90o 13C Decoupler Pulse
pulse program: decp90sp.mocompare with Experiment 7.2
Setting of the needed channels: F1: 1HF2: 13C
Acquisition parametersPL1 :f1 channel - high power level for 1H
transmitter pulseP1 :f1 channel - 90° 1H transmitter pulse
51
P2 :f1 channel - 180° 1H transmitter pulsePL2 :f2 channel - high power level for 13C
decoupler pulseP3 :f2 channel - leave at 0 for the
determination of the correctattenuation of the shaped pulse. Forphase determination set to hard 90°13C decoupler pulse.
PL21 :f1 channel - low power level, typicalattenuation 12 dB
P28 :f1 channel - spin-lock pulse,length=P13
SP2 :f2 channel - power level for shapedpulse, to be varied, initial value 80dB
P13 :f2 channel – 90° shaped pulse, 10msec
D1 :10 sec – relaxation delay D2 :1/[2J(C,H)]= 2.33 msec, calculatedfrom 1J(C,H)=215 Hz
TD :4 K SW :500 HzO1 :on 1H resonance O2 :on 13C resonanceNS :1 Gaussian shape with 1024 data points was
usedRG :receiver gain for correct ADC input
Processing parametersSI :2 K BC_mod :quadWDW :EM LB :0.1 HzFT :Fourier transformation phase correction :adjust the satellites up
and downbaseline correction :ABS plot :use XWINPLOT
Experiment 7.4- Selective Excitation with DANTE
pulse program: dante.mo1D-sequence to excite a single resonance selectively, also with older instrumentspossible.
Setting of the needed channels: F1: 13CF2: 1H
Acquisition parametersPL9 :f1 channel - low power level for 13C
transmitter pulseP0 :f1 channel - 1° 13C transmitter pulse
PL12 :f2 channel - power level for CPDdecoupling
PCPD2 :f2 channel – 90° pulse fordecoupling sequence
CPD2 :WALTZ16 - CPD decouplingsequence, defined by cpdprg2
D1 :2 sec – relaxation delay D12 :20 usec - delay for power switchingD15 :0.5 msec –yielding a total length of
DANTE excitation of 25 msecL4 :number of pulse P0, here 50 was used
TD :4 K SW :10 ppmO1 :on 13C resonance of the selected
methyl groupO2 :middle of 1H NMR spectrum
DS :4 NS :128RG :receiver gain for correct ADC input
52
Processing parametersSI :2 K BC_mod :quadWDW :EM LB :0.5 HzFT :Fourier transformation phase correction :adjust the phase to
pure absorption.baseline correction :ABS plot :use XWINPLOT
Experiment 7.5- SELCOSY
pulse program: selcoThis is a 1D variant of the 2D COSY. The selective COSY method yields the sameconnectivity information as the homonuclear decoupling technique.
Setting of the needed channels: F1: 1HF2: off
Acquisition parametersPL1 :f1 channel - high power level for 1H
transmitter pulseP1 :f1 channel - 90° 1H transmitter pulse
SP1 :f1 channel - power level for shapedpulse
P11 :f1 channel – 90° shaped pulse, 50msec was used here
D1 :2 sec – relaxation delay D13 :3 usec - short delayD14 :∼1/[2J(H,H)], typically 37 msec,
calculated from 1J(H,H)=8 HzTD :32 K SW :10 ppmO1 :on resonance of selected signal or use
SPOFFSGaussian shape with 1024 data points wasused
NS :16 DS :4RG :receiver gain for correct ADC input
Processing parametersSI :16 K BC_mod :quadWDW :EM LB :0.1 HzFT :Fourier transformation phase correction :note that the selective
COSY producesantiphase signals ofthe active couplingpartners
plot :use XWINPLOT
Experiment 7.6- SELINCOR: Selective Inverse H,C Correlation via 1J (C,H)
pulse program: selincor.moThis experiment is the selective 1D version of the 2D inverse H,C correlation. Theexperiment correlates a selected carbon atom with the attached proton via onebond C,H coupling, using proton sensitivity for observation.
Setting of the needed channels: F1: 1HF2: 13C
53
Acquisition parametersPL0 :f2 channel - 120 dB fixed power levelPL1 :f1 channel - high power level for 1H
transmitter pulseP1 :f1 channel - 90° 1H transmitter pulse
P2 :f1 channel - 180° 1H transmitterpulse
PL2 :f2 channel - high power level for 13Cdecoupler pulse
P3 :f2 channel - 90° 13C decoupler pulse
P4 :f2 channel - 90° 13C decoupler pulseSP2 :f2 channel - power level for shaped
pulseP13 :f2 channel - 90° or 270° shaped
pulse, 5 msecD1 :1 sec – relaxation delay D2 :1/[2J(C,H)]= 3.57 msec, calculated
from 1J(C,H)=140 HzD7 :2.5 sec – BIRD delay, to be optimized
for minimum FID; observe in the set-upmode the incoming FID and adjust D7for minimum intensity
D20 :same length as selective pulse P13,5 msec was used here
TD :32 K SW :10 ppmO1 :middle of 1H NMR signal O2 :on resonance of selected 13C nucleusNS :32 DS :4Gaussian shape with 1024 data points wasused
RG :receiver gain for correct ADC input
Processing parametersSI :16 K BC_mod :quadWDW :EM or MC (if the phase of the
satellites are not very pure)LB :0.1 Hz
FT :Fourier transformation phase correction :adjust the phase topure absorption(WDW=MC no phasecorrection isnecessary)
plot :use XWINPLOT
Experiment 7.7- SELINQUATE
pulse program: selinaThis is the selective version of the INADEQUATE (Incredible Natural AbundanceDouble QUAtum Transfer). It is possible to measure specific 13C, 13C couplingconstants over one or more bonds selectively with the high digital resolution of an1D method. The experiment yields connectivity information for the irradiatedcarbon nucleus and 13C, 13C spin coupling constants with high accuracy.
Setting of the needed channels: F1: 13CF2: 1H
Acquisition parametersPL1 :f1 channel - high power level for 13C
transmitter pulseP1 :f1 channel - 90° 13C transmitter pulse
P2 :f1 channel - 180° 13C transmitter pulseSP1 :f1 channel - power level for shaped
pulseP11 :f1 channel - 270° shaped pulse, 10
msec was used herePL12 :f2 channel - power level for CPD
decouplingPCPD2 :f2 channel - 90°pulse for
decoupling sequence
54
CPD2 :WALTZ16 - CPD decouplingsequence, defined by cpdprg2
D1 :4 sec – relaxation delay D11 :30 msec - delay for disk I/OD4 :1/[4J(C,C)]= 7.6 msec, calculated from
1J(C,C)=33 Hz, for long rangecouplings J(C,C)=4 Hz= 62.5 msec
D13 :3 usec - short delay
TD :16 K SW :23 ppmO1 : on resonance of selected signal or
use SPOFFSO2 :middle of 1H NMR spectrum
NS :256 DS :4PHCOR3 :difference of phases between
power level SP1 and PL1Gaussian shape with 1024 data points wasused
RG :receiver gain for correct ADC input
Processing parametersSI :8 K BC_mod :quadWDW :EM LB :2 HzFT :Fourier transformation phase correction :.note that the
experiment yields 13Csatellites in antiphase.The residual signal ofthe moleculecontaining only one13C atom should notbe used for phasing.
plot :use XWINPLOT
Experiment 7.8- Selective TOCSY
pulse program: selmlzf.moThis experiment is the selective 1D version of the 2D TOCSY (TOtal CorrelationSpectroscopY) method. One proton is excited by a shaped pulse and this producesa response from all protons that are connected by spin coupling within a chain.
Setting of the needed channels: F1: 1HF2: off
Acquisition parametersPL0 :f1 channel - 120 dB, fixed power levelPL1 :f1 channel - high power level for 1H
transmitter pulseP1 :f1 channel - 90° 1H transmitter pulse
SP1 :f1 channel - power level for shapedpulse
P11 :f1 channel - 270° shaped pulse, 50msec was used here
PL10 :f1 channel - power level for TOCSY-spinlock, 12 dB was used here
P5 :f1 channel - 60° low power pulse
P6 :f1 channel - 90° low power pulse [40usec]
P7 :f1 channel - 180° low power pulseP17 :f1 channel - trim pulse [2.5 msec]
D1 :2 sec – relaxation delay D11 :30 msec - delay for disk I/OD9 :200 msec – TOCSY mixing time D14 :delay for evolution after shaped
pulse: for self-refocussing pulse 20usec
D13 :3 usec – short delay
55
VD :variable delay, taken from vd-list to beused for z-filter:
Example for z-filter list:0.004s;0.016s;0.010s;0.006s;0.004s;0.010s;0.017s;0.011s;0.018s;0.012s
L4 :number of delays in VD-list (10)
TD :32 K SW :10 ppmO1 :on resonance of selected signal or use
SPOFFSdefine VDLIST
PHCOR1 :difference in phases betweenpower level SP1 and PL10
Gaussian shape with 1000 data points wasused
NS :8 DS :4RG :receiver gain for correct ADC input
Processing parametersSI :16 K BC_mod :quadWDW :EM LB :0.1 HzFT :Fourier transformation phase correction :adjust the phase to
pure absorption.baseline correction :ABS plot :use XWINPLOT
Experiment 7.9- INAPT
pulse program: selinapt.moThis experiment is the selective version of INEPT. Here only a particular proton isexcited and used for polarization transfer, in order to identify 13C nuclei that areconnected to this proton via spin-spin coupling. The experiment is mainly used fordetecting long-range interactions and provides a good method for assigningquaternary carbon nuclei.
Setting of the needed channels: F1: 13CF2: 1H
Acquisition parametersPL0 :f2 channel - 120 dB, fixed power levelPL1 :f1 channel - high power level for 13C
transmitter pulseP1 :f1 channel - 90° 13C transmitter pulse
P2 :f1 channel - 180° 13C transmitter pulseSP2 :f2 channel - power level for shaped
pulse, here 67 dB was usedP13 :f2 channel - 90°o rectangular shaped
1H decoupler pulse, here 20 msecP14 :f2 channel - 180° rectangular shaped
1H decoupler pulsePL12 :f2 channel - power level for CPD
decouplingPCPD2 :f2 channel - 90° pulse for
decoupling sequenceCPD2 :WALTZ16 - CPD decoupling
sequence, defined by cpdprg2D1 :3 sec – relaxation delay D20 :10 msec - fixed delayD21 :20 msec – fixed delayTD :32 K SW :55 ppmO1 :center of aromatic region of the 13C
NMR spectrumO2 :on resonance of selected 1H NMR
signalRectangular shaped pulse with 1000 datapoints was used
NS :64 RG :receiver gain for correct ADC input
56
Processing parametersSI :16 K BC_mod :quadWDW :EM LB :2 HzFT :Fourier transformation phase correction :note that the sign of
the signals may bepositive or negative
baseline correction :ABS plot :use XWINPLOT
Experiment 7.10- Determination of Long-Range C,H Coupling Constants
pulse program: sellr.moThe experiment presented here demonstrates a 2D method related to 2D J-resolved spectroscopy and employing a selective pulse. It yields directly thedesired spin coupling constant of a chosen C,H pair free of other passive spincouplings. Unlike the original method the pulse sequence given here uses ashaped RE-BURP pulse.
Setting of the needed channels: F1: 13CF2: 1H
Acquisition parametersPL1 :f1 channel - high power level for 13C
transmitter pulseP1 :f1 channel - 90° 13C transmitter pulse
P2 :f1 channel - 180° 13C transmitter pulseSP2 :f2 channel - power level for shaped
RE-BURP pulse, 46 dB was usedP14 :f2 channel - 180°shaped pulse, 40
msec was used herePL12 :f2 channel - power level for CPD
decouplingPCPD2 :f2 channel - 90° pulse for
decoupling sequenceCPD2 :WALTZ16 - CPD decoupling
sequence, defined by cpdprg2D0 :3 usec – incremented delay D1 :2 sec - relaxation delayD11 :30 msec – delay for disk I/O D12 :20 usec - delay for power switchingParmod :2D ND0 :2TD2 :1 K data points in F2 TD1 :128 data points in F1SW2 :200 ppm SW1 :50 HzO1 :middle of the 13C NMR spectrum O2 :on resonance of the methyl group at
1.8 ppmNS :8 DS :16
RE-BURP shape with 256 points was usedIN0 :1/[2*SW1] DE :as small as possibleRG :receiver gain for correct ADC input
Processing parametersSI(F2) :512 W SI(F1) :256 WWDW(F2) :SINE WDW(F1) :SINESSB(F2) :2 SSB(F1) :2PH-mod(F2) :no PH-mod(F1) :mcMC2 :QF XFB :fourier transformation in both
directionsphase correction :not necessary plot :use XWINPLOT
57
Experiment 7.11- SELRESOLV
pulse program: selreso.moThe experiment presented here demonstrates a 2D J-resolved spectroscopy andemploying a selective pulse. It yields directly the desired spin coupling constant ofa chosen C,H pair independent of other passive spin couplings. In contrast toExperiment 7.10, however, the SELRESOLV method is a proton detectedexperiment and hence more sensitivity.
Setting of the needed channels: F1: 1HF2: 13C
Acquisition parametersPL1 :f1 channel - high power level for 1H
transmitter pulseP1 :f1 channel - 90° 1H transmitter pulse
P2 :f1 channel - 180° 1H transmitter pulsePL2 :f2 channel - high power level for 13C
decoupler pulseP3 :f2 channel - 90° 13C decoupler pulse
PL19 :f1 channel - power level for CPDdecoupling, 28 dB
PCPD1 :f1 channel - 90° pulse fordecoupling sequence, 100 usec
SP2 :f2 channel - power level for shapedpulse, here 66 dB was used
P13 :f2 channel - 90° shaped pulse, 10msec was used here
CPD1 :WALTZ16 - CPD decouplingsequence, defined by cpdprg1
half Gaussian shape
D0 :3 usec – incremented delayD1 :6 sec – relaxation delay D11 :30 msec - delay for disk I/OD6 :1/[2J(C,H)]= 50 msec, calculated from
nJ(C,H)=10 HzD12 :20 usec - delay for power switching
Parmod :2D ND0 :2TD2 :2 K data points in F2 TD1 :32 data points in F1SW2 :1 ppm SW1 :45 HzO1 :center of methyl group region of 1H
NMR spectrumO2 :on resonance of the olefinic carbon
atom C-2 at 123.6 ppmNS :16 DS :16IN0 :1/[2*SW1] DE :as small as possibleRG :receiver gain for correct ADC input
Processing parametersSI(F2) :2 K SI(F1) :128 WWDW(F2) :SINE WDW(F1) :SINESSB(F2) :0 SSB(F1) :0PH-mod(F2) :no PH-mod(F1) :mcMC2 :QF XFB :fourier transformation in both
directionsphase correction :not necessary plot :use XWINPLOT
Experiment 7.12- SERF
pulse program: serf.moThe SERF (Selective ReFocussing) experiment is a 2D method. It directly yieldsthe desired coupling constant of a chosen spin pair without other passive spincouplings.
58
Setting of the needed channels:F1: 1HF2: off
Acquisition parametersPL1 :f1 channel - high power level for 1H
transmitter pulseP28 :f1 channel - 5 msec purging pulse
SP1 :f1 channel - power level for E-BURP2, here 55 dB was used
P11 :f1 channel - 90° shaped pulse, E-BURP2 pulse, 50 msec length
SP5 :f1 channel - power level for RE-BURP, here 45 dB was used
P12 :f1 channel - 180° shaped pulse,double selective RE-BURP pulse, 50msec length
D0 :3 usec – incremented delay D1 :2 sec – relaxation delayD12 :20 usec - delay for power switchingParmod :2D ND0 :2TD2 :1 K data points in F2 TD1 :64 data points in F1SW2 :8 ppm SW1 :50 HzO1 :middle of 1H NMR spectrumNS :4 DS :16IN0 :1/[2*SW1] DE :as small as possibleRG :receiver gain for correct ADC inputcalibrate the double selective RE-BURPshape, so that this pulse actssimultaneously on the olefinic proton at 6.9ppm and the methyl group at 1.8 ppm
the E-BURP2 shape acts on the olefinicsignal at 6.9 ppm
Processing parametersSI(F2) :512 W SI(F1) :128 WWDW(F2) :SINE WDW(F1) :SINESSB(F2) :0 SSB(F1) :0PH-mod(F2) :no PH-mod(F1) :mcMC2 :QF XFB :fourier transformation in both
directionsphase correction :not necessary plot :use XWINPLOT
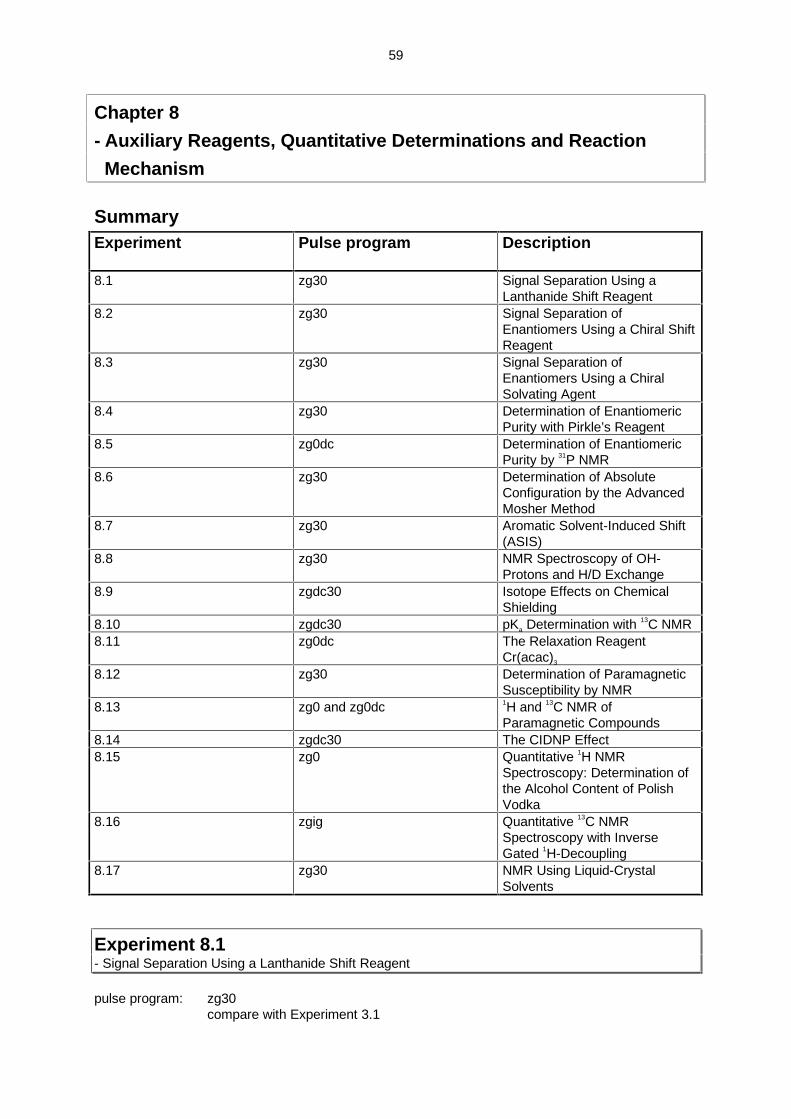
59
Chapter 8
- Auxiliary Reagents, Quantitative Determinations and Reaction
Mechanism
SummaryExperiment Pulse program Description
8.1 zg30 Signal Separation Using aLanthanide Shift Reagent
8.2 zg30 Signal Separation ofEnantiomers Using a Chiral ShiftReagent
8.3 zg30 Signal Separation ofEnantiomers Using a ChiralSolvating Agent
8.4 zg30 Determination of EnantiomericPurity with Pirkle’s Reagent
8.5 zg0dc Determination of EnantiomericPurity by 31P NMR
8.6 zg30 Determination of AbsoluteConfiguration by the AdvancedMosher Method
8.7 zg30 Aromatic Solvent-Induced Shift(ASIS)
8.8 zg30 NMR Spectroscopy of OH-Protons and H/D Exchange
8.9 zgdc30 Isotope Effects on ChemicalShielding
8.10 zgdc30 pKa Determination with 13C NMR8.11 zg0dc The Relaxation Reagent
Cr(acac)3
8.12 zg30 Determination of ParamagneticSusceptibility by NMR
8.13 zg0 and zg0dc 1H and 13C NMR ofParamagnetic Compounds
8.14 zgdc30 The CIDNP Effect8.15 zg0 Quantitative 1H NMR
Spectroscopy: Determination ofthe Alcohol Content of PolishVodka
8.16 zgig Quantitative 13C NMRSpectroscopy with InverseGated 1H-Decoupling
8.17 zg30 NMR Using Liquid-CrystalSolvents
Experiment 8.1- Signal Separation Using a Lanthanide Shift Reagent
pulse program: zg30compare with Experiment 3.1
60
Setting of the needed channels: F1: 1HF2: off
Acquisition parametersPL1 :f1 channel - high power level for 1H
transmitter pulseP1 :f1 channel - 90° 1H transmitter pulse
D1 :0.1 sec – relaxation delayTD :32 K SW :15 ppmO1 :middle of the 1H NMR spectrumNS :8 RG :receiver gain for correct ADC input
Processing parametersSI :16 K BC_mod :quadWDW :EM LB :0.1 HzFT :Fourier transformation phase correction :adjust the phase to
pure absorption.baseline correction :ABS plot :use XWINPLOT
Experiment 8.2- Signal Separation of Enantiomers Using a Chiral Shift Reagent
pulse program: zg30compare with Experiment 3.1
Setting of the needed channels: F1: 1HF2: off
Acquisition parametersPL1 :f1 channel - high power level for 1H
transmitter pulseP1 :f1 channel - 90° 1H transmitter pulse
D1 :0.1 sec – relaxation delayTD :32 K SW :15 ppmO1 :middle of the 1H NMR spectrum (also
signals at -3 ppm)NS :8 RG :receiver gain for correct ADC input
Processing parametersSI :16 K BC_mod :quadWDW :EM LB :0.1 HzFT :Fourier transformation phase correction :adjust the phase to
pure absorption.baseline correction :ABS plot :use XWINPLOT
Experiment 8.3- Signal Separation of Enantiomers Using a Chiral Solvating Agent
pulse program: zg30compare with Experiment 3.1
Setting of the needed channels: F1: 1HF2: off
61
Acquisition parametersPL1 :f1 channel - high power level for 1H
transmitter pulseP1 :f1 channel - 90° 1H transmitter pulse
D1 :0.1 sec – relaxation delayTD :32 K SW :15 ppmO1 :middle of the 1H NMR spectrumNS :8 RG :receiver gain for correct ADC input
Processing parametersSI :16 K BC_mod :quadWDW :EM LB :0.1 HzFT :Fourier transformation phase correction :adjust the phase to
pure absorption.baseline correction :ABS plot :use XWINPLOT
Experiment 8.4- Determination of Enantiomeric Purity with Pirkle’s Reagent
pulse program: zg30compare with Experiment 3.1
Setting of the needed channels: F1: 1HF2: off
Acquisition parametersPL1 :f1 channel - high power level for 1H
transmitter pulseP1 :f1 channel - 90° 1H transmitter pulse
D1 :0.1 sec – relaxation delayTD :32 K SW :15 ppmO1 :middle of the 1H NMR spectrumNS :8 RG :receiver gain for correct ADC input
Processing parametersSI :16 K BC_mod :quadWDW :GM GB :0.2LB :-0.5 HzFT :Fourier transformation phase correction :adjust the phase to
pure absorption.baseline correction :ABS plot :use XWINPLOT
Experiment 8.5- Determination of Enantiomeric Purity by 31P NMR
pulse program: zg0dccompare with Experiment 2.2
Setting of the needed channels: F1: 31PF2: 1H
Acquisition parametersPL1 :f1 channel - high power level for 13C P0 :f1 channel - 30° 13C transmitter pulse
62
transmitter pulsePL12 :f2 channel - power level for CPD
decouplingPCPD2 :f2 channel - 90° pulse for
decoupling sequenceCPD2 :WALTZ16 - CPD decoupling
sequence, defined by cpdprg2D1 :2 sec – relaxation delay D11 :30 msec - delay for disk I/OTD :16 K SW :20 ppmO1 :middle of the 31P NMR spectrum O2 :middle of 1H NMR spectrumNS :32 RG :receiver gain for correct ADC input
Processing parametersSI :8 K BC_mod :quadWDW :EM LB :3 HzFT :Fourier transformation phase correction :adjust the phase to
pure absorption.integration :is done with ABS or can be
done manualreferencing :reference against external
85% H3PO4 with δp=0baseline correction :ABS plot :use XWINPLOT
Experiment 8.6- Determination of Absolute Configuration by the Advanced Mosher Method
pulse program: zg30compare with Experiment 3.1
Setting of the needed channels: F1: 1HF2: off
Acquisition parametersmeasure both solutions with the same parametersPL1 :f1 channel - high power level for 13C
transmitter pulseP1 :f1 channel - 90° 13C transmitter pulse
D1 :0.1 sec – relaxation delayTD :32 K SW :20 ppmO1 : middle of 1H NMR spectrumNS :8 RG :receiver gain for correct ADC input
Processing parametersprocess both FIDs with the same parametersSI :16 K BC_mod :quadWDW :EM LB :0.1 HzFT :Fourier transformation phase correction :adjust the phase to
pure absorption.baseline correction :ABS plot :use XWINPLOTuse the dual display mode to extract the chemical shift differences of the two spectra
Experiment 8.7- Aromatic Solvent-Induced Shift (ASIS)
pulse program: zg30compare with Experiment 3.1
63
Setting of the needed channels: F1: 1HF2: off
Acquisition parametersrecord the spectra of the compound dissolved in both solutionsPL1 :f1 channel - high power level for 13C
transmitter pulseP1 :f1 channel - 90° 13C transmitter pulse
D1 :0.1 sec – relaxation delayTD :32 K SW :20 ppmO1 : middle of 1H NMR spectrumNS :8 RG :receiver gain for correct ADC input
Processing parametersSI :16 K BC_mod :quadWDW :EM LB :0.1 HzFT :Fourier transformation phase correction :adjust the phase to
pure absorption.baseline correction :ABS referencing :reference both spectra to
δH=0 and inspect thearomatic region
plot :use XWINPLOT
Experiment 8.8- NMR Spectroscopy of OH-Protons and H/D Exchange
pulse program: zg30compare with Experiment 3.1
Setting of the needed channels: F1: 1HF2: off
Acquisition parametersrecord a spectrum, remove the tube from the magnet, add a drop of D2O, and shake theNMR tube thoroughly and record again a spectrumPL1 :f1 channel - high power level for 13C
transmitter pulseP1 :f1 channel - 90° 13C transmitter pulse
D1 :0.1 sec – relaxation delayTD :32 K SW :20 ppmO1 : middle of 1H NMR spectrumNS :8 RG :receiver gain for correct ADC input
Processing parametersSI :16 K BC_mod :quadWDW :EM LB :0.1 HzFT :Fourier transformation phase correction :adjust the phase to
pure absorption.baseline correction :ABS plot :use XWINPLOT
64
Experiment 8.9- Isotope Effects on Chemical Shielding
pulse program: zgdc30compare with Experiment 3.2
Setting of the needed channels: F1: 13CF2: 1H
Acquisition parametersfirst measure mixture of the deuterated solvents alone, then add the mixture of theundeuterated solvents and repeat the measurementPL1 :f1 channel - high power level for 13C
transmitter pulseP1 :f1 channel - 90° 13C transmitter pulse
PL12 :f2 channel - power level for CPDdecoupling
PCPD2 :f2 channel –90° pulse fordecoupling sequence
CPD2 :WALTZ16 - CPD decouplingsequence, defined by cpdprg2
D1 :1 sec – relaxation delay D11 :30 msec - delay for disk I/OTD :64 K SW :200 ppmO1 :middle of the 13C NMR spectrum O2 :middle of 1H NMR spectrumNS :256 RG :receiver gain for correct ADC input
Processing parametersSI :64 K BC_mod :quadWDW :EM LB :0.3 HzFT :Fourier transformation phase correction :adjust the phase to
pure absorption.baseline correction :ABS plot :use XWINPLOT
Experiment 8.10- pKa Determination with 13C NMR
pulse program: zgdc30compare with Experiment 3.2
Setting of the needed channels: F1: 13CF2: 1H
Acquisition parametersPL1 :f1 channel - high power level for 13C
transmitter pulseP1 :f1 channel - 90° 13C transmitter pulse
PL12 :f2 channel - power level for CPDdecoupling
PCPD2 :f2 channel –90° pulse fordecoupling sequence
CPD2 :WALTZ16 - CPD decouplingsequence, defined by cpdprg2
D1 :2 sec – relaxation delay D11 :30 msec - delay for disk I/OTD :64 K SW :200 ppmO1 :middle of the 13C NMR spectrum O2 :middle of 1H NMR spectrumNS :32 RG :receiver gain for correct ADC input
65
Processing parametersSI :32 K BC_mod :quadWDW :EM LB :2 HzFT :Fourier transformation phase correction :adjust the phase to
pure absorption.baseline correction :ABS plot :use XWINPLOT
Experiment 8.11- The Relaxation Reagent Cr(acac)3
pulse program: zg0dccompare with Experiment 2.2
Setting of the needed channels: F1: 13CF2: 1H
Acquisition parametersPL1 :f1 channel - high power level for 13C
transmitter pulseP0 :f1 channel - 45° 13C transmitter pulse
PL12 :f2 channel - power level for CPDdecoupling
PCPD2 :f2 channel –90° pulse fordecoupling sequence
CPD2 :WALTZ16 - CPD decouplingsequence, defined by cpdprg2
D1 :0.5 sec – relaxation delay D11 :30 msec - delay for disk I/OTD :64 K SW :250 ppmO1 :middle of the 13C NMR spectrum O2 :middle of 1H NMR spectrumNS :64 RG :receiver gain for correct ADC input
Processing parametersSI :32 K BC_mod :quadWDW :EM LB :2 HzFT :Fourier transformation phase correction :adjust the phase to
pure absorption.baseline correction :ABS plot :use XWINPLOT
Experiment 8.12- Determination of Paramagnetic Susceptibility by NMR
pulse program: zg30compare with Experiment 3.1
Setting of the needed channels: F1: 1HF2: off
Acquisition parametersPL1 :f1 channel - high power level for 1H
transmitter pulseP1 :f1 channel - 90° 1H transmitter pulse
D1 :0.1 sec – relaxation delayTD :32 K SW :15 ppmO1 :middle of the 1H NMR spectrumNS :8 RG :receiver gain for correct ADC input
66
Processing parametersSI :16 K BC_mod :quadWDW :EM LB :0.1 HzFT :Fourier transformation phase correction :adjust the phase to
pure absorption.baseline correction :ABS plot :use XWINPLOT
Experiment 8.13- 1H and 13C NMR of Paramagnetic Compounds
a) pulse program: zg0compare with Experiment 2.1
Setting of the needed channels: F1: 1HF2: off
Acquisition parametersPL1 :f1 channel - high power level for 1H
transmitter pulse, here 3 dB wasused
P0 :f1 channel - 45° 1H transmitter pulse
D1 :0.1 sec – relaxation delayTD :64 K SW :110pmO1 :25 ppm to lower frequencies from
TMS signalNS :8 RG :receiver gain for correct ADC input
Processing parametersSI :32 K BC_mod :quadWDW :EM LB :5 HzFT :Fourier transformation phase correction :adjust the phase to
pure absorption.baseline correction :ABS plot :use XWINPLOT
b) pulse program: zg0dccompare with Experiment 2.2
Setting of the needed channels: F1: 13CF2: 1H
Acquisition parametersPL1 :f1 channel - high power level for 13C
transmitter pulseP0 :f1 channel - 45° 13C transmitter pulse
PL12 :f2 channel - power level for CPDdecoupling
PCPD2 :f2 channel –90° pulse fordecoupling sequence
CPD2 :WALTZ16 - CPD decouplingsequence, defined by cpdprg2
D1 :0.1 sec – relaxation delayTD :64 K SW :990 ppmO1 :400 ppm to higher frequencies from
TMS signalO2 :on resonance of the previously
determined 1H NMR frequency of thecobaltocene signal
NS :2048 RG :receiver gain for correct ADC input
67
Processing parametersSI :16 K BC_mod :quadWDW :EM LB :100 HzFT :Fourier transformation phase correction :adjust the phase to
pure absorption.baseline correction :ABS plot :use XWINPLOT
Experiment 8.14- The CIDNP Effect
pulse program: zgdc30compare with Experiment 3.2
Setting of the needed channels: F1: 13CF2: 1H
Acquisition parametersPL1 :f1 channel - high power level for 13C
transmitter pulseP1 :f1 channel - 90° 13C transmitter pulse
PL12 :f2 channel – power level for CPDdecoupling
PCPD2 :f2 channel –90° pulse fordecoupling sequence
CPD2 :WALTZ16 – CPD decouplingsequence, defined by cpdprg2
D1 :1 sec – relaxation delay D11 :30 msec - delay for disk I/OTD :32 K SW :250 ppmO1 :middle of the 13C NMR spectrum O2 :middle of 1H NMR spectrumNS :16 RG :receiver gain for correct ADC inputprepare with edc 20 data sets and use theau-program multizg to measure the 20spectra
set the temperature to 120�C and startimmediately the automatic program
Processing parametersSI :16 K BC_mod :quadWDW :EM LB :2 HzFT :Fourier transformation phase correction :adjust the phase to
pure absorption.baseline correction :ABS plot :use XWINPLOT
Experiment 8.15- Quantitative 1H NMR Spectroscopy: Determination of the Alcohol Content of Polish Vodka
pulse program: zg0compare with Experiment 2.1
Setting of the needed channels: F1: 1HF2: off
Acquisition parametersPL1 :f1 channel - high power level for 1H
transmitter pulseP0 :f1 channel - 45° 1H transmitter pulse
D1 :5 sec – relaxation delayTD :32 K or more (use a large data set to SW :10 ppm
68
get 10 points/Hz digital resolution)O1 :middle of the 1H NMR spectrumNS :16 (obtain a good S/N, at least 35:1) RG :receiver gain for correct ADC input
Processing parametersSI :64 K BC_mod :quadWDW :EM LB :0.1 HzFT :Fourier transformation phase correction :adjust the phase to
pure absorption.integration :manual baseline correction :ABSplot :use XWINPLOT
Experiment 8.16- Quantitative 13C NMR Spectroscopy with Inverse Gated 1H-Decoupling
pulse program: zgig1D-sequence with inverse gated decoupling, using a 90o pulse. This experimentyields 1H-decoupled NMR spectra of X-nuclei without signal enhancement by thenuclear Overhauser effect.
Setting of the needed channels: F1: 13CF2: 1H
Acquisition parametersPL1 :f1 channel - high power level for 13C
transmitter pulseP1 :f1 channel - 90° 13C transmitter pulse
PL12 :f2 channel - power level for CPDdecoupling
PCPD2 :f2 channel - 90° pulse fordecoupling sequence
CPD2 :WALTZ16 - CPD decouplingsequence, defined by cpdprg2
D1 :10 sec – relaxation delay D11 :30 msec - delay for disk I/OTD :2 K (short aq to avoid NOE build-up
during acquisition)SW :20 ppm
O1 :middle of aromatic region of the 13CNMR spectrum
O2 :middle of aromatic region of 1H NMRspectrum
NS :160 RG :receiver gain for correct ADC input
Processing parametersSI :8 K BC_mod :quadWDW :EM LB :2 HzFT :Fourier transformation phase correction :adjust the phase to
pure absorption.integration :manual baseline correction :ABSplot :use XWINPLOT
Experiment 8.17- NMR Using Liquid-Crystal Solvents
pulse program: zg30compare with Experiment 3.1

69
Setting of the needed channels: F1: 1HF2: off
Acquisition parametersPL1 :f1 channel - high power level for 1H
transmitter pulseP1 :f1 channel - 90° 1H transmitter pulse
D1 :1 sec – relaxation delay D11 :30 msec - delay for disk I/OTD :64 K SW :22 ppmO1 :on resonance of the 1H benzene
signal in isotropic phaseDE :100 usec, to avoid break through of
the matrix signalNS :8 RG :receiver gain for correct ADC inputset the temperature to 330 K and measure the liquid crystal alone, go back to 300 Kand measure again. Add the benzene and measure at 300 K.
Processing parametersSI :32 K BC_mod :quadWDW :EM LB :0.3 HzFT :Fourier transformation phase correction :adjust the phase to
pure absorption.baseline correction :ABS plot :use XWINPLOT
70
Chapter 9
- Heteronuclear NMR Specroscopy
SummaryExperiment Pulse program Description
9.1 dept 1H-Decoupled 15N NMR Spectrawith DEPT
9.2 deptnd 1H-Coupled 15N NMR Spectrawith DEPT
9.3 zg30 19F NMR Spectroscopy9.4 dept 29Si NMR Spectroscopy with
DEPT9.5 exp9_5.mo 29Si NMR Spectroscopy with
Spin-Lock Polarization9.6 zgdc30 119Sn NMR Spectroscopy9.7 zgdc 2H NMR Spectroscopy9.8 zgdc 11B NMR Spectroscopy9.9 aring2.mo 17O NMR Spectroscopy with
RIDE9.10 zg
aring
47/49Ti NMR Spectroscopy withARING
Experiment 9.1- 1H-Decoupled 15N NMR Spectra with DEPT
pulse program: deptcompare with Experiment 6.9
Setting of the needed channels: F1: 15NF2: 1H
Acquisition parametersPL1 :f1 channel - high power level for 15N
transmitter pulseP1 :f1 channel - 90° 15N transmitter pulse
P2 :f1 channel - 180° 15N transmitter pulsePL2 :f2 channel - high power level for 1H
decoupler pulseP0 :f2 channel - 45° 1H decoupler pulse
(optimum for NH2)P3 :f2 channel - 90° 1H decoupler pulseP4 :f2 channel - 180° 1H decoupler pulse
PL12 :f2 channel - power level for CPDdecoupling
PCPD2 :f2 channel - 90° pulse fordecoupling sequence
CPD2 :WALTZ16 - CPD decouplingsequence, defined by cpdprg2
D1 :2 sec – relaxation delay D12 :20 usec - delay for power switchingD2 :1/[2J(N,H)]= 5.6 msec, calculated from
1J(N,H)=90 HzTD :32 K SW :350 ppm (chemical shift range of NH-
groups)O1 :220 ppm upfield from CH3NO2 (middle
of NH region)O2 :middle of 1H NMR spectrum
NS :4 DS :8
71
RG :receiver gain for correct ADC input
Processing parametersSI :16 K BC_mod :quadWDW :EM LB :2 HzFT :Fourier transformation phase correction :adjust the phase to
pure absorption.baseline correction :ABS plot :use XWINPLOT
Experiment 9.2- 1H-Coupled 15N NMR Spectra with DEPT
pulse program: deptndDEPT experiment without decoupling.
Setting of the needed channels: F1: 15NF2: 1H
Acquisition parametersPL1 :f1 channel - high power level for 15N
transmitter pulseP1 :f1 channel - 90° 15N transmitter pulse
P2 :f1 channel - 180° 15N transmitter pulsePL2 :f2 channel - high power level for 1H
decoupler pulseP0 :f1 channel - 45° 1H decoupler pulse
P3 :f2 channel - 90° 1H decoupler pulseP4 :f2 channel - 180° 1H decoupler pulse
D1 :2 sec – relaxation delay D2 :1/[2J(N,H)]= 5.6 msec, calculated from1J(N,H)=90 Hz
TD :32 K SW :350 ppmO1 :220 ppm upfield from CH3NO2 O2 :middle of 1H NMR spectrumNS :32 DS :8RG :receiver gain for correct ADC input
Processing parametersSI :16 K BC_mod :quadWDW :EM LB :1 HzFT :Fourier transformation phase correction :adjust the phase to
pure absorption.baseline correction :ABS plot :use XWINPLOT
Experiment 9.3- 19F NMR Spectroscopy
pulse program: zg30compare with Experiment 3.1
Setting of the needed channels: F1: 19FF2: off
Acquisition parametersPL1 :f1 channel - high power level for 19F P1 :f1 channel - 90° 19F transmitter pulse
72
transmitter pulseD1 :1 sec – relaxation delayTD :64 K SW :300 ppm (typical range for fluorine
bound to carbon)O1 :about 100 ppm upfield from CCl3F
(center of that range)NS :1 RG :receiver gain for correct ADC input
Processing parametersSI :32 K BC_mod :quadWDW :EM LB :0.1 HzFT :Fourier transformation phase correction :adjust the phase to
pure absorption.baseline correction :ABS plot :use XWINPLOT
Experiment 9.4- 29Si NMR Spectroscopy with DEPT
pulse program: deptcompare with Experiment 6.9
Setting of the needed channels: F1: 29SiF2: 1H
Acquisition parametersPL1 :f1 channel - high power level for 29Si
transmitter pulseP1 :f1 channel - 90° 29Si transmitter pulse
P2 :f1 channel - 180° 29Si transmitter pulsePL2 :f2 channel - high power level for 1H
decoupler pulseP0 :f2 channel - 16.8° 1H decoupler pulse
corresponding to the 12 equivalentprotons of the sample
P3 :f2 channel - 90° 1H decoupler pulseP4 :f2 channel - 180° 1H decoupler pulse
PL12 :f2 channel - power level for CPDdecoupling
PCPD2 :f2 channel - 90° pulse fordecoupling sequence
CPD2 :WALTZ16 - CPD decouplingsequence, defined by cpdprg2
D1 :1 sec – relaxation delay D2 :1/[2J(Si,H)]= 0.07 sec, calculated from2J(Si,H)=7 Hz
TD :64 K SW :250 ppmO1 :70 ppm upfield from 29Si signal of TMS O2 :middle of 1H NMR spectrumNS :32 DS :64RG :receiver gain for correct ADC input
Processing parametersSI :32 K BC_mod :quadWDW :EM LB :3 HzFT :Fourier transformation phase correction :adjust the phase to
pure absorption.baseline correction :ABS plot :use XWINPLOT
73
Experiment 9.5- 29Si NMR Spectroscopy with Spin-Lock Polarization
pulse program: exp9_5.moWith the spin-lock technique a superior polarization can be achieved, which is heredemonstated for the liquid state. This type of polarization transfer in liquids workswell for nuclei with no directly attached hydrogen atom.
Setting of the needed channels: F1: 29SiF2: 1H
Acquisition parametersPL2 :f2 channel - high power level for 1H
decoupler pulse, here 3 dB was usedP3 :f2 channel - 90° 1H decoupler pulse
PL10 :f1 channel - low power level P6 :f1 channel - 90° 29Si transmitter pulse,50 usec was used
PL15 :f2 channel - low power level P9 :f2 channel - 90° 1H decoupler pulse,50 usec was used
PL12 :f2 channel - power level for CPDdecoupling
PCPD2 :f2 channel - 90° pulse fordecoupling sequence, here 100usec was used
CPD2 :WALTZ16 - CPD decouplingsequence, defined by cpdprg2
D1 :4 sec – relaxation delay D9 :152 msec – delay for spin-lockD12 :20 usec – delay for power switching D11 :30 msec – delay for disk I/OTD :4 K SW :500 HzO1 :on resonance of 29Si signal of TMS O2 :on resonance of 1H NMR signal of
TMSL4 :32, the whole time should be 152 msec
corresponding to 2J(Si,H)= 7 HzNS :1 RG :receiver gain for correct ADC input
Processing parametersSI :2 K BC_mod :quadWDW :EM LB :1 HzFT :Fourier transformation phase correction :adjust the phase to
pure absorption.baseline correction :ABS plot :use XWINPLOT
Experiment 9.6- 119Sn NMR Spectroscopy
pulse program: zgdc30compare with Experiment 3.2
Setting of the needed channels: F1: 119SnF2: 1H
Acquisition parametersPL1 :f1 channel - high power level for 119Sn
transmitter pulseP1 :f1 channel - 90° 119Sn transmitter
pulsePL12 :f2 channel – power level for CPD
decouplingPCPD2 :f2 channel - 90° pulse for
decoupling sequence
74
CPD2 :WALTZ16 - CPD decouplingsequence, defined by cpdprg2
D1 :1 sec – relaxation delay D11 :30 msec - delay for disk I/OTD :32 K SW :600 ppm (Sn chemical shift range
typical for R4-nSnXn)O1 :100 ppm upfield from Sn(CH3)4 (center
of that chemical shift range)O2 :middle of 1H NMR spectrum
NS :8 RG :receiver gain for correct ADC input
Processing parametersSI :16 K BC_mod :quadWDW :EM LB :3 HzFT :Fourier transformation phase correction :adjust the phase to
pure absorption.baseline correction :ABS plot :use XWINPLOT
Experiment 9.7- 2H NMR Spectroscopy
pulse program: zgdccompare with Experiment 3.10
Setting of the needed channels: F1: 2HF2: 1H
Acquisition parametersPL1 :f1 channel - high power level for 2H
transmitter pulseP1 :f1 channel - 90° 2H transmitter pulse
PL12 :f2 channel - power level for CPDdecoupling
PCPD2 :f2 channel - 90° pulse fordecoupling sequence
CPD2 :WALTZ16 - CPD decouplingsequence, defined by cpdprg2
D1 :100 msec – relaxation delay D11 :30 msec - delay for disk I/OTD :8 K SW :8 ppmO1 :middle of the 2H NMR spectrum O2 :middle of 1H NMR spectrumNS :256 RG :receiver gain for correct ADC input
Processing parametersSI :4 K BC_mod :quadWDW :EM LB :2 HzFT :Fourier transformation phase correction :adjust the phase to
pure absorption.baseline correction :ABS integration :is done with ABS or can be
done manualplot :use XWINPLOT
Experiment 9.8- 11B NMR Spectroscopy
pulse program: zgdccompare with Experiment 3.10
75
Setting of the needed channels: F1: 11BF2: 1H
Acquisition parametersPL1 :f1 channel - high power level for 11B
transmitter pulseP1 :f1 channel - 90° 11B transmitter pulse
PL12 :f2 channel - power level for CPDdecoupling
PCPD2 :f2 channel - 90° pulse fordecoupling sequence
CPD2 :WALTZ16 - CPD decouplingsequence, defined by cpdprg2
D1 :100 msec – relaxation delay D11 :30 msec - delay for disk I/OD2 :1/[2J(C,H)]= 2.36 msec, calculated
from 1J(C,H)=212 HzD12 :20 usec - delay for power switching
TD :4 K SW :36 ppmO1 :middle of the 11B NMR spectrum O2 :middle of 1H NMR spectrumNS :8 RG :receiver gain for correct ADC input
Processing parametersSI :2 K BC_mod :quadWDW :EM LB :2 HzFT :Fourier transformation phase correction :adjust the phase to
pure absorption.referencing :use the external reference of
the standard; be sure not tochange the magnetic fieldbetween the twomeasurements
baseline correction :ABS plot :use XWINPLOT
Experiment 9.9- 17O NMR Spectroscopy with RIDE
pulse program: aring2.moThe RIDE (Ring Down Elimination) pulse sequence, is used to eliminate probe-head ringing, which occurs for quadrupolar nuclei with a relatively low y-value like170.
Setting of the needed channels: F1: 17OF2: off
Acquisition parametersPL1 :f1 channel - high power level for 17O
transmitter pulseP1 :f1 channel - 90° 17O transmitter pulse
P2 :f1 channel - 180° 17O transmitter pulseD1 :10 msec – relaxation delay D13 :3 usec - short delayTD :4 K SW :500 ppmO1 :200 ppm downfield from 17O water
signalO2 :middle of 1H 13C NMR spectrum
NS :4*128 DE :15 usecRG :receiver gain for correct ADC input
Processing parametersSI :2 K BC_mod :quad
76
WDW :EM LB :200 HzFT :Fourier transformation phase correction :adjust the phase to
pure absorption.baseline correction :ABS plot :use XWINPLOT
Experiment 9.10- 47/49Ti NMR Spectroscopy with ARING
a) pulse program: zgcompare with Experiment 2.8
Setting of the needed channels: F1: 47/49TiF2: off
Acquisition parametersPL1 :f1 channel - high power level for 47/49Ti
transmitter pulseP1 :f1 channel - 90° 47/49Ti transmitter
pulseD1 :10 msec – relaxation delay DE :10 usecTD :8 K SW :600 ppmO1 :middle of the titanium NMR spectrumNS :8 RG :receiver gain for correct ADC input
Processing parametersSI :2 K BC_mod :quadWDW :EM LB :15 HzFT :Fourier transformation phase correction :adjust the phase to
pure absorption.baseline correction :ABS plot :use XWINPLOT
b) pulse program: aringA 1D sequence to suppress probe-head ringing.
Setting of the needed channels: F1: 47/49TiF2: off
Acquisition parametersPL1 :f1 channel - high power level for 17O
transmitter pulseP1 :f1 channel - 90° 17O transmitter pulse
P2 :f1 channel - 180° 17O transmitter pulseD1 :10 msec – relaxation delay D13 :3 usec - short delayTD :8 K SW :600 ppmO1 : middle of the titanium NMR spectrum DE :10 usecNS :8 RG :receiver gain for correct ADC input
Processing parametersSI :2 K BC_mod :quadWDW :EM LB :15 HzFT :Fourier transformation phase correction :adjust the phase to
pure absorption.baseline correction :ABS plot :use XWINPLOT
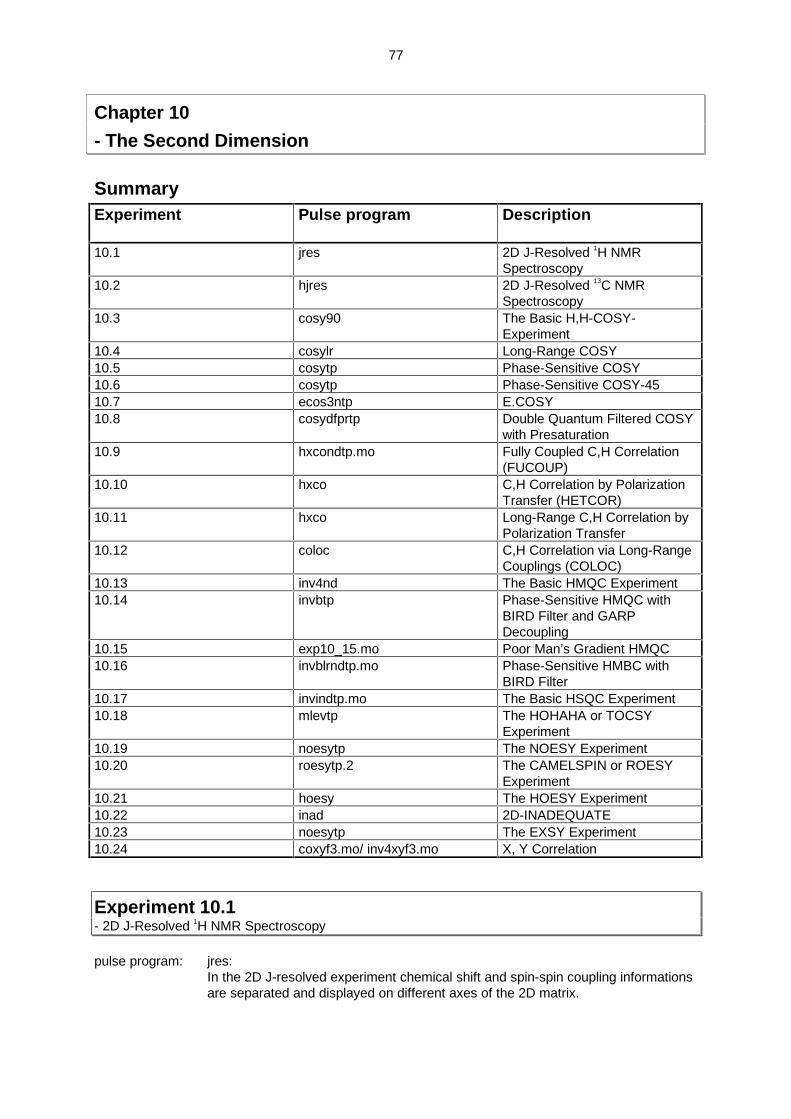
77
Chapter 10
- The Second Dimension
SummaryExperiment Pulse program Description
10.1 jres 2D J-Resolved 1H NMRSpectroscopy
10.2 hjres 2D J-Resolved 13C NMRSpectroscopy
10.3 cosy90 The Basic H,H-COSY-Experiment
10.4 cosylr Long-Range COSY10.5 cosytp Phase-Sensitive COSY10.6 cosytp Phase-Sensitive COSY-4510.7 ecos3ntp E.COSY10.8 cosydfprtp Double Quantum Filtered COSY
with Presaturation10.9 hxcondtp.mo Fully Coupled C,H Correlation
(FUCOUP)10.10 hxco C,H Correlation by Polarization
Transfer (HETCOR)10.11 hxco Long-Range C,H Correlation by
Polarization Transfer10.12 coloc C,H Correlation via Long-Range
Couplings (COLOC)10.13 inv4nd The Basic HMQC Experiment10.14 invbtp Phase-Sensitive HMQC with
BIRD Filter and GARPDecoupling
10.15 exp10_15.mo Poor Man’s Gradient HMQC10.16 invblrndtp.mo Phase-Sensitive HMBC with
BIRD Filter10.17 invindtp.mo The Basic HSQC Experiment10.18 mlevtp The HOHAHA or TOCSY
Experiment10.19 noesytp The NOESY Experiment10.20 roesytp.2 The CAMELSPIN or ROESY
Experiment10.21 hoesy The HOESY Experiment10.22 inad 2D-INADEQUATE10.23 noesytp The EXSY Experiment10.24 coxyf3.mo/ inv4xyf3.mo X, Y Correlation
Experiment 10.1- 2D J-Resolved 1H NMR Spectroscopy
pulse program: jres:In the 2D J-resolved experiment chemical shift and spin-spin coupling informationsare separated and displayed on different axes of the 2D matrix.
78
Setting of the needed channels: F1: 1HF2: off
Acquisition parametersPL1 :f1 channel - high power level for 1H
transmitter pulseP1 :f1 channel - 90° 1H transmitter pulse
P2 :f1 channel - 180° 1H transmitter pulseD0 :3 usec - incremented delay D1 :2 sec - relaxation delayParmod :2D ND0 :2TD2 :1 K data points in F2 TD1 :128 data points in F1SW2 :8 ppm SW1 :40 HzO1 :middle of 1H NMR spectrumNS :4 DS :16DE :as small as possible IN0 :1/[2*SW1]RG :receiver gain for correct ADC input
Processing parametersSI(F2) :512 W SI(F1) :256 WWDW(F2) :SINE WDW(F1) :SINESSB(F2) :0 SSB(F1) :0PH-mod(F2) :no PH-mod(F1) :mcMC2 :QF XFB :fourier transformation in both
directionsTILT SYMJphase correction :not necessary plot :use XWINPLOT
Experiment 10.2- 2D J-Resolved 13C NMR Spectroscopy
pulse program: hjresIn the 2D J-resolved experiment chemical shift and spin-spin coupling informationsof a 1H coupled 13C NMR spectrum are separated and displayed on different axesof the 2D matrix.
Setting of the needed channels: F1: 13CF2: 1H
Acquisition parametersPL1 :f1 channel - high power level for 13C
transmitter pulseP1 :f1 channel - 90° 13C transmitter pulse
P2 :f1 channel - 180° 13C transmitter pulsePL12 :f2 channel - power level for CPD
decouplingPCPD2 :f2 channel - 90° pulse for
decoupling sequenceCPD2 :WALTZ16- CPD decoupling
sequence, defined by cpdprg2D0 :3 usec - incremented delay
D1 :2 sec – relaxation delay D12 :20 usec - delay for power switchingParmod :2D ND0 :2TD2 :1 K data points in F2 TD1 :64 data points in F1SW2 :175 ppm SW1 :250 HzO1 : middle of 13C NMR spectrum O2 :middle of 1H NMR spectrumNS :32 DS :16DE :as short as possible IN0 :1/[2*SW1]RG :receiver gain for correct ADC input
79
Processing parametersSI(F2) :512 W SI(F1) :256 WWDW(F2) :QSINE WDW(F1) :QSINESSB(F2) :2 SSB(F1) :2PH-mod(F2) :no PH-mod(F1) :mcMC2 :QF XFB :fourier transformation in both
directionsSYMJphase correction :not necessary plot :use XWINPLOT
Experiment 10.3- The Basic H,H-COSY-Experiment
pulse program: cosy90The COSY (Correlation SpectroscopY) pulse sequence generates a 2D NMRspectrum in which the signals of a normal 1H NMR spectrum are correlated witheach other. Cross-peaks appear if the spin coupling is present.
Setting of the needed channels: F1: 1HF2: off
Acquisition parametersPL1 :f1 channel - high power level for 1H
transmitter pulseP1 :f1 channel - 90° 1H transmitter pulse
D0 :3 usec - incremented delay D1 :2 sec - relaxation delayParmod :2D ND0 :1TD2 :1 K data points in F2 TD1 :128 data points in F1SW2 :8 ppm SW1 :8 ppmO1 : middle of 1H NMR spectrumNS :4 DS :16IN0 :1/[1*SW1] RG :receiver gain for correct ADC input
Processing parametersSI(F2) :512 W SI(F1) :512 WWDW(F2) :SINE WDW(F1) :SINESSB(F2) :0 SSB(F1) :0PH-mod(F2) :no PH-mod(F1) :mcMC2 :QF XFB :fourier transformation in both
directionsSYM :may be performed phase correction :not necessaryplot :use XWINPLOT
Experiment 10.4- Long-Range COSY
pulse program: cosylrWith the long-range variant of the standard COSY pulse sequence it is possible toobserve cross-signals between protons which are connected by a very smallcoupling constant.
Setting of the needed channels: F1: 1HF2: off
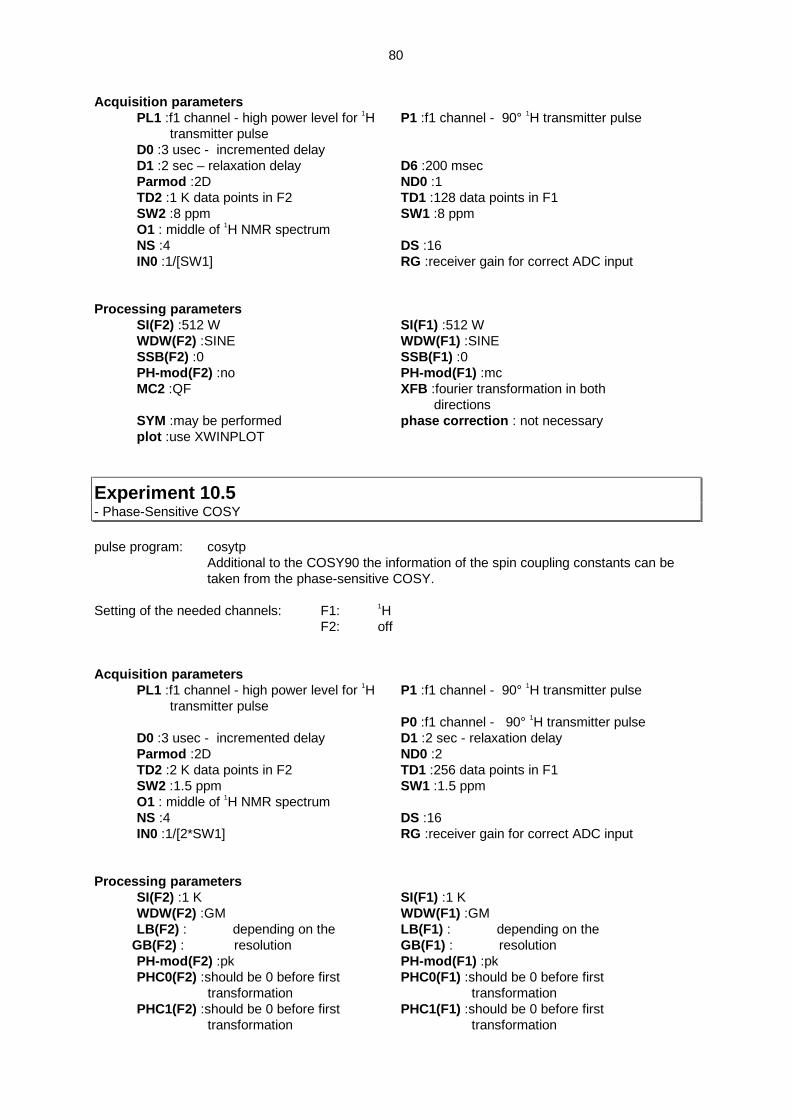
80
Acquisition parametersPL1 :f1 channel - high power level for 1H
transmitter pulseP1 :f1 channel - 90° 1H transmitter pulse
D0 :3 usec - incremented delayD1 :2 sec – relaxation delay D6 :200 msecParmod :2D ND0 :1TD2 :1 K data points in F2 TD1 :128 data points in F1SW2 :8 ppm SW1 :8 ppmO1 : middle of 1H NMR spectrumNS :4 DS :16IN0 :1/[SW1] RG :receiver gain for correct ADC input
Processing parametersSI(F2) :512 W SI(F1) :512 WWDW(F2) :SINE WDW(F1) :SINESSB(F2) :0 SSB(F1) :0PH-mod(F2) :no PH-mod(F1) :mcMC2 :QF XFB :fourier transformation in both
directionsSYM :may be performed phase correction : not necessaryplot :use XWINPLOT
Experiment 10.5- Phase-Sensitive COSY
pulse program: cosytpAdditional to the COSY90 the information of the spin coupling constants can betaken from the phase-sensitive COSY.
Setting of the needed channels: F1: 1HF2: off
Acquisition parametersPL1 :f1 channel - high power level for 1H
transmitter pulseP1 :f1 channel - 90° 1H transmitter pulse
P0 :f1 channel - 90° 1H transmitter pulseD0 :3 usec - incremented delay D1 :2 sec - relaxation delayParmod :2D ND0 :2TD2 :2 K data points in F2 TD1 :256 data points in F1SW2 :1.5 ppm SW1 :1.5 ppmO1 : middle of 1H NMR spectrumNS :4 DS :16IN0 :1/[2*SW1] RG :receiver gain for correct ADC input
Processing parametersSI(F2) :1 K SI(F1) :1 KWDW(F2) :GM WDW(F1) :GMLB(F2) : depending on the LB(F1) : depending on the
GB(F2) : resolution GB(F1) : resolutionPH-mod(F2) :pk PH-mod(F1) :pkPHC0(F2) :should be 0 before first
transformationPHC0(F1) :should be 0 before first
transformationPHC1(F2) :should be 0 before first
transformationPHC1(F1) :should be 0 before first
transformation
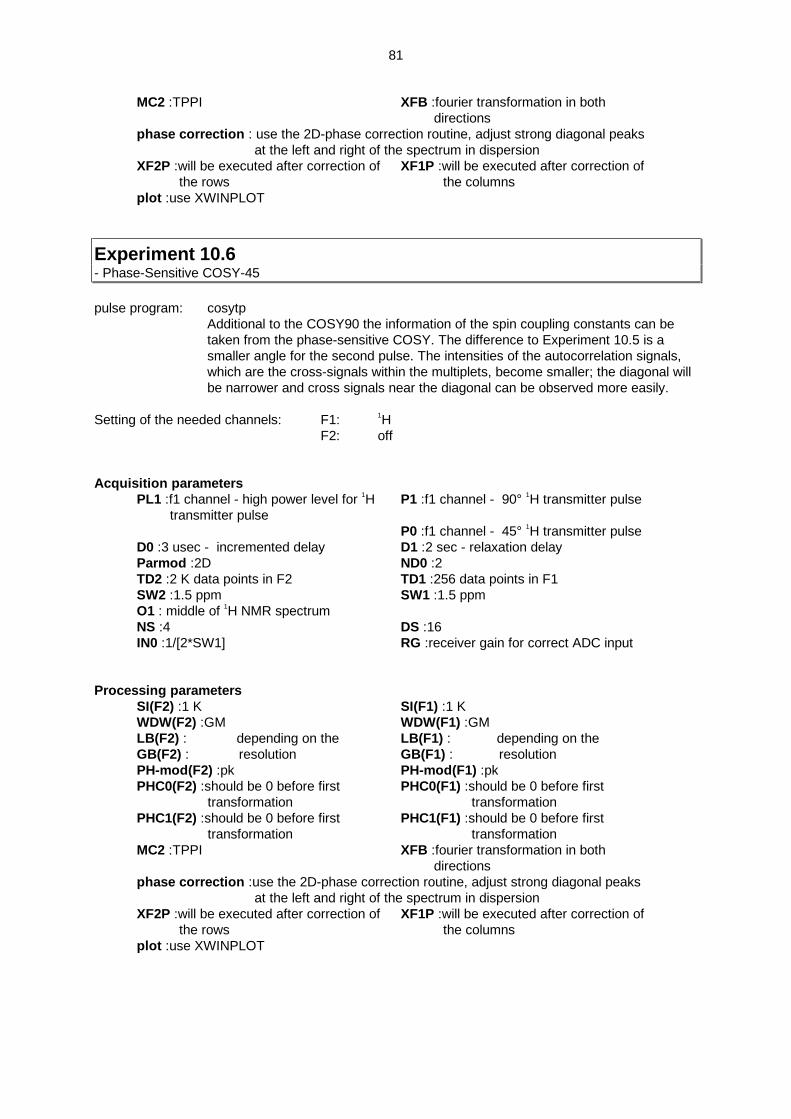
81
MC2 :TPPI XFB :fourier transformation in bothdirections
phase correction : use the 2D-phase correction routine, adjust strong diagonal peaksat the left and right of the spectrum in dispersion
XF2P :will be executed after correction ofthe rows
XF1P :will be executed after correction ofthe columns
plot :use XWINPLOT
Experiment 10.6- Phase-Sensitive COSY-45
pulse program: cosytpAdditional to the COSY90 the information of the spin coupling constants can betaken from the phase-sensitive COSY. The difference to Experiment 10.5 is asmaller angle for the second pulse. The intensities of the autocorrelation signals,which are the cross-signals within the multiplets, become smaller; the diagonal willbe narrower and cross signals near the diagonal can be observed more easily.
Setting of the needed channels: F1: 1HF2: off
Acquisition parametersPL1 :f1 channel - high power level for 1H
transmitter pulseP1 :f1 channel - 90° 1H transmitter pulse
P0 :f1 channel - 45° 1H transmitter pulseD0 :3 usec - incremented delay D1 :2 sec - relaxation delayParmod :2D ND0 :2TD2 :2 K data points in F2 TD1 :256 data points in F1SW2 :1.5 ppm SW1 :1.5 ppmO1 : middle of 1H NMR spectrumNS :4 DS :16IN0 :1/[2*SW1] RG :receiver gain for correct ADC input
Processing parametersSI(F2) :1 K SI(F1) :1 KWDW(F2) :GM WDW(F1) :GMLB(F2) : depending on the LB(F1) : depending on theGB(F2) : resolution GB(F1) : resolutionPH-mod(F2) :pk PH-mod(F1) :pkPHC0(F2) :should be 0 before first
transformationPHC0(F1) :should be 0 before first
transformationPHC1(F2) :should be 0 before first
transformationPHC1(F1) :should be 0 before first
transformationMC2 :TPPI XFB :fourier transformation in both
directionsphase correction :use the 2D-phase correction routine, adjust strong diagonal peaks
at the left and right of the spectrum in dispersionXF2P :will be executed after correction of
the rowsXF1P :will be executed after correction of
the columnsplot :use XWINPLOT
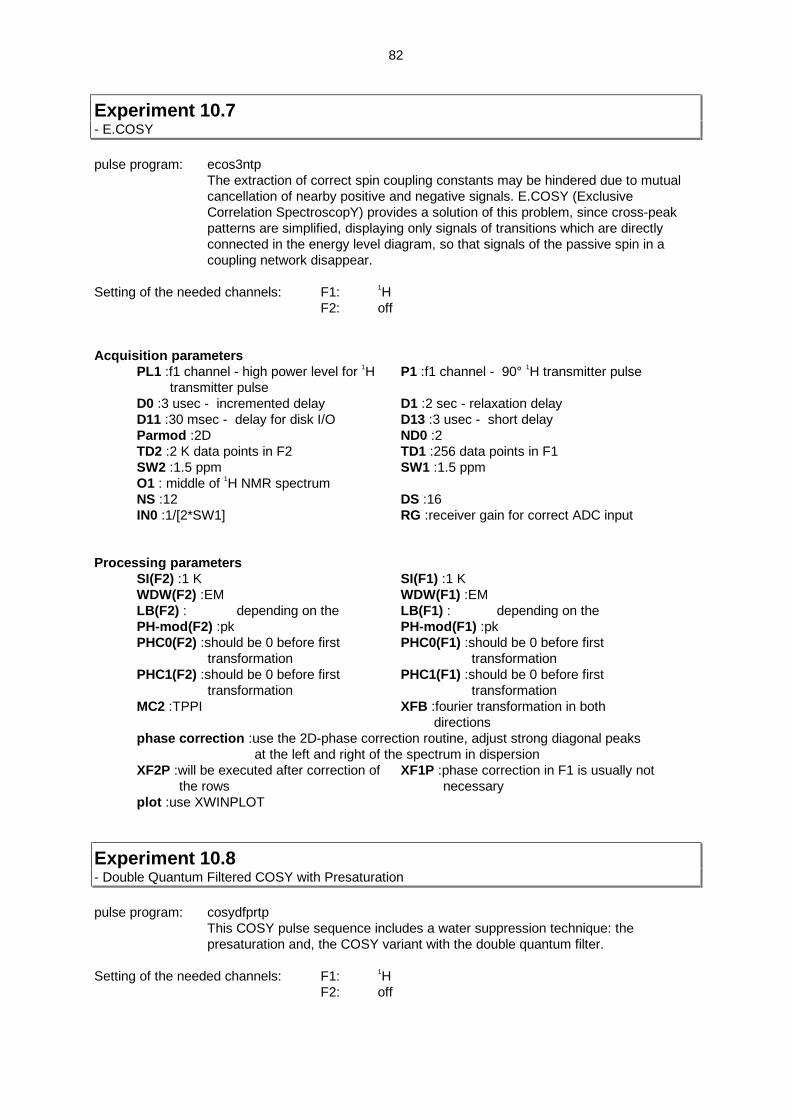
82
Experiment 10.7- E.COSY
pulse program: ecos3ntpThe extraction of correct spin coupling constants may be hindered due to mutualcancellation of nearby positive and negative signals. E.COSY (ExclusiveCorrelation SpectroscopY) provides a solution of this problem, since cross-peakpatterns are simplified, displaying only signals of transitions which are directlyconnected in the energy level diagram, so that signals of the passive spin in acoupling network disappear.
Setting of the needed channels: F1: 1HF2: off
Acquisition parametersPL1 :f1 channel - high power level for 1H
transmitter pulseP1 :f1 channel - 90° 1H transmitter pulse
D0 :3 usec - incremented delay D1 :2 sec - relaxation delayD11 :30 msec - delay for disk I/O D13 :3 usec - short delayParmod :2D ND0 :2TD2 :2 K data points in F2 TD1 :256 data points in F1SW2 :1.5 ppm SW1 :1.5 ppmO1 : middle of 1H NMR spectrumNS :12 DS :16IN0 :1/[2*SW1] RG :receiver gain for correct ADC input
Processing parametersSI(F2) :1 K SI(F1) :1 KWDW(F2) :EM WDW(F1) :EMLB(F2) : depending on the LB(F1) : depending on thePH-mod(F2) :pk PH-mod(F1) :pkPHC0(F2) :should be 0 before first
transformationPHC0(F1) :should be 0 before first
transformationPHC1(F2) :should be 0 before first
transformationPHC1(F1) :should be 0 before first
transformationMC2 :TPPI XFB :fourier transformation in both
directionsphase correction :use the 2D-phase correction routine, adjust strong diagonal peaks
at the left and right of the spectrum in dispersionXF2P :will be executed after correction of
the rowsXF1P :phase correction in F1 is usually not
necessaryplot :use XWINPLOT
Experiment 10.8- Double Quantum Filtered COSY with Presaturation
pulse program: cosydfprtpThis COSY pulse sequence includes a water suppression technique: thepresaturation and, the COSY variant with the double quantum filter.
Setting of the needed channels: F1: 1HF2: off
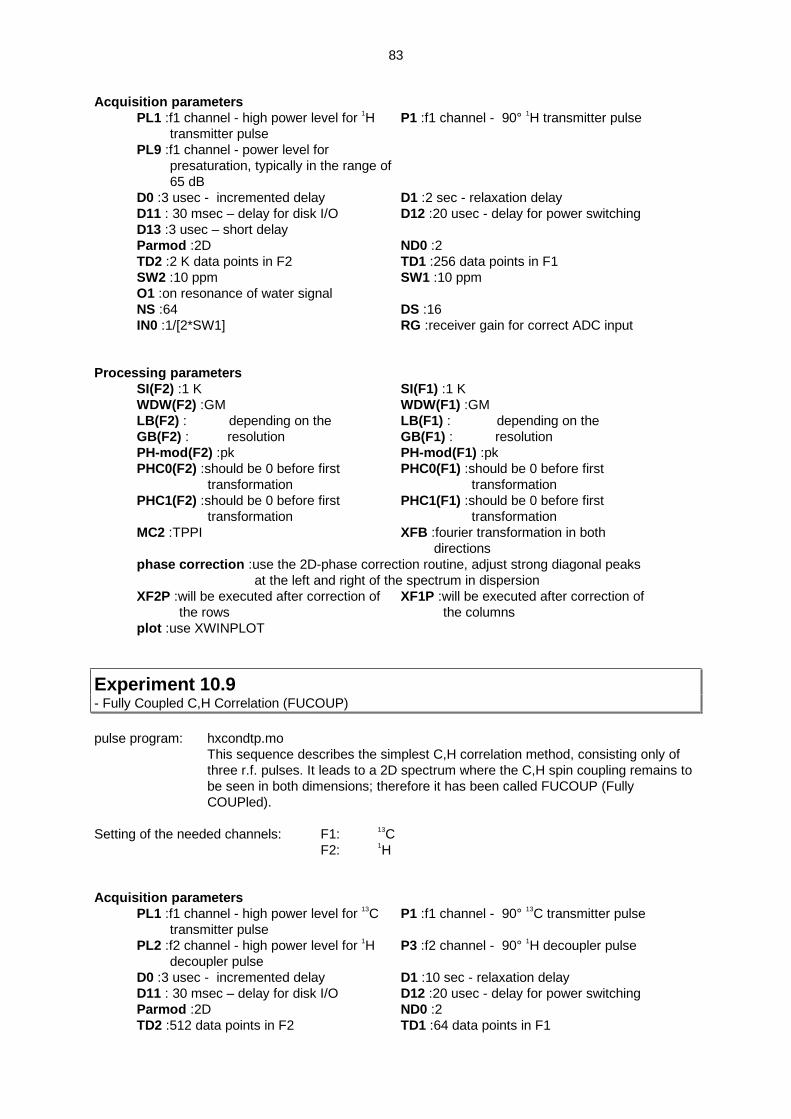
83
Acquisition parametersPL1 :f1 channel - high power level for 1H
transmitter pulseP1 :f1 channel - 90° 1H transmitter pulse
PL9 :f1 channel - power level forpresaturation, typically in the range of65 dB
D0 :3 usec - incremented delay D1 :2 sec - relaxation delayD11 : 30 msec – delay for disk I/O D12 :20 usec - delay for power switchingD13 :3 usec – short delayParmod :2D ND0 :2TD2 :2 K data points in F2 TD1 :256 data points in F1SW2 :10 ppm SW1 :10 ppmO1 :on resonance of water signalNS :64 DS :16IN0 :1/[2*SW1] RG :receiver gain for correct ADC input
Processing parametersSI(F2) :1 K SI(F1) :1 KWDW(F2) :GM WDW(F1) :GMLB(F2) : depending on the LB(F1) : depending on theGB(F2) : resolution GB(F1) : resolutionPH-mod(F2) :pk PH-mod(F1) :pkPHC0(F2) :should be 0 before first
transformationPHC0(F1) :should be 0 before first
transformationPHC1(F2) :should be 0 before first
transformationPHC1(F1) :should be 0 before first
transformationMC2 :TPPI XFB :fourier transformation in both
directionsphase correction :use the 2D-phase correction routine, adjust strong diagonal peaks
at the left and right of the spectrum in dispersionXF2P :will be executed after correction of
the rowsXF1P :will be executed after correction of
the columnsplot :use XWINPLOT
Experiment 10.9- Fully Coupled C,H Correlation (FUCOUP)
pulse program: hxcondtp.moThis sequence describes the simplest C,H correlation method, consisting only ofthree r.f. pulses. It leads to a 2D spectrum where the C,H spin coupling remains tobe seen in both dimensions; therefore it has been called FUCOUP (FullyCOUPled).
Setting of the needed channels: F1: 13CF2: 1H
Acquisition parametersPL1 :f1 channel - high power level for 13C
transmitter pulseP1 :f1 channel - 90° 13C transmitter pulse
PL2 :f2 channel - high power level for 1Hdecoupler pulse
P3 :f2 channel - 90° 1H decoupler pulse
D0 :3 usec - incremented delay D1 :10 sec - relaxation delayD11 : 30 msec – delay for disk I/O D12 :20 usec - delay for power switchingParmod :2D ND0 :2TD2 :512 data points in F2 TD1 :64 data points in F1
84
SW2 :500 Hz SW1 :500 HzO1 :on resonance of 13C NMR signal of
CHCl3O2 :on resonance of 1H NMR signal of
CHCl3NS :2 DS :16IN0 :1/[2*SW1] RG :receiver gain for correct ADC input
Processing parametersSI(F2) :512 W SI(F1) :128 WWDW(F2) :E_M WDW(F1) :EMLB(F2) : depending on the resolution LB(F1) : depending on the resolutionPH-mod(F2) :pk PH-mod(F1) :pkPHC0(F2) :should be 0 before first
transformationPHC0(F1) :90
PHC1(F2) :should be 0 before firsttransformation
PHC1(F2) :should be 0 before firsttransformation
MC2 :TPPI XFB :fourier transformation in bothdirections
phase correction :use the 2D-phase correction routine, adjust the phase in F2 to giveantiphase signals and 90o phase correction in F1
XF2P :will be executed after correction ofthe rows
plot :use XWINPLOT
Experiment 10.10- C,H Correlation by Polarization Transfer (HETCOR)
pulse program: hxcoThis 2D-method leads to a C,H correlation by polarization transfer. Cross signalsfor all protons and 13C nuclei which are connected by a 13C, 1H coupling over onebond are detected.
Setting of the needed channels: F1: 13CF2: 1H
Acquisition parametersPL1 :f1 channel - high power level for 13C
transmitter pulseP1 :f1 channel - 90° 13C transmitter pulse
P2 :f1 channel - 180° 13C transmitter pulsePL2 :f2 channel - high power level for 1H
decoupler pulseP3 :f2 channel - 90° 1H decoupler pulse
PL12 :f2 channel - power level for CPDdecoupling
PCPD2 :f2 channel - 90° pulse fordecoupling sequence
CPD2 :WALTZ16 - decoupling sequence,defined by cpdprg2
D0 :3 usec - incremented delay D1 :2 sec - relaxation delayD2 :1/[2J(C,H)]= 3.45 msec, calculated
from 1J(C,H)=145 HzD3:1/[3JC,H)]= 2.29ec, calculated from
1J(C,H)=145 HzD11 : 30 msec – delay for disk I/O D12 :20 usec - delay for power switchingParmod :2D ND0 :2TD2 :1 K data points in F2 TD1 :128 data points in F1SW2 :175 ppm SW1 :8 ppmO1 : middle of 13C NMR spectrum O2 :middle of 1H NMR spectrumNS :32 DS :16IN0 :1/[2*SW1] RG :receiver gain for correct ADC input
85
Processing parametersSI(F2) :512 W SI(F1) :256 WWDW(F2) :QSINE WDW(F1) :QSINESSB(F2) :2 SSB(F1) :2PH-mod(F2) :no PH-mod(F1) :mcMC2 :QF XFB :fourier transformation in both
directionsphase correction :not necessary plot :use XWINPLOT
Experiment 10.11- Long-Range C,H Correlation by Polarization Transfer
pulse program: hxcoIn this case it is possible to observe cross-signals for C,H spin pairs connected bytwo- or three-bond couplings 2J(C,H) or 3J(C,H). This can be achieved with thesame pulse sequence as used in the Experiment 10.8 by adjusting the appropriatedelays.
Setting of the needed channels: F1: 13CF2: 1H
Acquisition parametersPL1 :f1 channel - high power level for 13C
transmitter pulseP1 :f1 channel - 90° 13C transmitter pulse
P2 :f1 channel - 180° 13C transmitter pulsePL2 :f2 channel - high power level for 1H
decoupler pulseP3 :f2 channel - 90° 1H decoupler pulse
PL12 :f2 channel - power level for CPDdecoupling
PCPD2 :f2 channel - 90° pulse fordecoupling sequence
CPD2 :WALTZ16 - CPD decouplingsequence, defined by cpdprg2
D0 :3 usec - incremented delay D1 :2 sec - relaxation delayD2 :1/[2J(C,H)]= 50 msec, calculated from
nJ(C,H)=10 HzD3 :1/[3J(C,H)]= 33 msec, calculated from
nJ(C,H)=10 HzD11 : 30 msec – delay for disk I/O D12 :20 usec - delay for power switchingParmod :2D ND0 :2TD2 :1 K data points in F2 TD1 :128 data points in F1SW2 :175 ppm SW1 :8 ppmO1 : middle of 13C NMR spectrum O2 :middle of 1H NMR spectrumNS :64 DS :16IN0 :1/[2*SW1] RG :receiver gain for correct ADC input
Processing parametersSI(F2) :512 W SI(F1) :256 WWDW(F2) :QSINE WDW(F1) :QSINESSB(F2) :2 SSB(F1) :2PH-mod(F2) :no PH-mod(F1) :mcMC2 :QF XFB :fourier transformation in both
directionsphase correction :not necessary plot :use XWINPLOT
86
Experiment 10.12- C,H Correlation via Long-Range Couplings (COLOC)
pulse program: colocThe COLOC (Correlation spectroscopy via Long range Couplings) is a 2D-method,to get cross-signals for protons and 13C nuclei connected by two- or three-bondcouplings.
Setting of the needed channels: F1: 13CF2: 1H
Acquisition parametersPL1 :f1 channel – high power level for 13C
transmitter pulseP1 :f1 channel - 90° 13C transmitter pulse
P2 :f1 channel - 180° 13C transmitter pulsePL2 :f2 channel – high power level for 1H
decoupler pulseP3 :f2 channel - 90° 1H decoupler pulse
P4 :f2 channel - 180° 1H decoupler pulsePL12 :f2 channel - power level for CPD
decouplingPCPD2 :f2 channel - 90° pulse for
decoupling sequenceCPD2 :WALTZ16 - CPD decoupling
sequence, defined by cpdprg2D0 :3 usec - incremented delay D1 :2 sec - relaxation delayD6 :25 msec – note that D6 must be larger
than TD1 times 1/[2*SW1]D11 : 30 msec - delay for disk I/O
D12 :20 usec – delay for power switching D18 :1/[3J(C,H)]= 33 msec, calculatedfrom nJ(C,H)=10 Hz
Parmod :2D ND0 :2TD2 :1 K data points in F2 TD1 :64 data points in F1SW2 :175 ppm SW1 :8 ppmO1 : middle of 13C NMR spectrum O2 :middle of 1H NMR spectrumNS :128 DS :16IN0 :1/[2*SW1] RG :receiver gain for correct ADC input
Processing parametersSI(F2) :512 W SI(F1) :256 WWDW(F2) :QSINE WDW(F1) :QSINESSB(F2) :2 SSB(F1) :2PH-mod(F2) :no PH-mod(F1) :mcMC2 :QF XFB :fourier transformation in both
directionsphase correction :not necessary plot :use XWINPLOT
Experiment 10.13- The Basic HMQC Experiment
pulse program: inv4ndThis is the basic HMQC (Heteronuclear Multiple Quantum Coherence) method. It isthe simplest form of an inverse H,X correlation technique. The suppression of theunwanted signals is performed only by the phase cycle. This experiment is withoutdecoupling.
Setting of the needed channels: F1: 1HF2: 13C
87
Acquisition parametersPL1 :f1 channel - high power level for 1H
transmitter pulseP1 :f1 channel - 90° 1H transmitter pulse
P2 :f1 channel - 180° 1H transmitter pulsePL2 :f2 channel - high power level for 13C
decoupler pulseP3 :f2 channel - 90° 13C decoupler pulse
D0 :3 usec - incremented delayD1 :2 sec – relaxation delay D2 :1/[2J(C,H)]= 3.5 msec, calculated from
1J(C,H)=145 HzParmod :2D ND0 :2TD2 :1 K data points in F2 TD1 :128 data points in F1SW2 :8 ppm SW1 :175 ppmO1 : middle of 1H NMR spectrum O2 : middle of 13C NMR spectrumNS :8 DS :16IN0 :1/[2*SW1] RG :receiver gain for correct ADC input
Processing parametersSI(F2) :512 W SI(F1) :256 WWDW(F2) :QSINE WDW(F1) :QSINESSB(F2) :2 SSB(F1) :2PH-mod(F2) :no PH-mod(F1) :mcMC2 :QF XFB :fourier transformation in both
directionsphase correction :not necessary plot :use XWINPLOT
Experiment 10.14- Phase-Sensitive HMQC with BIRD Filter and GARP Decoupling
pulse program: invbtpThis experiment gives an inverse H,C correlation. The suppression of the H-12Csignals is performed with a BIRD sandwich and the decoupling is done with GARP(Globally optimized Alternating-phase Rectangular Pulses).
Setting of the needed channels: F1: 1HF2: 13C
Acquisition parametersPL1 :f1 channel - high power level for 1H
transmitter pulseP1 :f1 channel - 90° 1H transmitter pulse
P2 :f1 channel - 180° 1H transmitter pulsePL2 :f2 channel - high power level for 13C
decoupler pulseP3 :f2 channel - 90° 13C decoupler pulse
P4 :f2 channel - 180° 13C decoupler pulsePL12 :f2 channel - power level for CPD
decouplingPCPD2 :f2 channel - 90° pulse for
decoupling sequenceCPD2 :GARP- CPD decoupling sequence,
defined by cpdprg2D0 :3 usec - incremented delay D1 :1 sec - relaxation delayD2 :1/[2J(C,H)]= 3.5 msec, calculated from
1J(C,H)=145 HzD7 :ca. 1 sec - BIRD delay to be optimized
for minimum FID; observe in the set-upmode the incoming FID and adjust D7for minimum intensity
Parmod :2D ND0 :4TD2 :1 K data points in F2 TD1 :128 data points in F1SW2 :8 ppm SW1 :175 ppm
88
O1 :middle of 1H NMR spectrum O2 :middle of 13C NMR spectrumNS :8 DS :16IN0 :1/[4*SW1] RG :receiver gain for correct ADC input
Processing parametersSI(F2) :512 W SI(F1) :256 WWDW(F2) :GM WDW(F1) :GMLB(F2) : depending on the LB(F1) : depending on theGB(F2) : resolution GB(F1) : resolutionPH-mod(F2) :pk PH-mod(F1) :pkPHC0(F2) :should be 0 before first
transformationPHC0(F1) :can be set by au-program
calcphinvPHC1(F2) :should be 0 before first
transformationPHC1(F1) :can be set by au-program
calcphinvMC2 :TPPI XFB :fourier transformation in both
directionsphase correction :use the 2D-phase
correction routine,correct the signalspositive
au-program :calcphinv (to calculate phasefor F1)
XF2P :will be executed after correction ofthe rows
plot :use XWINPLOT
Experiment 10.15- Poor Man’s Gradient HMQC
pulse program: exp10_15.moA spin-lock pulse in connection with the BIRD sequence, reduces unwantedsignals nearly to the level known from pulsed field gradients and allows the use ofa higher receiver gain.
Setting of the needed channels: F1: 1HF2: 13C
Acquisition parametersPL1 :f1 channel - high power level for 1H
transmitter pulseP1 :f1 channel - 90° 1H transmitter pulse
P2 :f1 channel - 180° 1H transmitter pulseP28 :f1 channel - spin-lock pulse, 2 msec!
Not more!PL2 :f2 channel - high power level for 13C
decoupler pulseP3 :f2 channel - 90° 13C decoupler pulse
P4 :f2 channel - 180° 13C decoupler pulsePL12 :f2 channel - power level for CPD
decouplingPCPD2 :f2 channel - 90° pulse for
decoupling sequenceCPD2 :GARP- CPD decoupling sequence,
defined by cpdprg2D0 :3 usec - incremented delay D1 :1 sec - relaxation delayD2 :1/[2J(C,H)]= 3.5 msec, calculated from
1J(C,H)=145 HzD7 :ca. 1 sec - BIRD delay to be optimized
for minimum FID; observe in the set-upmode the incoming FID and adjust D7for minimum intensity
D4 :1/[4J(C,H)]= 1.75 msec, calculatedfrom 1J(C,H)=145 Hz
Parmod :2D ND0 :4
89
TD2 :1 K data points in F2 TD1 :128 data points in F1SW2 :8 ppm SW1 :175 ppmO1 :middle of 1H NMR spectrum O2 :middle of 13C NMR spectrumNS :2 DS :16IN0 :1/[4*SW1] RG :receiver gain for correct ADC input
Processing parametersSI(F2) :512 W SI(F1) :256 WWDW(F2) :GM WDW(F1) :GMLB(F2) : depending on the LB(F1) : depending on theGB(F2) : resolution GB(F1) : resolutionPH-mod(F2) :pk PH-mod(F1) :pkPHC0(F2) :should be 0 before first
transformationPHC0(F1) :can be set by au-program
calcphinvPHC1(F2) :should be 0 before first
transformationPHC1(F1) :can be set by au-program
calcphinvMC2 :TPPI XFB :fourier transformation in both
directionsphase correction :use the 2D-phase
correction routine,correct the signalspositive
au-program :calcphinv (to calculate phasefor F1)
XF2P :will be executed after correction ofthe rows
plot :use XWINPLOT
Experiment 10.16- Phase-Sensitive HMBC with BIRD Filter
pulse program: invblrndtp.moTo obtain long-range H,C correlations a special sequence called HMBC(Heteronuclear Multiple Bond Correlation) was developed. The purpose of thismethod is to suppress correlations via 1J(C,H). This is a phase-sensitive versionwithout decoupling.
Setting of the needed channels: F1: 1HF2: 13C
Acquisition parametersPL1 :f1 channel - high power level for 1H
transmitter pulseP1 :f1 channel - 90° 1H transmitter pulse
P2 :f1 channel - 180° 1H transmitter pulsePL2 :f2 channel - high power level for 13C
decoupler pulseP3 :f2 channel - 90° 13C decoupler pulse
P4 :f2 channel - 180° 13C decoupler pulseD0 :3 usec - incremented delay D1 :1 sec - relaxation delayD2 :1/[2J(C,H)]= 3.5 msec, calculated from
1J(C,H)=145 HzD6 :1/[2J(C,H)]= 50 msec, calculated from
nJ(C,H)=10 HzD7 :ca. 1 sec – BIRD delay to be optimized
for minimum FID; observe in the set-upmode the incoming FID and adjust D7for minimum intensity
D15 :46.5 msec - D6-D2
Parmod :2D ND0 :4TD2 :1 K data points in F2 TD1 :128 data points in F1SW2 :8 ppm SW1 :175 ppmO1 :middle of 1H NMR spectrum O2 :middle of 13C NMR spectrum
90
NS :128 DS :16IN0 :1/[4*SW1] RG :receiver gain for correct ADC input
Processing parametersSI(F2) :512 W SI(F1) :256 WWDW(F2) :GM WDW(F1) :GMLB(F2) : depending on the LB(F1) : depending on theGB(F2) : resolution GB(F1) : resolutionPH-mod(F2) :pk PH-mod(F1) :pkPHC0(F2) :should be 0 before first
transformationPHC0(F1) :can be set by au-program
calcphinvPHC1(F2) :should be 0 before first
transformationPHC1(F1) :can be set by au-program
calcphinvMC2 :TPPI XFB :fourier transformation in both
directionsphase correction :use the 2D-phase
correction routine,correct the signalspositive
au-program :calcphinv (to calculate phasefor F1)
XF2P :will be executed after correction ofthe rows
plot :use XWINPLOT
Experiment 10.17- The Basic HSQC Experiment
pulse program: invindtp.moThe HSQC (Heteronuclear Single Quantum Coherence) method performs the H,Ccorrelation via the 13C chemical shift evolution of a single quantum coherence. Inthis sequence the signals are not broadened by homonuclear H,H couplings in F1.This experiment is without decoupling.
Setting of the needed channels: F1: 1HF2: 13C
Acquisition parametersPL1 :f1 channel - high power level for 1H
transmitter pulseP1 :f1 channel - 90° 1H transmitter pulse
P2 :f1 channel - 180° 1H transmitter pulsePL2 :f2 channel - high power level for 13C
decoupler pulseP3 :f2 channel - 90° 13C decoupler pulse
P4 :f2 channel - 180° 13C decoupler pulseD0 :3 usec - incremented delay D1 :2 sec - relaxation delayD4 :1/[4J(C,H)]= 1.72 msec, calculated
from 1J(C,H)=145 HzParmod :2D ND0 :4TD2 :1 K data points in F2 TD1 :128 data points in F1SW2 :8 ppm SW1 :175 ppmO1 :middle of 1H NMR spectrum O2 :middle of 13C NMR spectrumNS :8 DS :16IN0 :1/[4*SW1] RG :receiver gain for correct ADC input
Processing parametersSI(F2) :512 W SI(F1) :256 WWDW(F2) :EM WDW(F1) :EM
91
LB(F2) : depending on the resolution LB(F1) : depending on the resolutionPH-mod(F2) :pk PH-mod(F1) :pkPHC0(F2) :should be 0 before first
transformationPHC0(F1) :can be set by au-program
calcphinvPHC1(F2) :should be 0 before first
transformationPHC1(F1) : can be set by au-program
calcphinvMC2 :TPPI XFB :fourier transformation in both
directionsphase correction :use the 2D-phase
correction routine,correct the signalspositive
au-program :calcphinv (to calculate phasefor F1)
XF2P :will be executed after correction ofthe rows
plot :use XWINPLOT
Experiment 10.18- The HOHAHA or TOCSY Experiment
pulse program: mlevtpThe TOCSY (Total Correlation SpectroscopY) method can give a total correlationof all protons of a chain with each other. This is the phase-sensitive variant.
Setting of the needed channels: F1: 1HF2: off
Acquisition parametersPL1 :f1 channel - high power level for 1H
transmitter pulseP1 :f1 channel - 90° 1H transmitter pulse
PL10 :f1 channel - power level for TOCSY-spinlock
P5 :f1 channel - 60° 1H transmitter lowpower pulse
P6 :f1 channel - 90° 1H transmitter lowpower pulse
P7 :f1 channel - 180° 1H transmitter lowpower pulse
P17 :f1 channel - 2.5 msec trim pulseD0 :3 usec - incremented delay D1 :2 sec - relaxation delayD9 :200 msec – TOCSY mixing time D12 :20 usec - delay for power switchingParmod :2D ND0 :2TD2 :1 K data points in F2 TD1 :128 data points in F1SW2 :10 ppm SW1 :10 ppmO1 : middle of 1H NMR spectrumNS :4 DS :16IN0 :1/[2*SW1] RG :receiver gain for correct ADC input
Processing parametersSI(F2) :512 W SI(F1) :512 WWDW(F2) :EM WDW(F1) :EMLB(F2) : depending on the resolution LB(F1) : depending on the resolutionPH-mod(F2) :pk PH-mod(F1) :pkPHC0(F2) :should be 0 before first
transformationPHC0(F1) :should be 0 before first
transformationPHC1(F2) :should be 0 before first
transformationPHC1(F1) :should be 0 before first
transformationMC2 :TPPI XFB :fourier transformation in both
directions
92
phase correction :use the 2D-phasecorrection routine,correct the signalspositive.
XF2P :will be executed after correction ofthe rows
XF1P :will be executed after correction ofthe columns
plot :use XWINPLOT
Experiment 10.19- The NOESY Experiment
pulse program: noesytpThe NOESY (Nuclear Overhauser Enhancement SpectroscopY) experiment is the2D equivalent of the NOE difference experiment and yields correlation signalswhich are caused by dipolar cross-relaxation between nuclei in a close spatialrelationship.
Setting of the needed channels: F1: 1HF2: off
Acquisition parametersPL1 :f1 channel - high power level for 1H
transmitter pulseP1 :f1 channel - 90° 1H transmitter pulse
D0 :3 usec - incremented delay D1 :2 sec - relaxation delayD8 :2 sec – mixing timeParmod :2D ND0 :2TD2 :1 K data points in F2 TD1 :256 data points in F1SW2 :10 ppm SW1 :10 ppmO1 :middle of 1H NMR spectrumNS :16 DS :16IN0 :1/[2*SW1] RG :receiver gain for correct ADC input
Processing parametersSI(F2) :512 W SI(F1) :512 WWDW(F2) :EM WDW(F1) :EMLB(F2) : depending on the resolution LB(F1) : depending on the resolutionPH-mod(F2) :pk PH-mod(F1) :pkPHC0(F2) :should be 0 before first
transformationPHC0(F1) :should be 0 before first
transformationPHC1(F2) :should be 0 before first
transformationPHC1(F1) :should be 0 before first
transformationMC2 :TPPI XFB :fourier transformation in both
directionsphase correction :use the 2D-phase
correction routine,adjust the phase of thediagonal signals sothat they are negative.
XF2P :will be executed after correction ofthe rows
XF1P :will be executed after correction ofthe columns
plot :use XWINPLOT
93
Experiment 10.20- The CAMELSPIN or ROESY Experiment
pulse program: roesytp.2This is a 2D version of the ROESY (Rotating frame Overhauser EnhancementSpectroscopY) experiment. It is an experiment to measure NOE, but under spin-lock conditions. It is used for molecules with a molar mass in the order of 1000 to3000, because the cross-signals measured with the NOESY (Nuclear OverhauserEnhancement SpectroscopY) may disappear.
Setting of the needed channels: F1: 1HF2: off
Acquisition parametersPL1 :f1 channel - high power level for 1H
transmitter pulseP1 :f1 channel - 90° 1H transmitter pulse
PL11 :f1 channel - power level for ROESY-spinlock, 23 dB was used here
P25 :f1 channel - 180° pulse at transmitterattenuation of spin-lock, here 180 usec
P15 :f1 channel – pulse for ROESYspinlock, here 300 msec
D0 :3 usec - incremented delayD1 :2 sec – relaxation delay D12 :20 usec - delay for power switchingL4 :832 for 300 msec spin-lock. The loop
parameter must be an even number.Parmod :2D ND0 :2TD2 :1 K data points in F2 TD1 :256 data points in F1SW2 :10 ppm SW1 :10 ppmO1 : middle of 1H NMR spectrumNS :16 DS :16IN0 :1/[2*SW1] RG :receiver gain for correct ADC input
Processing parametersSI(F2) :512 W SI(F1) :512 WWDW(F2) :EM WDW(F1) :QSINELB(F2) :depending on the resolution SSB(F1) :2PH-mod(F2) :pk PH-mod(F1) :pkPHC0(F2) :should be 0 before first
transformationPHC0(F1) :should be 0 before first
transformationPHC1(F2) :should be 0 before first
transformationPHC1(F1) :should be 0 before first
transformationMC2 :TPPI XFB :fourier transformation in both
directionsphase correction : use the 2D-phase correction routine, adjust the phase of the
diagonal signals negative, so that the ROESY correlation signalsare positive.
XF2P :will be executed after correction ofthe rows
XF1P :will be executed after correction ofthe columns
plot :use XWINPLOT

94
Experiment 10.21- The HOESY Experiment
pulse program: hoesyThe HOESY (Heteronuclear Overhauser Enhancement SpectroscopY) is a 2Dexperiment to measure the heteronuclear Overhauser effect.
Setting of the needed channels: F1: 6LiF2: 1H
Acquisition parametersPL1 :f1 channel - high power level for 6Li
transmitter pulseP1 :f1 channel - 90° 6Li transmitter pulse
P2 :f1 channel - 180° 6Li transmitter pulsePL2 :f2 channel - high power level for 1H
decoupler pulseP3 :f2 channel - 90° 1H decoupler pulse
PL12 :f2 channel - power level for CPDdecoupling
PCPD2 :f2 channel - 90° pulse fordecoupling sequence
CPD2 :WALTZ16 - CPD decouplingsequence, defined by cpdprg2
D0 :3 usec - incremented delay D1 :6 sec - relaxation delayD9 :1.7 sec – mixing time D12 :20 usec - delay for power switchingParmod :2D ND0 :2TD2 :512 data points in F2 TD1 :128 data points in F1SW2 :4 ppm SW1 :9 ppmO1 : middle of 6Li NMR spectrum O2 :middle of 1H NMR spectrumNS :32 DS :16IN0 :1/[2*SW1] RG :receiver gain for correct ADC input
Processing parametersSI(F2) :256 W SI(F1) :256 WWDW(F2) :EM WDW(F1) :EMLB(F2) :depending on the resolution LB(F1) : depending on the resolutionPH-mod(F2) :no PH-mod(F1) :mcMC2 :QF XFB :fourier transformation in both
directionsphase correction :not necessary plot :use XWINPLOT
Experiment 10.22- 2D-INADEQUATE
pulse program: inadThe INADEQUTE (Incredible Natural Abundance DoublE QUAntum TransferExperiment) is a 2D experiment. It observe 13C,13C couplings over two bonds andsuppress the strong 12C signals.
Setting of the needed channels: F1: 13CF2: 1H
Acquisition parametersPL1 :f1 channel - high power level for 13C
transmitter pulseP1 :f1 channel - 90° 13C transmitter pulse
P2 :f1 channel - 180° 13C transmitter pulse
95
PL12 :f2 channel - power level for CPDdecoupling
PCPD2 :f2 channel - 90° pulse fordecoupling sequence
CPD2 :WALTZ16 - CPD decouplingsequence, defined by cpdprg2
D0 :3 usec - incremented delay D1 :3 sec - relaxation delayD4 :1/[4J(C,C)]= 7.6 msec, calculated from
1J(C,C)=33 HzD11 : 30 msec - delay for disk I/O
Parmod :2D ND0 :1TD2 :1 K data points in F2 TD1 :128 data points in F1O1 : middle of 13C NMR spectrumSW2 :60 ppm SW1 :120 ppm (double quantum
frequency)NS :128 DS :16IN0 :1/[2*SW2] RG :receiver gain for correct ADC input
Processing parametersSI(F2) :512 W SI(F1) :256 WWDW(F2) :SINE WDW(F1) :SINESSB(F2) :2 SSB(F1) :2PH-mod(F2) :no PH-mod(F1) :mcMC2 :QF XFB :fourier transformation in both
directionsphase correction :not necessary plot :use XWINPLOT
Experiment 10.23- The EXSY Experiment
pulse program: noesytpThe 2D EXSY (Exchange SpectroscopY) method can indicate chemical exchangebefore line-broadening occurs. the pulse sequence is exactly the same as thatused for phase-sensitive NOESY.
Setting of the needed channels: F1: 1HF2: off
Acquisition parametersPL1 :f1 channel - high power level for 1H
transmitter pulseP1 :f1 channel - 90° 1H transmitter pulse
D0 :3 usec - incremented delay D1 :2 sec - relaxation delayD8 :1 sec – mixing timeParmod :2D ND0 :2TD2 :512 data points in F2 TD1 :32 data points in F1SW2 :0.7 ppm SW1 :0.7 ppmO1 : middle of methyl group regionNS :4 DS :16IN0 :1/[2*SW1] RG :receiver gain for correct ADC input
Processing parametersSI(F2) :256 W SI(F1) :256 WWDW(F2) :EM WDW(F1) :EMLB(F2) :depending on the resolution LB(F1) : depending on the resolutionPH-mod(F2) :pk PH-mod(F1) :pkPHC0(F2) :should be 0 before first
transformationPHC0(F1) :should be 0 before first
transformation
96
PHC1(F2) :should be 0 before firsttransformation
PHC1(F1) :should be 0 before firsttransformation
MC2 :TPPI XFB :fourier transformation in bothdirections
phase correction : use the 2D-phase correction routine, phase correction is usuallyonly necessary in F2, the cross-signals have the same phase asthe diagonal signals
XF2P :will be executed after correction ofthe rows
XF1P :will be executed after correction ofthe columns
plot :use XWINPLOT
Experiment 10.24- X, Y Correlation
a) pulse program: coxyf3.moThis experiment correlates two hetero-atoms X and Y with each other undercomplete proton decoupling. For this experiment a tripleresonance probe-head anda three-channel spectrometer are required.
Setting of the needed channels: F1: mY (13C)F2: 1HF3: nX (31P)
Acquisition parametersPL1 :f1 channel - high power level for 13C
transmitter pulseP1 :f1 channel - 90° 13C transmitter pulse
P2 :f1 channel - 180° 13C transmitter pulsePL3 :f3 channel - high power level for 31P
decoupler pulseP21 :f3 channel - 90° 31P decoupler pulse
PL12 :f2 channel - power level for CPD/BBdecoupling
PCPD2 :f2 channel - 90° pulse fordecoupling sequence
D0 :3 usec - incremented delay D1 :2 sec - relaxation delayD11 :30 msec – delay for disk I/O D22 :1/[2J(X,Y)]= 25 msec, calculated
from nJ(X,Y)=20 HzParmod :2D ND0 :2TD2 :1 K data points in F2 TD1 :64 data points in F1SW2 :12 ppm SW1 :1 ppmO1 :middle of 13C NMR spectrum O2 :middle of 1H NMR spectrumO3 :middle of 31P NMR spectrumNS :8 DS :16IN0 :1/[2*SW1] RG :receiver gain for correct ADC input
Processing parametersSI(F2) :512 W SI(F1) :256 WWDW(F2) :SINE WDW(F1) :SINESSB(F2) : 0 SSB(F1) : 0PH-mod(F2) :no PH-mod(F1) :mcMC2 :QF XFB :fourier transformation in both
directionsphase correction :not necessary plot :use XWINPLOT
b) pulse program: inv4xyf3.mocompare with Experiment 10.24 a)
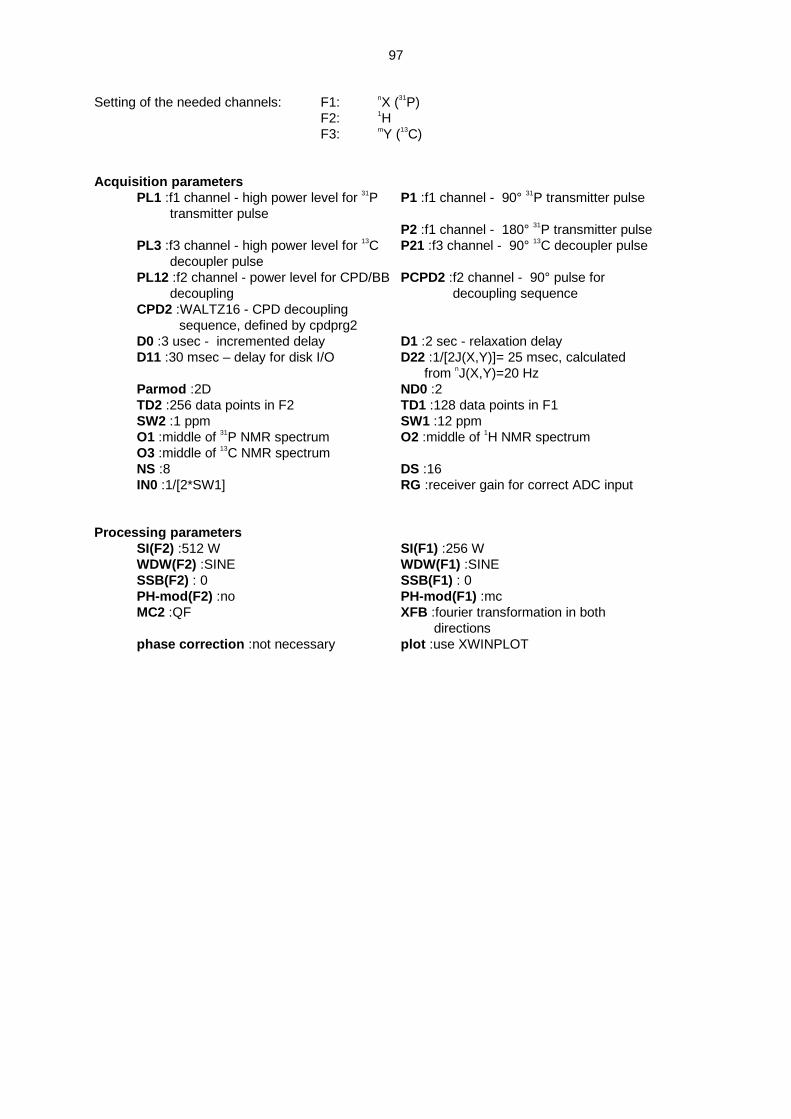
97
Setting of the needed channels: F1: nX (31P)F2: 1HF3: mY (13C)
Acquisition parametersPL1 :f1 channel - high power level for 31P
transmitter pulseP1 :f1 channel - 90° 31P transmitter pulse
P2 :f1 channel - 180° 31P transmitter pulsePL3 :f3 channel - high power level for 13C
decoupler pulseP21 :f3 channel - 90° 13C decoupler pulse
PL12 :f2 channel - power level for CPD/BBdecoupling
PCPD2 :f2 channel - 90° pulse fordecoupling sequence
CPD2 :WALTZ16 - CPD decouplingsequence, defined by cpdprg2
D0 :3 usec - incremented delay D1 :2 sec - relaxation delayD11 :30 msec – delay for disk I/O D22 :1/[2J(X,Y)]= 25 msec, calculated
from nJ(X,Y)=20 HzParmod :2D ND0 :2TD2 :256 data points in F2 TD1 :128 data points in F1SW2 :1 ppm SW1 :12 ppmO1 :middle of 31P NMR spectrum O2 :middle of 1H NMR spectrumO3 :middle of 13C NMR spectrumNS :8 DS :16IN0 :1/[2*SW1] RG :receiver gain for correct ADC input
Processing parametersSI(F2) :512 W SI(F1) :256 WWDW(F2) :SINE WDW(F1) :SINESSB(F2) : 0 SSB(F1) : 0PH-mod(F2) :no PH-mod(F1) :mcMC2 :QF XFB :fourier transformation in both
directionsphase correction :not necessary plot :use XWINPLOT
98
Chapter 11
- NMR Spectroscopy with Pulsed Field Gradients
SummaryExperiment Pulse program Description
11.1 calibgp Calibration of Pulsed FieldGradients
11.2 preempgp2.mo Gradient Preemphasis11.3 calibam.mo Gradient Amplifier Test11.4 zggp30.mo Determination of Pulsed Field
Gradient Ring-Down Delays11.5 zggpse The Pulsed Gradient Spin-Echo
Experiment11.6 Excitation Pattern of Selective
Pulses11.7 exp11_7.mo The Gradient zz-Filter11.8 selcogp.mo gs-SELCOSY11.9 selgpml.mo gs-SELTOCSY11.10 selnogp.3 DPFGSE-NOE11.11 selincorgp.mo gs-SELINCOR11.12 GRECCO11.13 p3919gp WATERGATE11.14 dpfgse.mo Water Suppression by Excitation
Sculpting
Experiment 11.1- Calibration of Pulsed Field Gradients
pulse program: calibgpCalibration of gradient strength
This experiment needs a special sample, preparation as described in the book.
Setting of the needed channels: F1: 1HF2: off
Acquisition parametersPL1 :f1 channel - high power level for 1H
transmitter pulseP1 :f1 channel - 90° 1H transmitter pulse
P2 :f1 channel - 180° 1H transmitter pulseP16 : 10 msec - homospoil/gradient pulse
D1 :1 sec - relaxation delay D11 :delay for disk I/OD12 :delay for power switchingD16 :100 usec - delay for
homospoil/gradient recoveryD28 :equal to aq
TD :2 K SW :100 KHzO1 :on resonance of water signal gpz 1 :1%NS :2 RG :receiver gain for correct ADC input
99
Processing parametersSI :1 K BC_mod :quadWDW :EM LB :20 HzFT :Fourier transformation phase correction :mcMeasure the width of the dip (Hz), and calculate the gradient strength GZ according tothe Equation.
Experiment 11.2- Gradient Preemphasis
pulse program: preempgp2.moIn this experiment it is described how to adjust the preemphasis using a sample ofchloroform.
Setting of the needed channels: F1: 1HF2: off
Acquisition parametersPL1 :f1 channel - high power level for 1H
transmitter pulseP0 :f1 channel - 10° 1H transmitter power
pulseP16 : 1 msec - homospoil/gradient pulse
D1 :0.1 sec - relaxation delay D16 :300 msec-50 usec - delay forhomospoil/gradient recovery, will bevaried
TD :4 K SW :5000 HzO1 :1000 Hz off resonance from CHCl3
signalNS :1
GPNAM1 : rectangular.1 gpz 1 :75%RG :receiver gain for correct ADC input
Processing parametersNo processing required
Experiment 11.3- Gradient Amplifier Test
pulse program: calibam.moThe simple test checks whether positive and negative gradient pulses have thesame effect and thus detects any imbalance of the configuration.
Setting of the needed channels: F1: 1HF2: off
Acquisition parametersPL1 :f1 channel - high power level for 1H
transmitter pulseP1 :f1 channel - 90° 1H transmitter power
pulseP16 : 1 msec - homospoil/gradient pulse
D1 :5 sec - relaxation delay D16 :100 usec - delay forhomospoil/gradient recovery
TD :4 K SW :500 HzO1 :on resonance of CHCl3 signal NS :16gpnam1 :SINE.100 gpz 1 :50%
100
gpnam2 :SINE.100 gpz 2 :-50%DS :4 RG :receiver gain for correct ADC input
Processing parametersSI :2 K BC_mod :quadWDW :EM LB :2 HzFT :Fourier transformation phase correction :adjust to pure
absorption.baseline correction :ABS referencing :set the TMS signal to 0 ppmplot :use XWINPLOT
Experiment 11.4- Determination of Pulsed Field Gradient Ring-Down Delays
pulse program: zggp30.moThe experiment described here demonstrates a calibration routine to define asuitable ringdown delay.
Setting of the needed channels: F1: 1HF2: off
Acquisition parametersPL1 :f1 channel - high power level for 1H
transmitter pulseP1 :f1 channel - 90° 1H transmitter power
pulseP16 : 1msec - homospoil/gradient pulse
D1 :5 sec - relaxation delay D16 :1sec - 1 usec - to be variedD11 :30 msec - delay for disk I/OTD :4 K SW :500 HzO1 :on resonance of CHCl3 signal NS :1gpnam1 :rectangular.1 gpz 1 :80%RG :receiver gain for correct ADC input
Processing parametersSI :2 K BC_mod :quadWDW :EM LB :2 HzFT :Fourier transformation phase correction : adjust the signals to
pure absorption.baseline correction :ABS plot :use XWINPLOT
Experiment 11.5- The Pulsed Gradient Spin-Echo Experiment
pulse program: zggpseThis spin-echo experiment can be used to determine the strength of field gradients,if the diffusion constant of the sample is accurately known by other means.
Setting of the needed channels: F1: 1HF2: off
Acquisition parametersPL1 :f1 channel - high power level for 1H P1 :f1 channel - 90° 1H transmitter pulse
101
transmitter pulseP2 :f1 channel - 180° 1H transmitter pulseP16 : 4 msec - homospoil/gradient pulse,
variable strength from 0 to 0.2 T/m in10 steps
D1 :2 sec - relaxation delay D16 :500 usec - delay forhomospoil/gradient recovery
TD :1 K SW :1000 HzO1 :on resonance of water signalgpnam1 :SINE.100gpnam2 :SINE.100
gpz 1 :1%gpz 2 :1%
NS :2 RG :receiver gain for correct ADC input
Processing parametersProcess all 10 spectra identically.SI :512 W BC_mod :quadWDW :EM LB :5 HzFT :Fourier transformation phase correction :adjust the phase to
pure absorption.baseline correction :ABSintegration :integrate the water signal in all spectra and refer all integrals to the integral
value of the starting spectrum with gradient stength of 0. Compile a tableof integral ratios Ig/I0 vs. gradient strength G used, where the gradientstength is determined as described in Experiment 11.1.
Experiment 11.6- Excitation Pattern of Selective Pulses
a) pulse program:The width of the excitation of a selective pulse corresponds only very roughly tothe inverse of ist duration. This method produces an image of the excitation patternin one scan and provide determinations of the excitation pattern of a a) 90o and ab) 180o selective pulse.
Setting of the needed channels: F1: 1HF2: off
Acquisition parameters
Processing parameters
b) pulse program:compare with Exp. 11.6 a)
Setting of the needed channels: F1: 1HF2: off
102
Acquisition parameters
Processing parameters
Experiment 11.7- The Gradient zz-Filter
pulse program: exp11_7.moIn many exoeriments one wants to selectively observe protons that are attached to13C or 15N. The strong signals of protons attached to 12C or 14N need to besuppressed in order to be able to adjust the receiver gain for the desired signalsonly. One technique to achieve this goal is to dephase unwanted signals withpulsed field gradients after storing the desired magnetization as z-magnetization.
Setting of the needed channels: F1: 1HF2: 13C
Acquisition parametersPL1 :f1 channel - high power level for 1H
transmitter pulseP1 :f1 channel - 90° 1H transmitter pulse
P2 :f1 channel - 180° 1H transmitter pulsePL2 :f2 channel - high power level for 13C
decoupler pulseP4 :f2 channel - 180° 13C decoupler pulse
P16 : 1.5 msec - homospoil/gradient pulseD1 :10 sec - relaxation delay D4 :1/[4J(C,H)]= 1.17 msec, calculated
from 1J(C,H)=214 HzD16 :100 usec - delay for
homospoil/gradient recoveryTD :4 K SW :500 HzO1 :on 1H resonance O2 :on 13C resonanceNS :1 DS :16gpnam1 :SINE.100 gpz 1 :5%RG :receiver gain for correct ADC input
Processing parametersSI :2 K BC_mod :quadWDW :EM LB :0.1 HzFT :Fourier transformation phase correction :adjust the phase of the
satellites up and downbaseline correction :ABS plot :use XWINPLOT
Experiment 11.8- gs-SELCOSY
pulse program: selcogp.moThis is the advanced 1D variant of the most common 2D experiment. Instead ofrecording the full 2D matrix, one can simply measure one ”row” by replacing thefirst 90o pulse of the COSY experiment with a soft pulse, thus looking only for spincouplings that affect the particular proton excited.
Setting of the needed channels: F1: 1HF2: off
103
Acquisition parametersPL1 :f1 channel - high power level for 1H
transmitter pulseP1 :f1 channel - 90° 1H transmitter power
pulseP2 :f1 channel - 180° 1H transmitter power
pulseSP1 :f1 channel - power level for shaped
pulse, here 64 dB was usedP12 :f1 channel - 180° shaped pulse, 50
msec was used hereP16 : 2 msec - homospoil/gradient pulse
D1 :2 sec - relaxation delay D16 :500 usec - delay forhomospoil/gradient recovery
D2 : 30-60 msec, adjusted to ≈1/[2J(H,H)]TD :32 K SW :10 ppmO1 :on resonance of selected signal or use
spoffsPHCOR2 :difference of phases between
power level SP1 and PL1gpnam1 :SINE.100gpnam2 :SINE.100gpnam3 :SINE.100gpnam4 :SINE.100gpnam5 :SINE.100gpnam6 :SINE.100
gpz 1 :40%gpz 2 :40%gpz 3 :7%gpz 4 :7%gpz 5 :20%gpz 6 :-20%
NS :1 DS :4Gaussian shape with 1024 data points wasused
RG :receiver gain for correct ADC input
Processing parametersSI :16 K BC_mod :quadWDW :EM LB :0.5 HzFT :Fourier transformation phase correction :note that the signals of
the coupling partnersshow the activecoupling in antiphase
baseline correction :ABS plot :use XWINPLOT
Experiment 11.9- gs-SELTOCSY
pulse program: selgpml.moThis is the 1D variant of the gs-TOCSY experiment. Compared with the selectiveTOCSY method, the gradient-selected method gives clean results without the needof phase cycling, using only one scan.
Setting of the needed channels: F1: 1HF2: off
Acquisition parametersPL1 :f1 channel - high power level for 1H
transmitter pulseP1 :f1 channel - 90° 1H transmitter power
pulseP2 :f1 channel - 180° 1H transmitter power
pulsePL10 :f1 channel - power level for TOCSY-
spinlockP5 :f1 channel - 60° low power pulse
P6 :f1 channel - 90° low power pulseP7 :f1 channel - 180° low power pulse
SP1 :f1 channel - power level for shapedpulse, here 62 dB was used
P12 :f1 channel - 180° shaped pulse, 50msec was used here
104
P16 : 1 msec - homospoil/gradient pulseD1 :2 sec - relaxation delay D16 :500 usec - delay for
homospoil/gradient recoveryD9 :250 msec; 76 msec; 215 msec –
mixing time (3 different experiments)D20 :1msec - equal to the effective length
of the gradient pulseTD :32 K SW :10 ppmO1 : on resonance of selected signal or
use spoffsPHCOR2 :difference of phases between
power level SP1 and PL1gpnam1 :SINE.100gpnam2 :SINE.100gpnam3 :SINE.100
gpz 1 : 7%gpz 2 : -3%gpz 3 :-10%
NS :1 DS :2Gaussian shape with 1024 data points wasused
RG :receiver gain for correct ADC input
Processing parametersSI :16 K BC_mod :quadWDW :EM LB :0.1 HzFT :Fourier transformation phase correction :adjust the signals to
pure absorption.baseline correction :ABS plot :use XWINPLOT
Experiment 11.10- DPFGSE-NOE
pulse program: selnogp.3Using pulsed field gradients, unwanted signals can be better suppressed and, witha selective excitation pulse tailored to the multiplet under consideration, the desiredNOE effects can be recorded without interference from other signals.
Setting of the needed channels: F1: 1HF2: off
Acquisition parametersPL0 :120 dBPL1 :f1 channel - high power level for 1H
transmitter pulseP1 :f1 channel - 90° 1H transmitter power
pulseP2 :f1 channel - 180° 1H transmitter power
pulseSP1 :f1 channel - power level for shaped
pulse, here 62 dB was usedP12 :f1 channel - 180° shaped pulse, 50
msec was used here, Gaussianshape
P16 : 1 msec - homospoil/gradient pulseD1 :2 sec - relaxation delay D8 :0.7 sec - mixing timeD16 :500 usec - delay for
homospoil/gradient recoveryD20 :d8*0.5-p16-d16
TD :32 K SW :10 ppmO1 :middle of 1H NMR spectrum NS :32gpnam1 :SINE.100gpnam2 :SINE.100gpnam3 :SINE.100gpnam4 :SINE.100
gpz 1 : 11%gpz 2 : 17%gpz 3 : 40%gpz 4 :-40 %
DS :4 RG :receiver gain for correct ADC input
105
Processing parametersSI :16 K BC_mod :quadWDW :EM LB :0.3 HzFT :Fourier transformation phase correction :adjust a negative
phase for the irradiatedmultiplet
baseline correction :ABS plot :use XWINPLOT
Experiment 11.11- gs-SELINCOR
pulse program: selincorgp.moThis experiment yields 1D proton spectra in which the desired proton signal isselected via a selective pulse on the directly bonded 13C nucleus using the 1J(C,H)spin coupling. The HSQC (Heteronuclear Single Quantum Coherence) method isused and the elimination of protons bond to 12C is achieved by pulsed fieldgradients.
Setting of the needed channels: F1: 1HF2: 13C
Acquisition parametersPL1 :f1 channel - high power level for 1H
transmitter pulseP1 :f1 channel - 90° 1H transmitter pulse
P2 :f1 channel - 180° 1H transmitter pulsePL2 :f2 channel - high power level for 13C
decoupler pulseP3 :f2 channel - 90° 13C decoupler pulse
P4 :f2 channel - 180° 13C decoupler pulsePL12 :f2 channel - power level for CPD
decouplingPCPD2 :f2 channel - 90° pulse for
decoupling sequencePL21 :f1 channel - power level for spin-
lock pulseP28 :f1 channel - spin-lock pulse, same
length as p13 (40 msec)SP2 :f2 channel - power level for shaped
pulse, here 66 dB was usedP14 :f2 channel - 180° shaped pulse, 40
msec was used hereCPD2 :WALTZ16 - CPD decoupling
sequence, defined by cpdprg2P16 : 1.5 msec - homospoil/gradient pulse
D1 :2 sec - relaxation delay D4 :1/[4J(C,H)]= 1.8 msec, calculated from1J(C,H)=140 Hz
D11 :30 msec - delay for disk I/O D16 :100 usec - delay forhomospoil/gradient recovery
DELTA :d4-p16-d16 DELTA2 :d4-p16-d16-4uTD :32 K SW :10 ppmO1 :middle of 1H spectrum O2 :on resonance of chosen 13C NMR
signalNS :128 DS :16gpnam1 :SINE.100gpnam2 :SINE.100gpnam3 :SINE.100gpnam4 :SINE.100gpnam5 :SINE.100
gpz 1 :5%gpz 1 :5%gpz 1 :-40%gpz 1 :40%gpz 1 :-20%
RG :receiver gain for correct ADC input
Processing parametersSI :16 K BC_mod :quad
106
WDW :EM LB :0.5 HzFT :Fourier transformation phase correction :adjust the signals to
pure absorption.baseline correction :ABS plot :use XWINPLOT
Experiment 11.12- GRECCO
pulse program:The GRECCO (Gradient Enhanced Carbon Coupling) experiment selectivelydetects 2J(C,C) and 3J(C,C) carbon couplings, which are useful for aconformational analysis.
Setting of the needed channels: F1: 13CF2: 1H
Acquisition parameters
Processing parameters
Experiment 11.13- WATERGATE
pulse program: p3919gpThis is a pulsed field gradient method to suppress the water signal.
Setting of the needed channels: F1: 1HF2: off
Acquisition parametersPL1 :f1 channel - high power level for 1H
transmitter pulseP1 :f1 channel - 90° 1H transmitter power
pulsePL18 :f1 channel - low power level for 3-9-
19 pulse (watergate)P0 :f1 channel -- 90° pulse at PL18
P16 : 2 msec - homospoil/gradient pulseP28 : f1 channel - 90° pulse at PL18
D1 :1 sec - relaxation delay D16 :500 usec - delay forhomospoil/gradient recovery
D19 :150 usec - delay for binomial watersuppression, D19=(1/(2*d)),d=distance of next null (in Hz),usually 2*DW
TD :32 K SW :10 ppmO1 :on water resonance NS :16gpnam1 :SINE.100gpnam2 :SINE.100
gpz 1 : 20%gpz 2 : 20%
DS :4 RG :receiver gain for correct ADC input
Processing parametersSI :16 K BC_mod :quadWDW :EM LB :0.5 Hz
107
FT :Fourier transformation phase correction :ignore the phase of thewater signal and adjustthe others to pureabsorption.
baseline correction :ABS referencing :set the TMS signal to 0 ppmplot :use XWINPLOT
Experiment 11.14- Water Suppression by Excitation Sculpting
pulse program: dpfgse.moThe WATERGATE technique has problems with baseline roll and signal phasing. Anew technique, termed DPFGSE (Double Pulsed Field Gradient Spin Echo), alsobeing called Excitation Sculpting solves this problem by applying theWATERGATE sequence twice.
Setting of the needed channels: F1: 1HF2: off
Acquisition parametersPL1 :f1 channel - high power level for 1H
transmitter pulseP1 :f1 channel - 90° 1H transmitter power
pulsePL18 :f1 channel - low power level for 3-9-
19 pulse (watergate)P0 :f1 channel -- 90° pulse at PL18
P16 : 1 msec - homospoil/gradient pulseP28 : f1 channel - 90° pulse at PL18
D1 :1 sec - relaxation delay D16 :500 usec - delay forhomospoil/gradient recovery
D19 :250 usecTD :32 K SW :10 ppmO1 :on water resonance NS :16gpnam1 :SINE.100gpnam2 :SINE.100gpnam3 :SINE.100gpnam4 :SINE.100
gpz 1 : 40%gpz 2 : 40%gpz 3 : 7%gpz 4 : 7%
DS :4 RG :receiver gain for correct ADC input
Processing parametersSI :16 K BC_mod :quadWDW :EM LB :0.5 HzFT :Fourier transformation phase correction :ignore the phase of the
water signal and adjustthe others to pureabsorption.
baseline correction :ABS plot :use XWINPLOT
108
Chapter 12
- 2D NMR Spectroscopy with Field Gradients
SummaryExperiment Pulse program Description
12.1 cosygp gs-COSY12.2 cosydfgptp.mo Phase-Sensitive gs-DQF-COSY12.3 inv4gp gs-HMQC12.4 inv4gplplrnd gs-HMBC12.5 inv4acgplplr.mo ACCORD-HMBC12.6 invietgpsi Phase-Sensitive gs-HSQC with
Sensitivity Enhancement12.7 mlevgp.mo gs-TOCSY12.8 inv4gpml gs-HMQC-TOCSY12.9 2Q-HMBC12.10 ineptinadgp.mo Gradient-Selected 1H-Detected
2D INEPT-INADEQUATE12.11 noesygpst gs-NOESY12.12 invietgpno.mo gs-HSQC-NOESY12.13 gs-HOESY12.14 inv4gpnd.mo 1H, 15N Correlation with gs-
HMQC
Experiment 12.1- gs-COSY
pulse program: cosygpThis COSY pulse sequence can be achieved with only one scan per T1 increment
Setting of the needed channels: F1: 1HF2: off
Acquisition parametersPL1 :f1 channel - high power level for 1H
transmitter pulseP1 :f1 channel - 90° 1H transmitter pulse
P0 :f1 channel - 90° 1H transmitter pulseP16 :2 msec - homospoil/gradient pulse
D0 :3 usec - incremented delay D1 :2 sec - relaxation delayD13 :3 usec - short delay D16 :500 usec - delay for
homospoil/gradient recoveryParmod :2D ND0 :1TD2 :1 K data points in F2 TD1 :256 data points in F1SW2 :10 ppm SW1 :10 ppmO1 : middle of 1H NMR spectrumNS :1 DS :16gpnam1 :SINE.100gpnam2 :SINE.100
gpz 1 : 10%gpz 2 : 10%
IN0 :1/[SW1] RG :receiver gain for correct ADC input
109
Processing parametersSI(F2) :512 W SI(F1) :512 WWDW(F2) :SINE WDW(F1) :SINESSB(F2) :0 SSB(F1) :0PH-mod(F2) :no PH-mod(F1) :mcMC2 :QF XFB :fourier transformation in both
directionsSYM (may be performed)phase correction :not necessary plot :use XWINPLOT
Experiment 12.2- Phase-Sensitive gs-DQF-COSY
pulse program: cosydfgptp.mo2D homonuclear shift correlation, using gradients as double quantum filter, phasesensitive using TPPI.
Setting of the needed channels: F1: 1HF2: off
Acquisition parametersPL1 :f1 channel - high power level for 1H
transmitter pulseP1 :f1 channel - 90° 1H transmitter pulse
P2 :f1 channel - 180° 1H transmitter pulseP16 :2 msec - homospoil/gradient pulse
D0 :3 usec - incremented delay D1 :2 sec - relaxation delayD13 :3 usec – short delay D16 :500 usec - delay for
homospoil/gradient recoveryD20 :2 msec – same length as gradient
pulseParmod :2D ND0 :2TD2 :2 K data points in F2 TD1 :512 data points in F1SW2 :10 ppm SW1 :10 ppmO1 : middle of 1H NMR spectrumNS :4 DS :16gpnam1 :SINE.100gpnam2 :SINE.100
gpz 1 : 10%gpz 2 : 20%
IN0 :1/[2*SW1] RG :receiver gain for correct ADC input
Processing parametersSI(F2) :1 K SI(F1) :1 KWDW(F2) :EM or GM WDW(F1) :EM or GMLB(F2) : depending on the LB(F1) : depending on theGB(F2) : resolution GB(F1) : resolutionPH-mod(F2) :pk PH-mod(F1) :pkPHC0(F2) :should be 0 before first
transformationPHC0(F1) :90
PHC1(F2) :should be 0 before firsttransformation
PHC1(F1) :should be 0 before firsttransformation
MC2 :TPPI XFB :fourier transformation in bothdirections
phase correction :use the 2D-phasecorrection routine
XF2P :will be executed after correction ofthe rows
plot :use XWINPLOT
110
Experiment 12.3- gs-HMQC
pulse program: inv4gpThis is a HMQC experiment with pulsed field gradients and a BIRD filter tosuppress the signals of protons bond to 12C.
Setting of the needed channels: F1: 1HF2: 13C
Acquisition parametersPL1 :f1 channel - high power level for 1H
transmitter pulseP1 :f1 channel - 90° 1H transmitter pulse
P2 :f1 channel - 180° 1H transmitter pulsePL2 :f2 channel - high power level for 13C
decoupler pulseP3 :f2 channel - 90° 13C decoupler pulse
P16 :2 msec - homospoil/gradient pulsePL12 :f2 channel - power level for CPD
decouplingPCPD2 :f2 channel - 90o pulse for
decoupling sequenceCPD2 :GARP - CPD decoupling sequence,
defined by cpdprg2D0 :3 usec - incremented delayD1 :2 sec - relaxation delay D12 :20 usec - delay for power switchingD2 :1/[2J(C,H)]= 3.57 msec, calculated
from 1J(C,H)=140 HzD13 :3 usec - short delay
D16 :500 usec - delay forhomospoil/gradient recovery
D20 :D2-P16-D13-D12, but ≥D16
Parmod :2D ND0 :2TD2 :1 K data points in F2 TD1 :256 data points in F1SW2 :10 ppm SW1 :165 ppmO1 : middle of 1H NMR spectrum O2 :middle of 13C NMR spectrumNS :1 DS :16gpnam1 :SINE.100gpnam2 :SINE.100gpnam3 :SINE.100
gpz 1 : 50%gpz 2 : 30%gpz 3 : 40.1
IN0 :1/[2*SW1] RG :receiver gain for correct ADC input
Processing parametersSI(F2) :512 W SI(F1) :512 WWDW(F2) :EM WDW(F1) :QSINELB(F2) :5 Hz SSB(F1) :3PH-mod(F2) :no PH-mod(F1) :mcMC2 :QF XFB :fourier transformation in both
directionsphase correction :not necessary plot :use XWINPLOT
Experiment 12.4- gs-HMBC
pulse program: inv4gplplrndThis is a HMBC (Heteronuclear Multiple Bond Correlation) pulse sequence toobtain a H,C correlation via 2J(C,H) and 3J(C,H). It is a gradient-selected versionwithout decoupling.
111
Setting of the needed channels: F1: 1HF2: 13C
Acquisition parametersPL1 :f1 channel - high power level for 1H
transmitter pulseP1 :f1 channel - 90° 1H transmitter pulse
P2 :f1 channel - 180° 1H transmitter pulsePL2 :f2 channel - high power level for 13C
decoupler pulseP3 :f2 channel - 90° 13C decoupler pulse
P16 :2 msec - homospoil/gradient pulseD0 :3 usec - incremented delay D1 :2 sec - relaxation delayD2 :1/[2J(C,H)]= 3.57 msec, calculated
from 1J(C,H)=140 HzD6 :1/[2J(C,H)]= 60 msec, calculated from
nJ(C,H)=8 HzD13 :3 usec - short delay D16 :500 usec - delay for
homospoil/gradient recoveryParmod :2D ND0 :2TD2 :1 K data points in F2 TD1 :256 data points in F1SW2 :10 ppm SW1 :165 ppmO1 : middle of 1H NMR spectrum O2 :middle of 13C NMR spectrumNS :2 DS :16gpnam1 :SINE.100gpnam2 :SINE.100gpnam3 :SINE.100
gpz 1 : 50%gpz 2 : 30%gpz 3 : 40.1
IN0 :1/[2*SW1] RG :receiver gain for correct ADC input
Processing parametersSI(F2) :512 W SI(F1) :512 WWDW(F2) :EM WDW(F1) :QSINELB(F2) :5 Hz SSB(F1) :3PH-mod(F2) :no PH-mod(F1) :mcMC2 :QF XFB :fourier transformation in both
directionsphase correction :not necessary plot :use XWINPLOT
Experiment 12.5- ACCORD-HMBC
pulse program: inv4acgplplr.moThis is a HMBC (Heteronuclear Multiple Bond Correlation) pulse sequence toobtain a H,C correlation via 2J(C,H) and 3J(C,H). It is a gradient-selected versionwithout decoupling.
Setting of the needed channels: F1: 1HF2: 13C
Acquisition parametersPL1 :f1 channel - high power level for 1H
transmitter pulseP1 :f1 channel - 90° 1H transmitter pulse
P2 :f1 channel - 180° 1H transmitter pulsePL2 :f2 channel - high power level for 13C
decoupler pulseP3 :f2 channel - 90° 13C decoupler pulse
PL12 :f2 channel - power level for CPDdecoupling, 12 dB
PCPD2 :f2 channel - 90° pulse fordecoupling sequence, 70 usec
P16 :1 msec - homospoil/gradient pulse

112
CPD2 :GARP - CPD decoupling sequence,defined by cpdprg2
D0 :3 usec - incremented delay D1 :2 sec - relaxation delayD2 :1/[2J(C,H)]= 3.57 msec, calculated
from 1J(C,H)=140 HzD6 :1/[2J(C,H)]= 200 msec, calculated
from 2/3J(C,H)=2.5 HzD16 :50 usec - delay for
homospoil/gradient recoveryD20 :1s/(2*(cnst6)+0.146*(cnst7-cnst6))-
p16-d16=2.7 msecD21 :1s/(2*(cnst7)-0.146*(cnst7-cnst6))-
p16-d16=2.1 mseccnst6 :J(XH)min, here 128 Hz cnst7 :J(XH)max, here 163 HzParmod :2D ND0 :2TD2 :2 K data points in F2 TD1 :256 data points in F1SW2 :10 ppm SW1 :165 ppmO1 : middle of 1H NMR spectrum O2 :middle of 13C NMR spectrumNS :2 DS :16gpnam1 :SINE.100gpnam2 :SINE.100gpnam3 :SINE.100gpnam4 :SINE.100gpnam5 :SINE.100gpnam6 :SINE.100gpnam7 :SINE.100gpnam8 :SINE.100
gpz 1 : 15%gpz 2 : -10%gpz 3 : -5%gpz 4 : 50%gpz 5 : 30%gpz 6 : 40%gpz 7 : -5%gpz 8 : 5%
IN0 :1/[2*SW1] IN6 :(200 msec-20 msec)/td1=0.7 msec,corresponding 2.5 Hz to 25Hz
RG :receiver gain for correct ADC input
Processing parametersSI(F2) :1 K SI(F1) :512 WWDW(F2) :EM WDW(F1) :QSINELB(F2) :5 Hz SSB(F1) :3PH-mod(F2) :no PH-mod(F1) :mcMC2 :QF XFB :fourier transformation in both
directionsphase correction :not necessary plot :use XWINPLOT
Experiment 12.6- Phase-Sensitive gs-HSQC with Sensitivity Enhancement
pulse program: invietgpsiThe HSQC (Heteronuclear Single Quantum Coherence) method performs the H,Ccorrelation via the 13C chemical shift evolution of a single quantum coherence. Inthis case it is a gradient-selected correlation using echo/antiecho selection method.
Setting of the needed channels: F1: 1HF2: 13C
Acquisition parametersPL1 :f1 channel - high power level for 1H
transmitter pulseP1 :f1 channel - 90° 1H transmitter pulse
P2 :f1 channel - 180° 1H transmitter pulsePL2 :f2 channel - high power level for 13C
decoupler pulseP3 :f2 channel - 90° 13C decoupler pulse
P4 :f2 channel - 180° 13C decoupler pulseP16 :1.6 msec - homospoil/gradient pulse
113
P28 :2 msec - trim pulsePL12 :f2 channel - power level for CPD
decouplingPCPD2 :f2 channel - 90° pulse for
decoupling sequenceCPD2 :GARP - CPD decoupling sequence,
defined by cpdprg2D0 :3 usec - incremented delay D1 :2 sec - relaxation delayD4 :1/[4J(C,H)]= 1.8 msec, calculated from
1J(C,H)=140 HzD11 : 30 msec - delay for disk I/O
D13 :3 usec - short delay D16 :100 usec - delay forhomospoil/gradient recovery
D24 :1/(8 J(XH) for all multiplicities L3 :loop for phase sensitive 2D using E/Amethod : L3=TD1/2=64
Parmod :2D ND0 :2TD2 :1 K data points in F2 TD1 :2 times 64 data points in F1SW2 :10 ppm SW1 :165 ppmO1 : :middle of 1H NMR spectrum O2 :middle of 13C NMR spectrumNS :1 DS : 16gpnam1 :SINE.100gpnam2 :SINE.100
gpz 1 : 80%gpz 2 : 20.1%
IN0 :1/[2*SW1] RG :receiver gain for correct ADC input
Processing parametersSI(F2) :512 W SI(F1) :512 WWDW(F2) :EM WDW(F1) :GMLB(F2) :3 HzPH-mod(F2) :pk PH-mod(F1) :noPHC0(F2) :should be 0 before first
transformationPHC1(F2) :should be 0 before first
transformationMC2 :echo-antiecho XFB :fourier transformation in both
directionsphase correction :use the 2D-phase
correction routine,phase correction isusually only necessaryin F2
XF2P :will be executed after correction ofthe rows
plot :use XWINPLOT
Experiment 12.7- gs-TOCSY
pulse program: mlevgp.moThis experiment is the gradient-selected version of the TOCSY (Total CorrelationSpectroscopY) method, which can be done with one scan.
Setting of the needed channels: F1: 1HF2: off
Acquisition parametersPL1 :f1 channel - high power level for 1H
transmitter pulseP1 :f1 channel - 90° 1H transmitter pulse
PL10 :f1 channel - power level for TOCSY-spinlock
P5 :f1 channel - 60° 1H transmitter lowpower pulse
P6 :f1 channel - 90° 1H transmitter lowpower pulse
P7 :f1 channel - 180° 1H transmitter low
114
power pulseP16 :2 msec - homospoil/gradient pulseP17 :f1 channel - 2.5 msec - trim pulse
D0 :3 usec - incremented delayD1 :2 sec - relaxation delay D9 : 100 msec- mixing timeD12 :20 usec - delay for power switching D16 :500 usec - delay for
homospoil/gradient recoveryParmod :2D ND0 :1TD2 :1 K data points in F2 TD1 :256 data points in F1SW2 :9 ppm SW1 :9 ppmO1 : middle of 1H NMR spectrumNS :1 DS :16gpnam1 :SINE.100gpnam2 :SINE.100
gpz 1 : 10%gpz 2 : 10%
IN0 :1/[SW1] RG :receiver gain for correct ADC input
Processing parametersSI(F2) :512 W SI(F1) :512 WWDW(F2) :SINE WDW(F1) :SINESSB(F2) :0 SSB(F1) :0PH-mod(F2) :no PH-mod(F1) :mcMC2 :QF XFB :fourier transformation in both
directionsphase correction :not necessary plot :use XWINPLOT
Experiment 12.8- gs-HMQC-TOCSY
pulse program: inv4gpmlThis is a combination of the HMQC (Heteronuclear Multiple Quantum Coherence)method with the TOCSY (Total Correlation SpectroscopY) sequence. Starting fromeach HMQC cross-signal one finds in F1 additional signals which are caused by aTOCSY transfer. This variant is a gradient-selected method, which does not needa BIRD filter.
Setting of the needed channels: F1: 1HF2: 13C
Acquisition parametersPL1 :f1 channel - high power level for 1H
transmitter pulseP1 :f1 channel - 90° 1H transmitter pulse
P2 :f1 channel - 180° 1Htransmitter pulsePL2 :f2 channel - high power level for 13C
decoupler pulseP3 :f2 channel - 90° 13C decoupler pulse
PL10 :f1 channel - power level for TOCSY-spinlock
P5 :f1 channel - 60° 1H transmitter lowpower pulse
P6 :f1 channel - 90° 1H transmitter lowpower pulse
P7 :f1 channel - 180° 1H transmitter lowpower pulse
P16 :2 msec - homospoil/gradient pulseP17 :f1 channel - 2.5 msec - trim pulse
PL12 :f2 channel - power level for CPDdecoupling
PCPD2 :f2 channel - 90° pulse fordecoupling sequence
CPD2 :GARP - CPD decoupling sequence,
115
defined by cpdprg2D0 :3 usec - incremented delay D1 :2 sec - relaxation delayD2 :1/[2J(C,H)]= 3.57 msec, calculated
from 1J(C,H)=140 HzD9 : 81.8 msec - mixing time
D12 :20 usec - delay for power switching D13 :3 usec - short delayD16 :500 usec - delay for
homospoil/gradient recoveryD21 :P16+D16+D12
Parmod :2D ND0 :2TD2 :1 K data points in F2 TD1 :256 data points in F1SW2 :10 ppm SW1 :165 ppmO1 : middle of 1H NMR spectrum O2 :middle of 13C NMR spectrumNS :4 DS :16gpnam1 :SINE.100gpnam2 :SINE.100gpnam3 :SINE.100
gpz 1 : 50%gpz 2 : 30%gpz 3 : 40.1%
IN0 :1/[2*SW1] RG :receiver gain for correct ADC input
Processing parametersSI(F2) :512 W SI(F1) :512 WWDW(F2) :SINE WDW(F1) :SINESSB(F2) :0 SSB(F1) :0PH-mod(F2) :no PH-mod(F1) :mcMC2 :QF XFB :fourier transformation in both
directionsphase correction :not necessary plot :use XWINPLOT
Experiment 12.9- 2Q-HMBC
pulse program:This experiments detects long-range carbon-carbon connectivities. The transferfrom protons to 13C uses a 3J(C,H) or a 2J(C,H) instead of a 1J(C,H) coupling andthat it is not dependent on the C,C coupling constants. Therefore carbon-carbonrelationships can also be detected, where the C,C spin coupling constant is closeto zero.
Setting of the needed channels: F1: 1HF2: 13C
Acquisition parametersPL1 :f1 channel - high power level for 1H
transmitter pulseP1 :f1 channel - 90° 1H transmitter pulse
P2 :f1 channel - 180° 1H transmitter pulsePL2 :f2 channel – high power level for 13C
decoupler pulseP3 :f2 channel - 90° 13C decoupler pulse
P4 :f2 channel - 180° 13C decoupler pulseP16 :1 msec - homospoil/gradient pulseP28 :f1 channel - 2 msec - trim pulse
D0 :3 usec - incremented delay D1 :4 sec - relaxation delayD11 :30 msec – delay for disk I/O D16 :100 usec - delay for
homospoil/gradient recoverycnst0 :ds=ns*2*cnst0 cnst6 :159 Hzcnst7 :179 Hz cnst8 :8.5 HzParmod :2D ND0 :2TD2 :1 K data points in F2 TD1 :128 data points in F1
116
SW2 :5.2 ppm SW1 :206 ppm (C,C double quantumfrequency)
O1 :center of 1H NMR spectrum O2 :center of 13C NMR spectrumNS :32 L3 :TD1/2gpnam1 :SINE.100gpnam2 :SINE.100gpnam3 :SINE.100gpnam4 :SINE.100gpnam5 :SINE.100
gpz 1 : 30%gpz 2 : -20%gpz 3 : -10%gpz 4 : 30%gpz 5 : -10%
IN0 :1/[2*SW1] RG :receiver gain for correct ADC input
Processing parametersSI(F2) :1024 W SI(F1) :256 WWDW(F2) :SINE WDW(F1) :QSINESSB(F2) :4 SSB(F1) :2PH-mod(F2) :pk PH-mod(F1) :noPHC0(F2) :should be 0 before first
transformationMC2 :echo-antiecho
XFB :fourier transformation in bothdirections
phase correction :use the 2D-phasecorrection routine,phase correction isusually only necessaryin F2
XF2P :will be executed after correction ofthe rows
Experiment 12.10- Gradient-Selected 1H-Detected 2D INEPT-INADEQUATE
pulse program: ineptinadgp.mo (ineptingp_mo)This experiment detects carbon-carbon connectivities, but starts from 1Hmagnetization and detects 1H magnetization. The suppressing of protonsbond to12C is achieved by the use of pulsed field gradients. Connectivities between twoquaternary carbon atoms cannot be detected.
Setting of the needed channels: F1: 1HF2: 13C
Acquisition parametersPL1 :f1 channel - high power level for 1H
transmitter pulseP1 :f1 channel - 90° 1H transmitter pulse
P2 :f1 channel - 180° 1H transmitter pulsePL2 :f2 channel – high power level for 13C
decoupler pulseP3 :f2 channel - 90° 13C decoupler pulse
P4 :f2 channel - 180° 13C decoupler pulsePL12 :f2 channel - power level for CPD
decouplingPCPD2 :f2 channel - 90° pulse for
decoupling sequenceP16 :1 msec - homospoil/gradient pulseP28 :f1 channel - 2 msec - trim pulse
CPD2 :GARP - CPD decoupling sequence,defined by cpdprg2
D0 :3 usec - incremented delay D1 :1.5 sec - relaxation delayD4 :1/[4J(C,H)]= 1.8 msec, calculated from
1J(C,H)=140 HzD11 :30 msec – delay for disk I/O
D16 :200 usec - delay for D20 :D4-P16-D16-4u
117
homospoil/gradient recoveryD21 :D16+P2+D0*2 D23 :1/[4J(C,C)]= 5 msec, calculated from
1J(C,C)=50 Hzcnst0 :ds=ns*2*cnst0 L3 :TD1/2Parmod :2D ND0 :2TD2 :1 K data points in F2 TD1 :2 times 512 data points in F1SW2 :3.7 ppm SW1 :80 ppm (C,C double quantum
frequency)O1 :center of 1H NMR spectrum O2 :center of 13C NMR spectrumNS :12 DS :16gpnam1 :SINE.100gpnam2 :SINE.100gpnam3 :SINE.100
gpz 1 : 39.7%gpz 2 : 39.7%gpz 3 : 40%
IN0 :1/[2*SW1] RG :receiver gain for correct ADC input
Processing parametersSI(F2) :1024 W SI(F1) :1024 WWDW(F2) :EM WDW(F1) :QSINELB(F2) :6.5 SSB(F1) :2PH-mod(F2) :pk PH-mod(F1) :noPHC0(F2) :should be 0 before first
transformationMC2 :echo-antiecho
XFB :fourier transformation in bothdirections
phase correction :use the 2D-phasecorrection routine,phase correction isusually only necessaryin F2
XF2P :will be executed after correction ofthe rows
Experiment 12.11- gs-NOESY
pulse program: noesygpstThis gs-NOESY method replaces the phase cycling procedure by one pulsed fieldgradient during the entire mixing time. In practice, only two transients for each t1
increment are needed.
Setting of the needed channels: F1: 1HF2: off
Acquisition parametersPL1 :f1 channel - high power level for 1H
transmitter pulseP1 :f1 channel - 90° 1H transmitter pulse
P2 :f1 channel - 180° 1Htransmitter pulseP16 :1 msec - homospoil/gradient pulse
D0 :3 usec - incremented delay D1 :2 sec - relaxation delayD8 :250 msec - mixing time D11 :30 msec - delay for disk I/OD16 :100 usec - delay for
homospoil/gradient recoveryD20 :D8*0.5 – p16 – d16
Parmod :2D ND0 :1TD2 :2 K data points in F2 TD1 :256 data points in F1SW2 :10 ppm SW1 :10 ppmO1 : middle of 1H NMR spectrum L3 :l3=td1/2 – loop for States-TPPINS :2 DS :16
118
gpnam1 :SINE.100gpnam2 :SINE.100
gpz 1 : 40%gpz 2 : -40%
IN0 :1/[1*SW1] RG :receiver gain for correct ADC input
Processing parametersSI(F2) :512 W SI(F1) :512 WWDW(F2) :EM WDW(F1) :QSINELB(F2) :2 SSB(F1) :2PH-mod(F2) :pk PH-mod(F1) :pkPHC1(F2) :should be 0 before first
transformationPHC1(F1) :should be 0 before first
transformationMC2 :States-TPPI XFB :fourier transformation in both
directionsphase correction :use the 2D-phase
correction routine,correct the signalspositive
XF2P :will be executed after correction ofthe rows
XF1P :will be executed after correction ofthe columns
Experiment 12.12- gs-HSQC-NOESY
pulse program: invietgpno.moIt is very difficult to observe and evaluate NOESY cross peaks if the correspondingdiagonal signals are very close together or overlap. A remedy to these problemscan be achieved by editing the NOESY spectra by the carbon chemical shift. Theacquisition of the data is performed without 13C decoupling, which allows one toobserve an NOE effect between a proton bound to 13C and a proton in the samemolecule with the identical chemical shift but bound to 12C.
Setting of the needed channels: F1: 1HF2: 13C
Acquisition parametersPL1 :f1 channel - high power level for 1H
transmitter pulseP1 :f1 channel - 90° 1H transmitter pulse
P2 :f1 channel - 180° 1H transmitter pulsePL2 :f2 channel – high power level for 13C
decoupler pulseP3 :f2 channel - 90° 13C decoupler pulse
P4 :f2 channel - 180° 13C decoupler pulsePL12 :f2 channel - power level for CPD
decouplingPCPD2 :f2 channel - 90° pulse for
decoupling sequenceP16 :1 msec - homospoil/gradient pulseP28 :f1 channel - 1 msec - trim pulse
CPD2 :GARP - CPD decoupling sequence,defined by cpdprg2
D0 :3 usec - incremented delay D1 :1 sec - relaxation delayD4 :1/[4J(C,H)]= 1.56 msec, calculated
from 1J(C,H)=160 HzD8 :2 sec – mixing time
D11 :30 msec – delay for disk I/O D12 :20 usec – delay for power switchingD16 :200 usec - delay for
homospoil/gradient recoveryParmod :2D ND0 :2TD2 :1 K data points in F2 TD1 :64 data points in F1
119
SW2 :2.0 ppm SW1 :12 ppmO1 :center of 1H NMR spectrum O2 :center of 13C NMR spectrumNS :12 DS :>=16
L3 :TD1/2gpnam1 :SINE.100gpnam2 :SINE.100gpnam3 :SINE.100gpnam4 :SINE.100
gpz 1 : 50%gpz 2 : 80%gpz 3 : 30%gpz 4 : 20.1%
IN0 :1/[2*SW1] RG :receiver gain for correct ADC input
Processing parametersSI(F2) :512 W SI(F1) :128 WWDW(F2) :EM WDW(F1) :EMLB(F2) :10 SSB(F1) :3PH-mod(F2) :pk PH-mod(F1) :noPHC0(F2) :should be 0 before first
transformationMC2 :echo-antiecho
XFB :fourier transformation in bothdirections
phase correction :use the 2D-phasecorrection routine,phase correction isusually only necessaryin F2. The NOEsignals have theopposite phase.
XF2P :will be executed after correction ofthe rows
Experiment 12.13- gs-HOESY
pulse program:This gs-HOEY experiment yields information on the spatial relationship betweenspins in the heteronuclear case. It will be of main value in cases where informationfrom spin-spin couplings is unhelpful or unavailable.
Setting of the needed channels: F1: 1HF2: 7Li
Acquisition parameters
Processing parameters
Experiment 12.14- 1H, 15N Correlation with gs-HMQC
pulse program: inv4gpnd.moDue to the low receptivity of 15N it is very tedious to obtain 15N NMR spectra oforganic compounds if they are available only in miligrams. Inverse detection istherefore the method of choice, particularily if the unwanted signals can beefectively suppressed with pulsed field gradients.
120
Setting of the needed channels: F1: 1HF2: 15N
Acquisition parametersPL1 :f1 channel - high power level for 1H
transmitter pulseP1 :f1 channel - 90° 1H transmitter pulse
P2 :f1 channel - 180° 1H transmitter pulsePL2 :f2 channel - high power level for 15N
decoupler pulseP3 :f2 channel - 90° 15N decoupler pulse
P16 :2 msec - homospoil/gradient pulseD0 :3 usec - incremented delay D1 :2 sec - relaxation delayD2 :1/[2J(N,H)]= 50 msec, calculated from
2,3J(C,H)=10 HzD11 : 30 msec - delay for disk I/O
D16 :100 usec - delay forhomospoil/gradient recovery
D20 :D4-P16-D16-4usec
D21 :D16+P2+D0*2 D23 : 1/[4J(C,C)]= 5 msec, calculated from1J(C,C)=50 Hz
Parmod :2D ND0 :2TD2 :1 K data points in F2 TD1 :128 data points in F1SW2 :10 ppm SW1 :400 ppmO1 :middle of 1H NMR spectrum O2 :middle of 15N NMR spectrumNS :4 DS : 16gpnam1 :SINE.100gpnam2 :SINE.100gpnam3 : SINE.100
gpz 1 : 55%gpz 2 : 45%gpz 3 : 20.14%
IN0 :1/[2*SW1] RG :receiver gain for correct ADC input
Processing parametersSI(F2) :512 W SI(F1) :512 WWDW(F2) :SINE WDW(F1) :SINELB(F2) :2 SSB(F1) :2PH-mod(F2) :no PH-mod(F1) :mcMC2 :QF XFB :fourier transformation in both
directionsphase correction :phase correction is not
necessaryplot :use XWINPLOT

121
Chapter 13
- The Third Dimension
SummaryExperiment Pulse program Description
13.1 invbcosytp3d.mo 3D HMQC-COSY13.2 invigpml3d.mo 3D gs-HSQC-TOCSY13.3 h_c_p3d.mo 3D H,C,P-Correlation13.4 3D HMBC
Experiment 13.1- 3D HMQC-COSY
pulse program: invbcotp3d.moThis is a 3D experiment, in which the COSY spectra are ”edited” via C,Hcorrelation.
Setting of the needed channels: F1: 1HF2: 13C
Acquisition parametersPL1 :f1 channel - high power level for 1H
transmitter pulseP1 :f1 channel - 90° 1H transmitter pulse
P2 :f1 channel - 180° 1H transmitter pulsePL2 :f2 channel - high power level for 13C
decoupler pulseP3 :f2 channel - 90° 13C decoupler pulse
P4 :f2 channel - 180° 13C decoupler pulsePL12 :f2 channel - power level for CPD
decouplingPCPD2 :f2 channel - 90° pulse for
decoupling sequenceCPD2 :GARP - CPD decoupling sequence,
defined by cpdprg2D0 :3 usec - incremented delay (F1 in 3D) D7 :ca. 0.4 sec - BIRD delay to be
optimized for minimum FIDD1 :2 sec - relaxation delay D10 :3 usec - incremented delay (F2 in
3D)D2 :1/[2J(C,H)]= 3.5 msec, calculated from
1J(C,H)= 145 HzD11 : 30 msec - delay for disk I/O
Parmod :3D ND0 :4TD3 :256 data points in F3 (1H) TD2 :64 data points in F2 (1H)TD1 :128 data points in F1 (13C) ND10 :2SW3 :3.3 ppm SW2 :3.3 ppmSW1 :42 ppmO1 : middle of selected 1H NMR region O2 :middle of selected 1H NMR regionO3 :middle of selected 13C NMR regionNS :4 DS :32IN0 :1/[4*SW1] IN10 :1/[2*SW2]RG :receiver gain for correct ADC input
Processing parametersSI(F3) :256 W SI(F2) :128 W
122
SI(F1) :128 WWDW(F3) :EM WDW(F2) :QSINEWDW(F1) :QSINELB(F3) :5 HzSSB(F2) :2 SSB(F1) :2MC2(F2) :TPPI MC2(F1) :TPPIPH-mod(F3) :pk PH-mod(F2) :pkPH-mod(F1) :pkPHC0(F3) :should be 0 before first
transformationPHC1(F3) :should be 0 before first
transformationPHC0(F2) :should be 0 before first
transformationPHC1(F2) :should be 0 before first
transformationPHC0(F1) :should be 0 before first
transformationPHC1(F1) :should be 0 before first
transformationAQORDER :3 - 1 - 2TF3, TF2, TF1 :fourier transformation in all dimensionsphase correction :should be performed
after the FT of eachdimension
plot :use XWINPLOT
Experiment 13.2- 3D gs-HSQC-TOCSY
pulse program:This 3D experiment is a combination of a HSQC (Heteronuclear Single QuantumCoherence) and a TOCSY (Total Correlation SpectroscopY) sequence. It is agradient-selected experiment.
Setting of the needed channels: F1: 1HF2: 13C
Acquisition parameters
Processing parameters
Experiment 13.3- 3D H,C,P-Correlation
pulse program:3D experiment to measure the correlation between three different nuclei.
Setting of the needed channels: F1: 1HF2: 13CF3: 31P
123
Acquisition parameters
Processing parameters
Experiment 13.4- 3D HMBC
pulse program:Instead of measuring several HMBC spectra with different delays, a 3D versionwas recently proposed in which the corresponding delay is incremented; thus thewhole range of C,H long-range coupling constants are actually used for doublequantum excitation.
Setting of the needed channels: F1: 1HF2: 13C
Acquisition parameters
Processing parameters
124
Chapter 14
- Solid-State NMR Spectroscopy
SummaryExperiment Pulse program Description
14.1 Shimming Solid-State Probe-Heads
14.2 Adjusting the Magic Angle14.3 Hartmann-Hahn Matching14.4 The Basic CP/MAS Experiment14.5 TOSS14.6 SELTICS14.7 Multiplicity Determination in the
Solid-State
Experiment 14.1- Shimming Solid-State Probe-Heads
a)pulse program:In solid-state NMR there is usually no lock channel and because of that aresonable basic shim is necessary.
Setting of the needed channels: F1: 1HF2: off
Acquisition parametersPL1 :f1 channel - high power level for 1H
transmitter pulseP1 :f1 channel - 90° 1H transmitter pulse
P2 :f1 channel - 180° 1H transmitter pulseD0 :3 usec - incremented delay D1 :2 sec - relaxation delayD2 :1/[2J(N,H)]= 50 msec, calculated from
2,3J(C,H)=10 HzD11 : 30 msec - delay for disk I/O
D16 :100 usec - delay forhomospoil/gradient recovery
D20 :D4-P16-D16-4usec
D21 :D16+P2+D0*2 D23 : 1/[4J(C,C)]= 5 msec, calculated from1J(C,C)=50 Hz
TD2 :1 K data points in F2 TD1 :128 data points in F1SW2 :10 ppm SW1 :400 ppmO1 :middle of 1H NMR spectrum O2 :middle of 15N NMR spectrumNS :4 DS : 16
RG :receiver gain for correct ADC input
Processing parametersSI(F2) :512 W SI(F1) :512 WWDW(F2) :SINE WDW(F1) :SINELB(F2) :2 SSB(F1) :2PH-mod(F2) :no PH-mod(F1) :mcMC2 :QF XFB :fourier transformation in both
directionsphase correction :phase correction is not plot :use XWINPLOT
125
necessary
b)pulse program:In solid-state NMR there is usually no lock channel and because of that aresonable basic shim is necessary.
Setting of the needed channels: F1: 13CF2: 1H
Acquisition parametersPL1 :f1 channel – high power level for 1H
transmitter pulseP1 :f1 channel - 90° 1H transmitter pulse
P2 :f1 channel - 180° 1H transmitter pulsePL2 :f2 channel – high power level for 15N
decoupler pulseP3 :f2 channel - 90° 15N decoupler pulse
D0 :3 usec - incremented delay D1 :2 sec - relaxation delayD2 :1/[2J(N,H)]= 50 msec, calculated from
2,3J(C,H)=10 HzD11 : 30 msec - delay for disk I/O
D16 :100 usec - delay forhomospoil/gradient recovery
D20 :D4-P16-D16-4usec
D21 :D16+P2+D0*2 D23 : 1/[4J(C,C)]= 5 msec, calculated from1J(C,C)=50 Hz
TD2 :1 K data points in F2 TD1 :128 data points in F1SW2 :10 ppm SW1 :400 ppmO1 :middle of 1H NMR spectrum O2 :middle of 15N NMR spectrumNS :4 DS : 16IN0 :1/[2*SW1] RG :receiver gain for correct ADC input
Processing parametersSI(F2) :512 W SI(F1) :512 WWDW(F2) :SINE WDW(F1) :SINELB(F2) :2 SSB(F1) :2PH-mod(F2) :no PH-mod(F1) :mcMC2 :QF XFB :fourier transformation in both
directionsphase correction :phase correction is not
necessaryplot :use XWINPLOT
Experiment 14.2– Adjusting the Magic Angle
pulse program:
Setting of the needed channels: F1: 79BrF2: off
Acquisition parametersPL1 :f1 channel - high power level for 1H
transmitter pulseP1 :f1 channel - 90° 1H transmitter pulse
P2 :f1 channel - 180° 1H transmitter pulseD0 :3 usec - incremented delay D1 :2 sec - relaxation delayD2 :1/[2J(N,H)]= 50 msec, calculated from
2,3J(C,H)=10 HzD11 : 30 msec - delay for disk I/O
126
D16 :100 usec - delay forhomospoil/gradient recovery
D20 :D4-P16-D16-4usec
D21 :D16+P2+D0*2 D23 : 1/[4J(C,C)]= 5 msec, calculated from1J(C,C)=50 Hz
TD2 :1 K data points in F2 TD1 :128 data points in F1SW2 :10 ppm SW1 :400 ppmO1 :middle of 1H NMR spectrum O2 :middle of 15N NMR spectrumNS :4 DS : 16
RG :receiver gain for correct ADC input
Processing parametersSI(F2) :512 W SI(F1) :512 WWDW(F2) :SINE WDW(F1) :SINELB(F2) :2 SSB(F1) :2PH-mod(F2) :no PH-mod(F1) :mcMC2 :QF XFB :fourier transformation in both
directionsphase correction :phase correction is not
necessaryplot :use XWINPLOT
Experiment 14.3- Hartmann-Hahn Matching
pulse program:Standard CP/MAS spectra are acquired with Cross Polarization from protons tocarbon.
Setting of the needed channels: F1: 13CF2: 1H
Acquisition parametersPL1 :f1 channel - high power level for 1H
transmitter pulseP1 :f1 channel - 90° 1H transmitter pulse
P2 :f1 channel - 180° 1H transmitter pulsePL2 :f2 channel - high power level for 15N
decoupler pulseP3 :f2 channel - 90° 15N decoupler pulse
D0 :3 usec - incremented delay D1 :2 sec - relaxation delayD2 :1/[2J(N,H)]= 50 msec, calculated from
2,3J(C,H)=10 HzD11 : 30 msec - delay for disk I/O
D16 :100 usec - delay forhomospoil/gradient recovery
D20 :D4-P16-D16-4usec
D21 :D16+P2+D0*2 D23 : 1/[4J(C,C)]= 5 msec, calculated from1J(C,C)=50 Hz
TD2 :1 K data points in F2 TD1 :128 data points in F1SW2 :10 ppm SW1 :400 ppmO1 :middle of 1H NMR spectrum O2 :middle of 15N NMR spectrumNS :4 DS : 16
RG :receiver gain for correct ADC input
Processing parametersSI(F2) :512 W SI(F1) :512 WWDW(F2) :SINE WDW(F1) :SINELB(F2) :2 SSB(F1) :2
127
PH-mod(F2) :no PH-mod(F1) :mcMC2 :QF XFB :fourier transformation in both
directionsphase correction :phase correction is not
necessaryplot :use XWINPLOT
Experiment 14.4– The Basic CP/MAS Experiment
pulse program:The CP/MAS method provides high resolution NMR spectra in the solid state andis mostly performed on 13C with cross polarization from 1H.
Setting of the needed channels: F1: 13CF2: 1H
Acquisition parametersPL1 :f1 channel - high power level for 1H
transmitter pulseP1 :f1 channel - 90° 1H transmitter pulse
P2 :f1 channel - 180° 1H transmitter pulsePL2 :f2 channel - high power level for 15N
decoupler pulseP3 :f2 channel - 90° 15N decoupler pulse
D0 :3 usec - incremented delay D1 :2 sec - relaxation delayD2 :1/[2J(N,H)]= 50 msec, calculated from
2,3J(C,H)=10 HzD11 : 30 msec - delay for disk I/O
D16 :100 usec - delay forhomospoil/gradient recovery
D20 :D4-P16-D16-4usec
D21 :D16+P2+D0*2 D23 : 1/[4J(C,C)]= 5 msec, calculated from1J(C,C)=50 Hz
TD2 :1 K data points in F2 TD1 :128 data points in F1SW2 :10 ppm SW1 :400 ppmO1 :middle of 1H NMR spectrum O2 :middle of 15N NMR spectrumNS :4 DS : 16
RG :receiver gain for correct ADC input
Processing parametersSI(F2) :512 W SI(F1) :512 WWDW(F2) :SINE WDW(F1) :SINELB(F2) :2 SSB(F1) :2PH-mod(F2) :no PH-mod(F1) :mcMC2 :QF XFB :fourier transformation in both
directionsphase correction :phase correction is not
necessaryplot :use XWINPLOT
Experiment 14.5- TOSS
pulse program:TOSS is a technique to suppress the spinning side-bands.
Setting of the needed channels: F1: 13CF2: 1H
128
Acquisition parametersPL1 :f1 channel - high power level for 1H
transmitter pulseP1 :f1 channel - 90° 1H transmitter pulse
P2 :f1 channel - 180° 1H transmitter pulsePL2 :f2 channel - high power level for 15N
decoupler pulseP3 :f2 channel - 90° 15N decoupler pulse
D0 :3 usec - incremented delay D1 :2 sec - relaxation delayD2 :1/[2J(N,H)]= 50 msec, calculated from
2,3J(C,H)=10 HzD11 : 30 msec - delay for disk I/O
D16 :100 usec - delay forhomospoil/gradient recovery
D20 :D4-P16-D16-4usec
D21 :D16+P2+D0*2 D23 : 1/[4J(C,C)]= 5 msec, calculated from1J(C,C)=50 Hz
TD2 :1 K data points in F2 TD1 :128 data points in F1SW2 :10 ppm SW1 :400 ppmO1 :middle of 1H NMR spectrum O2 :middle of 15N NMR spectrumNS :4 DS : 16
RG :receiver gain for correct ADC input
Processing parametersSI(F2) :512 W SI(F1) :512 WWDW(F2) :SINE WDW(F1) :SINELB(F2) :2 SSB(F1) :2PH-mod(F2) :no PH-mod(F1) :mcMC2 :QF XFB :fourier transformation in both
directionsphase correction :phase correction is not
necessaryplot :use XWINPLOT
Experiment 14.6- SELTICS
pulse program:SELTICS (Sideband ELimination by Temporary Interruption of the Chemical Shift)is another method to suppress the spinning side-bands.
Setting of the needed channels: F1: 13CF2: 1H
Acquisition parametersPL1 :f1 channel - high power level for 1H
transmitter pulseP1 :f1 channel - 90° 1H transmitter pulse
P2 :f1 channel - 180° 1H transmitter pulsePL2 :f2 channel - high power level for 15N
decoupler pulseP3 :f2 channel - 90° 15N decoupler pulse
D0 :3 usec - incremented delay D1 :2 sec - relaxation delayD2 :1/[2J(N,H)]= 50 msec, calculated from
2,3J(C,H)=10 HzD11 : 30 msec - delay for disk I/O
D16 :100 usec - delay forhomospoil/gradient recovery
D20 :D4-P16-D16-4usec
D21 :D16+P2+D0*2 D23 : 1/[4J(C,C)]= 5 msec, calculated from1J(C,C)=50 Hz
TD2 :1 K data points in F2 TD1 :128 data points in F1SW2 :10 ppm SW1 :400 ppmO1 :middle of 1H NMR spectrum O2 :middle of 15N NMR spectrum
129
NS :4 DS : 16RG :receiver gain for correct ADC input
Processing parametersSI(F2) :512 W SI(F1) :512 WWDW(F2) :SINE WDW(F1) :SINELB(F2) :2 SSB(F1) :2PH-mod(F2) :no PH-mod(F1) :mcMC2 :QF XFB :fourier transformation in both
directionsphase correction :phase correction is not
necessaryplot :use XWINPLOT
Experiment 14.7- Multiplicity Determination in the Solid-State
pulse program:The first editing method was baptized NQS (Non Quaternary Suppression).
Setting of the needed channels: F1: 13CF2: 1H
Acquisition parametersPL1 :f1 channel - high power level for 1H
transmitter pulseP1 :f1 channel - 90° 1H transmitter pulse
P2 :f1 channel - 180° 1H transmitter pulsePL2 :f2 channel - high power level for 15N
decoupler pulseP3 :f2 channel - 90° 15N decoupler pulse
D0 :3 usec - incremented delay D1 :2 sec - relaxation delayD2 :1/[2J(N,H)]= 50 msec, calculated from
2,3J(C,H)=10 HzD11 : 30 msec - delay for disk I/O
D16 :100 usec - delay forhomospoil/gradient recovery
D20 :D4-P16-D16-4usec
D21 :D16+P2+D0*2 D23 : 1/[4J(C,C)]= 5 msec, calculated from1J(C,C)=50 Hz
TD2 :1 K data points in F2 TD1 :128 data points in F1SW2 :10 ppm SW1 :400 ppmO1 :middle of 1H NMR spectrum O2 :middle of 15N NMR spectrumNS :4 DS : 16
RG :receiver gain for correct ADC input
Processing parametersSI(F2) :512 W SI(F1) :512 WWDW(F2) :SINE WDW(F1) :SINELB(F2) :2 SSB(F1) :2PH-mod(F2) :no PH-mod(F1) :mcMC2 :QF XFB :fourier transformation in both
directionsphase correction :phase correction is not
necessaryplot :use XWINPLOT