basic methods for assessment of renal fluoride excretion in
TRANSCRIPT
Cre
ate
d b
y W
HO
/Gra
phic
s
Basic methods for assessment of renal fl uoride
excretion in community prevention programmes for
oral health
2014
ffirs01.indd i 4/15/2014 4:34:30 PM
WHO Library Cataloguing-in-Publication Data
Basic methods for assessment of renal fl uoride excretion in community prevention programmes for oral health.
1. Fluoride – adverse effects. 2. Fluoride – metabolism. 3. Fluoridation. 4. Fluorosis, Dental – prevention and control. 5. Community Dentistry. 6. Oral Health. 7. Program Evaluation – methods. I. World Health Organization.
ISBN 978 92 4 154870 0 (NLM classifi cation: WU 270)
© World Health Organization 2014
All rights reserved. Publications of the World Health Organization are available on the WHO web site ( www.who.int ) or can be purchased from WHO Press, World Health Organization, 20 Avenue Appia, 1211 Geneva 27, Switzerland (tel.: + 41 22 791 3264; fax: + 41 22 791 4857; e-mail: [email protected] ).
Requests for permission to reproduce or translate WHO publications – whether for sale or for non-commercial distribution – should be addressed to WHO Press through the WHO web site ( www.who.int/about/licensing/copyright_form/en/index.html ).
The designations employed and the presentation of the material in this publication do not imply the expression of any opinion whatsoever on the part of the World Health Organization concerning the legal status of any country, territory, city or area or of its authorities, or concerning the delimitation of its frontiers or boundaries. Dotted lines on maps represent approximate border lines for which there may not yet be full agreement.
The mention of specifi c companies or of certain manufacturers’ products does not imply that they are endorsed or recommended by the World Health Organization in preference to others of a similar nature that are not mentioned. Errors and omissions excepted, the names of proprietary products are distinguished by initial capital letters.
All reasonable precautions have been taken by the World Health Organization to verify the information contained in this publication. However, the published material is being distributed without warranty of any kind, either expressed or implied. The respon-sibility for the interpretation and use of the material lies with the reader. In no event shall the World Health Organization be liable for damages arising from its use.
PRINTED IN FRANCE
ffirs02.indd ii 4/15/2014 4:34:31 PM
iii
Contents
Acronyms and abbreviations 1
Preface 2
Acknowledgements 5
1 Introduction 61.1 Background 61.2 Sources of fl uoride intake in humans 71.3 Fluoride metabolism and excretion 81.4 Biomarkers of fl uoride exposure 81.5 Urinary fl uoride assessments in population oral health 91.6 Areas of uncertainty 10
2 General design of study 122.1 Background 122.2 Identifi cation of participants 122.3 Sampling 122.4 Methods of monitoring 15
2.4.1 24-hour urine collection 152.4.2 Timed collections of urine obtained from defi ned
periods of a day 17
3 Methods for collecting urine, and for handling and evaluating results 203.1 Recording of information 20
3.1.1 General information 203.1.2 Personal information 23
3.2 Essential preparatory practices 293.2.1 Pre-collection planning approaches 29
4 Twenty-four hour urine collection 334.1 Procedure 334.2 Fluoride and creatinine concentrations 344.3 Information to be recorded 34
ftoc.indd iii 4/10/2014 6:55:41 PM
Basic Methods for Assessment of Renal Fluoride Excretion
iv
4.4 Determination of fl uoride in urine 354.5 General rules for tabulation and processing of data 35
5 Design of the fi nal report for 24-hour urine collection 375.1 Introduction 375.2 Materials and methods 375.3 Results 375.4 Discussion and conclusion 395.5 Summary 395.6 Tables for the 24-hour collection method 40
6 Collections of 8–18 hours (within the 24-hour cycle) 446.1 Collection of nocturnal urine and during periods
of high excretion 456.2 Optional calculations obtained from time-controlled
urine collection – Use of a standardized format 466.2.1 Coded recordings of personal data and individual
fl uoride exposure 476.2.2 Standard table for surveys with 24-hour
collections 486.2.3 Standard table for surveys with two collections
totalling 14–16 hours, using MS Excel 506.2.4 Standard table for surveys with three collections
totalling 14–16 hours using MS Excel: complete series 51
6.2.5 Standard table for surveys with collections made in four periods totalling the 24-cycle 51
6.2.6 Cleaning of data 516.3 Extrapolations 53
7 Design of the fi nal report for time-controlled urinary collections 547.1 Tables for time-controlled urinary collections lasting
8–18 hours 55
8 Urine spot samples 658.1 Creatinine 65
9 Provision of technical advice 67
Annex A: Apparatus and materials 68
Annex B: Steps for verifying function of apparatus 72
Annex C: Calibration procedure 74
References 79
ftoc.indd iv 4/10/2014 6:55:41 PM

Contents
v
TablesTable 5.1 Urinary fl uoride excretion data from 24-hour urine
collections 38Table 5.2 Criteria for cleaning data from children aged 2–6 years,
from 24-hour collections 40Table 5.3 Standards for urinary fl uoride excretion (mg/24-hour
cycle): lower and upper margins 41Table 5.4 Calculated daily urinary fl uoride excretion associated
with low, optimal and high fl uoride intake for ages 1–14 years 42
Table 5.5 Calculated daily urinary fl uoride excretion associated with low, optimal and high fl uoride intake for broader age groups 43
Table 7.1 Urinary fl uoride data for time-controlled urine collections 55
Table 7.2 Criteria for cleaning data from childen aged 2–6 years, from time-controlled urine collectionsa 56
Table 7.3 Range of optimal urinary fl uoride excretion (μg/hour) at different times, for time-controlled urine collections: lower and upper margins 57
Table 7.4 Standards for urinary fl uoride concentration (mg/L; ppm) for all ages, for time-controlled urine collections; lower and upper margins 57
Table 7.5 Calculation of parameters using simple numerical operations 58
Table 7.6 Data and computing table using MS Excel for surveys for 24-hour collections (example with six cases) 59
Table 7.7 Dataset example and MS Excel computing table showing calculations of fl uoride excretion of children providing nocturnal and noon urine collections 60
Table 7.8 Dataset example and MS Excel computing table showing calculations of fl uoride excretion of children providing morning, afternoon and nocturnal collections 62
Table 7.9 Ideal format of a dataset to be transferred to an evaluation centre 64
FiguresFigure 3.1 Example of daytime label used in time-controlled
collections, to be attached to the urine collecting jar (WHO Form No. 96392, modifi ed) 21
Figure 3.2 Overnight urine collection label used in time-controlled collections (WHO Form No. 96393) 21
ftoc.indd v 4/10/2014 6:55:41 PM

Basic Methods for Assessment of Renal Fluoride Excretion
vi
Figure 3.3 Summary record form of urine collection from a group of children in time-controlled collections (WHO Form No. 96391) 22
Figure 3.4 Sample invitation 23Figure 3.5 Questionnaire on use of fl uoride supplements and
toothpaste 24
ftoc.indd vi 4/10/2014 6:55:41 PM
1
Acronyms and abbreviations
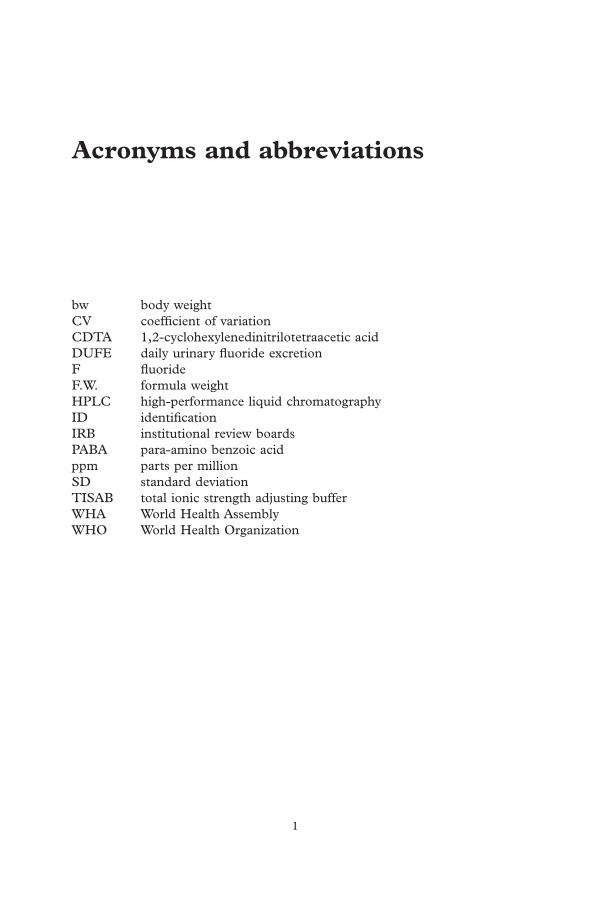
bw body weightCV coeffi cient of variationCDTA 1,2-cyclohexylenedinitrilotetraacetic acidDUFE daily urinary fl uoride excretionF fl uorideF.W. formula weightHPLC high-performance liquid chromatographyID identifi cationIRB institutional review boardsPABA para-amino benzoic acidppm parts per millionSD standard deviationTISAB total ionic strength adjusting bufferWHA World Health AssemblyWHO World Health Organization
fbetw.indd 1 4/10/2014 6:55:35 PM
2
Preface
Dental caries is still a major oral health problem in most industrialized coun-tries, affecting 60–90% of schoolchildren and the vast majority of adults. It is also the most prevalent oral disease in several Asian and Latin American countries, although it appears to be less common and less severe in most African countries. In light of changing living conditions, however, it is expected that the incidence of dental caries will increase in many developing countries in Africa, particularly as a result of a growing consumption of sugars and inadequate exposure to fl uorides. The World Health Organization (WHO) World oral health report 2003 ( 1 ) noted that dental caries can be controlled by the joint action of communities, professionals and individuals aimed at reduc-ing the impact of sugar consumption and emphasizing the benefi cial effect of fl uorides. In many developing countries, access to oral health services is limited; likewise, in developed countries, signifi cant numbers of population groups are underserved.
The effects of fl uoride on oral health have been studied for about a century, and the scientifi c literature shows that fl uoride may have both benefi cial and detrimental effects. The WHO policy on fl uoride is clarifi ed in various scien-tifi c articles ( 2 ) , technical reports ( 3 ) and World Health Assembly resolutions ( 4–6 ) . In 2007, for the fi rst time in 25 years, oral health was subject to discus-sion by the World Health Assembly and the Executive Board of WHO ( 7 ) . At the 60th World Health Assembly, Member States agreed on an action plan for oral health – Oral health: Action plan for promotion and integrated disease preven-tion ( 8 ) . The resolution calls upon countries that do not have access to optimal levels of fl uoride, and have not yet established fl uoridation programmes, to consider the development and implementation of such programmes, giving priority to equitable strategies through automatic administration of fl uoride (i.e. in drinking water, salt or milk), and to the provision of affordable fl uoride toothpaste. Use of water fl uoridation for prevention of dental caries began in the 1940s in USA; it has been the source of numerous studies, and has expanded to several countries around the world ( 2 ) . Use of salt fl uoridation for dental caries prevention began in Switzerland in the mid-1950s, and has been adopted by several countries around the globe ( 9 ) . Salt fl uoridation has
fpref.indd 2 4/10/2014 6:55:40 PM

Preface
3
been as effective as water fl uoridation in reducing dental caries in areas where salt production and distribution can be controlled. Milk fl uoridation has also proven successful in dental caries prevention, particularly in school-age chil-dren living in areas where the fl uoride concentration in drinking water is suboptimal ( 10 ) .
Population-wide automatic fl uoridation measures are effective and are the most equitable ways to prevent dental caries. However, some degree of un -sightly enamel fl uorosis results when children are exposed to fl uoride above optimal concentrations. Several products or elements containing fl uoride can be sources of exposure. It is therefore important that fl uoride exposure be known and health authorities be made aware of exposure before the introduc-tion of any fl uoridation or supplementation programmes for prevention of dental caries ( 11 ) .
Total fl uoride exposure of individuals or populations can be monitored by assessing fl uoride concentration in plasma, urine or ductal saliva. The amount of fl uoride in these biological liquids is indicative of the level of total fl uoride exposure. After intake of fl uoride – whether through drinking water, dietary components or fl uoride supplements – the plasma fl uoride level will rise immediately, but it starts to decrease within 30–60 minutes, and reverts to the original level within 3–6 hours.
Urinary fl uoride excretion is basically dependent on the fl uoride concen-trations or rather on the concentration peaks in the plasma. In the case of long-lasting collections (e.g. 6–10 hours), the peaks tend to level out and the variations in the accumulated urine are smaller. The main advantage of using urinary fl uoride excretion to estimate total fl uoride exposure is that urine collections are non-invasive – no blood needs to be taken – and are thus more suitable than other methods for monitoring community fl uoridation schemes. Unique fi eld experience has been gained by using fl uoride excretion in urine to evaluate programmes implementing water, salt and milk fl uoridation ( 11 ) . It is possible to develop excretion thresholds; that is, levels that should not be exceeded if unsightly enamel fl uorosis is to be avoided. In programmes where fl uoride is added to milk and to salt, urinary studies will identify instances of insuffi cient excretion, indicating suboptimal fl uoride levels. Most importantly, studies of urinary fl uoride provide a simple and reliable means of ensuring that total fl uoride intake from all sources does not exceed certain limits; this i s especially critical in young children whose permanent anterior teeth are developing ( 11 ) .
In 1999, the WHO Oral Health Programme published the booklet Moni-toring of renal fl uoride excretion in community prevention programmes in oral health ( 11 ) . The manual has been useful as a guide for monitoring fl uoride excretion and concentrations in programmes in which either salt or milk has been used as a vehicle for administering fl uoride for caries prevention. This current manual – entitled Basic methods for assessment renal fl uoride excretion in community
fpref.indd 3 4/10/2014 6:55:40 PM
Basic Methods for Assessment of Renal Fluoride Excretion
4
prevention programmes for oral health – is an update of the 1999 publication. It includes practical experience from national fl uoridation programmes, and will primarily be useful in helping countries to plan effective surveillance of fl uo-ride exposure. It is hoped that the manual will stimulate oral health personnel and public health administrators to use a systematic approach to managing and analysing data obtained from different levels of fl uoride exposure. It is also a hope that the manual will motivate inter-country collaboration on efforts to establish standardized and effective epidemiological surveillance systems for community prevention programmes using fl uoride. The present manual thereby complements the WHO “Oral Health Surveys – Basic Methods” ( 12 ) , which provide recommendations on oral health assessment of population groups and specify the tools important to surveillance of oral health.
fpref.indd 4 4/10/2014 6:55:40 PM

5
Acknowledgements
This manual was prepared by Dr R.J. Baez, University of Texas, Health Science Center, San Antonio Dental School, Texas, United States of America; Dr P.E. Petersen, WHO, Geneva, Switzerland; and Dr T.M. Marthaler, University of Zurich, Zurich, Switzerland.
Special thanks for technical advice are due to Dr V. Zohoori, Health and Social Care Institute, Teesside University, Middlesbrough, United Kingdom of Great Britain and Ireland (UK); Dr A. Rugg-Gunn, Dental School, Newcastle University, Newcastle, UK; Dr M. Buzalaf, Dental School, University of Sao Paulo, Sao Paulo, Brazil; Dr A. Villa, Institute of Nutrition, Santiago, Chile; Dr T.D. Hai, National Institute of Odontostomatology, Hanoi, Viet Nam; and Dr P. Phanthumvanit, Thammasat University, Faculty of Dentistry, Pathumtani, Thailand.
Financial support
This report was published with the fi nancial support from the Borrow Foundation, United Kingdom. The World Health Organization Oral Health Programme, Geneva, is grateful for the continued support to activities for global oral health .
flast.indd 5 4/10/2014 6:55:40 PM
6
1 Introduction
1.1 Background
Fluoride is a natural constituent of all types of human diet and is present, in varying amounts, in drinking water throughout the world. Because of its value in preventing decay (i.e. formation of dental caries), fl uoride is increasingly being used for this purpose in several countries. Enamel fl uorosis (unsightly mottling of the teeth) is the only untoward effect of the use of fl uoride, and the condition is known to occur in regions worldwide wherever drinking water contains high levels of fl uoride naturally.
Most of the time throughout the day, teeth are bathed in saliva; hence, the teeth benefi t from fl uoride ions present in the oral environment, originating from a number of sources to which the individual may be exposed. The con-centration of fl uoride in saliva varies among individuals, and depends on various factors such as salivary secretion rate and the type of fl uoride expo-sure. To exert a cariostatic effect, fl uoride levels need to rise above the pre-dominantly low level several times throughout the day. When fl uoride is added to vehicles such as water, salt or milk, it becomes available in the oral cavity at optimal levels several times a day, whereas toothbrushing with fl uoride-containing toothpaste provide concentrated fl uoride twice a day. These methods of fl uoride supplementation are highly successful in reducing levels of dental caries in entire populations. Fluoride is also available through con-centrated gels, rinsing solutions, lacquers or varnishes. These methods are most appropriate for selective use on individuals who are suffering from high caries activity.
The goals of community-based public health programmes should be to implement measures that raise the fl uoride concentration in as many mouths as possible as often as possible, using the most appropriate method. Effective methods are water, salt or milk fl uoridation either alone or in combination with fl uoride-containing toothpaste, all of which make fl uoride available to the population in a manner that does not require cooperative effort or direct action. However, when fl uoride is ingested by young children, very mild dental enamel fl uorosis may occur. Because of the numerous sources of fl uoride
c01.indd 6 4/10/2014 6:55:16 PM

Introduction
7
available today, the risk of enamel fl uorosis must always be borne in mind. Thus, public health administrators should assess the total fl uoride exposure of the population before introducing any additional fl uoridation or supple-mentation programmes for caries prevention.
The overall goals of this document are to provide information on:
• determining current levels of fl uoride exposure; • determining the appropriateness of fl uoride-based caries-prevention
programmes; • using fl uoride in urine as a biomarker of fl uoride exposure; and • assessing adherence to fl uoride-based community preventive
programmes.
Specifi c objectives are to:
• present the concept of urinary fl uoride as a biomarker of fl uoride exposure;
• provide guidance on the general design of urinary fl uoride assessment, including identifi cation of participants, sampling, methods of monitor-ing, methods of time-controlled urine collection (24-hoururine collec-tion and timed collections of urine obtained from defi ned periods of a day) and number of subjects suggested;
• describe the methods for urinary collection, and the elements needed for both sample collection and the determination of fl uoride in urine (and in water, if required);
• provide advice on data management and evaluation of results using simple calculations;
• provide an option for countries that have a special interest in conduct-ing a more comprehensive analysis of data;
• provide information and examples of recording other sources of fl uoride exposure, if such is indicated by any specifi c situation; and
• provide guidance on design of the fi nal report.
1.2 Sources of fl uoride intake in humans
Years ago, water was the main source of fl uoride exposure to humans, although other sources of fl uoride were recognized, including the environment and pollution from industrial emissions. Today, there are many sources of fl uoride, and this needs to be taken into consideration when planning a community caries prevention programme using fl uoride. Fluoride-containing toothpaste can be a signifi cant source of fl uoride ingestion, particularly in young children who involuntarily or voluntarily swallow considerable portions of the tooth-paste, either because the swallowing refl ex in young children is not fully
c01.indd 7 4/10/2014 6:55:16 PM

Basic Methods for Assessment of Renal Fluoride Excretion
8
developed, or because some toothpastes are formulated to heave candy-like fl avours ( 3, 13 ) .
1.3 Fluoride metabolism and excretion
The fl uoride content of the human body is determined by certain physiologi-cal relationships. Urinary fl uoride concentration and excretion depend on plasma fl uoride levels; they are also infl uenced by urinary fl ow and pH. The rate of fl uoride excretion depends on the amount of bioavailable fl uoride ingested; that is, the fl uoride actually absorbed by the organism and distrib-uted in the bloodstream. Urinary pH is affected by diet. For example, diets high in vegetables lead to more alkaline urine, resulting in a higher proportion of ingested fl uoride being excreted in urine. Conversely, diets rich in meat lead to more acid urine, resulting in a lower proportion of ingested fl uoride being excreted in urine. In spite of these confounding factors, determination of renal fl uoride excretion in young children is a useful method for estimating total fl uoride exposure in community programmes for caries prevention that use water, milk or salt fl uoridation.
From data obtained in studies of ingested (systemic) fl uoride – mainly via water, milk or salt – it is possible to develop excretion thresholds; that is, levels that should not be exceeded (Section 5.6, Table 5.3). Urinary studies will also identify instances of insuffi cient excretion, indicating suboptimal fl uoride levels. However, most importantly, studies of urinary fl uoride provide a simple means of ensuring that the total fl uoride intake from all sources does not exceed certain limits, especially in young children whose permanent teeth are developing. This is essential in order to avoid unsightly dental enamel fl uorosis.
1.4 Biomarkers of fl uoride exposure
Recent reviews have considered the suitability of biomarkers for fl uoride exposure. One review looked at contemporary biomarkers (i.e. those measur-ing present or very recent exposure) ( 14 ) , and looked at biomarkers for both recent and historical exposure ( 15, 16 ) . The contemporary biomarkers con-sidered were blood, bone surface, saliva, milk, sweat and urine; the biomarkers of recent exposure considered were nails and hair; and the biomarkers of historical exposure considered were bone and teeth. The reviews concluded that, at present, urine is the most useful biomarker of contemporary fl uoride exposure. The recent review on contemporary biological markers of exposure to fl uoride stated:
A proportion of ingested fl uoride is excreted in urine. Plots of daily urinary fl uoride excretion against total daily fl uoride intake suggest that daily urinary
c01.indd 8 4/10/2014 6:55:16 PM
Introduction
9
fl uoride excretion is suitable for predicting fl uoride intake for groups of people, but not individuals. While fl uoride concentrations in plasma, saliva and urine have some ability to predict fl uoride exposure, present data are insuffi cient to recommend utilizing fl uoride concentrations in these body fl uids as biomarkers of contemporary fl uoride exposure for individuals. Daily fl uoride excretion in urine can be considered a useful biomarker of contemporary fl uoride exposure for groups of people, and normal values have been published ( 14 ) .
Thus, the value of urinary fl uoride as a biomarker of fl uoride exposure has been established and its limitations have been documented.
1.5 Urinary fl uoride assessments in population oral health
Ingested fl uoride from all sources, whether deliberately or unintentionally ingested, is excreted primarily in the urine. Thus, studies of urinary fl uoride levels are ideal for assessing the intake of fl uoride in populations. More par-ticularly, such studies also provide a basis for decisions on the use of fl uoride for caries prevention.
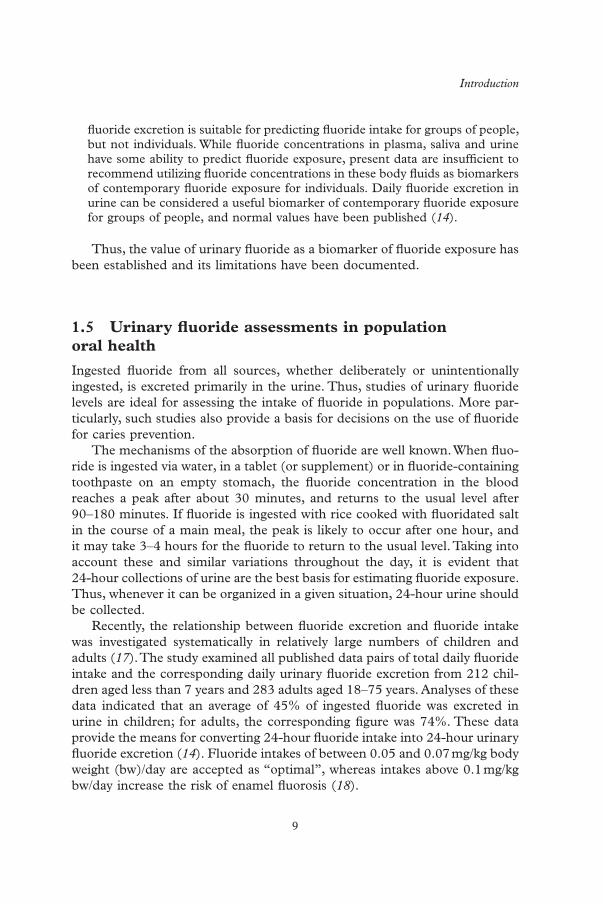
The mechanisms of the absorption of fl uoride are well known. When fl uo-ride is ingested via water, in a tablet (or supplement) or in fl uoride-containing toothpaste on an empty stomach, the fl uoride concentration in the blood reaches a peak after about 30 minutes, and returns to the usual level after 90–180 minutes. If fl uoride is ingested with rice cooked with fl uoridated salt in the course of a main meal, the peak is likely to occur after one hour, and it may take 3–4 hours for the fl uoride to return to the usual level. Taking into account these and similar variations throughout the day, it is evident that 24-hour collections of urine are the best basis for estimating fl uoride exposure. Thus, whenever it can be organized in a given situation, 24-hour urine should be collected.
Recently, the relationship between fl uoride excretion and fl uoride intake was investigated systematically in relatively large numbers of children and adults ( 17 ) . The study examined all published data pairs of total daily fl uoride intake and the corresponding daily urinary fl uoride excretion from 212 chil-dren aged less than 7 years and 283 adults aged 18–75 years. Analyses of these data indicated that an average of 45% of ingested fl uoride was excreted in urine in children; for adults, the corresponding fi gure was 74%. These data provide the means for converting 24-hour fl uoride intake into 24-hour urinary fl uoride excretion ( 14 ) . Fluoride intakes of between 0.05 and 0.07 mg/kg body weight (bw)/day are accepted as “optimal”, whereas intakes above 0.1 mg/kg bw/day increase the risk of enamel fl uorosis ( 18 ) .
c01.indd 9 4/10/2014 6:55:17 PM

Basic Methods for Assessment of Renal Fluoride Excretion
10
Table 5.3 (Section 5.6) shows the lower and upper margins of optimal intake according to Villa ’ s equation for selected age groups of children ( 17 ) . According to the equation, for fl uoride levels to be optimal, children in the age group 3–5 years (normally having a weight of 17.3 kg) should have an average daily fl uoride excretion of 0.33–0.45 mg/day. Table 5.4 shows the calculated daily urinary fl uoride excretion (DUFE) associated with low, optimal and high fl uoride intake for ages 1–14 years for each year of age, and Table 5.5 presents the calculated DUFE associated with low, optimal and high fl uoride intake for broader age groups.
1.6 Areas of uncertainty
Several areas of uncertainty are associated with the use of urinary fl uoride as a biomarker of fl uoride exposure. These uncertainties, listed below, should be considered when planning, conducting and interpreting the fi ndings of studies of urinary fl uoride excretion.
• Infl uence of diet on urinary fl uoride excretion. As discussed in Section 1.3, communities consuming diets high in vegetables are likely to excrete urine that is more alkaline than urine excreted by those consuming a diet high in meats. Higher alkalinity results in excretion of a higher proportion of ingested fl uoride. Thus, in communities with a high veg-etable intake, a relatively high fl uoride excretion does not necessarily imply a high fl uoride intake.
• Within-subject variation. It is usual to collect urine from subjects for 1 day only; hence, there will be considerable within-subject variation in the results; and this within-subject variation can be as large as between-subject variation. Thus, within-subject variation can infl ate the range and variance of data from urine excretion studies. To limit such effects, it would be necessary to record results over several days for each subject. In practice, this is rarely necessary because there is little effect on the mean values, but it does imply that ranges and variances need to be interpreted cautiously. Reports must note the potential effects of within-subject variation, to avoid misinterpretation of data presented as ranges of fl uoride excretion and intakes.
• Lack of correlation between urinary fl uoride excretion and fl uoride intake. Urinary fl uoride excretion is not suitable for predicting fl uoride intake for individuals (see Section 1.4: “Biomarkers of fl uoride intake”).
• Uncertainty about levels needed to provide protection. The so-called “optimal” fl uoride intake recommended for children has an empirical origin; nevertheless, the actual range that is suffi cient to protect against caries and beyond which dental enamel fl uorosis may happen is not known precisely.
c01.indd 10 4/10/2014 6:55:17 PM

Introduction
11
• Methodological errors. If the method chosen is a timed period collection of urine covering 8–18 hours of the 24-hour cycle, an error will be associated with the estimation of 24-hour fl uoride excretion in urine from such data.
c01.indd 11 4/10/2014 6:55:17 PM

12
2 General design of study
2.1 Background
The rate of urinary excretion of fl uoride varies throughout the day and night, depending on the time of fl uoride ingestion, particularly where fl uoride-containing toothpaste is used and is perhaps swallowed during brushing, and where a fl uoride supplement is given once a day (e.g. in the form of tablets or fl uoridated milk). Therefore, when using urine to evaluate fl uoride excre-tion, it is best to collect the urine for the entire 24-hour period. Shorter periods can be used if necessary, but the limitations of this approach must be recog-nized (see Section 1.6). There may be special circumstances where informa-tion on pH of urine is useful (see Sections 1.3 and 1.6), but certain safeguards are required in order to obtain a valid estimate of pH in fresh urine, as dis-cussed in Sections 3.2.1 and 4.1.
2.2 Identifi cation of participants
Countries contemplating the introduction of additional fl uoridation or sup-plementation programmes should consider measurement of urinary excretion as an important element of studies of total fl uoride exposure. Such studies should include identifi cation of community water supplies and mapping of their fl uoride concentration, use of fl uoride supplements, use and frequency of fl uoride-containing toothpastes, and identifi cation of any other possible sources of fl uoride to which the target population may be exposed.
2.3 Sampling
A study of fl uoride excretion may be undertaken for various purposes such as community surveillance, fi eld demonstration trial or research. The selection of individuals to participate in each type of investigation will depend on the specifi c purpose, and both the purpose and the basis of selection should be clearly established before the study begins. If the study is for community surveillance, the population should be selected randomly, because elements
c02.indd 12 4/10/2014 6:55:17 PM
General design of study
13
of the diet that affect fl uoride intake (e.g. water, salt and dietary habits) may vary with area and with socioeconomic status. Where total randomization is impossible, a careful selection of subjects must be made from multiple sites, taking into account any special or predominant regional dietary habits.
Sampling procedures should consider location, number of subjects, age group, frequency, and time of study and number of days; these criteria are discussed below.
Location
The study population should be representative of the community in terms of fl uoride exposure and dietary habits. It may be useful to target certain popula-tion groups living in different sections of the community that have different behavioural or environmental conditions.
Number of subjects
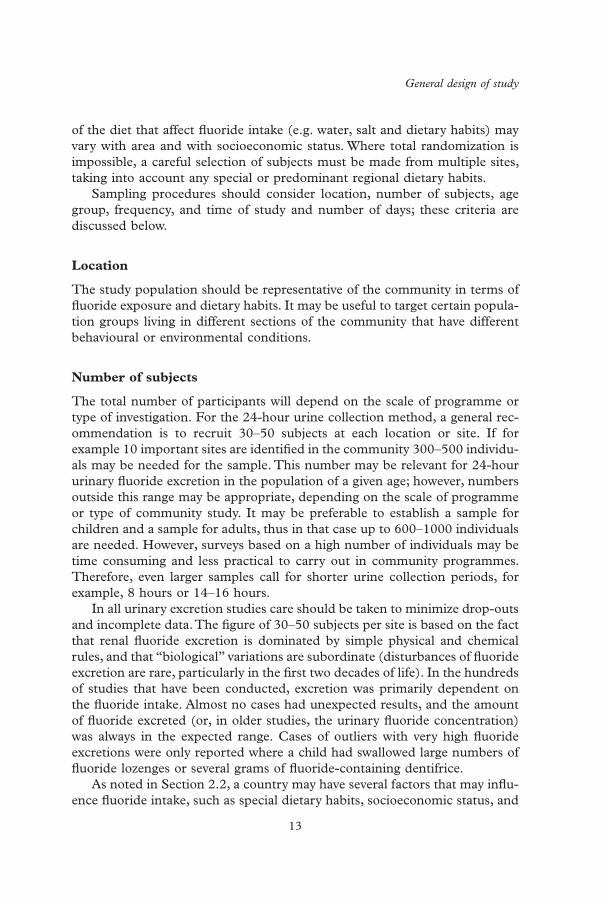
The total number of participants will depend on the scale of programme or type of investigation. For the 24-hour urine collection method, a general rec-ommendation is to recruit 30–50 subjects at each location or site. If for example 10 important sites are identifi ed in the community 300–500 individu-als may be needed for the sample. This number may be relevant for 24-hour urinary fl uoride excretion in the population of a given age; however, numbers outside this range may be appropriate, depending on the scale of programme or type of community study. It may be preferable to establish a sample for children and a sample for adults, thus in that case up to 600–1000 individuals are needed. However, surveys based on a high number of individuals may be time consuming and less practical to carry out in community programmes. Therefore, even larger samples call for shorter urine collection periods, for example, 8 hours or 14–16 hours.
In all urinary excretion studies care should be taken to minimize drop-outs and incomplete data. The fi gure of 30–50 subjects per site is based on the fact that renal fl uoride excretion is dominated by simple physical and chemical rules, and that “biological” variations are subordinate (disturbances of fl uoride excretion are rare, particularly in the fi rst two decades of life). In the hundreds of studies that have been conducted, excretion was primarily dependent on the fl uoride intake. Almost no cases had unexpected results, and the amount of fl uoride excreted (or, in older studies, the urinary fl uoride concentration) was always in the expected range. Cases of outliers with very high fl uoride excretions were only reported where a child had swallowed large numbers of fl uoride lozenges or several grams of fl uoride-containing dentifrice.
As noted in Section 2.2, a country may have several factors that may infl u-ence fl uoride intake, such as special dietary habits, socioeconomic status, and
c02.indd 13 4/10/2014 6:55:17 PM
Basic Methods for Assessment of Renal Fluoride Excretion
14
environmental conditions; because these factors may be unknown, the study population should be selected at random. Where the conditions are known (e.g. in regions with high fl uoride concentration in the water), a careful selec-tion of the study population must be made from multiple sites.
Age groups
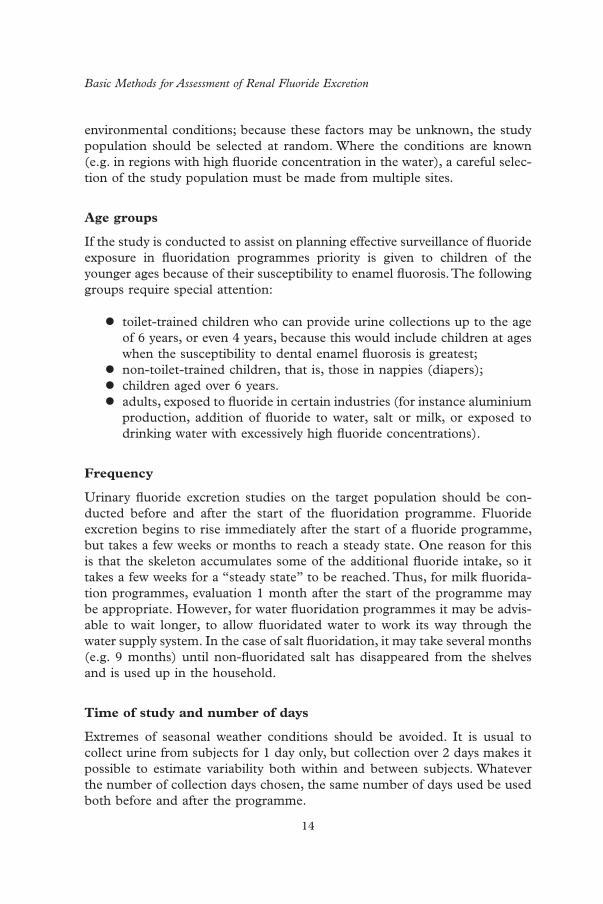
If the study is conducted to assist on planning effective surveillance of fl uoride exposure in fl uoridation programmes priority is given to children of the younger ages because of their susceptibility to enamel fl uorosis. The following groups require special attention:
• toilet-trained children who can provide urine collections up to the age of 6 years, or even 4 years, because this would include children at ages when the susceptibility to dental enamel fl uorosis is greatest;
• non-toilet-trained children, that is, those in nappies (diapers); • children aged over 6 years. • adults, exposed to fl uoride in certain industries (for instance aluminium
production, addition of fl uoride to water, salt or milk, or exposed to drinking water with excessively high fl uoride concentrations).
Frequency
Urinary fl uoride excretion studies on the target population should be con-ducted before and after the start of the fl uoridation programme. Fluoride excretion begins to rise immediately after the start of a fl uoride programme, but takes a few weeks or months to reach a steady state. One reason for this is that the skeleton accumulates some of the additional fl uoride intake, so it takes a few weeks for a “steady state” to be reached. Thus, for milk fl uorida-tion programmes, evaluation 1 month after the start of the programme may be appropriate. However, for water fl uoridation programmes it may be advis-able to wait longer, to allow fl uoridated water to work its way through the water supply system. In the case of salt fl uoridation, it may take several months (e.g. 9 months) until non-fl uoridated salt has disappeared from the shelves and is used up in the household.
Time of study and number of days
Extremes of seasonal weather conditions should be avoided. It is usual to collect urine from subjects for 1 day only, but collection over 2 days makes it possible to estimate variability both within and between subjects. Whatever the number of collection days chosen, the same number of days used be used both before and after the programme.
c02.indd 14 4/10/2014 6:55:17 PM
General design of study
15
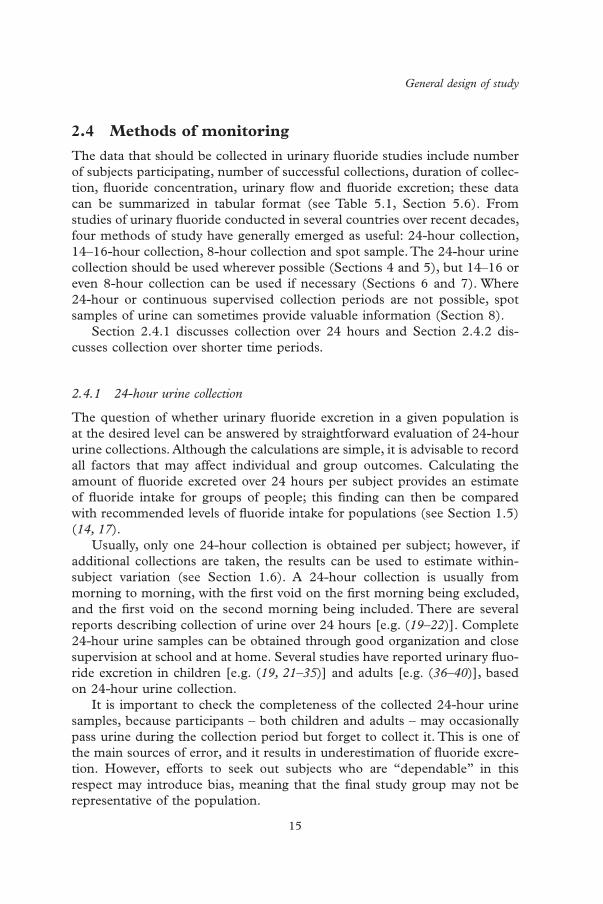
2.4 Methods of monitoring
The data that should be collected in urinary fl uoride studies include number of subjects participating, number of successful collections, duration of collec-tion, fl uoride concentration, urinary fl ow and fl uoride excretion; these data can be summarized in tabular format (see Table 5.1, Section 5.6). From studies of urinary fl uoride conducted in several countries over recent decades, four methods of study have generally emerged as useful: 24-hour collection, 14–16-hour collection, 8-hour collection and spot sample. The 24-hour urine collection should be used wherever possible (Sections 4 and 5), but 14–16 or even 8-hour collection can be used if necessary (Sections 6 and 7). Where 24-hour or continuous supervised collection periods are not possible, spot samples of urine can sometimes provide valuable information (Section 8).
Section 2.4.1 discusses collection over 24 hours and Section 2.4.2 dis-cusses collection over shorter time periods.
2.4.1 24-hour urine collection
The question of whether urinary fl uoride excretion in a given population is at the desired level can be answered by straightforward evaluation of 24-hour urine collections. Although the calculations are simple, it is advisable to record all factors that may affect individual and group outcomes. Calculating the amount of fl uoride excreted over 24 hours per subject provides an estimate of fl uoride intake for groups of people; this fi nding can then be compared with recommended levels of fl uoride intake for populations (see Section 1.5) ( 14, 17 ) .
Usually, only one 24-hour collection is obtained per subject; however, if additional collections are taken, the results can be used to estimate within-subject variation (see Section 1.6). A 24-hour collection is usually from morning to morning, with the fi rst void on the fi rst morning being excluded, and the fi rst void on the second morning being included. There are several reports describing collection of urine over 24 hours [e.g. ( 19–22 ) ]. Complete 24-hour urine samples can be obtained through good organization and close supervision at school and at home. Several studies have reported urinary fl uo-ride excretion in children [e.g. ( 19, 21–35 ) ] and adults [e.g. ( 36–40 ) ], based on 24-hour urine collection.
It is important to check the completeness of the collected 24-hour urine samples, because participants – both children and adults – may occasionally pass urine during the collection period but forget to collect it. This is one of the main sources of error, and it results in underestimation of fl uoride excre-tion. However, efforts to seek out subjects who are “dependable” in this respect may introduce bias, meaning that the fi nal study group may not be representative of the population.
c02.indd 15 4/10/2014 6:55:17 PM

Basic Methods for Assessment of Renal Fluoride Excretion
16
There are three methods for checking the completeness of 24-hour collec-tions: urine volume or fl ow rate, creatinine and para-amino benzoic acid (PABA). Each of these is discussed below. Because each criterion has limita-tions, it is best to consider more than one criterion before excluding a collection.
Urine volume or fl ow rate
Urine volume (or fl ow rate) is a commonly used marker for validating the completeness of 24-hour urine samples. For example, in children aged 2–4 years, a 24-hour urine volume of less than 140 mL or a fl ow rate of less than 5 mL/hour may indicate incomplete collection. However, daily urine volume, and consequently fl ow rate, is affected by the amount of liquid consumed per day. The upper section of Table 5.2 provides criteria that can be used in cleaning data for children aged 2–6 years.
Creatinine
Creatinine is spontaneously formed by the breakdown of creatine in muscle, and levels are only slightly affected by diet or normal physical activity. It is excreted in urine at a relatively constant rate, through glomerular fi ltration. In any individual with stable renal function, the scatter of serum creatinine concentrations from day to day is small, having a within-subject coeffi cient of variation (CV) of about 4%. Therefore, 24-hour urinary excretion of creati-nine has been used as a marker of completeness of 24-hour urine collection. Samples with a 24-hour urine creatinine of less than 8 mg/kg bw/day may be due to incomplete collection, and samples with a 24-hour urine creatinine of more than 22 mg/kg bw/day may be due to collection for longer than 24 hours (see the middle section of Table 5.2).
Para-amino benzoic acid
PABA is part of the vitamin B folic acid, and is eaten in small amounts in foods such as yeast, cereals, meat and milk. Larger amounts are included in some vitamin tablets, hair dyes or sunscreens. Since PABA is fully absorbed and fully excreted in urine within 24 hours, it has been used in some large surveys, such as the United Kingdom of Great Britain and Ireland (UK) National Diet and Nutrition Survey (NDNS), to assess the completeness of 24-hour urine collection. Before administering PABA tablets, the eligibility of participants should be checked. PABA tablets should not be given to those who are pregnant; have allergy to hair dye, sunscreen or vitamins; or are taking sulphonamides. PABA may interfere with the antibacterial action of sulphonamides.
c02.indd 16 4/10/2014 6:55:17 PM

General design of study
17
This method of determining completeness of the 24-hour urine sample involves providing three 80 mg PABA tablets to the participants, to be taken at specifi ed intervals with meals. Completeness is then assessed by measuring urinary recovery of PABA over 24 hours. Collections having PABA recovery of 85–110% are considered complete (see the lower section of Table 5.2). PABA can be estimated using a colorimetric method ( 41 ) or a high-performance liquid chromatography (HPLC) method ( 42 ) . The latter is preferable because some common drugs (e.g. paracetamol) cross-react in the colorimetric method, giving falsely high recoveries.
2.4.2 Timed collections of urine obtained from defi ned periods of a day
In all studies that are not based on 24-hour urine collection, information on the timing of maximum fl uoride ingestion is important. Fluoride supple-mentation other than through drinking water usually results in peaks of fl uo-ride excretion at certain hours. After ingestion of fl uoridated milk, food containing fl uoridated salt, or fl uoride tablets, maximum fl uoride excretion levels are generally reached within 30–180 minutes; the same is true where toothpaste is swallowed during brushing of the teeth. Information on eating habits allows for better planning of any study and facilitates the interpretation of results.
The primary purpose of the time-controlled method is to provide fairly precise estimations of 24-hour fl uoride excretion when 24-hour collections are not feasible. The estimations are fairly reliable when urine collection starts during or immediately after intake of fl uoridated milk or supplements. For monitoring the effects of salt fl uoridation, urine collection must start shortly after consumption of the main salted meal, and collection should last at least 2 hours (3 hours if possible). By organizing an additional collection for the night, it is possible to readily obtain urine collections lasting 9–12 hours. In many such studies, a third collection during the daytime is organized for another 3–5 hours. In this way, the total duration of collections covered is between 14 hours (i.e. 2 + 9 + 3) and 20 hours (i.e. 3 + 12 + 5). The many physi-ological studies on plasma fl uoride indicate that very high or very low fl uoride excretion are not to be expected in the 4 hours (i.e. 24 minus 20) to 10 hours (i.e. 24 minus 14) for which data are not collected.
During the past 30 years, several fl uoride studies based on 8-hour or 14–16-hour urine collections have been reported. The results indicate that such studies are useful for evaluating public health programmes ( 20, 43–52 ) .
For particular purposes – such as to establish the time of day at which fl uoride elimination is highest in the population of interest – it may be useful to collect urine separately for specifi c periods (e.g. morning, afternoon, night) and to analyse each micturition separately. In such cases, collection must
c02.indd 17 4/10/2014 6:55:17 PM

Basic Methods for Assessment of Renal Fluoride Excretion
18
include 2–3 hours that cover the period of the day when the customary main fl uoride ingestion and subsequent excretion takes place.
12–20 hour collections
Collections of urine over intervals of between 12 and 20 hours should cover, as far as possible, three distinct periods in all subjects:
• High : a supervised sample collected during the period when maximum excretion is expected. If supplementary fl uoride is given (e.g. in fl uori-dated milk, tablets or drops, or a meal containing fl uoridated salt), collection should start as soon as possible (but at least within 30 minutes of the beginning of the meal), and should last at least 2 hours, to ensure that the excretion peak is captured.
• Low : a supervised sample taken during a part of the day that is not preceded by high fl uoride intake.
• Nocturnal : a sample taken during the night (i.e. during the period of sleep). Children or their parents should bring this sample to school the next morning.
Ideally, a complete series of three collections should be collected from each subject [e.g. see ( 47 ) ]. Average fl uoride excretion levels should generally be similar in the low and nocturnal collections. If they differ widely, efforts should be made to determine the possible reason (e.g. young children may swallow considerable amounts of fl uoride-containing toothpaste). In some developing countries, half of the children in a community go to school in the morning (from 07:00 to 11:00) and half in the afternoon (from 12:00 to 17:00). Therefore, it is likely that the fi rst groups will provide morning and nocturnal urine samples, and the second groups afternoon and nocturnal samples. In such circumstances, acceptance of these “incomplete series” of collections may be the only way to obtain data.
8-hour collections
When it is diffi cult to obtain three collections covering a total of 12–20 hours, two collections extending over as many hours as possible should be the aim. Urine may be collected at school or at work, preferably under supervision, with a total duration of at least 8 hours. Two different collections are neces-sary, one following the main intake of fl uoride (high) and one at another time (low or, preferably, nocturnal). This may be the only possibility for studies undertaken in subjects from poor areas or large cities, or from rural areas of some developing countries where it may be diffi cult to secure cooperation of the population. Nocturnal collections are preferable, because high nocturnal
c02.indd 18 4/10/2014 6:55:17 PM

General design of study
19
fl uoride excretion is usually indicative of high 24-hour excretion, and thus of high fl uoride intake.
Specifi c situation of young children in day care
In some countries, young children are taken to a day-care centre or pre-kinder institution in the early morning, and remain there until late morning or early afternoon; they are then transferred to the home of a relative or to a babysitter until late afternoon, when they are taken home by their parents. In these circumstances, supervised urine collection may only be possible during the morning and nocturnal periods totalling 14–15 hours. In such cases, a cau-tious approach is to look separately at the results during the low and high excretion periods ( 43 ) .
c02.indd 19 4/10/2014 6:55:17 PM
20
3 Methods for collecting urine, and for handling and evaluating results
3.1 Recording of information
For specifi c studies investigating sources of fl uoride exposure, it is useful to obtain and comprehensively record information on fl uoride exposure, both general (i.e. factors that bear on the entire group, community or region) and personal (i.e. factors such as fl uoride exposure at home or professionally applied fl uorides). Less comprehensive data will suffi ce when evaluating the level of fl uoride exposure in communities before or after the introduction of fl uoride-based preventive programmes. The following subclauses provide details of relevant information to be recorded. Figures 3.1 through 3.5 depict examples that can be useful to the investigator on recruiting efforts (Figure 3.4 ), designing labels for urine collecting periods (Figures 3.1 and 3.2 ), sum-marizing data (Figure 3.3 ) and collecting information on tooth brushing practices and use of fl uoride supplements (Figure 3.5 ).
3.1.1 General information
The fl uoride content of the drinking water in the community must be ascer-tained. A good practice is to provide parents or guardians with a clean 25 mL plastic cylinder – labelled with the identifi cation (ID) code assigned to the child – with a screw cap, to obtain a sample of water that the child drinks at home. Parents should be instructed to rinse the cylinder a couple of times with the water the child usually drinks at home, fi ll it to the top with that water, ensure that the cylinder is tightly closed, and bring the sample to the school for testing.
If milk fl uoridation is present, the quantity of fl uoride in milk and the time of ingestion should be established. If salt fl uoridation programmes have been implemented in the country, or if fl uoridated salt is otherwise available, it is essential to determine whether fl uoride is added to domestic salt only, or also to the salt used in bakeries, large kitchens (e.g. in restaurants, workplace, canteens and hospitals) or the food industry ( 53 ) .
Data on actual fl uoride concentration in salt are also crucial. A level of 250 mg/kg is commonly used when addition of fl uoride is limited to domestic
c03.indd 20 4/10/2014 6:55:22 PM

Methods for collecting urine, and for handling and evaluating results
21
xeS emaN a ID No.
School/ institution or place of employment Date Period Ab
Time initial voidingc
Time Time Time Time Final time
Micturition 1 2 3 4 Volume (mL)
1 2 3 4 Volume (mL)
ID, identification
Note: In some countries it is not permitted to record the name of the child; in such cases ,the project director should maintain a cross-reference list, and the ID number assigned should be used to identify data collected from individuals.
a Sex is included merely to alert staff and ensure that a wide mouth jar is provided to female children to facilitate collection.
b The period should be designated depending whether it is the morning period (A), afternoon (B), or evening (C), and the corresponding labels printed and affixed to each jar beforehand. Other period designations may be used, but the designations must be decided on before the start of the study.
c The volume of urine at initial voiding is not recorded and is not analysed for fluoride, but the time must be carefully recorded on the label and entered in the form shown in Fig. 3.3.
Figure 3.1 Example of daytime label used in time-controlled collections, to be attached to the urine collecting jar (WHO Form No. 96392, modifi ed)
Name_______________________________ ID No.____________
Overnight urine collec on Date___________________
1) Note the me at which subject urinated before going to bed. DO NOT COLLECT THIS URINE
_______________________ pm
2) If subject wishes to urinate during the night he or she should use the jar
3) When subject gets up in the morning he or she should urinate in the jar. Then close the jar and note the me _____________ am
PLEASE BRING THE JAR TO SCHOOL IN THE MORNING
Figure 3.2 Overnight urine collection label used in time-controlled collections (WHO Form No. 96393)
c03.indd 21 4/10/2014 6:55:22 PM

Basic Methods for Assessment of Renal Fluoride Excretion
22
General informa on: Region __________________ Country ________________Community ___________________ Area: Urban ____Rural _______ Date _________ School: ________________ Code:_______ Mean temperature:____°C
A doireP :atad nerdlihC(High)
Period B(Low)
Period C (Nocturnal)
No ID Age Sex Weight Start End Start End Start End Time
Vol. Time
Vol. Time
Vol. Time
Vol. Time
Vol. Time
Vol. Time
Vol. Time
Vol. Time
Vol. Time
Vol. Time
Vol. Time
Vol. Time
Vol. Time
Vol. Time
Vol. Time
Vol. Time
Vol. Time
Vol. Time
Vol. Time
Vol. Time
Vol. Time
Vol.
Figure 3.3 Summary record form of urine collection from a group of children in time-controlled collections (WHO Form No. 96391)
c03.indd 22 4/10/2014 6:55:23 PM

Methods for collecting urine, and for handling and evaluating results
23
Preschool, kindergarten, day-care centre or elementary school_______________________________________________
Community_____________________________ Date ____________________
Dear Parent:
The school has agreed to participate in a study about fluoride and children 3–5 years old. The dental health staff fromthe __________________________ of ______________________ wants to study how much fluoride children have in theirurine. Fluoride is found naturally in our drinking water. People from this community are being asked to take part in thisstudy because fluoride helps to prevent dental cavities. What the dental health staff learns about our community will becompared with information from other communities and will help establishing a programme to prevent cavities (caries)in the population living in this community.
The study is simple. It involves collecting a few samples of your child’s urine and a sample of your drinking water.Plastic containers will be provided by the people in charge of the study. Please let us know whether or not you wouldbe interested in getting more details and possibly agreeing that your child takes part in this activity.
We kindly ask you to complete the form below (X) and send it back with your child.
You may contact the nurse’s office or your child’s teacher if you have questions you want answered first.
YES I am interest NO I am not interested
Your name _____________________________________________________
Contact information ___________________________________________:
Figure 3.4 Sample invitation (example)
salt. However, when almost all salt destined for human consumption (including salt used in bakeries, large kitchens and the food industry) is fl uori-dated, concentrations of 180–200 mg/kg are commonly used. Samples of salt and pre-salted food must be collected from food markets, restaurants, baker-ies, institutions, salt-processing plants or distributors, and so on.
Whereas some countries have collected data on salt intake, others estimate this by salt “disappearance”, which is obtained indirectly by summing home production and imports minus quantities of exported salt, or directly from quantities of salt sold (if this can be determined). Only a portion of salt used in households or in large kitchens is actually ingested, and that proportion can vary widely between different cultures. Salt as sodium chloride contains 39.3% sodium, and the maximum recommended daily intake of sodium is 2.3 g, which amounts to a maximum of 5 g salt per day ( 54 ) .
3.1.2 Personal information
Each subject must be identifi ed with a unique (non-repeated) sequential number. The age recorded is usually that on the last birthday, although the exact date of birth can be included. Sex is not mandatory, but some investiga-tors prefer to record and report gender balance (i.e. ratio of male: female). Body weight must be determined on the day of the sample collection to the
c03.indd 23 4/10/2014 6:55:23 PM

Basic Methods for Assessment of Renal Fluoride Excretion
24
Ministry of Health of ________________ Dental department __________________
Use of dentifrices and fluoride supplements by children 3–5 years of age
Country ___________________________ Community ________________________
Recorder __________________________ Survey date Day month year
A. General information
1. Child name
2. Date of birth Day month year
3. Age in years
Male Female
4. Sex 1 2
5.
Occupation of the father or responsible family member
Manual .................................................................................... 1
Technical ................................................................................. 2
Professional ............................................................................. 3
6.
Level of education of mother
None ........................................................................................ 1
Elementary .............................................................................. 2
Secondary ................................................................................ 3
College .................................................................................... 4
Professional ............................................................................. 5
Figure 3.5 Questionnaire on use of fl uoride supplements and toothpaste
c03.indd 24 4/10/2014 6:55:23 PM

Methods for collecting urine, and for handling and evaluating results
25
B. Use of dentifrice
7.
Yes No Does (child name) use toothbrush? ............................................... 1 2
8.
Yes No Does (child name) use toothpaste? ................................................ 1 2
9.
Which toothpaste does (child name) use now?
10.
At what age did (child name) start to use toothpaste? years
11.
How many times per day does (child name) brushes with toothpaste? times
12.
How much toothpaste does (child name) use each time?
1
2
3
13.
Who places the toothpaste on the child’s toothbrush?
The child 1 The mother or other adult 2
14.
Does the mother or another adult supervise the child Yes No during tooth brushing? ............................................................... 1 2
15.
Do you usually buy the same toothpaste for the adults Yes No and children in the family? ......................................................... 1 2
//////////////////////////// //////////////////////////// ////////////////////////////
Figure 3.5 Continued
c03.indd 25 4/10/2014 6:55:23 PM

Basic Methods for Assessment of Renal Fluoride Excretion
26
16.
Which is the main reason for preferring the toothpaste brand that you buy for
your child?
Cost ....................................................................................... 1
Flavour ................................................................................... 2
Package ................................................................................. 3
Other ..................................................................................... 4
17.
Please tell us, what is the purpose of the toothpaste? (Care should be taken not to
influence the answer)
To prevent dental caries ........................................................ 1
To give good mouth breath ................................................... 2
For cleanliness ....................................................................... 3
Other ..................................................................................... 4
18.
Has (child name) ever taken medicines with fluoride for preventing dental caries,
such as drops, tablets or vitamins?
Fluoride drops ....................................................................... 1
Fluoride tablets ...................................................................... 2
Vitamins with fluoride .......................................................... 3
19.
Yes No Is (child name) taking any of these at the present time ............. 1 2
If the answer is No, finish the interview. 20.
At what age did (child name) start taking these medicines? .......... years
1 = Drops with fluoride 2 = Fluoride tablets 3 = Vitamins with fluoride ................
Figure 3.5 Continued
c03.indd 26 4/10/2014 6:55:23 PM
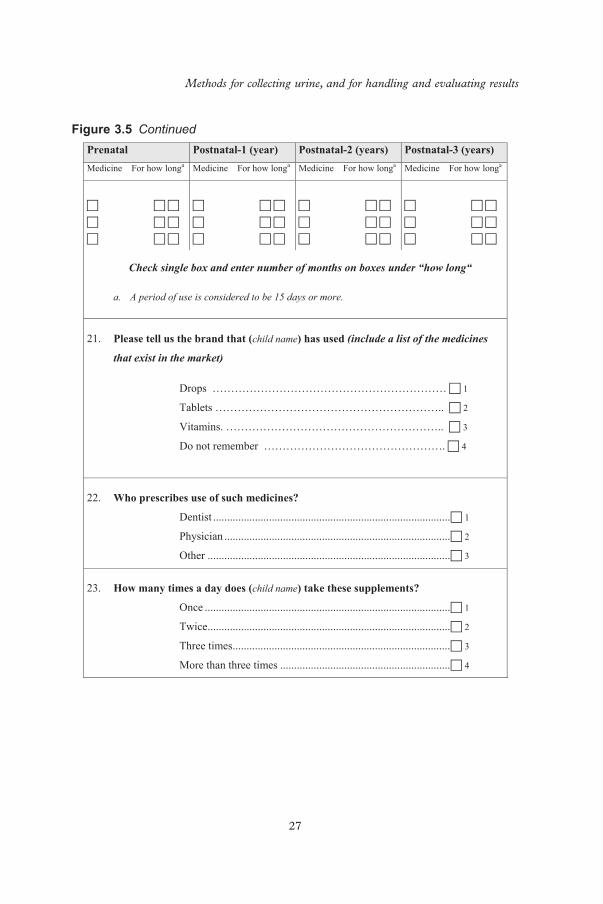
Methods for collecting urine, and for handling and evaluating results
27
Prenatal Postnatal-1 (year) Postnatal-2 (years) Postnatal-3 (years) Medicine For how longa Medicine For how longa Medicine For how longa Medicine For how longa
Check single box and enter number of months on boxes under “how long“
a. A period of use is considered to be 15 days or more.
21.
Please tell us the brand that (child name) has used (include a list of the medicines
that exist in the market)
Drops ……………………………………………………… 1
Tablets …………………………………………………….. 2
Vitamins. ………………………………………………….. 3
Do not remember …………………………………………. 4
22.
Who prescribes use of such medicines?
Dentist ..................................................................................... 1
Physician ................................................................................. 2
Other ....................................................................................... 3
23.
How many times a day does (child name) take these supplements?
Once ........................................................................................ 1
Twice ....................................................................................... 2
Three times .............................................................................. 3
More than three times ............................................................. 4
Figure 3.5 Continued
c03.indd 27 4/10/2014 6:55:23 PM

Basic Methods for Assessment of Renal Fluoride Excretion
28
24.
Where do you buy these medicines?
Pharmacy/Drugstore ............................................................. 1
Dentist/Physician clinic ........................................................ 2
Other ..................................................................................... 3
Specify ____________________________________________
25.
What is the brand name of salt you buy for the family? ________________
Thank you for your answers
Figure 3.5 Continued
nearest 0.1 kg; this can be obtained easily using a portable scale (with the subject wearing light clothing) at the same time as name tags or ID numbers are given.
Investigators may collect from parents or guardians any known information on fl uoride exposure of children or directly from adult participants. Informa-tion required for the investigation of sources of fl uoride exposure could include use of fl uoride-containing toothpaste, whether children use adult toothpaste (1500–2500 parts per million [ppm]F) or toothpaste for children with a lower fl uoride content (250–500 ppm), frequency and quantity of toothpaste use, age at which child began brushing with toothpaste, whether child brushes teeth under supervision, and use of fl uoride supplements (brand name, fl uo-ride concentration and frequency of use and quantity used). Additional infor-mation may include the use of other fl uoride-containing products for oral care (e.g. fl uoride rinses and regular topical application by dental professionals). The fl uoride concentration in these products and the frequency of their use can be recorded in a questionnaire specially designed for this purpose (see Figure 3.5 ), which is administered to parents or guardians either on the same day as sample collection or at a different time. If the study is conducted as part of occupational health surveillance, information pertinent to nature of products being handled, intensity of exposure in terms of hours per day, week or months and exposure protective measures available should be recorded.
In this context, it is important to differentiate clearly between “fl uoride exposure” and “fl uoride intake”. Exposure is a general term indicating avail-ability or frequent use of fl uoride (or both); intake is more specifi c, referring to the ingestion of an amount of fl uoride that is known approximately or may even be measured.
c03.indd 28 4/10/2014 6:55:23 PM
Methods for collecting urine, and for handling and evaluating results
29
3.2 Essential preparatory practices
3.2.1 Pre-collection planning approaches
Informed consent
Fluoride exposure studies involving children require informed consent from the children ’ s parents or guardians. Collaboration from parents or guardians is critical for supervising and recording urine excretion data at home; hence, it is important to fi rst invite them to allow their children to participate, and to then provide clear instructions for the tasks they are expected to carry out. A clear short note of invitation should be prepared, and sent or delivered to each parent or guardian of eligible children (an example is given in Figure 3.4 ). Institutional review boards (IRB) or equivalent agencies oversee the safety and rights of humans who participate as research subjects. A consent form explaining the purpose and activities to be conducted, benefi ts and risks to subjects, participation time and other implications must be prepared by the investigators using plain language that will be easily understood by someone with limited education. IRBs require such a document to be reviewed and approved before subjects are engaged in a study. Requirements may vary from country to country, and the investigator is advised to enquire about existing requirements on this matter.
Collaboration from preschool, kindergarten or day-care centres is crucial to enable investigators to conduct studies in a smooth way. Before the day on which the urine collection is planned, it is advisable to meet with the school nurse to fi nalize details, identify classrooms and restroom facilities for boys and girls, and agree on the necessary project fl ow. Any additional information on project specifi cs can be provided at this time.
Collection staff
People who work closely with families, particularly in the health fi eld, are best suited to obtaining urine collections from subjects in the survey, and are available in most countries. The key staff involved have to obtain the confi dence and cooperation of subjects (and their families if relevant) and schools, supervise collection and undertake simple measurements on the urine collected.
Home kit
Collection vessel – adults and older children
Most studies are undertaken in children or adults able to control micturition. In such cases, the collection vessel is a jar or plastic bottle with a wide mouth,
c03.indd 29 4/10/2014 6:55:23 PM

Basic Methods for Assessment of Renal Fluoride Excretion
30
a lid that can be closed securely (preferably a screw cap), and an area for marking the ID. Such containers are marketed for urine collection and usually graduated in both millilitres and ounces.
The size of container required will depend on the age of the subjects; for example, children aged 3–5 years produce an average of 600–700 mL of urine in 24 hours, whereas children aged 5 years are likely to urinate more.
For collection of all urine over a 24-hourperiod:
• preschool children should be supplied with a 155-mL container; and
• older children and adults should be supplied with a 200-mL container. For nocturnal collections, a 1000-mL container may be required.
A container of 500 or 1000-mL capacity should be used for pooling urine collected from one child during one 24-hour period (the 500-mL capacity may suffi ce if the study includes only small children).
When urine is obtained from defi ned periods of a day, collection containers for use during daytime could have a capacity of 120–300 mL for each period (depending on age and the amount of liquids ingested); jars or bottles of 500-mL capacity are also appropriate.
Collection vessel – infants and young children
For infants or young children who are not toilet trained, paediatric collectors – special pants that collect all urine (referred to as a “bag within a bag”) – should be used ( 22 ) . The bag-within-a-bag system is designed to permit urine to fl ow from the inside bag to the outside bag, but not in the reverse direction; this prevents urine from being in contact with the child ’ s genitals. The collec-tor is provided with a wide micro pore adhesive band made of non-allergenic material to prevent skin irritation (e.g. Lil’Katch, Cat. No. 05–0501 mfg Mark Clark, Topeka, Kansas – distributed by Baxter Scientifi c).
Number of kits
Generally, two of the above kits are used for each subject – one for home and one for school. A third kit may be required if the subject is going somewhere else during the collection period. All items should be labelled using a water-proof marker.
Diary
A small “diary” is required and is given to the subject. The diary contains instructions, the collection supervisor ’ s telephone number, and space for the subject (or parent) to record relevant information (see below).
c03.indd 30 4/10/2014 6:55:23 PM

Methods for collecting urine, and for handling and evaluating results
31
Supervisor requirements
General
The collection supervisor will require the use of a small laboratory or offi ce containing a refrigerator, a freezer, a sink, and a table or bench. The following will also be required:
• plastic measuring jug with wide neck; • plastic funnel; • a 1 L measuring cylinder, accurate to 10 mL; • cold disinfecting solution; and • 20% chlorhexidine digluconate solution, to prevent growth of microor-
ganisms ( 55, 56 ) and reduce offensive odour; this is particularly impor-tant if pH of urine is to be determined, because growth of bacteria releases ammonia and increases the pH of the urine ( 56 ) .
Labels
Labels are crucial for recording the subject ’ s identity number. If time collec-tions are planned, the labels may contain other information essential to the conduct of the study. A label for use specifi cally in time-controlled urine col-lections has been designed for recording personal information (Fig. 3.1 ), micturition times and volume for up to four time periods. This label should be fi rmly attached to the urine collecting jar, to ensure that it does not detach if it becomes wet during the collection process. The label should be of a size that is large enough to contain all the relevant information, but small enough to adhere securely to the jar.
If time collections are planned, a different label is used for the overnight collection (Fig. 3.2 ). This label includes space for entering personal informa-tion and instructions for subjects or parents, plus two recording fi elds.
Record book
A record book is vital – it is used to transfer and maintain a record of indi-vidual and collective data obtained by the collection supervisor in the fi eld. The record book reduces the possibility of losing data entered in labels or forms; it can also be used for cross-referencing and verifying questionable entries. A hand-written record book is recommended because it is easier to handle.
Other essential accessories
Accessories will include a weighing scale in kilograms (one per collection site), pencils, an eraser, data-collection forms, labels (suffi cient quantity), a
c03.indd 31 4/10/2014 6:55:23 PM
Basic Methods for Assessment of Renal Fluoride Excretion
32
fi ne-point permanent marker, disposable gloves, pens and write-on removable adhesive tape in four colours (one per period of collection). If timed collec-tions are planned, additional equipment will be required: a 5-mL capacity graduate plastic measuring cylinder for adding 2.5 mL of 20% chlorhexidine digluconate to the urine collection bottles and a graduated 250 mL plastic cylinder for measuring urine volume at the collection site.
c03.indd 32 4/10/2014 6:55:23 PM
33
4 Twenty-four hour urine collection
4.1 Procedure
If it is intended to record urine pH, the collection supervisor will fi rst add 2.5 mL of 20% chlorhexidine digluconate solution to each collection bottle.
The supervisor should visit the subject, or the subject ’ s care taker, the day before the day of urine collection, to explain the collection procedure and give the subject a home kit and a diary. On the morning of the collection, the subject should void urine (this urine will not be collected) and record the time of this fi rst (discarded) void in the diary. Every subsequent void should be collected. The subject should void into the wide-necked collection container and this urine should be poured into the screw-capped collection bottle, using the funnel. If possible, this collection bottle should be kept in a refrigerator.
The collection supervisor should meet the subject at school, with the second collection kit. Every time the subject wishes to pass urine, the subject and supervisor should meet to ensure complete collection and transfer of urine to the screw-cap collection bottle. If possible, this collection bottle should be kept in a refrigerator. At the end of the school day, the supervisor should collect the school kit, take it to the laboratory or offi ce, and put the collection bottle in the refrigerator. After school, the supervisor should visit the subject at home to motivate the subject (or parent) to continue collection of urine until the fi rst void on the next morning and remind the subject that he/she should note the time of this fi rst void (collected urine) in the diary. In studies with adults, arrangements with the administrative superior or employer are essential.
On the following day, the supervisor should visit the subject ’ s home to ask whether the collection was completed successfully, collect the home kit and diary, and take the collected urine to the laboratory or offi ce. At the labora-tory, all of the urine collected from the subject over the 24-hour should be poured into the 1 L measuring cylinder, and the total volume recorded. Also, the pH of the urine should be measured, if this information is required. The addition of chlorhexidine, mentioned at the beginning of this section, is essen-tial if pH is to be determined. Small crystals of thymol can be added to the urine samples to reduce offensive odour.
c04.indd 33 4/10/2014 6:55:24 PM

Basic Methods for Assessment of Renal Fluoride Excretion
34
Urine samples should be stored in a refrigerator, to keep them cool until they are transferred to the laboratory. If a refrigerator is not available, an insulated cooler to which ice bags or dried ice have been added can be used to keep the samples cool.
The urine should be well mixed before aliquots are taken, and the aliquots should be put in the freezer. Usually, four aliquots are taken and put into four labelled bijous: two for measurement of fl uoride concentration and two for measurement of creatinine concentration. If the aliquots are to be sent by mail (or similar), it is a good idea to take two additional aliquots and store these bijous in the freezer in the laboratory or offi ce, in case the four aliquots are lost in transit. Once the four (or six) labelled bijous are in the freezer, the remaining urine can be discarded, and the collection kits and measuring cyl-inder should be washed, put into disinfecting solution for the appropriate time and rinsed so that they are ready for use by the next subject.
4.2 Fluoride and creatinine concentrations
Urine aliquots intended to be used for this purpose will be conveyed to a suitable laboratory that is equipped to undertake the necessary studies (see Section 2.4.1). If possible, samples should be kept frozen during transport to the laboratory.
4.3 Information to be recorded
As noted previously, personal information must be recorded on the form and in the record book. The following must also be recorded:
• length of the collection period (from the subject ’ s diary, recorded in decimal hours – e.g. 23.9 h, see Section 4.5 for details);
• urine pH (if needed); • urine volume (mL), as measured; • urine volume (mL), adjusted from recorded collection period to
24 hour; • creatinine concentration (mg/L); • creatinine excretion (mg/hour); • fl uoride concentration (mg/L urine or ppm); and • fl uoride excretion (mg/24 hour).
Subject data sometimes needs to be discarded. Any of the following are reasons for discarding data:
• the subject admits to incomplete collection; • the volume of urine is outside the accepted range of volumes (see fl ow
limits in Table 5.2, in Section 5.6); or
c04.indd 34 4/10/2014 6:55:24 PM
Twenty-four hour urine collection
35
• the amount of creatinine excreted in urine is outside the accepted range (see Table 5.2).
For the subjects who completed the study successfully, derived data usually comprises (Table 5.1):
• number of subjects; • gender balance (% male: female); • age (mean, SD); • 24-hour urine volume (mean, SD); • fl uoride concentration (mean, SD); and • 24-hour urinary fl uoride excretion (mean, SD).
4.4 Determination of fl uoride in urine
Reliable methods for determining urinary fl uoride concentrations are well established, and detailed procedures are given in the Appendix section: AP3.3. Procedures for determining fl uoride in water obtained from the community (e.g. from the central water supply, boreholes, wells, springs, creeks or lakes) are the same as those used for determining fl uoride in urine.
4.5 General rules for tabulation and processing of data
The concentration of fl uoride in urine is obtained as described in Annex C or from data provided by the laboratory that conducted the fl uoride determi-nation. Whatever method is used, it is important to take into consideration essential data needed, and to comply with the following calculation rules, which provide simple numerical operations that can be performed using a basic calculator or computer programme. These rules are intended to facilitate calculation of derived data.
A. Duration of collection is calculated in hours and decimals of hour (to convert minutes to decimals of one hour, multiply by 0.01667).
B. A correction factor – obtained by dividing 24 by the actual duration of collection in a given subject – is used when the urine collection was shorter than 24 hours. The corrected volume for a subject is obtained by multiplying the recorded volume by the correction factor for that subject.
C. Quantity of fl uoride in micrograms ( μ g) in the collected urine is obtained by multiplying urine volume (in ml) by fl uoride concentration (in μ g/mL; i.e. ppm).
D. Findings by kilogram of body weight and 24 hours: a) Urine volume in mL/kg bw/day is obtained by dividing the volume
of urine (in mL) in 24 hours (see point B above) by the weight of the child in kilograms.
c04.indd 35 4/10/2014 6:55:24 PM
Basic Methods for Assessment of Renal Fluoride Excretion
36
b) If the investigation requires results of quantity of fl uoride in μ g/kg bw/day, calculations must be carried out for each child by dividing the quantity of fl uoride excreted (in μ g, see point C above) by the weight of the child in kilograms.
These rules are summarized in Table 7.5 in Section 7.1. The person in charge of the assessment should obtain the average quantity
of fl uoride excreted in 24 hours, and compare this with the standards given in Table 5.3. If available, parameters from the shorter collection periods should be compared with the standards given in Table 7.3. These comparisons will help in deciding whether the fl uoride excretion results indicate subopti-mal, optimal or above optimal fl uoride intake, taking into consideration the following guidelines:
• Low fl uoride intake : fl uoride up to 0.02 mg/kg bw/day (i.e. 20 μ g/kg bw/day).
• Optimal usage of fl uoride ; multiple fl uoride-based prevention is used, but not to an extent that would cause enamel fl uorosis of cosmetic impor-tance. The range of total optimal fl uoride intake (or exposure) is 0.05–0.07 mg/kg/day (i.e. 50–70 μ g/kg bw/day).
If no further data management or analyses are required, the person in charge of the study should then prepare a fi nal report, which should include at least the information described in Section 5.
c04.indd 36 4/10/2014 6:55:24 PM

37
5 Design of the fi nal report for 24-hour urine collection
This section suggests what information should be included in the various sections of a fi nal report for a study that involved 24-hour urine collection, and how the report should be structured.
5.1 Introduction
The introduction to the report should state clearly the objectives of the study; objectives can range from surveillance of community programmes to a specifi c research project.
5.2 Materials and methods
The materials and methods should comply with the conventions for scientifi c publications, giving reasons for and methods of selecting the particular loca-tion or locations of the study, and the number and age of subjects. A separate section should provide all relevant information about the known fl uoride exposure of the subjects and the population from which the subjects are drawn. For example, some traditional (mainly African) diets have been shown to be high in fl uoride, whereas in industrialized countries, intensive cultiva-tion, combined with sophisticated food processing, leads to generally low dietary fl uoride content.
5.3 Results
The results section of the study report can be fairly brief, because the methods and evaluations for 24-hour collections are straightforward. Several articles provide examples of how to present the results for studies based on complete 24-hour collections ( 17, 19, 21 ) .
The essential results of any study of this type are the 24-hour urinary fl uo-ride excretion values, summarized when possible in the format illustrated in Table 5.1 (Section 5.6). Urinary data obtained for the purpose of this type of
c05.indd 37 4/10/2014 6:55:25 PM
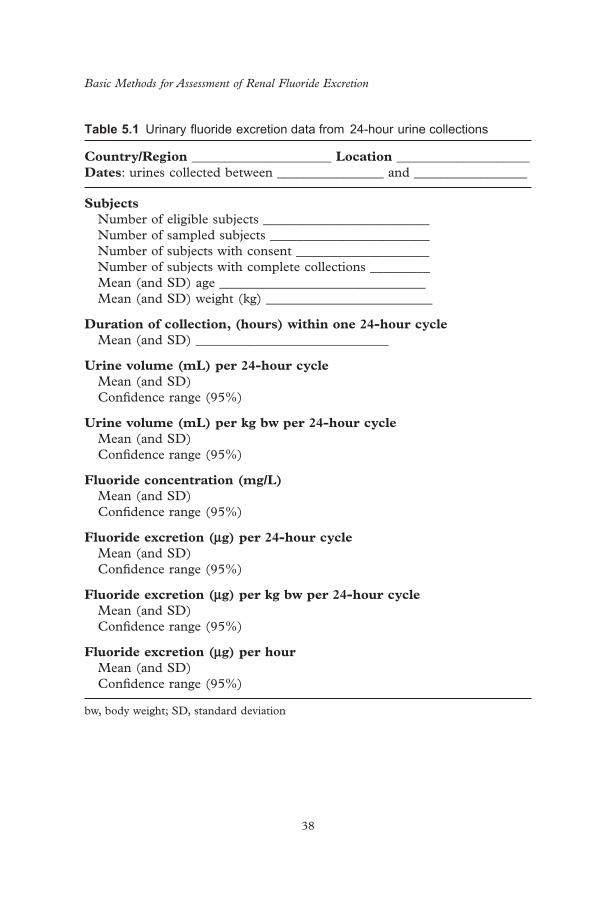
Basic Methods for Assessment of Renal Fluoride Excretion
38
Table 5.1 Urinary fl uoride excretion data from 24-hour urine collections
Country/Region _____________________ Location ____________________ Dates : urines collected between ________________ and _________________
Subjects Number of eligible subjects _________________________ Number of sampled subjects ________________________ Number of subjects with consent ____________________ Number of subjects with complete collections _________ Mean (and SD) age _______________________________ Mean (and SD) weight (kg) _________________________
Duration of collection, (hours) within one 24-hour cycle Mean (and SD) _____________________________
Urine volume (mL) per 24-hour cycle Mean (and SD) Confi dence range (95%)
Urine volume (mL) per kg bw per 24-hour cycle Mean (and SD) Confi dence range (95%)
Fluoride concentration (mg/L) Mean (and SD) Confi dence range (95%)
Fluoride excretion ( μ g) per 24-hour cycle Mean (and SD) Confi dence range (95%)
Fluoride excretion ( μ g) per kg bw per 24-hour cycle Mean (and SD) Confi dence range (95%)
Fluoride excretion ( μ g) per hour Mean (and SD) Confi dence range (95%)
bw, body weight; SD, standard deviation
c05.indd 38 4/10/2014 6:55:25 PM
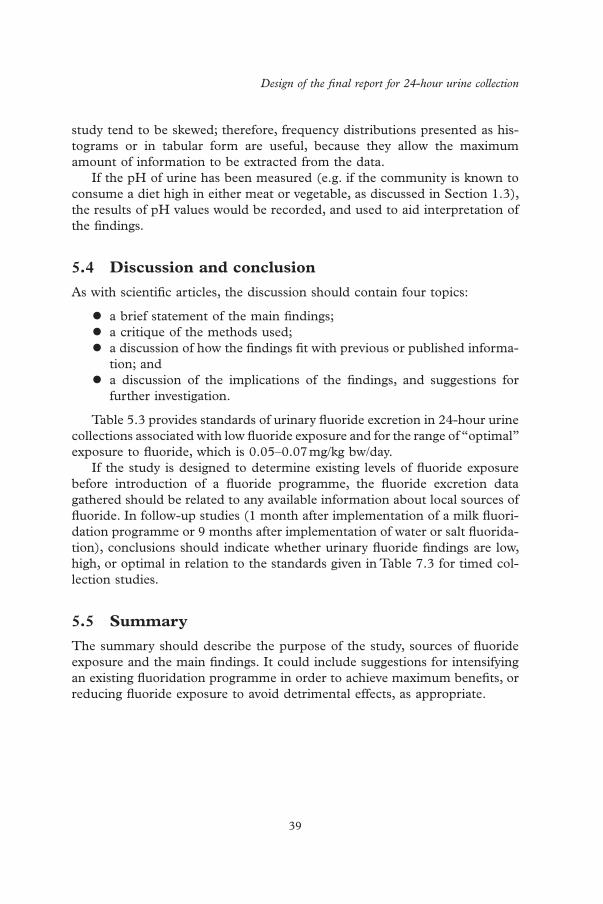
Design of the fi nal report for 24-hour urine collection
39
study tend to be skewed; therefore, frequency distributions presented as his-tograms or in tabular form are useful, because they allow the maximum amount of information to be extracted from the data.
If the pH of urine has been measured (e.g. if the community is known to consume a diet high in either meat or vegetable, as discussed in Section 1.3), the results of pH values would be recorded, and used to aid interpretation of the fi ndings.
5.4 Discussion and conclusion
As with scientifi c articles, the discussion should contain four topics:
• a brief statement of the main fi ndings; • a critique of the methods used; • a discussion of how the fi ndings fi t with previous or published informa-
tion; and • a discussion of the implications of the fi ndings, and suggestions for
further investigation.
Table 5.3 provides standards of urinary fl uoride excretion in 24-hour urine collections associated with low fl uoride exposure and for the range of “optimal” exposure to fl uoride, which is 0.05–0.07 mg/kg bw/day.
If the study is designed to determine existing levels of fl uoride exposure before introduction of a fl uoride programme, the fl uoride excretion data gathered should be related to any available information about local sources of fl uoride. In follow-up studies (1 month after implementation of a milk fl uori-dation programme or 9 months after implementation of water or salt fl uorida-tion), conclusions should indicate whether urinary fl uoride fi ndings are low, high, or optimal in relation to the standards given in Table 7.3 for timed col-lection studies.
5.5 Summary
The summary should describe the purpose of the study, sources of fl uoride exposure and the main fi ndings. It could include suggestions for intensifying an existing fl uoridation programme in order to achieve maximum benefi ts, or reducing fl uoride exposure to avoid detrimental effects, as appropriate.
c05.indd 39 4/10/2014 6:55:25 PM
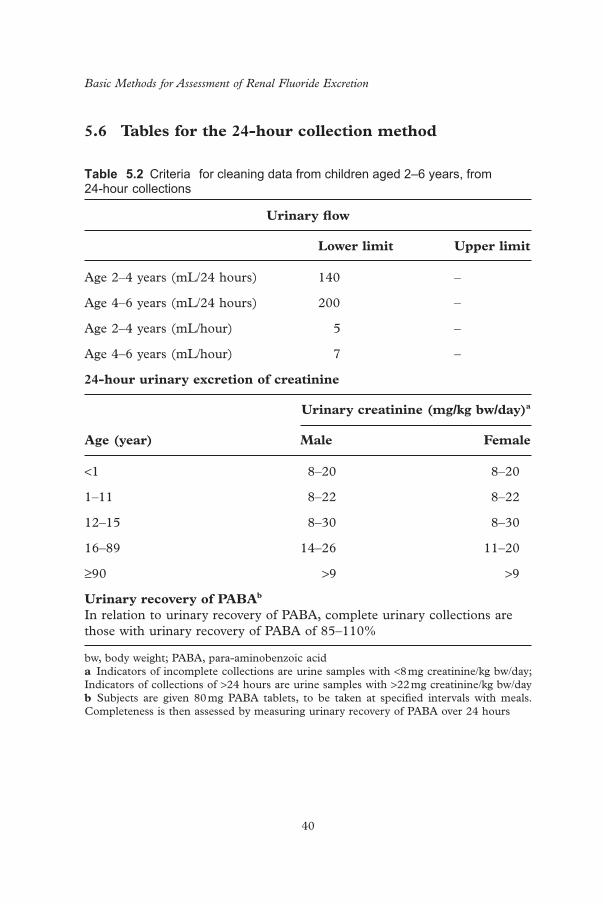
Basic Methods for Assessment of Renal Fluoride Excretion
40
5.6 Tables for the 24-hour collection method Table 5.2 Criteria for cleaning data from children aged 2–6 years, from 24-hour collections
Urinary fl ow
Lower limit Upper limit
Age 2–4 years (mL/24 hours) 140 –
Age 4–6 years (mL/24 hours) 200 –
Age 2–4 years (mL/hour) 5 –
Age 4–6 years (mL/hour) 7 –
24-hour urinary excretion of creatinine
Age (year)
Urinary creatinine (mg/kg bw/day) a
Male Female
< 1 8–20 8–20
1–11 8–22 8–22
12–15 8–30 8–30
16–89 14–26 11–20
≥ 90 > 9 > 9
Urinary recovery of PABA b In relation to urinary recovery of PABA, complete urinary collections are those with urinary recovery of PABA of 85–110%
bw, body weight; PABA, para-aminobenzoic acid a Indicators of incomplete collections are urine samples with < 8 mg creatinine/kg bw/day; Indicators of collections of > 24 hours are urine samples with > 22 mg creatinine/kg bw/day b Subjects are given 80 mg PABA tablets, to be taken at specifi ed intervals with meals. Completeness is then assessed by measuring urinary recovery of PABA over 24 hours
c05.indd 40 4/10/2014 6:55:25 PM

Design of the fi nal report for 24-hour urine collection
41
Table 5.3 Standards for urinary fl uoride excretion (mg/24-hour cycle): lower and upper margins
Low exposure to fl uoride (intake < 0.02 mg per 24-hour cycle)
Range of optimal fl uoride intake
Lower margin a Upper margin b
Age 2–4 years, approximate bw 15.3 kg ≤ 0.14 0.30 0.41
Age 3–5 years, approximate bw 17.3 kg ≤ 0.15 0.33 0.45
Age 4–6 years, approximate bw 19.2 kg ≤ 0.16 0.37 0.50
Age 10–14 years, approximate bw 43.1 kg ≤ 0.33 0.79 1.10
bw, body weight a Lower margin based on a fl uoride intake of 0.05 mg/kg bw/day b Upper margin based on a fl uoride intake of 0.07 mg/kg bw/say Note: For calculations, see Tables 5.4 and 5.5
c05.indd 41 4/10/2014 6:55:25 PM
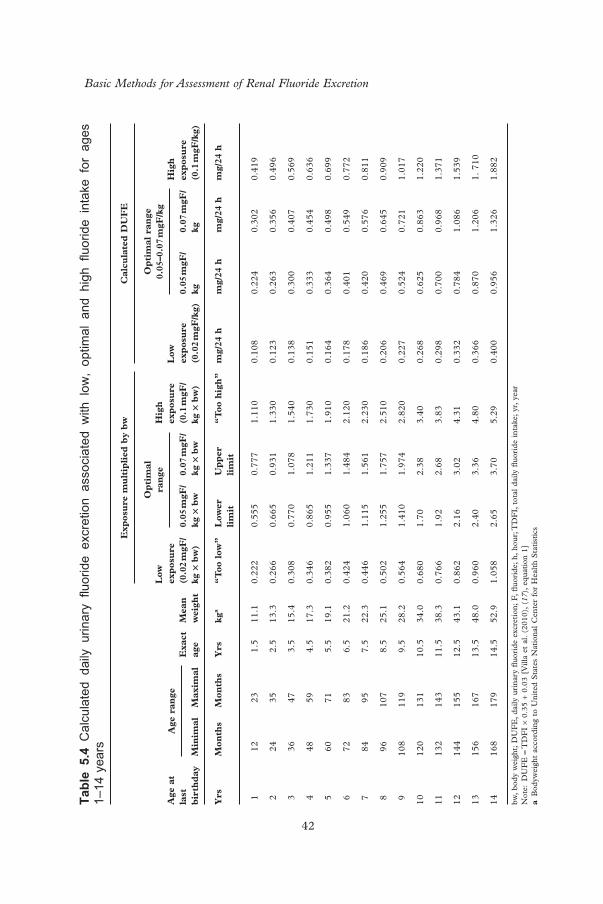
Basic Methods for Assessment of Renal Fluoride Excretion
42
Tabl
e 5.
4 C
alcu
late
d da
ily u
rinar
y fl u
orid
e ex
cret
ion
asso
ciat
ed w
ith l
ow,
optim
al a
nd h
igh
fl uor
ide
inta
ke f
or a
ges
1–14
yea
rs
Exp
osu
re m
ult
ipli
ed b
y b
wC
alcu
late
d D
UF
E
Age
at
last
b
irth
day
Age
ran
ge
Exa
ct
age
Mea
n
wei
ght
Low
ex
pos
ure
(0
.02
mgF
/kg
× b
w)
Op
tim
al
ran
geH
igh
ex
pos
ure
(0
.1 m
gF/
kg ×
bw
)
Low
ex
pos
ure
(0
.02
mgF
/kg)
Op
tim
al r
ange
0.
05–0
.07
mgF
/kg
Hig
h
exp
osu
re
(0.1
mgF
/kg)
Min
imal
Max
imal
0.05
mgF
/kg
× b
w0.
07 m
gF/
kg ×
bw
0.05
mgF
/kg
0.
07 m
gF/
kg
Yrs
Mon
ths
Mon
ths
Yrs
kg a
“T
oo l
ow”
Low
er
lim
itU
pp
er
lim
it
“T
oo h
igh
”m
g/24
hm
g/24
hm
g/24
hm
g/24
h
1 1
2 2
3 1
.511
.10.
222
0.55
50.
777
1.11
00.
108
0.22
40.
302
0.41
9
2 2
4 3
5 2
.513
.30.
266
0.66
50.
931
1.33
00.
123
0.26
30.
356
0.49
6
3 3
6 4
7 3
.515
.40.
308
0.77
01.
078
1.54
00.
138
0.30
00.
407
0.56
9
4 4
8 5
9 4
.517
.30.
346
0.86
51.
211
1.73
00.
151
0.33
30.
454
0.63
6
5 6
0 7
1 5
.519
.10.
382
0.95
51.
337
1.91
00.
164
0.36
40.
498
0.69
9
6 7
2 8
3 6
.521
.20.
424
1.06
01.
484
2.12
00.
178
0.40
10.
549
0.77
2
7 8
4 9
5 7
.522
.30.
446
1.11
51.
561
2.23
00.
186
0.42
00.
576
0.81
1
8 9
610
7 8
.525
.10.
502
1.25
51.
757
2.51
00.
206
0.46
90.
645
0.90
9
910
811
9 9
.528
.20.
564
1.41
01.
974
2.82
00.
227
0.52
40.
721
1.01
7
1012
013
110
.534
.00.
680
1.70
2.38
3.40
0.26
80.
625
0.86
31.
220
1113
214
311
.538
.30.
766
1.92
2.68
3.83
0.29
80.
700
0.96
81.
371
1214
415
512
.543
.10.
862
2.16
3.02
4.31
0.33
20.
784
1.08
61.
539
1315
616
713
.548
.00.
960
2.40
3.36
4.80
0.36
60.
870
1.20
61.
710
1416
817
914
.552
.91.
058
2.65
3.70
5.29
0.40
00.
956
1.32
61.
882
bw,
body
wei
ght;
DU
FE
, da
ily u
rina
ry fl
uor
ide
excr
etio
n; F
, fl u
orid
e; h
, ho
ur; T
DF
I, t
otal
dai
ly fl
uor
ide
inta
ke;
yr,
year
N
ote:
DU
FE
= T
DF
I ×
0.35
+ 0
.03
[Vill
a et
al.
(201
0),
( 17 )
, eq
uati
on 1
] a
Bod
ywei
ght
acco
rdin
g to
Uni
ted
Sta
tes
Nat
iona
l C
ente
r fo
r H
ealt
h S
tati
stic
s
c05.indd 42 4/10/2014 6:55:25 PM
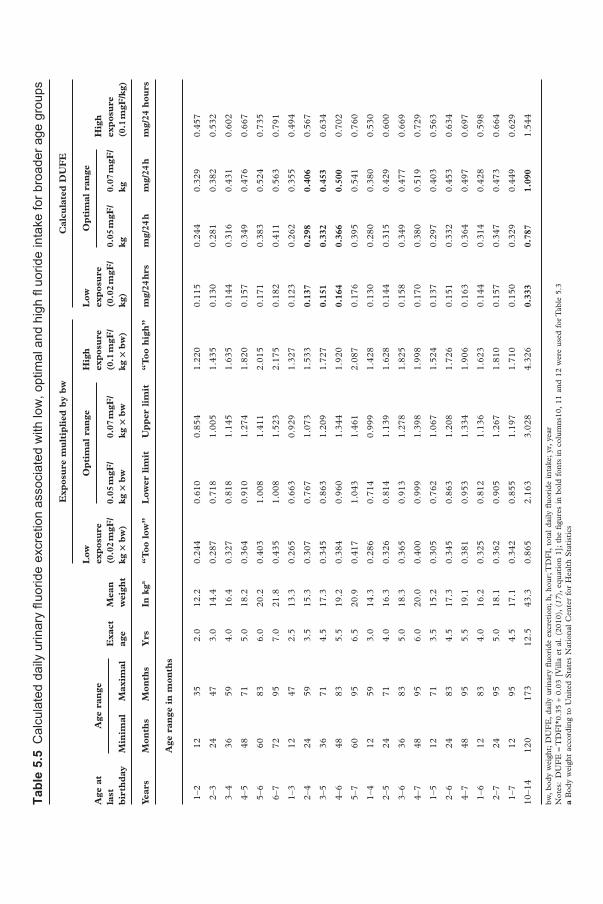
Tabl
e 5.
5 C
alcu
late
d da
ily u
rinar
y fl u
orid
e ex
cret
ion
asso
ciat
ed w
ith lo
w, o
ptim
al a
nd h
igh
fl uo
ride
inta
ke fo
r bro
ader
age
gro
ups
Exp
osu
re m
ult
ipli
ed b
y b
wC
alcu
late
d D
UF
E
Age
at
last
b
irth
day
Age
ran
ge
Exa
ct
age
Mea
n
wei
ght
Low
ex
pos
ure
(0
.02
mgF
/kg
× b
w)
Op
tim
al r
ange
Hig
h
exp
osu
re
(0.1
mgF
/kg
× b
w)
Low
ex
pos
ure
(0
.02
mgF
/kg
)
Op
tim
al r
ange
H
igh
ex
pos
ure
(0
.1 m
gF/k
g)M
inim
alM
axim
al0.
05 m
gF/
kg ×
bw
0.07
mgF
/kg
× b
w0.
05 m
gF/
kg
0.07
mgF
/kg
Year
sM
onth
sM
onth
sY
rsIn
kg a
“T
oo l
ow”
Low
er l
imit
Up
per
lim
it
“T
oo h
igh
”m
g/24
hrs
mg/
24 h
mg/
24 h
mg/
24 h
ours
Age
ran
ge i
n m
onth
s
1–2
1235
2.0
12.2
0.24
40.
610
0.85
41.
220
0.11
50.
244
0.32
90.
457
2–3
2447
3.0
14.4
0.28
70.
718
1.00
51.
435
0.13
00.
281
0.38
20.
532
3–4
3659
4.0
16.4
0.32
70.
818
1.14
51.
635
0.14
40.
316
0.43
10.
602
4–5
4871
5.0
18.2
0.36
40.
910
1.27
41.
820
0.15
70.
349
0.47
60.
667
5–6
6083
6.0
20.2
0.40
31.
008
1.41
12.
015
0.17
10.
383
0.52
40.
735
6–7
7295
7.0
21.8
0.43
51.
008
1.52
32.
175
0.18
20.
411
0.56
30.
791
1–3
1247
2.5
13.3
0.26
50.
663
0.92
91.
327
0.12
30.
262
0.35
50.
494
2–4
2459
3.5
15.3
0.30
70.
767
1.07
31.
533
0.13
7 0.
298
0.40
6 0.
567
3–5
3671
4.5
17.3
0.34
50.
863
1.20
91.
727
0.15
1 0.
332
0.45
3 0.
634
4–6
4883
5.5
19.2
0.38
40.
960
1.34
41.
920
0.16
4 0.
366
0.50
0 0.
702
5–7
6095
6.5
20.9
0.41
71.
043
1.46
12.
087
0.17
60.
395
0.54
10.
760
1–4
1259
3.0
14.3
0.28
60.
714
0.99
91.
428
0.13
00.
280
0.38
00.
530
2–5
2471
4.0
16.3
0.32
60.
814
1.13
91.
628
0.14
40.
315
0.42
90.
600
3–6
3683
5.0
18.3
0.36
50.
913
1.27
81.
825
0.15
80.
349
0.47
70.
669
4–7
4895
6.0
20.0
0.40
00.
999
1.39
81.
998
0.17
00.
380
0.51
90.
729
1–5
1271
3.5
15.2
0.30
50.
762
1.06
71.
524
0.13
70.
297
0.40
30.
563
2–6
2483
4.5
17.3
0.34
50.
863
1.20
81.
726
0.15
10.
332
0.45
30.
634
4–7
4895
5.5
19.1
0.38
10.
953
1.33
41.
906
0.16
30.
364
0.49
70.
697
1–6
1283
4.0
16.2
0.32
50.
812
1.13
61.
623
0.14
40.
314
0.42
80.
598
2–7
2495
5.0
18.1
0.36
20.
905
1.26
71.
810
0.15
70.
347
0.47
30.
664
1–7
1295
4.5
17.1
0.34
20.
855
1.19
71.
710
0.15
00.
329
0.44
90.
629
10–1
412
017
312
.543
.30.
865
2.16
33.
028
4.32
6 0.
333
0.78
7 1.
090
1.54
4
bw,
body
wei
ght;
DU
FE
, da
ily u
rina
ry fl
uor
ide
excr
etio
n; h
, ho
ur; T
DF
I, t
otal
dai
ly fl
uor
ide
inta
ke;
yr,
year
N
otes
: D
UF
E =
TD
FI*
0.35
+ 0
.03
[Vill
a et
al.
(201
0),
( 17 )
, eq
uati
on 1
]; t
he fi
gur
es i
n bo
ld f
onts
in
colu
mns
10,
11 a
nd 1
2 w
ere
used
for
Tab
le 5
.3
a B
ody
wei
ght
acco
rdin
g to
Uni
ted
Sta
tes
Nat
iona
l C
ente
r fo
r H
ealt
h S
tati
stic
s
c05.indd 43 4/10/2014 6:55:25 PM

44
6 Collections of 8–18 hours (within the 24-hour cycle)
Any urine collection must cover a period of at least 2 hours. Incomplete voiding of the bladder at the start or end of the collection period should be avoided, because it can signifi cantly affect the results. To ensure that the total urine generated during the specifi ed period is collected, the procedure involves recording the time at which the collection began and ended (in hours and minutes), and the volume of urine collected as outlined below:
• At the beginning of each collection period, ensure that the subject empties his or her bladder completely: — If this is the fi rst collection taken from the subject, discard this urine. — If this micturition is the end of a collection period, add the urine
passed at this time to the jar used to collect the previous samples from that collection period.
• Note the name of the subject and the time in box No. 1 of the respec-tive period on the label or in the record book (see Fig. 3.1).
• When the subject arrives for the next urination, give the subject the jar or container into which they are to urinate.
• Note the time of this second urination. Ensure that the jar or container is closed, and then put in a cool place (e.g. a refrigerator). If no refrig-erator is available, an insulated cooler to which ice bags or dried ice have been added can be used to keep the urine cool before it is trans-ferred to the laboratory. Handle the next and any subsequent urination in the same pre-set collection period in an identical manner.
Towards the end of the supervised pre-set collection period, ask the subject to urinate into the jar. The time when this takes place marks the end of the subject ’ s personal period.
• Measure the total volume of urine collected during this period using a graduated plastic cylinder 250 mL capacity (or cylinders of 100 or 500 mL capacity can be used, if available), and note the volume on the label and in the record book.
c06.indd 44 4/10/2014 6:55:26 PM
Collections of 8–18 hours (within the 24-hour cycle)
45
At this point, the base information available from each subject is:
• time point of initial voiding of the bladder; • time point of last urine collection into the container (jar or bottle); and • total volume of urine collected between initial and fi nal time points.
For the purpose of analysis, take a 15–25 mL sample of urine from each jar into in a small tube. If possible, take additional aliquots as a safeguard against loss of urine. Store the tubes in a container containing ice for transfer to the laboratory. If fl uoride determination cannot be conducted immediately, place tubes in a freezer at –18°C or in a refrigerator, if no freezer are available. Ensure that all tubes are labelled with a reference number that identifi es the individual from whom the sample came, and the time period in which the sample was collected. It is good practice to colour code the collection periods (A, B, C or D), mark each tube with the subject ID number using the fi ne-point permanent ink marker, and also identify the location of the collection.
Wherever possible, obtain a night collection and two supervised day col-lections. Typically, a night collection in children is obtained under parental supervision and covers 8–10 hours. The two daytime collections are made under supervision of teachers, and one or two members of the project team. Each daytime collection should last about 3–5 hours. In this way, a total of 14–18 hours of the entire 24-hour cycle will be covered. As noted above, in some countries it may only be possible to obtain a morning and a nocturnal collection; these would total 12–15 hours.
6.1 Collection of nocturnal urine and during periods of high excretion
A specifi c jar with a capacity of 750–800 mL is used for a nocturnal collection; with children, this collection is made under parental supervision. A sample label for a nocturnal collection is depicted in Fig. 3.2. Instruct parents to note the time at which the child urinates before going to bed, or the adult partici-pant to note the time at which he/she urinated before going to bed, and advise them not to collect that urine in the jar. If the child or adult participant needs to urinate during the night he or she should use the jar. When the jar is brought in the next morning, measure the volume of urine and record it both on the label and in the record book. In adults, cooperation may sometimes be diffi cult to obtain. In cases of doubt, it may be advisable to choose another person.
The summary data can be entered in the form prepared for this purpose (Fig. 3.3) and in the record book. A spreadsheet created using Microsoft (MS) Excel software can be used for entering data and calculating results (Tables 7.6 and 7.7). These data are entered in columns 12–14, 22–24 and 32–34, and are used to in calculating fl uoride excretion per time.
c06.indd 45 4/10/2014 6:55:26 PM
Basic Methods for Assessment of Renal Fluoride Excretion
46
Generally, fl uoride excretion is highest 1–2 hours after the main cooked meal, and lowest during the night; morning urine is also low in fl uoride. Accordingly, the two columns to the left in Table 7.3 show the lower and upper margins for high excretion periods (e.g. after intake of fl uoridated milk, meals prepared with fl uoridated salt, or consumption of high-fl uoride mineral water or some other fl uoride source). The two columns to the right in Table 7.3 show the lower and upper margins for urine not preceded – for at least 3 hours – by signifi cant fl uoride intake.
6.2 Optional calculations obtained from time-controlled urine collection – Use of a standardized format
The question whether or not urinary fl uoride excretion in a given population is at the desired level can be answered by straightforward evaluation of 24-hour urine collections. The calculations are simple, but it is vital to record all factors that may affect individual and group outcomes. This method has been carried over from the fi rst edition of the manual on monitoring of renal fl uoride excre-tion ( 11 ) , and is intended to assist those interested in obtaining a more com-prehensive evaluation of results of renal fl uoride excretion using MS Excel (Sections 1.0–3.2.1 of this document apply).
A standard format is presented in Table 7.6 (see Section 7.1), to illustrate the recording and evaluation of fi eld and laboratory data. This format was developed and extensively tested under various working conditions. Sources of data on fl uoride intake or exposure should be entered in rows 1 and 2 of the spreadsheet. A simple coding system should be designed to facilitate data entry (see Section 6.2.1 below). For direct comparison with other data, two columns with 24-hour results shown on a per-hour basis have been included (columns 21 and 22).
Some general rules must be followed for appropriate processing of data using the standard format described above. Following such rules will make it easier to process the data, and will thus help to reduce errors and frustration. Data are entered as hours and minutes – using no commas, full stops or colons (e.g. 715 and 630); and midnight must be recorded as 2400 rather than 0000, because any value equal to 0 in any of the columns 11–14 renders the data for a collection invalid.
Precision in recording time is essential. In 24-hour collections, time should be recorded to the nearest quarter of an hour (15 minutes); in shorter collec-tions, it should be recorded to the nearest 5 minutes or 1 minute. Entries must be in the format “hhmm” (i.e. with no decimal point) for the time of initial voiding and fi nal collection. Volume of urine should be determined to the nearest 5 mL in 24-hour collections, but to the nearest 2 mL in shorter
c06.indd 46 4/10/2014 6:55:26 PM

Collections of 8–18 hours (within the 24-hour cycle)
47
collection periods. Measuring cylinders for up to 250 mL usually have 2 mL divisions; whereas those for up to 500 mL have 5 mL divisions.
Fluoride concentrations should be recorded with two digits after the decimal point (e.g. 0.65 ppm). In the case of low concentrations, three decimal places may be provided by the laboratory. Figures that include three decimal places (e.g. 0.095 ppm) should not be rounded up. The computed values (columns 15 and above) are calculated by the computer using at least six decimals (fl oating point operations). The format of the depicted values is specifi ed in the programmed part of the tables and does not alter the high precision of the calculations.
6.2.1 Coded recordings of personal data and individual fl uoride exposure
In Tables 7.6–7.8, the titles and column headings are self-explanatory (these occupy rows 1–9 in the MS Excel spreadsheet). Column numbers are given below the headings (in row 10). Data for the fi rst subject are then recorded in row 11, for the second subject in row 12, and so on. Thus, if a study involves 37 subjects, data for the last subject will occupy row 47. In MS Excel, the rows are numbered, making it easier to check the data in studies involving large numbers of subjects. Columns are used in a similarly system-atic manner; with columns 1–10 reserved for personal information (see Section 3.1.2).
Column 1 The subject ID number (not necessarily in strict sequential order, unless the investigator has rearranged the spreadsheet to cross-reference with the code number; this extra step is not recommended because it is un -necessary, and creates room for errors).
Column 2 Gender (male = 1 and female = 2) Column 3 Age in years at last birthday Column 4 Body weight in kilograms Columns 5–10 Coded data on individual fl uoride intake or fl uoride
exposure, and other relevant information Column 5 Use of fl uoridated milk or salt: No = 0; Yes = 1 Column 6 Use of fl uoride-containing toothpaste: Never = 0;
Sometimes = 1; Once a day = 1; At least twice a day = 3 Column 7 Amount of toothpaste used by child: Small pea size = 1;
Half of the toothbrush length = 2; Entire length of the toothbrush = 3
Column 8 Who places the toothpaste on the child ’ s toothbrush: The child = 1; The mother or another relative = 2
Column 9 Does the mother or an adult person supervise the child during tooth brushing? Yes = 1; No = 2
c06.indd 47 4/10/2014 6:55:26 PM
Basic Methods for Assessment of Renal Fluoride Excretion
48
Column 10 Use of prescribed or over-the-counter fl uoride sup-plements: Never = 0; Sometimes = 1; Daily = 2
Column 11 Repeats Column 1, and pertains to the block of columns 11–20
6.2.2 Standard table for surveys with 24-hour collections
It is important to take into consideration the format to be used for entering time data. As explained in Section 6.2.1, the time of day at which the collec-tion is initiated and the time at which it ends is expressed in hours and minutes using no commas, full stops or colons. The duration of the collection is expressed in hours and decimals hours; conversion to this format is essential for subsequent arithmetic procedures. Because it is diffi cult to obtain an exact 24-hour collection, a correction factor is calculated, and is then used to obtain the corrected 24-hour urinary volume and fl uoride excretion (see Section 4.5).
In Table 7.6, fi eld and laboratory data (i.e. data at the beginning and end of the collection period, urine volume and fl uoride concentration) are entered in columns 12–15:
Column 12 Time at the start of urine collection (hhmm); that is, the time at which the subject emptied his or her bladder (this urine is not time-controlled, and is therefore dis-carded unless it pertains to and terminates a preceding collection)
Column 13 Time of fi nal micturition into the container Column 14 Volume (mL) of urine Column 15 Fluoride concentration (ppm)
The data that must be entered into the table are shown in italics, and contained within two frames (covering columns 1–10 and 12–15). As an example, Table 7.6 has been completed for six subjects to illustrate how the table should be used.
Results computed from the fi eld and laboratory data in columns 12–15 are presented in columns 16–24:
Column 16 Duration in hh. decimals of the collection; thus, for subject 1 in the example, duration is 23.25 hours (i.e. 23 hours 15 minutes)
Column 17 Quantity (in μ g) of fl uoride in the urine collection, obtained by multiplying the value in column 14 by that in column 15; thus, for subject 4 in the example, the quantity of fl uoride is 600 × 0.4 = 240
c06.indd 48 4/10/2014 6:55:26 PM

Collections of 8–18 hours (within the 24-hour cycle)
49
Column 18 Correction factor to yield exact 24-hour values, obtained by dividing 24 by the duration of collection (Column 16); thus, for subject 4 in the example, the factor is 24/24.67 = 0.973
Column 19 Corrected 24-hour urinary volume in mL, obtained by multiplying the volume collected (column 14) by the correction factor (column 18); thus, for subject 2 in the example, who collected 710 mL of urine, the corrected volume is 710 × 0.973 = 691 mL
Column 20 Corrected 24-hour fl uoride excretion (in μ g), obtained by multiplying the quantity of fl uoride in the urine actually collected (column 17) by the correction factor (column 18); thus, for subject 2 in the example, the corrected fl uoride excretion is 256 μ g × 0.973 = 249 μ g
Column 21 Urinary fl ow in mL/hour, obtained by dividing the value in column 19 – corrected 24-hour urinary volume in mL – by 24
Column 22 Hourly urinary fl uoride excretion, obtained by dividing the value in column 20 – corrected 24-hour fl uoride excretion (in μ g) – by 24; hourly values are useful for comparison with results of studies limited to certain parts of the 24-hour period
Column 23 24-hour urinary volume per kilogram body weight, obtained by dividing the value in column 19 by that entered in column 4 (i.e. subject weight in kg)
Column 24 24-hour urinary fl uoride excretion per kilogram body weight, obtained by dividing the value in column 20 – corrected 24-hour fl uoride excretion in μ g – by that entered in column 4 (subject weight in kg)
Basic statistics are displayed automatically below each column that shows data for individual subjects. Minimum and maximum values are given, and must always be examined to identify “outliers”, which may result from mis-reporting or methodological errors (see Section 6.2.6). Median values and arithmetic mean values are also given; median values are generally slightly lower than the mean values because it is quite common for very high values to be obtained from a few individuals, resulting in a skewed distribution. Values for SD, CV and standard error are also presented.
In studies of circadian variations, it may be convenient to collect and sepa-rately analyse 24-hour urine in two (day and night), three or even four separate periods. In such cases, Table 7.6 cannot be used. These data are more com-plicated to handle; the amount of fl uoride in the collection, for instance, must be computed for each time period rather than being averaged over the periods.
c06.indd 49 4/10/2014 6:55:26 PM

Basic Methods for Assessment of Renal Fluoride Excretion
50
Tables are available for use with these data, using the same format shown in columns 1–10, 12–15, 22–25, etc. (see Section 6.2).
6.2.3 Standard table for surveys with two collections totalling 14–16 hours, using MS Excel
As in Table 7.6, columns 1–10 of Table 7.7 are reserved for personal data and codes relating to individual fl uoride exposure, and column 11 repeats the subject number. For the fi rst collection period , columns 12–15 are again used for recording fi eld and laboratory data, with the same use of italics and boxes as in Table 7.6. In the example given, except for two children, the fi rst collec-tion took place during the night; results for this period are given in columns 16–20.
Column 16 Validity code. If the initial time, the fi nal time, the volume and the fl uoride concentration of the collection (columns 12–15) are available, the code 1 – “valid” – appears in column 16. If one or more of these values are missing, the code in column 16 is 0, indicating an “unsuccessful” collection. Missing data could be due to the initial or fi nal time of the collection (or both) being missing, the collected urine being lost, or the fl uoride concentration being unavailable. As noted above, mid-night must be recorded as 2400, not as 0000, because any value equal to 0 in any of the columns 12–15 renders the data for a collection invalid. Whenever the code in column 16 is 0, an “ x ” is automatically assigned to columns 17–20.
Column 17 Time of initial voiding (column 12). This is recorded only for those children whose urine collection was suc-cessful. The median time at the start of the collections is important when comparing fl uoride excretion with a distinct time point of fl uoride, as in Table 7.3.
Column 18 Duration of collection, expressed in hours and decimals (hh.dec). The underlying formula automatically takes into account the special situation of collections extending past midnight; when the initial time of a collection is a larger fi gure – for example, if the collection ran from 2200 (i.e. 10 pm) to 0700 (i.e. 7 am) – then 24 hours are automatically added to the fi nal time; this gives the correct duration, which in the case of this example would be 9 hours.
c06.indd 50 4/10/2014 6:55:26 PM
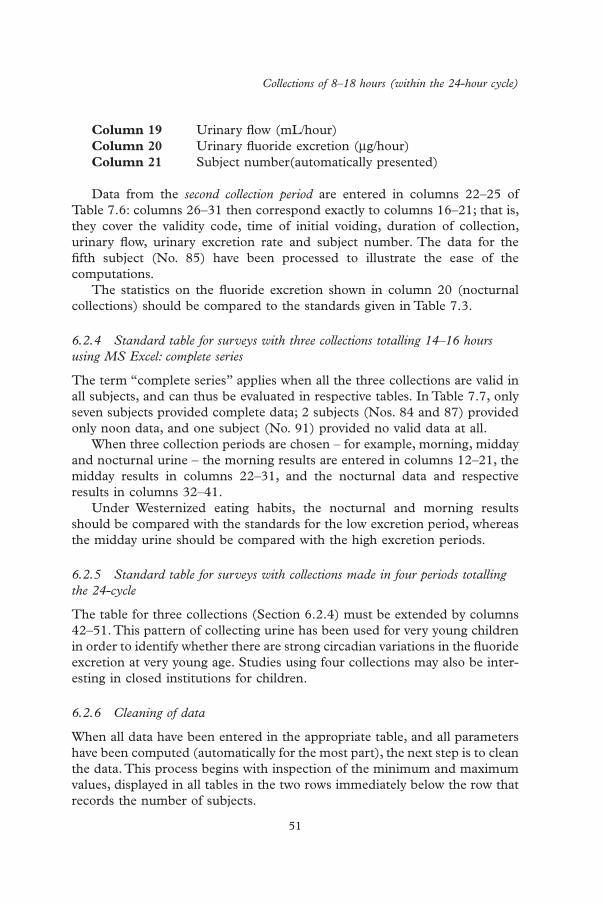
Collections of 8–18 hours (within the 24-hour cycle)
51
Data from the second collection period are entered in columns 22–25 of Table 7.6: columns 26–31 then correspond exactly to columns 16–21; that is, they cover the validity code, time of initial voiding, duration of collection, urinary fl ow, urinary excretion rate and subject number. The data for the fi fth subject (No. 85) have been processed to illustrate the ease of the computations.
The statistics on the fl uoride excretion shown in column 20 (nocturnal collections) should be compared to the standards given in Table 7.3.
6.2.4 Standard table for surveys with three collections totalling 14–16 hours using MS Excel: complete series
The term “complete series” applies when all the three collections are valid in all subjects, and can thus be evaluated in respective tables. In Table 7.7, only seven subjects provided complete data; 2 subjects (Nos. 84 and 87) provided only noon data, and one subject (No. 91) provided no valid data at all.
When three collection periods are chosen – for example, morning, midday and nocturnal urine – the morning results are entered in columns 12–21, the midday results in columns 22–31, and the nocturnal data and respective results in columns 32–41.
Under Westernized eating habits, the nocturnal and morning results should be compared with the standards for the low excretion period, whereas the midday urine should be compared with the high excretion periods.
6.2.5 Standard table for surveys with collections made in four periods totalling the 24-cycle
The table for three collections (Section 6.2.4) must be extended by columns 42–51. This pattern of collecting urine has been used for very young children in order to identify whether there are strong circadian variations in the fl uoride excretion at very young age. Studies using four collections may also be inter-esting in closed institutions for children.
6.2.6 Cleaning of data
When all data have been entered in the appropriate table, and all parameters have been computed (automatically for the most part), the next step is to clean the data. This process begins with inspection of the minimum and maximum values, displayed in all tables in the two rows immediately below the row that records the number of subjects.
Column 19 Urinary fl ow (mL/hour) Column 20 Urinary fl uoride excretion ( μ g/hour) Column 21 Subject number(automatically presented)
c06.indd 51 4/10/2014 6:55:26 PM

Basic Methods for Assessment of Renal Fluoride Excretion
52
In surveys where collections are for 14–16 hours or 8 hours, data cleaning must be done carefully, and additional criteria may need to be established. For instance, the protocol may require that, for nocturnal urine collection in children, the last urine before sleep must be passed between 19.00 and mid-night, and the fi rst morning urine between 05.00 and 09.00. Thus, if a noc-turnal collection starts at 18.30, for example, it would be excluded according to these limits. However, in some societies, children (particularly those aged over 4–5 years) may not go to bed so early, so their last micturition before going to bed may occur, for example, at 21.00. Similarly, these children may get up in the morning at 6.00 or 6.30, and their fi rst urination time would constitute the end of the nocturnal collection. Any such criteria for data clean-ing must be adapted to the local customs and circumstances; these should be established during the planning stage and clearly stated in the protocol.
The minimum and maximum values shown just below the number of subjects immediately reveal “suspect” data or values that are obviously outside expected limits. Suggested limits for urinary fl ow, fl uoride excretion rate and fl uoride concentration are given in Table 7.2. When there are suspect results, the subject should be identifi ed and the original record examined to determine whether there was a typing error, or whether something went wrong with the collection or the laboratory analysis. Only typing mistakes and obvious gross errors should be corrected in the original data table; other suspect data should be left unchanged, and no further changes should be made to this original data table. However, a copy – the “clean data table” – should be made on which suspect or doubtful data in columns 11–24, 21–24 and so on (i.e. the results that deviate signifi cantly from normal or expected values) can be “cleaned”. Although incomplete voiding of the bladder has no infl uence on concentrations, time-controlled samples are susceptible to incomplete voiding at the beginning and at the end of the collection period; this is the principal source of “outliers” with very high or very low urinary fl ow.
Cleaning of outliers must be done cautiously, and should be restricted to results that are obviously incompatible with the rest of the data. If a decision is made to exclude a particular set of results, only the initial time is to be deleted; entries in columns 15–19, 25–29 and so on will then automatically be changed to an “x”. The effect of such exclusion is easy to check by com-paring statistics based on the uncleaned data (in the original data table) with those based on the cleaned data (in the clean data table) Clearly, maximum and minimum values will change when outliers are excluded, but averages and medians should change very little. SD values may decrease appreciably as a result of exclusions.
In studies in which three collection series have been planned, provided that more than 80% of the children still have three valid collections in the clean data table, data for the children who provided complete collections may be transferred to a table designated for children with all three collections. By
c06.indd 52 4/10/2014 6:55:26 PM
Collections of 8–18 hours (within the 24-hour cycle)
53
doing this, data for any children who provided incomplete collections are disregarded.
6.3 Extrapolations
As noted under Section 2.4.1, in some highly industrialized and in some developing countries it is not feasible to undertake collections lasting 24 hours. In these circumstances, supervised urine collection can only be taken, for instance, during the morning and the afternoon or evening, or during the morning and during nocturnal periods. However, this can give a total of 16 hours, which would mean excretion was measured during two thirds of the cycle (i.e. 16/24 hours). If one collection is timed to occur during maximal fl uoride excretion and the other during low excretion (usually the nocturnal urine), then it is tempting to extrapolate from the 16-hour results to 24-hour results. Two published studies have used a simple method for such extrapola-tions ( 43, 47 ) . Although the results of these studies looked “reasonable”, more research is needed in this fi eld, and it is best at this time to compare the observed results in the various collection periods with the standards given in Table 5.4.
c06.indd 53 4/10/2014 6:55:26 PM
54
7 Design of the fi nal report for time-controlled urinary collections
The suggestions given in Section 5 for preparing a fi nal report for surveys with a 24-hour collection should be considered when developing reports for surveys of a shorter duration. When the 24-hour period is subdivided, the results should be presented separately for the defi ned periods of the 24-hour cycle [e.g. see ( 57 ) ]. The results should be presented in detail, and in a way that allows the reader to follow the calculations. For 24-hour collections, Table 7.6 presents a base table using MS Excel; such a table may be placed in an annex to the report. Table 7.7 shows an appropriate MS Excel table for studies using a nocturnal and a daytime collection; again, this table may be placed in an annex. Table 7.8 presents a dataset example and MS Excel computing table showing calculations of fl uoride excretion of children providing morning, afternoon and nocturnal collections. Tables of this kind are the important outcome of timed urinary fl uoride excretion studies.
Table 7.3 provides standards for urinary fl uoride excretion in micrograms of fl uoride per hour, which are applicable to timed collections during the 2–4 hours after the main meal, and for night and morning urinary collections. Table 7.4 provides standards for urinary fl uoride concentration for communi-ties with low fl uoride intake and those with optimal fl uoride intake. Table 7 displays the calculation of parameters using simple numerical operations.
c07.indd 54 4/10/2014 6:55:31 PM
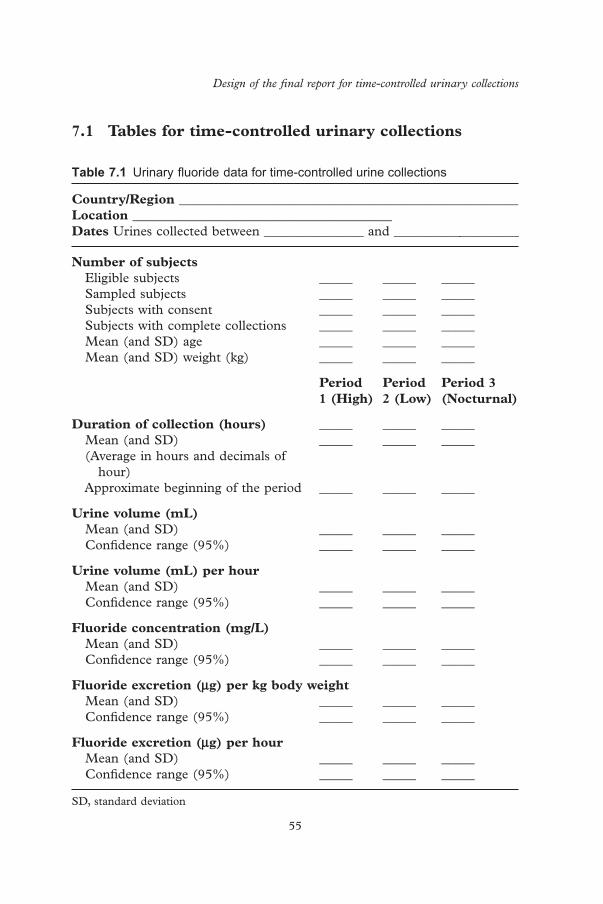
Design of the fi nal report for time-controlled urinary collections
55
Table 7.1 Urinary fl uoride data for time-controlled urine collections
Country/Region ___________________________________________________ Location _______________________________________ Dates Urines collected between _______________ and ___________________
Number of subjects Eligible subjects _____ _____ _____ Sampled subjects _____ _____ _____ Subjects with consent _____ _____ _____ Subjects with complete collections _____ _____ _____ Mean (and SD) age _____ _____ _____ Mean (and SD) weight (kg) _____ _____ _____
Period 1 (High)
Period 2 (Low)
Period 3 (Nocturnal)
Duration of collection (hours) _____ _____ _____ Mean (and SD) _____ _____ _____ (Average in hours and decimals of
hour) Approximate beginning of the period _____ _____ _____
Urine volume (mL) Mean (and SD) _____ _____ _____ Confi dence range (95%) _____ _____ _____
Urine volume (mL) per hour Mean (and SD) _____ _____ _____ Confi dence range (95%) _____ _____ _____
Fluoride concentration (mg/L) Mean (and SD) _____ _____ _____ Confi dence range (95%) _____ _____ _____
Fluoride excretion ( μ g) per kg body weight Mean (and SD) _____ _____ _____ Confi dence range (95%) _____ _____ _____
Fluoride excretion ( μ g) per hour Mean (and SD) _____ _____ _____ Confi dence range (95%) _____ _____ _____
SD, standard deviation
7.1 Tables for time-controlled urinary collections
c07.indd 55 4/10/2014 6:55:31 PM

Basic Methods for Assessment of Renal Fluoride Excretion
56
Table 7.2 Criteria for cleaning data from children aged 2–6 years, from time-controlled urine collections a
Initiation and ending of urine collection periods Morning urine collection First urine must be collected between 05:00 and 09:00
Nocturnal urine collection Last urine before sleep must be passed between 19.00 and midnight
Lower limits Upper limits
Urinary fl ow Age 2–4 years (mL/hour) 5 _____Age 4–6 years (mL/hour) 7 _____Age 2–4 years (mL/24 hours) 140 _____Age 4–6 years (mL/24 hours) 200 _____
Urinary fl uoride excretion Age 2–4 years ( μ g/hour) 2 180Age 4–6 years ( μ g /hour) 3 300Age 2–4 years (mg/24 hours) 0.12 4Age 4–6 years (mg/24 hours) 0.20 7
Urinary fl uoride concentration All ages mg/L (ppm) 0.08 5
Note: Although incomplete voiding of the bladder has no infl uence on concentrations, time-controlled samples are susceptible to incomplete voiding at the beginning and at the end of the collection period; this is the principal source of “outliers” with very high or very low urinary fl ow Note for the printer: μ g/hour means: micrograms/hour a Fluoride data from Bulgaria (mainly for low fl uoride limits); England; Islamic Republic of Iran (mainly for high fl uoride limits); Sri Lanka and Switzerland
c07.indd 56 4/10/2014 6:55:31 PM
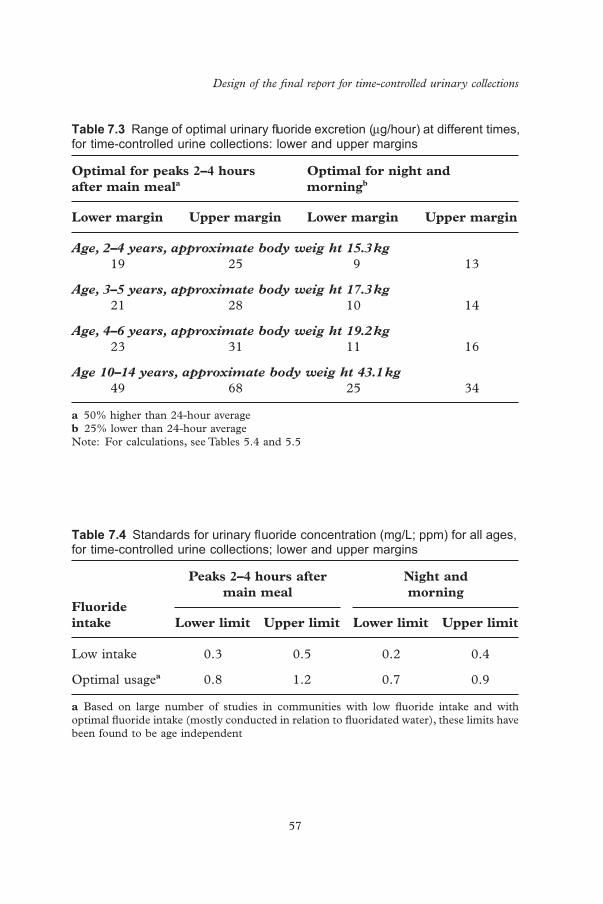
Design of the fi nal report for time-controlled urinary collections
57
Table 7.3 Range of optimal urinary fl uoride excretion ( μ g/hour) at different times, for time-controlled urine collections: lower and upper margins
Optimal for peaks 2–4 hours after main meal a
Optimal for night and morning b
Lower margin Upper margin Lower margin Upper margin
Age, 2–4 years, approximate body weig ht 15.3 kg 19 25 9 13
Age, 3–5 years, approximate body weig ht 17.3 kg 21 28 10 14
Age, 4–6 years, approximate body weig ht 19.2 kg 23 31 11 16
Age 10–14 years, approximate body weig ht 43.1 kg 49 68 25 34
a 50% higher than 24-hour average b 25% lower than 24-hour average Note: For calculations, see Tables 5.4 and 5.5
Table 7.4 Standards for urinary fl uoride concentration (mg/L; ppm) for all ages, for time-controlled urine collections; lower and upper margins
Fluoride intake
Peaks 2–4 hours after main meal
Night and morning
Lower limit Upper limit Lower limit Upper limit
Low intake 0.3 0.5 0.2 0.4
Optimal usage a 0.8 1.2 0.7 0.9
a Based on large number of studies in communities with low fl uoride intake and with optimal fl uoride intake (mostly conducted in relation to fl uoridated water), these limits have been found to be age independent
c07.indd 57 4/10/2014 6:55:31 PM

Basic Methods for Assessment of Renal Fluoride Excretion
58
Tabl
e 7.
5 C
alcu
latio
n of
par
amet
ers
usin
g si
mpl
e nu
mer
ical
ope
ratio
ns
Rel
evan
t p
art
of S
ecti
on 4
.5
Du
rati
on o
f co
llec
tion
in
h
ours
an
d
dec
imal
s of
h
our a
Cor
rect
ion
fo
r u
rin
e co
llec
tion
la
stin
g < 2
4 h
ours
b
Cor
rect
ed
volu
me
(mL
)
Qu
anti
ty o
f fl
uor
ide
in
uri
ne
coll
ecti
on
( μ g)
Uri
ne
volu
me
(mL
/kgb
w/d
ay)
Flu
orid
e (i
μ g/k
g/bw
/day
) c
AB
BC
D(a
)D
(b)
Op
erat
ion
T
ime
at e
nd
of c
olle
ctio
n m
inus
tim
e at
beg
inni
ng
of c
olle
ctio
n
Act
ual
dura
tion
of
colle
ctio
n,
divi
ded
by 2
4
Rec
orde
d vo
lum
e of
uri
ne (
in m
L)
mul
tipl
ied
by t
he
corr
ecti
on f
acto
r fo
r th
at s
ubje
ct
Vol
ume
of
urin
e (i
n m
L)
mul
tipl
ied
by fl
uor
ide
conc
entr
atio
n (i
n μ g
/mL
; pp
m)
Vol
ume
of
urin
e (i
n m
L)
in 2
4 ho
urs
(B)
divi
ded
by t
he
wei
ght
of t
he
child
(in
kg)
Qua
ntit
y of
fl u
orid
e ex
cret
ed
(in
μ g)
[C]
divi
ded
by t
he
wei
ght
of t
he
child
(in
kg)
bw,
body
wei
ght;
ppm
, pa
rts
per
mill
ion
a M
inut
es a
re m
ulti
plie
d by
0.0
1667
to
conv
ert
to d
ecim
als
of o
ne h
our
b A
cor
rect
ion
fact
or i
s us
ed w
hen
the
urin
e co
llect
ion
did
not
last
exa
ctly
24
hour
s c
Cal
cula
tion
s ar
e ca
rrie
d ou
t fo
r ea
ch c
hild
c07.indd 58 4/10/2014 6:55:31 PM
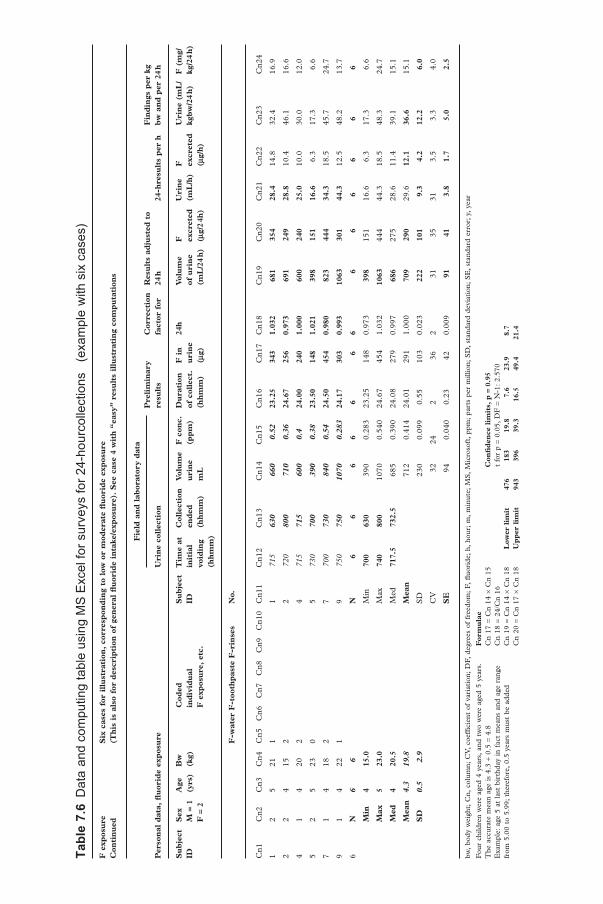
Tabl
e 7.
6 D
ata
and
com
putin
g ta
ble
usin
g M
S E
xcel
for s
urve
ys fo
r 24-
hour
colle
ctio
ns
(exa
mpl
e w
ith s
ix c
ases
) F
exp
osu
re
Con
tin
ued
Six
cas
es f
or i
llu
stra
tion
, co
rres
pon
din
g to
low
or
mod
erat
e fl
uor
ide
exp
osu
re
(Th
is i
s al
so f
or d
escr
ipti
on o
f ge
ner
al fl
uor
ide
inta
ke/e
xpos
ure
). S
ee c
ase
4 w
ith
“ea
sy”
resu
lts
illu
stra
tin
g co
mp
uta
tion
s
Per
son
al d
ata,
fl u
orid
e ex
pos
ure
Fie
ld a
nd
lab
orat
ory
dat
aP
reli
min
ary
resu
lts
Cor
rect
ion
fa
ctor
for
R
esu
lts
adju
sted
to
24 h
24-h
resu
lts
per
hF
ind
ings
per
kg
bw
an
d p
er 2
4 h
Uri
ne
coll
ecti
on
Su
bje
ct
IDS
ex
M =
1
F =
2
Age
(y
rs)
Bw
(k
g)C
oded
in
div
idu
al
F e
xpos
ure
, et
c.
Su
bje
ct
IDT
ime
at
init
ial
void
ing
(hh
mm
)
Col
lect
ion
en
ded
(h
hm
m)
Vol
um
e u
rin
e m
L
F c
onc.
(p
pm
)D
ura
tion
of
col
lect
. (h
hm
m)
F i
n
uri
ne
( μ g)
24h
Vol
um
e of
uri
ne
(mL
/24
h)
F
excr
eted
( μ
g/2
4h)
Uri
ne
(mL
/h)
F
excr
eted
( μ
g/h
)
Uri
ne
(mL
/kg
bw
/24
h)
F (
mg/
kg/2
4 h
)
F-w
ater
F-t
ooth
pas
te F
-rin
ses
No.
Cn1
Cn2
Cn3
Cn4
Cn5
Cn6
Cn7
Cn8
Cn9
Cn1
0C
n11
Cn1
2C
n13
Cn1
4C
n15
Cn1
6C
n17
Cn1
8C
n19
Cn2
0C
n21
Cn2
2C
n23
Cn2
4
12
521
11
715
630
660
0.52
23
.25
343
1.03
2 68
1 35
4 28
.4
14.8
32.4
16.9
22
415
22
720
800
710
0.36
24
.67
256
0.97
3 69
1 24
9 28
.8
10.4
46.1
16.6
41
420
24
715
715
600
0.4
24.0
0 24
0 1.
000
600
240
25.0
10
.030
.012
.0
52
523
05
730
700
390
0.38
23
.50
148
1.02
1 39
8 15
1 16
.6
6.3
17.3
6.6
71
418
27
700
730
840
0.54
24
.50
454
0.98
0 82
3 44
4 34
.3
18.5
45.7
24.7
91
422
19
750
750
1070
0.
283
24.1
7 30
3 0.
993
1063
30
1 44
.3
12.5
48.2
13.7
6 N
6
6 N
6
6 6
6 6
6 6
6 6
6 6
6 6
Min
4
15.0
M
in 70
0 63
0 39
00.
283
23.2
514
80.
973
398
151
16.6
6.3
17.3
6.6
Max
5
23.0
M
ax 74
0 80
0 10
700.
540
24.6
745
41.
032
1063
44
444
.318
.548
.324
.7
Med
4
20.5
M
ed 71
7.5
732.
5 68
50.
390
24.0
827
90.
997
686
275
28.6
11.4
39.1
15.1
Mea
n
4.3
19.8
M
ean
71
20.
414
24.0
129
11.
000
709
290
29.6
12.1
36
.6
15.1
SD
0.
5 2.
9 S
D23
00.
099
0.55
103
0.02
3 22
2 10
1 9.
3 4.
2 12
.2
6.0
CV
3224
236
231
3531
3.5
3.3
4.0
SE
94
0.04
00.
2342
0.00
9 91
41
3.
8 1.
7 5.
0 2.
5
bw,
body
wei
ght;
Cn,
col
umn;
CV
, co
effi c
ient
of
vari
atio
n; D
F,
degr
ees
of f
reed
om;
F,
fl uor
ide;
h,
hour
; m
, m
inut
e; M
S,
Mic
roso
ft,
ppm
; pa
rts
per
mill
ion;
SD
, st
anda
rd d
evia
tion
; S
E,
stan
dard
err
or;
y, y
ear
Fou
r ch
ildre
n w
ere
aged
4 y
ears
, an
d tw
o w
ere
aged
5 y
ears
. T
he a
ccur
ate
mea
n ag
e is
4.3
+ 0
.5 =
4.8
E
xam
ple:
age
5 a
t la
st b
irth
day
in f
act
mea
ns a
nd a
ge r
ange
fr
om 5
.00
to 5
.99;
the
refo
re,
0.5
year
s m
ust
be a
dded
For
mu
lae
C
n 17
= C
n 14
× C
n 15
C
n 18
= 2
4/C
n 16
C
n 19
= C
n 14
× C
n 18
C
n 20
= C
n 17
× C
n 18
Con
fi d
ence
lim
its,
p =
0.9
5
t fo
r p
= 0.
05,
DF
= N
-1:
2.57
0 L
ower
lim
it
476
183
19.8
7.
6 23
.9
8.7
Up
per
lim
it
943
396
39.3
16
.5
49.4
21
.4
c07.indd 59 4/10/2014 6:55:31 PM

Basic Methods for Assessment of Renal Fluoride Excretion
60
Table 7.7 Dataset example and MS Excel computing table showing calculations of fl uoride excretion of children providing nocturnal and noon urine collections Enter source of data and a summary of fl uoride exposure here
Enter source of data here (example of 10 subjects for illustration; No. 85 with “easy” data) and case 91 zero valid collections
Personal data Night
Sub ject ID No.
Sex M = 1 F = 2
Age (yrs)
Bw (kg)
Sub ject No.
Field and laboratory data Valid “ = 1”
Valid time at initial void Ing(hhmm)
Duration of collection hh.dec
Results per h
Time at initial voiding (hhmm)
Collec-tion ended (hhmm)
Urine volume (mL)
F conc (ppm)
Urine fl ow (mL/h)
F excr. ( μ g/h)
Sub ject No.
Cn1 Cn2 Cn3 Cn4 Cn11 Cn12 Cn13 Cn14 Cn15 Cn16 Cn17 Cn18 Cn19 Cn20 Cn21
81 1 3.7 15 81 1830 720 300 1.06 1 1830 12.83 23.4 24.8 81
82 1 3.4 82 1600 705 150 1.59 1 1600 15.08 9.9 15.8 82
83 1 5 17 83 2400 930 220 0.533 1 2400 9.50 23.2 12.3 83
84 1 4 16 84 200 1.29 0 x x x x 84
85 1 3.3 16 85 2040 640 240 0.5 1 2040 10.00 24.0 12.0 85
87 1 5 18 87 320 1.85 0 x x x x 87
88 2 3.6 16 88 2040 700 300 0.53 1 2040 10.33 29.0 15.4 88
91 1 5 20 91 2000 0 x x x x 91
89 1 3.6 17 89 1910 715 200 1.1 1 1910 12.08 16.6 18.2 89
90 2 3.8 15 90 1400 2100 300 0.766 1 1400 7.00 42.9 32.8 90
10 N 10 9 N 8 7 9 9 7 7 7 7 7 N
Min 3 15 Min 1400 640 150.0 0.500 1400 7.0 9.9 12.0 Min
Max 5 20 Max 2400 2100 320.0 1.85 2400 15.1 42.9 32.8 Max
Median 4 16 Median 1955 715 240.0 1.060 1910 10.3 23.4 15.8 Median
Mean 4.0 16.6 Mean 247.8 1.024 11.0 24.1 18.8 Mean
SD 0.7 1.6 SD 0.488 2.6 10.3 7.5 SD
If age only in integers: CV 48 24 43 40 CV
Raw mean age
Plus 0.5: 4.5 CV = 100 × SD/Mean
Time of voiding the bladder: between 0001 and 2400 (0000 will invalidate the case)
bw, body weight; Cn, column; CV, coeffi cient of variation; DF, degrees of freedom; F, fl uoride; h, hour; ID, identifi cation; m, minute; MS, Microsoft, ppm; parts per million; SD, standard deviation; SE, standard error; y, year Gender of subjects Row 10 provides column numbers Explanation formulae Total number of subjects 10
N % Leave blank those cells of the fi eld and laboratory data where the data is missing. Collections are only valid where all four sets of fi eld and laboratory data are recorded
Cn 18 = duration of collection in hours and decimals Subjects with at least 1 valid collection 0 Female 2 20 Cn 19 = Cn14/Cn18 Number of subject with all collections valid 0 Male 8 80 Cn 20 = Cn 14 × Cn 15/Cn18 Number of valid collections 16 Sum 10 100 Number of collections per subject, mean 1.6
c07.indd 60 4/10/2014 6:55:31 PM

Design of the fi nal report for time-controlled urinary collections
61
Noon
Field and laboratory data Valid “ = 1”
Valid time at initial voiding (hhmm)
Duration of collection (hh.dec)
Results per h No. of valid collections (Cn16 + Cn 26)
Time at initial voiding (hhmm)
Collec-tion ended (hhmm)
Urine volume (mL)
F conc. (ppm)
Urine fl ow (mL/h)
F excr. ( μ g/h)
No
Cn22 Cn23 Cn24 Cn25 Cn26 Cn27 Cn28 Cn29 Cn30 Cn31 Cn32
1200 1530 70 0.922 1 1200 3.50 20.0 18.4 81 2
1200 1440 140 1.42 1 1200 2.67 52.5 74.6 82 2
1145 1500 100 1.18 1 1145 3.25 30.8 36.3 83 2
1200 1520 170 1.41 1 1200 3.33 51.0 71.9 84 1
1200 1500 90 2 1 1200 3.00 30.0 60.0 85 2
1220 1530 70 1.25 1 1220 3.17 22.1 27.6 87 1
1200 1450 170 0.843 1 1200 2.83 60.0 50.6 88 2
1200 1400 0 x x x x 91 0
1210 1330 90 1.45 1 1210 1.33 67.5 97.9 89 2
1200 1320 220 1.2 1 1200 1.33 165.0 198.0 90 2
10 10 9 9 9 9 9 9 9 16
1145 1320 70.0 0.843 1145 1.3 20.0 18.4
1220 1530 220.0 2.000 1220 3.5 165.0 198.0
1200 1475 100.0 1.250 1200 3.0 51.0 60.0
124.4 1.297 2.7 55.4 70.6
0.339 0.8 44.5 53.9
26 3.0 80 76
c07.indd 61 4/10/2014 6:55:32 PM
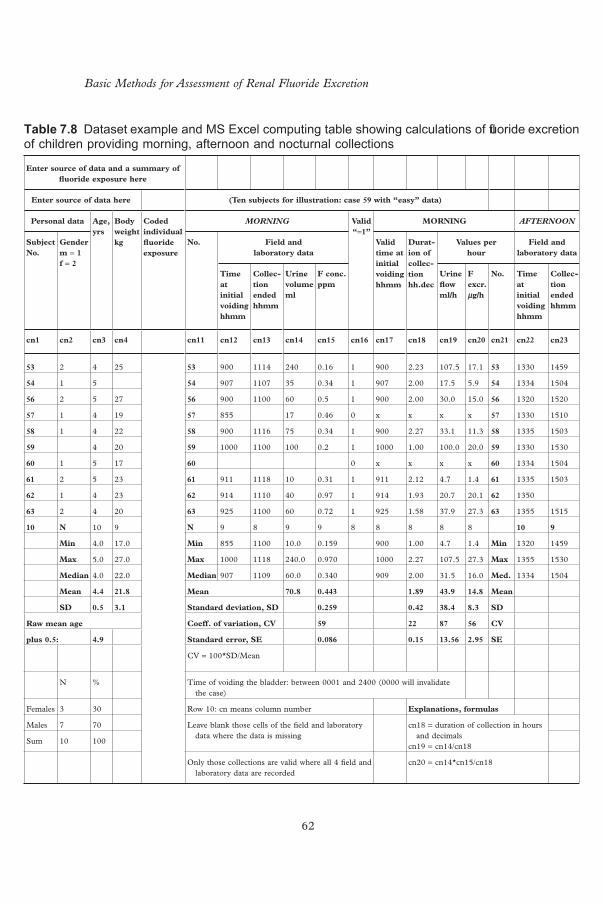
Basic Methods for Assessment of Renal Fluoride Excretion
62
Table 7.8 Dataset example and MS Excel computing table showing calculations of fl uoride excretion of children providing morning, afternoon and nocturnal collections
Enter source of data and a summary of fl uoride exposure here
Enter source of data here (Ten subjects for illustration: case 59 with “easy” data)
Personal data Age, yrs
Body weight kg
Coded individual fl uoride exposure
MORNING Valid “ = 1”
MORNING AFTERNOON
Subject No.
Gender m = 1 f = 2
No. Field and laboratory data
Valid time at initial voiding hhmm
Durat-ion of collec-tion hh.dec
Values per hour
Field and laboratory data
Time at initial voiding hhmm
Collec-tion ended hhmm
Urine volume ml
F conc. ppm
Urine fl ow ml/h
F excr. μ g/h
No. Time at initial voiding hhmm
Collec-tion ended hhmm
cn1 cn2 cn3 cn4 cn11 cn12 cn13 cn14 cn15 cn16 cn17 cn18 cn19 cn20 cn21 cn22 cn23
53 2 4 25 53 900 1114 240 0.16 1 900 2.23 107.5 17.1 53 1330 1459
54 1 5 54 907 1107 35 0.34 1 907 2.00 17.5 5.9 54 1334 1504
56 2 5 27 56 900 1100 60 0.5 1 900 2.00 30.0 15.0 56 1320 1520
57 1 4 19 57 855 17 0.46 0 x x x x 57 1330 1510
58 1 4 22 58 900 1116 75 0.34 1 900 2.27 33.1 11.3 58 1335 1503
59 4 20 59 1000 1100 100 0.2 1 1000 1.00 100.0 20.0 59 1330 1530
60 1 5 17 60 0 x x x x 60 1334 1504
61 2 5 23 61 911 1118 10 0.31 1 911 2.12 4.7 1.4 61 1335 1503
62 1 4 23 62 914 1110 40 0.97 1 914 1.93 20.7 20.1 62 1350
63 2 4 20 63 925 1100 60 0.72 1 925 1.58 37.9 27.3 63 1355 1515
10 N 10 9 N 9 8 9 9 8 8 8 8 8 10 9
Min 4.0 17.0 Min 855 1100 10.0 0.159 900 1.00 4.7 1.4 Min 1320 1459
Max 5.0 27.0 Max 1000 1118 240.0 0.970 1000 2.27 107.5 27.3 Max 1355 1530
Median 4.0 22.0 Median 907 1109 60.0 0.340 909 2.00 31.5 16.0 Med. 1334 1504
Mean 4.4 21.8 Mean 70.8 0.443 1.89 43.9 14.8 Mean
SD 0.5 3.1 Standard deviation, SD 0.259 0.42 38.4 8.3 SD
Raw mean age Coeff. of variation, CV 59 22 87 56 CV
plus 0.5: 4.9 Standard error, SE 0.086 0.15 13.56 2.95 SE
CV = 100*SD/Mean
N % Time of voiding the bladder: between 0001 and 2400 (0000 will invalidate the case)
Females 3 30 Row 10: cn means column number Explanations, formulas
Males 7 70 Leave blank those cells of the fi eld and laboratory data where the data is missing
cn18 = duration of collection in hours and decimals
cn19 = cn14/cn18Sum 10 100
Only those collections are valid where all 4 fi eld and laboratory data are recorded
cn20 = cn14*cn15/cn18
c07.indd 62 4/10/2014 6:55:32 PM

Design of the fi nal report for time-controlled urinary collections
63
Valid “ = 1”
AFTERNOON NIGHT Valid “ = 1”
NIGHT N of valid collect-ions cn16 plus cn26 plus cn36
Valid time at initial voiding hhmm
Dura-tion of collec-tion hh.dec
Values per hour
Field and laboratory data
Valid time at initial voiding hhmm
Dura-tion of collec-tion hh.dec
Values per hour
Urine volume ml
F conc. ppm
Urine fl ow ml/h
F excr. μ g/h
No. Time at initial voiding hhmm
Collec-tion ended hhmm
Urine volume ml
F conc. ppm
Urine fl ow ml/h
F excr. μ g/h
No.
cn24 cn25 cn26 cn27 cn28 cn29 cn30 cn31 cn32 cn33 cn34 cn35 cn36 cn37 cn38 cn39 cn40 cn41 cn42
80 0.103 1 1330 1.48 53.9 5.6 53 2210 720 140 0.72 1 2210 9.17 15.3 11.0 53 3
95 0.77 1 1334 1.50 63.3 48.8 54 2140 845 170 0.61 1 2140 11.08 15.3 9.4 54 3
100 1.0 1 1320 2.00 50.0 50.0 56 2100 700 200 0.4 1 2100 10.00 20.0 8.0 56 3
30 0.74 1 1330 1.67 18.0 13.3 57 2005 750 280 0.41 1 2005 11.75 23.8 9.8 57 2
28 1.14 1 1335 1.47 19.1 21.8 58 1735 805 255 0.68 1 1735 14.50 17.6 12.0 58 3
120 0.4 1 1330 2.00 60.0 24.0 59 2100 700 500 0.2 1 2100 10.00 50.0 10.0 59 3
95 0.249 1 1334 1.50 63.3 15.8 60 2100 845 170 0.612 1 2100 11.75 14.5 8.9 60 2
45 0.36 1 1335 1.47 30.7 11.0 61 820 130 0.72 0 x x x x 61 2
89 0.89 0 x x x x 62 2030 830 205 0.76 1 2030 12.00 17.1 13.0 62 2
100 0.255 1 1355 1.33 75.0 19.1 63 2010 830 180 1.31 1 2010 12.33 14.6 19.1 63 3
10 10 9 9 9 9 9 9 10 10 10 9 9 9 9 9 26
28.0 0.103 1320 1.33 18.0 5.6 Min 1735 700 130.0 0.200 1735 9.17 14.5 8.0
120.0 1.140 1355 2.00 75.0 50.0 Max 2210 845 500.0 1.310 2210 14.50 50.0 19.1
92.0 0.570 1334 1.50 53.9 19.1 Med 2100 812.5 190.0 0.646 2100 11.75 17.1 10.0
78.2 0.591 1.60 48.2 23.3 Mean 223.0 0.642 11.40 20.9 11.2
0.361 0.24 20.7 15.8 SD 0.295 1.58 11.3 3.3
61 15 43 68 CV 46 14 54 30
0.114 0.08 6.89 5.27 SE 0.093 0.53 3.77 1.11
Total number of children:
10
Number of valid collections:
26
Collections per child: 2.60
c07.indd 63 4/10/2014 6:55:32 PM

Tabl
e 7.
9 Id
eal f
orm
at o
f a d
atas
et to
be
trans
ferr
ed to
an
eval
uatio
n ce
ntre
For
des
igna
tion
of
colu
mns
and
dat
a to
be
ente
red
see
Tab
le
7.6
Th
e fi
gure
s ( i
tali
cs )
in t
he
fram
es a
re t
he
dat
es n
eed
edfo
r co
mp
lete
eva
luat
ion
F
expo
sure
sho
uld
be e
nter
ed I
n co
lum
ns 5
–10
(not
sho
wn)
(Thi
s lin
e is
als
o re
serv
ed f
or t
he s
umm
ary
of fl
uor
ide
expo
sure
(e.
g. w
ater
; sa
lt;
milk
, to
othp
aste
and
fl u
orid
e ri
nses
)
Su
bje
ct
Mor
nin
gA
fter
noo
nN
octu
rnal
Fie
ld a
nd
lab
orat
ory
dat
aF
ield
an
d l
abor
ator
y d
ata
Fie
ld a
nd
lab
orat
ory
dat
a
ID
No.
a S
ex
M =
1
F =
2
Age
(y
rs)
Bw
(k
g)F
ex
pos
.ID
N
o.T
ime
init
ial
void
ing
(hh
mm
)
Col
lect
. en
ded
(h
hm
m)
Uri
ne
volu
me
(mL
)
Flu
orid
e co
nce
nt.
p
pm
ID
No.
Tim
e in
itia
l vo
idin
g (h
hm
m)
Col
lect
. en
ded
(h
hm
m)
Uri
ne
volu
me
(mL
)
Flu
orid
e co
nce
nt.
(p
pm
)
ID
No.
Tim
e in
itia
l vo
idin
g (h
hm
m)
Col
lect
. en
ded
(h
hm
m)
Uri
ne
volu
me
(mL
)
Flu
orid
e co
nce
nt.
(p
pm
)
Cn
1C
n2
Cn
3C
n4
Cn
5C
n11
23
15
22 23
91
011
2024
0.22
23
1320
1510
850.
1 23
21
5072
016
00.
15
24
25
24 24
91
011
0060
0.43
24
1320
1520
650.
77 24
22
0084
512
20.
7
25
24
19 25
91
510
5070
0.55
25
1330
1515
481.
0 25
21
3070
018
00.
45
27
16
28 27
91
525
0.22
27
1310
1518
300.
74 27
21
1575
017
00.
65
28
25
23 28
84
011
1575
0.32
28
1310
1520
451.
14 28
20
5080
524
00.
92
29
16
20 29
85
011
0060
0.79
29
1300
1500
820.
25 29
21
5584
522
00.
3
31
14
19 31
90
511
1048
0.10
5 31
13
3515
0664
0.36
31
820-
155
0.27
33
24
20 33
91
011
1045
0.46
33
33
2045
830
260
0.45
34
25
26 34
85
011
0076
0.87
34
1340
1520
0.96
34
2135
830
225
1.2
9 N
9
8 9
9 8
8 8
8 8
9 9
9
Min
84
010
5024
.00.
105
1300
1500
30.0
0.10
320
4570
012
2.0
0.15
0
Max
91
511
2076
.00.
870
1340
1520
100.
01.
140
2200
845
260.
01.
200
Med
91
011
0560
.00.
430
1320
1517
64.5
0.75
521
3382
018
0.0
0.45
0
Mea
n
53.7
0.
441
64.9
0.
665
192.
4 0.
566
SD
0.
261
0.38
20.
337
bw,
body
wei
ght;
Cn,
col
umn;
F,
fl uor
ide;
h,
hour
; ID
, id
enti
fi cat
ion;
m,
min
ute;
MS
, M
icro
soft
, pp
m;
part
s pe
r m
illio
n; S
D,
stan
dard
dev
iati
on;
y, y
ear
a ID
No.
is
man
dato
ry f
or C
n1,
opti
onal
for
fur
ther
col
umns
L
eave
bla
nk t
hose
cel
ls w
here
det
ails
are
mis
sing
. B
asic
ally
, a
urin
e co
llect
ion
is v
alid
onl
y w
hen
all
four
set
s of
fi e
ld a
nd l
abor
ator
y da
ta a
re a
vaila
ble
Not
e: d
ata
stor
ed i
n M
S E
xcel
sho
uld
be c
heck
ed a
s fa
r as
is
poss
ible
in
MS
Exc
el. T
he s
tati
stic
s N
, Min
, Max
, Med
ian,
Mea
n an
d S
D a
re u
sefu
l fo
r ch
ecki
ng b
y th
e fi e
ld w
orke
r, a
nd f
or c
heck
ing
of c
orre
ct t
rans
fers
at
the
eval
uati
on
cent
re.
If t
he d
ata
are
sent
via
an
MS
Exc
el t
able
, th
ese
stat
isti
cs s
houl
d be
pre
sent
ed b
elow
the
row
s re
serv
ed f
or t
he s
ubje
cts
c07.indd 64 4/10/2014 6:55:32 PM

65
8 Urine spot samples
Twenty-four hour urine collection is the most reliable method for estimating urinary excretion of fl uoride. However, when it is not feasible to obtain 24-hour urine or shorter time-controlled collections, spot urine samples may be obtained. A spot urine sample is defi ned as an un-timed “single-void” urine sample. This method is the least informative method for studying fl uoride expo-sure, because the amount of fl uoride excreted per day or per hour cannot be calculated from the concentration alone.
Spot samples are relatively easy to obtain, and measurement of fl uoride concentration is relatively simple. The method can be used in a number of situations. First, the value obtained can be compared with standards (Table 7.4). Urinary fl uoride concentrations of 0.8–1.2 mg/L (i.e. ppm) are regarded as indicating optimal exposure to fl uoride. Based on a large number of studies, mostly conducted in connection with fl uoridated water, these limits have been found to be independent of age ( 19, 45, 47, 51, 52, 58, 59 ) . Second, if repeated over a period of time, the values can rapidly disclose changes in fl uoride exposure. Thus, such data can show whether a fl uoride-based intervention (in water, salt or milk) has been successful in reaching the target community, or whether a source of excessive fl uoride exposure has been successfully removed. Third, if the fl uoride concentration in spot samples – obtained, for example, about 6months after a baseline collection and after introduction of a fl uoride-based programme – is 20% higher than the baseline measurement, it would be reasonable to assume that the intake of fl uoride has also increased by about 20%.
If spot samples are collected, it is best to take them at several times within a day. Urine that has accumulated in the bladder over a short period may refl ect a short-lived peak level of the fl uoride concentration. Hence, the longer the urine is retained in the bladder, the more representative it is of 24-hour results. For each spot sample, the hour when it was obtained should be recorded. When spot samples are collected in a follow-up assessment of urinary fl uoride, the time of day at which the urine is passed should be approximately equal to the collection times in the initial excretion study. In programmes where fl uoride is given once or twice per day, spot urine samples
c08.indd 65 4/10/2014 6:55:33 PM
Basic Methods for Assessment of Renal Fluoride Excretion
66
are not useful unless they are scheduled in such a way as to be directly associ-ated with the fl uoride intake.
8.1 Creatinine
In healthy subjects, urinary creatinine excretion is fairly constant throughout the day. Creatinine concentration in urine is measured in most hospitals or laboratories as a routine test for evaluating kidney function, and the test is easy and relatively cheap. Due to the relative stability of creatinine within an individual, it has also been used for normalization of analytic concentrations. An estimate of 24-hour urinary excretion of fl uoride can be calculated by multiplying the ratio of urinary fl uoride to urinary creatinine (F: Cr ratio) with creatinine reference values. The mean 24-hour urinary creatinine value of 15 mg/kg bw/day (with 5 th and 95 th percentiles of 8 and 22 mg/kg bw/day) has been reported as the standard urinary excretion of creatinine ( 60 ) . Also, a mean F: Cr ratio of 1.49 mg F/g Cr has been reported for children ( 22 ) . In young children on a customary diet, good agreement has been reported between the measured 24-hour urinary fl uoride excretion and the predicted 24-hour urinary fl uoride excretion from the F: Cr ratio ( 22 ) .
c08.indd 66 4/10/2014 6:55:33 PM
67
9 Provision of technical advice
WHO is willing to help in identifying experts who can assist countries in designing, directing or evaluating data from fl uoride exposure studies. Contact the WHO Oral Health Programme, Department for Prevention of Non-communicable Diseases:
World Health Organization 20 Avenue Appia CH-1211 Geneva – Switzerland [email protected]
c09.indd 67 4/10/2014 6:55:34 PM

68
Annex A Apparatus and materials
Specifi c ion electrodes are used to determine fl uoride in water and monitor renal fl uoride excretion in community prevention programmes. The following apparatus and elements are needed for the procedure.
1) Polypropylene tubes, 15 mL with screw cap for fl uoride determination in urine and water.
2) Disposable gloves to fi t hand size of the operator. 3) Disposable paper towels. 4) Climate-controlled room. If tests are to be conducted in a laboratory,
ambient conditions are usually maintained at 23 ± 2°C and 50 ± 10% relative humidity; this corresponds roughly to “normal room tempera-ture” in moderate climates, and most laboratories aim to maintain such environmental conditions. Fluoride determination can be con-ducted at the school or preschool site, if a suitable room is available. However, temperature fl uctuation during the day can cause erratic readings – for example, a 1°C difference in temperature will give rise to a measurement error of about 2% – therefore, care must be taken to ensure that standard solutions (used for calibrating electrodes) and urine tests samples are at the same temperature. It is also important to note that lower or higher temperature affects the electrode slope; the slope of the fl uoride electrode at 25°C should be 59.2 mV.
5) Running water and accessibility to a drain for disposing of urine after tests are conducted.
6) Distilled or deionized water to prepare standards and solutions (about 20 L, depending on the number of test samples to be evaluated). The number of fl uoride determinations can be calculated by taking into consideration: • the number of participating subjects – children or adults; • the number of collection periods included in the study; • all cylinders (tubes) of drinking water brought by subjects; and • urine collections taken at the school or at the institution or place
of employment if participants are adults.
bapp01.indd 68 4/10/2014 6:55:14 PM
Annex A
69
7) Reliable pH/ISE meter compatible for use with specifi c fl uoride ion electrodes, and to determine the pH of urine if required. Models that have been found to be reliable and simple to use include the Orion Model 720A Plus (available either for 220 or 110 volts operation) or the Orion Dual Star pH/ISE meter (Thermo-Orion Scientifi c, Beverly, MA, USA). The latter model comes with a universal power supply, with an adapter that has plugs to fi t a variety of electric sockets; also, the input voltage can be either 110 or 220 volts. The meter sensitivity can be set to record one, two or three decimal points, depending on the precision desired. For calculation of fl uoride excretion rates, meter sensitivity can be set to the nearest 0.01 ppm.
8) Reliable specifi c fl uoride ion electrode. For example, the Orion 9609BN (Thermo-Orion Scientifi c, Beverly, MA, USA) has been found to be a reliable instrument. Two electrodes are recommended, to make it easier to obtain two readings from each sample. Again, the meter sensitivity can be set to record one, two or three decimal, depending on the precision desired. For calculation of fl uoride excre-tion rates, meter sensitivity can be set to the nearest 0.01 ppm.
9) Reference electrode fi lling solution, depending on the electrode man-ufacturer recommendations. If using the Orion electrode, the fi lling solution recommended is Thermo-Orion Cat 900061.
10) Standard at 100 ppm (e.g. Ion plus Orion 940907). 11) Total ionic strength adjusting buffer (TISAB) to provide a constant
background ionic strength, de-complex fl uoride and adjust solution pH. Two TISAB buffers can be used: TISAB II for low-level meas-urements (e.g. Orion 94-09-09) or TISAB III concentrated (Orion 94-09-11).
Note: TISAB II and TISAB III can be prepared from laboratory supplies.
Tisab II
TISAB II is used for most measurements, but is particularly useful in measuring solutions that might have low concentrations of fl uoride ( < 0.4 ppm) and in which no fl uoride-complexing agents (e.g. aluminum or iron) are present.
To prepare TISAB II: Place about 500 ml of distilled water in a 1 L beaker. Add 57 mL of glacial acetic acid and 58 g of reagent-grade NaCl. Place the beaker in a water bath for cooling. Immerse a calibrated pH electrode into the solution and slowly add 5 M NaOH until the pH is between 5.0 and 5.5. Cool to room temperature. Pour into a 1 L volumetric fl ask and dilute to the 1 L mark with distilled water ( 61 ) .
bapp01.indd 69 4/10/2014 6:55:14 PM
Basic Methods for Assessment of Renal Fluoride Excretion
70
12) Magnetic stirrer with variable speed 110 or 220 volts (e.g. Corning P410).
13) Magnetic micro stirring bars, tetrafl uorocarbon coated; 1.6 × 7 mm. 14) Stirring bar retriever, tetrafl uorocarbon coated. 15) Plastic beakers, 250 mL capacity (e.g. Fisher Cat 02591–28). 16) Dark plastic bottles, 125 mL with screw cap, for storing standard
solutions. 17) One precision micro litre adjustable volume pipette 100–1000 μ l (e.g.
Brinkman Eppendorf 2100Series Fisher catalogue 05–402–90) with pipette tips (e.g. Brinkman Eppendorf Pipette tips 05–403–26, box of 96) for 100–1000 μ l micropipette.
18) One precision micro litre adjustable volume pipette 500–5000 μ l (e.g. Brinkman Eppendorf 2100 Series Cat. 05–402–91) with pipette tips (e.g. Brinkman Eppendorf Pipette tips 05–403–71, Rack 5 × 24 = 120) for 500–5000 μ l micropipette.
19) One precision micro litre adjustable volume pipette 1–10 mL (e.g. Brinkman Eppendorf 2100 Series Cat 05–403–121 with Brinkman Eppendorf Pipette tips 05–403–116; bulk two bags of 100 = 200) for 1–10 mL micropipette.
20) One plastic or metal test-tube rack with 40 orifi ces of 17 mm diameter (e.g. Fisher Cat No 14–809B).
21) Semi-logarithmic sheets (three cycles × 70 divisions) (e.g. Keuffel & Esser Co. No 465490).
22) Mini wipes, 10.2 cm, for wiping electrodes after rinsing (e.g. Fisher Cat No. 06–665–28).
23) Class B polypropylene (Nalgene) 100 mL volumetric fl asks with poly-propylene screw caps (e.g. Fisher 02–617–154).
24) Bimetal thermometer, Celcius scale 0–150°C (e.g. Fisher Catalogue No 15–077–30D).
Tisab III
Dissolve 300 g sodium citrate. 2H 2 O (FW = 294.10), 22 g CDTA, and 60 g NaCl in 1 L water ( 62 ) .
NOTE 2: When the study is conducted in communities that can only be accessed via extensive travel, use of TISAB III concentrated is advanta-geous because smaller quantities can be transported and are likely to be less expensive. TISAB II is supplied in 3.785 L containers (1 gallon), and it needs to be added to the urine sample in a 1 : 1 ratio (e.g. add 5 mL of TISAB II to 5 mL of urine). TISAB III is supplied in 500 mL bottles and needs to be added to the urine sample in a 0.1 : 1 ratio (e.g. add 0.5 mL of TISAB III to 5 mL of urine).
bapp01.indd 70 4/10/2014 6:55:14 PM

Annex A
71
25) Polyethylene or polypropylene bucket for disposing of urine or water (about 15 L capacity).
26) Electrode stand and holder for two electrodes. 27) Plastic funnel.
bapp01.indd 71 4/10/2014 6:55:14 PM

72
Annex B Steps for verifying function of apparatus
Examine all accessories, instrument (meter) and equipment (electrodes), micropipettes, magnetic stirrer and so on for functional effectiveness before they are used in a test. The electrode chamber must be fi lled with fi lling solu-tion about 30–35 minutes (and preferably 1hour) before its intended use, to allow time for electrode stabilization. The solution level should be at least 25 mm above the level of the sample and the reference junction; the chamber should be fi lled up to the edge of the hole. The reference junction must remain submerged to ensure proper fl ow rate.
B1 Combination fl uoride electrode preparation and checking electrode operation
1. Remove the rubber cap covering the electrode tip. 2. Fill the electrode (for example Model 96–0900 or 9609BN) chamber
with special fi lling solution (for example Catalogue No. 900061) and ensure proper fl ow rate according to the electrode instruction manual.
3. Connect electrode to the meter. 4. Place 10 mL of distilled water and 10 mL of TISAB II into a 25 mL
tube or cylinder; or 9 mL of distilled water and 1 mL of TISAB III into a 25 mL plastic tube or cylinder.
5. Rinse the electrode with distilled water, blot dry and place into the tube, stir thoroughly, wait for a stable reading and record the electrode poten-tial in millivolts.
6. Pipette 1 mL of 100 ppm standard into the tube or cylinder and stir thoroughly. When a stable reading is displayed, record the electrode potential in millivolts.
7. Pipette 10 mL of the same standard (100 ppm) into the same cylinder and stir thoroughly. When a stable reading is displayed record the elec-trode potential in millivolts.
8. There should be a 54–60 mV difference between the two millivolt read-ings when the solution temperature is 20–25°C. If the millivolt potential
bapp02.indd 72 4/10/2014 6:55:14 PM

Annex B
73
is not within this range, refer to the trouble shooting section of the electrode manual.
This procedure measures the electrode slope, which is defi ned as the change in millivolts observed every 10-fold change in concentration. Obtaining the slope value is the best way to check electrode operation.
bapp02.indd 73 4/10/2014 6:55:14 PM

74
Annex C Calibration procedure
C1 Preparation of standards
The standards should bracket the expected sample range; serial dilution is the best method for the preparation of the standards. This can be done starting from a fl uoride level of 100 mg/L. The following concentrations are recom-mended as calibration points: 0.1, 0.5, 1.0 and 5.0 mg F/L. An additional calibration standard of 0.05 mg F/L can also be used. The calibrating solutions of the indicated concentrations can be prepared in relatively small quantities (e.g. 50 or 100 mL) so fresh solutions are always used. Calibration standards can be stored in dark plastic bottles provided with screw cap.
If certifi ed calibrating solutions (per example, Orion) are not available, these can be prepared by starting from a 100 ppm F solution. This solution is commercially available (Orion catalogue No. 940907), or can be prepared (e.g. from a compound of sodium fl uoride 100% pure or 99% pure). The reactive should be of high purity (preferably 100% pure). Considering that the molecular weight of the sodium fl uoride (NaF) is 42 (19 F and 23 Na), the percentage of the fl uoride available would be 45.2%. Hence, if the reactive is only 99% pure, the amount of fl uoride would be 44.78%. Thus, in a con-tainer of 500 grams, only 223.9 grams are fl uoride.
How much of the reactive compound of sodium fl uoride needs to be weighed to prepare a solution of fl uoride of 100 mg/L, given that in 500 g NaF there are 223.9 g F, and 100 mg F are needed? The calculation indi-cates that 0.223 g NaF is needed. This amount is deposited in a volumetric fl ask with a capacity of 1 L, and the fl ask is fi lled with distilled water to the 1-L mark.
C1.1 Preparation of standard solutions by serial dilution
From 100 ppm solution takes 10 mL and dilute to 100 mL. This will give a standard of 10 ppm.
From 100 ppm solution takes 5 mL and dilute to 100 mL. This will give a standard of 5 ppm.
bapp03.indd 74 4/10/2014 6:55:15 PM

Annex C
75
To prepare solutions with ppm
To a solution of 10 ppm
Add mL of distilled water to
0.05 0.5 100
0.1 1.0 100
0.5 5.0 100
1.0 10.0 100
ppm, parts per million Note: It is indispensable to use a micropipette
If numerous determinations are to be made, a larger quantity can be pre-pared maintaining the same proportions.
The desired amount of calibrating solution is deposited in a plastic con-tainer. Thus, for example, for 2 mL, a TISAB II solution in equal amounts (i.e. 2 mL) should be added.
C2 Actual calibration procedure
The desired amount of calibrating solution (e.g. 5 mL) is deposited in a plastic container, such as a polypropylene tube of 50 mL capacity, and a TISAB II solution in equal amounts (i.e. 5 mL) is added. If a concentrated TISAB III solution is used, then 5 mL of standard solution are placed in the plastic tube and 0.5 mL of TISAB III added.
NOTE: If a concentrated TISAB III solution has been added to the stand-ards, this solution should be added to the test samples in the correct pro-portion (i.e. 1/10 of the amount of standard or sample). Always use the same type of TISAB in the standards and the sample. Use of TISAB II in the standard and TISAB III in the sample, or vice versa, will cause erroneous concentration readings due to the difference in ionic strength and the dilution factor.
Note In many laboratories carrying out fl uoride analyses in the context of caries-preventive uses of fl uoride, details of the procedures, the types of TISAB and other method details vary to some extent. This is evident from scientifi c publications that describe the analytical methods in detail. Some special-ized laboratories take only 1 mL of urine to be mixed with 1 mL of TISAB
bapp03.indd 75 4/10/2014 6:55:15 PM

Basic Methods for Assessment of Renal Fluoride Excretion
76
54. Determine the standard solution temperature using the thermometer [Annex A24)] and record it in the record book.
55. Deposit the desired amount of standard in separate plastic tubes and label each with the corresponding fl uoride concentration.
56. Drop a micro stirring bar into each solution. 57. If two electrodes are to be used, each needs to be calibrated; connect
the electrodes to the meter receptacles and note the location of each corresponding channel. If a Orion 720A plus or a Orion Dual Star meter is used, two receptacles are provided in the instrument for con-necting two electrodes. Place the electrode inside the tube having the lowest concentration standard (i.e. 0.05 ppm or 0.1 ppm) taking care to maintain the solution level slightly below the electrode chamber ’ s orifi ce.
58. Start the magnetic stirrer and stir the solution in a low setting. The stirrer platform may become warm, and heat transfer to the test samples will affect the accuracy of the calibration curve. Therefore, prevent heat transfer by placing a piece of cork or board as an insulator between the stirrer platform and the bottom of the test tube.
59. Follow manufacturer ’ s instructions for operation of the meter for cali-bration procedures in the concentration mode. Each electrode to be used in fl uoride determination must be calibrated separately. When a stable reading is observed on the display screen, record the reading. Remove the electrode from the plastic tube, rinse it with distilled or deionized water and blot with fi ne tissue.
II, to arrive at the 2 mL solution in which the fl uoride is measured. Using small quantities, however, requires meticulous work by well-trained labora-tory personnel. If, for instance, 0.04 mL of a strong fl uoride solution (at, for example, 5 ppm F) is not completely blotted away from the electrode due to less than ideal working conditions, the amount of fl uoride in that 0.04 mL will increase the measured concentration in the following urine-TISAB mixture by as much as 0.1 ppm, whereas when working with 5 mL + 5 mL, the concentration is raised only by 0.02 ppm. It is general rule that working with 5 mL + 5 mL is fi ve times less sensitive to imprecise handling than working with 1 mL + 1 mL. Exercising care and good prac-tice, it is possible to use 4 mL (2 mL sample + 2 mL TISAB II) or (4 mL sample + 0.4 mL TISAB III). In this case, 15 mL capacity tubes are suitable for use with the Orion 9609BN ion plus combination electrode. If a dif-ferent model ion electrode that requires separate reference electrode is used, the size of the plastic cylinder should be large enough to accommo-date both electrodes.
bapp03.indd 76 4/10/2014 6:55:15 PM

Annex C
77
60. Proceed with the next concentration standard (i.e. 0.5) repeating the process until readings from all succeeding standard solutions (1.0, 5.0 and 10.0 ppm) are obtained.
61. If using the Orion Dual Star meter, a calibration curve can be dis-played. Although modern meters automatically construct a calibration curve in the meter memory, it is important to be able to construct a calibration curve on semi-logarithmic paper. Electrode potentials of standard solutions are measured and plotted on the linear axis (ordinate) against their concentrations on the long axis (abscissa). The registered values for each standard solution are entered onto semi-logarithmic paper. This can be made in the millivolts or the concentration mode. The values of the obtained reading of each solu-tion are connected by a line. If the electrode is working correctly, and standard solutions properly made, the readings should be connected essentially by a straight line. If calibration is satisfactory, proceed with the next step.
C3 Determination of fl uoride in urine and water
If the public health facility has a laboratory or if the oral health personnel desire to conduct the determination of fl uoride in urine or water, the following procedure is recommended:
1. Ensure that urine test samples are brought to room temperature, and that their temperature and that of the standard are the same.
2. The person responsible for conducting fl uoride determination must decide, ahead of time, the quantity of urine sample that will be used in the tests. This quantity regulates the amount of TISAB that will be needed. Further, a decision must be made as to whether TISAB II or TISAB III will be used. The same type of TISAB (II or III) must be added to both standard solutions and urine test samples.
3. Depending of the type of TISAB used (TISAB II or TISAB III), use a micropipette to measure either 5 mL (2 mL or 4 mL if using a 15 mL tube) of urine from the plastic tube containing the samples collected from each child in the corresponding collection period.
Add either 5 or 2 mL of TISAB II or 0.4 mL of TISAB III to the sample and gently mix it.
2. Drop a mini stirring bar into the sample. 3. Start the magnetic stirrer, set at a low speed. Place the plastic tube
containing the sample over it and ensure that the electrode is properly held in place in the electrode stand or holder. Follow the procedures
bapp03.indd 77 4/10/2014 6:55:15 PM

Basic Methods for Assessment of Renal Fluoride Excretion
78
given by the meter manufacturer to obtain direct readings in the con-centration mode.
4. When a stable reading is obtained, record it as the concentration of fl uoride in the sample with electrode No. 1.
5. Carefully remove the electrode from the tube containing the sample, rinse the electrode with distilled or deionized water, and blot the elec-trode, taking care not to rub the lanthanum membrane at the tip of the electrode.
6. Place electrode No. 2, which has been connected to the other channel, and repeat steps 3–5.
7. Repeat the procedure in an identical manner for each of the urine test samples collected in a given collection period, ensuring that calibration of each electrode is verifi ed every 1.5 hours, or even more frequently if there is any temperature change in the room where tests are being conducted.
The described procedure is identical for determining fl uoride concentration in water.
Keep in mind the importance of ensuring that standards and test samples are at the same temperature during measurements (25°C is recommended), and retain a constant stirring speed. Two parallel determinations are made and the average value is calculated and used for further processing.
It is also important to verify the calibration of the electrode every 1.5 hours, or even more frequently if there is any temperature change in the room where tests are being conducted.
The average of the two determinations is recorded as the concentration of fl uoride in the urine obtained from the child in the corresponding collec-tion period.
NOTE Electrodes do not last indefi nitely. Those in regular daily use may often function satisfactorily for 1–2 years, whereas those used intermit-tently last longer. Indications of breakdown include erratic read-outs taking several minutes to stabilize, and slope out of range (normally 54–50 mV per 10-fold change in F concentration). If such irregularities are observed, electrode replacement is recommended.
bapp03.indd 78 4/10/2014 6:55:15 PM
79
References
1 Petersen P.E. The world oral health report . WHO/NMH/NPH/ORH/03.2 2003 ( http://www.who.int/oral_health/media/en/orh_report03_en.pdf , accessed 10 December 2013 ).
2 Petersen P.E. , Lennon M.A. Effective use of fl uorides for the prevention of dental caries in the 21st century: The WHO approach . Community Dent Oral Epidemiol , 2004 , 32 : 319 – 321 ( http://www.who.int/entity/oral_health/media/en/orh_cdoe_319to321.pdf , accessed 10 December 2013 ).
3 Fluorides and oral health . Technical Report Series No. 846, Geneva, World Health Organization , 1994 ( http://whqlibdoc.who.int/trs/WHO_TRS_846.pdf , accessed 10 December 2013 ).
4 Fluoridation and dental health . WHA28.64, Geneva, World Health Organization, World Health Assembly (WHA) , 1975 ( http://apps.who.int/iris/bitstream/10665/95721/1/WHA28.64_fre.pdf , accessed 10 December 2013 ).
5 Fluoridation and dental health . WHA22.30, Geneva, World Health Organization, World Health Assembly (WHA) , 1969 ( http://apps.who.int/iris/bitstream/10665/91255/1/WHA22.30_eng.pdf , accessed 10 December 2013 ).
6 Fluorides and the prevention of dental caries . WHA31.50, Geneva, World Health Organization, World Health Assembly (WHA) , 1978 ( http://whqlibdoc.who.int/wholis/3/WHA31_R50_eng.pdf , accessed 10 December 2013 ).
7 Report on global oral health EB120/10 and draft resolution EB120.R5 . Executive Board Meeting January 2007, Geneva, World Health Organization , 2007 ( http://apps.who.int/gb/ebwha/pdf_fi les/EB120/b120_r5-en.pdf , accessed 10 December 2013 ).
8 Oral health: Action plan for promotion and integrated disease prevention . WHA60.17, Geneva, World Health Organization, World Health Assembly (WHA) , 2007 ( http://www.healthsystemsevidence.org/R.aspx?U = -1&T = EXTERNAL&A = 21036&D = FreeFullText-Full-text + report + (free)&L = http%3a%2f%2fapps.who.int%2fgb%2febwha%2fpdf_files%2fWHASSA_WHA60-Rec1%2fE%2fWHASS1_WHA60REC1-en.pdf , accessed 10 December 2013 ).
9 Marthaler T.M. , Petersen P.E. Salt fl uoridation – an alternative in automatic prevention of dental caries . Int Dent J , 2005 , 55 ( 6 ): 351 – 358 ( http://www.who.int/oral_health/publications/orh_IDJ_salt_fl uoration.pdf , accessed 10 December 2013 ).
bref.indd 79 4/10/2014 6:55:16 PM
Basic Methods for Assessment of Renal Fluoride Excretion
80
10 Milk fl uoridation for the prevention of dental caries . In: Bánóczy J , Petersen PE & Rugg-Gunn AJ , eds. Geneva , World Health Organization , 2009 ( http://www.who.int/oral_health/publications/milk_fl uoridation_2009_en.pdf , accessed 10 Decem-ber 2013 ).
11 Marthaler T.M. Monitoring of renal fl uoride excretion in community prevention pro-grames on oral health . WHO/NCD/NCS/ORH/99-1, Geneva, World Health Orga-nization , 1999 .
12 Oral health surveys: Basic methods ( 5 th Edition ). Geneva , World Health Organiza-tion , 2013 ( http://apps.who.int/iris/handle/10665/41905 , accessed 13 December 2013 ).
13 Murray J.J. Appropriate use of fl uorides for human health . Geneva , World Health Organization , 1986 ( http://whqlibdoc.who.int/publications/1986/9241542039_(part1).pdf , accessed 10 December 2013 ).
14 Rugg-Gunn A.J. , Villa A.E. , Buzalaf M.R. Contemporary biological markers of exposure to fl uoride . Monogr Oral Sci , 2011 , 22 : 37 – 51 .
15 Buzalaf M.A.R. , Rodrigues M. , Pessan J. , Leite A. , Arana A. , Villena R. et al. Biomarkers of fl uoride in children exposed to different sources of fl uoride . J Dent Res , 2011 , 90 ( 2 ): 215 – 219 .
16 Pessan J.P. , Buzalaf M.R. Historical and recent biological markers of exposure to fl uoride . Monogr Oral Sci , 2011 , 22 : 52 – 65 .
17 Villa A. , Anabalon M. , Zohouri V. , Maguire A. , Franco A.M. , Rugg-Gunn A. Relationships between fl uoride intake, urinary fl uoride excretion and fl uoride retention in children and adults: An analysis of available data . Caries Res , 2010 , 44 ( 1 ): 60 – 68
18 Levy S.M. , Kiritsy M.C. , Warren J.J. Sources of fl uoride intake in children . J Public Health Dent , 1995 , 55 ( 1 ): 39 – 52 .
19 Rugg-Gunn A.J. , Nunn J.H. , Ekanayake L. , Saparamadu K.D. , Wright W.G. Urinary fl uoride excretion in 4-year-old children in Sri Lanka and England . Caries Res , 1993 , 27 ( 6 ): 478 – 483 .
20 Baez R.J. , Podairu A. , Marthaler T.M. , Baez M.X. , Floarea L. Urinary fl uoride excretion by children and elderly individuals in Romania (Timisoara and Bucha-rest) . Oral Health and Dental Management in the Black Sea Countries , 2007 , 6 ( 3[21] ): 3 – 11 ( http://www.oralhealth.ro/volumes/2007/volume-3/V3-07-1.pdf , accessed 10 December 2013 ).
21 Zohouri F.V. , Rugg-Gunn A.J. Total fl uoride intake and urinary excretion in 4-year-old Iranian children residing in low-fl uoride areas . Br J Nutr , 2000 , 83 ( 1 ): 15 – 25 .
22 Zohouri F.V. , Swinbank C.M. , Maguire A. , Moynihan P.J. Is the fl uoride/creatinine ratio of a spot urine sample indicative of 24-h urinary fl uoride? Community Dent Oral Epidemiol , 2006 , 34 ( 2 ): 130 – 138 .
23 Ketley C.E. , Cochran J.A. , Lennon M.A. , O’Mullane D.M. , Worthington H.V. Urinary fl uoride excretion of young children exposed to different fl uoride regimes . Community Dental Health , 2002 , 19 ( 1 ): 12 – 17 .
bref.indd 80 4/10/2014 6:55:16 PM
References
81
24 Acevedo A.M. , Febres-Cordero C. , Feldman S. , Arasme M.A. , Pedauga D.F. , Gonzalez H. et al. Urinary fl uoride excretion in children aged 3 to 5 years exposed to fl uoridated salt at 60 to 90 mgF/Kg in two Venezuelan cities. A pilot study . Acta Odontol Latinoam , 2007 , 20 ( 1 ): 9 – 16 .
25 Ketley C.E. , Cochran J.A. , Holbrook W.P. , Sanches L. , van Loveren C. , Oila A.M. et al. Urinary fl uoride excretion by preschool children in six European countries . Community Dent Oral Epidemiol , 2004 , 32 : 62 – 68 .
26 Franco A.M. , Martignon S. , Saldarriaga A. , Gonzalez M.C. , Arbelaez M.I. , Ocampo A. et al. Total fl uoride intake in children aged 22–35 months in four Colombian cities . Community Dent Oral Epidemiol , 2005 , 33 ( 1 ): 1 – 8 .
27 Haftenberger M. , Viergutz G. , Neumeister V. , Hetzer G. Total fl uoride intake and urinary excretion in German children aged 3–6 years . Caries Res , 2001 , 35 ( 6 ): 451 – 457 .
28 Villa A. , Anabalon M. , Cabezas L. The fractional urinary fl uoride excretion in young children under stable fl uoride intake conditions . Community Dent Oral Epidemiol , 2000 , 28 ( 5 ): 344 – 355 .
29 Ekstrand J. , Fomon S.J. , Ziegler E.E. , Nelson S.E. Fluoride pharmacokinetics in infancy . Pediatric Research , 1994 , 35 ( 2 ): 157 – 163 .
30 Maguire A. , Zohouri F.V. , Hindmarch P.N. , Hatts J. , Moynihan P.J. Fluoride intake and urinary excretion in 6- to 7-year-old children living in optimally, sub-optimally and non-fl uoridated areas . Community Dent Oral Epidemiol , 2007 , 35 ( 6 ): 479 – 488 .
31 Grijalva-Haro M.I. , Barba-Leyva M.E. , Laborin-Alvarez A. Fluoride intake and excretion in children of Hermosillo, Sonora, Mexico . Salud Publica de Mexico , 2001 , 43 ( 2 ): 127 – 134 .
32 Ekstrand J. , Hardell L.I. , Spak C.J. Fluoride balance studies on infants in a 1-ppm-water-fl uoride area . Caries Res , 1984 , 18 ( 1 ): 87 – 92 .
33 Villa A.E. , Salazar G. , Anabalon M. , Cabezas L. Estimation of the fraction of an ingested dose of fl uoride excreted through urine in pre-school children . Community Dent Oral Epidemiol , 1999 , 27 ( 4 ): 305 – 312 .
34 Ketley C.E. , Lennon M.A. Determination of fl uoride intake from urinary fl uoride excretion data in children drinking fl uoridated school milk . Caries Res , 2001 , 35 ( 4 ): 252 – 257 .
35 Pessan J.P. , Pin M.L.G. , Martinhon C.C.R. , de Silva S.M.B. , Granjeiro J.M. , Buzalaf M.A. Analysis of fi ngernails and urine as biomarkers of fl uoride exposure from dentifrice and varnish in 4- to 7-year-old children . Caries Res , 2005 , 39 ( 5 ): 363 – 370 .
36 Villa A. , Anabalon M. , Cabezas L. , Rugg-Gunn A. Fractional urinary fl uoride excretion of young female adults during the diurnal and nocturnal periods . Caries Res , 2008 , 42 ( 4 ): 275 – 281 .
37 Villa A. , Cabezas L. , Anabalon M. , Garza E. The fractional urinary fl uoride excre-tion of adolescents and adults under customary fl uoride intake conditions, in a
bref.indd 81 4/10/2014 6:55:16 PM

Basic Methods for Assessment of Renal Fluoride Excretion
82
community with 0.6-mg F/L in its drinking water . Community Dental Health , 2004 , 21 ( 1 ): 11 – 18 .
38 Spencer H. , Lewin I. , Wistrowski E. , Samachson J. Fluoride metabolism in man . Am J Med , 1970 , 49 ( 6 ): 807 – 813 .
39 Maheshwari U.R. , King J. , Brunetti A.J. , Hodge H.C. , Newbrun E. , Margen S. Fluoride balances in pregnant and nonpregnant women . J Occup Med , 1981 , 23 ( 7 ): 465 – 468 ( http://www.ncbi.nlm.nih.gov/pubmed/?term = Fluoride + balances + in + pregnant + and + nonpregnant + women , accessed 13 December 2013 ).
40 Spencer H. , Kramer L. , Osis D. , Wiatrowski E. Excretion of retained fl uoride in man . J App Physiol , 1975 , 38 ( 2 ): 282 – 287 .
41 Bingham S. , Cummings J.H. The use of 4-aminobenzoic acid as a marker to validate the completeness of 24 h urine collections in man . Clin Sci , 1983 , 64 ( 6 ): 629 – 635 .
42 Jakobsen J. , Ovesen L. , Fagt S. , Pedersen A.N. Para-aminobenzoic acid used as a marker for completeness of 24 hour urine: assessment of control limits for a spe-cifi c HPLC method . Eur J Clin Nutr , 1997 , 51 ( 8 ): 514 – 519 .
43 Baez R.J. , Marthaler T.M. , Baez M.X. , Warpeha R.A. Urinary fl uoride levels in Jamaican children after 21 years of salt fl uoridation . Schweiz Monatsschr Zahnmed , 2010 , 120 : 21 – 28 .
44 Marthaler T.M. Urinary fl uoride in pre-school children related to use of fl uori-dated milk or salt . Caries Res , 1994 , 28 : 217 .
45 Marthaler T.M. , Binder-Fuchs M. , Baez R.J. , Menghini G. Urinary fl uoride excre-tion in Swiss children aged 3 and 4 consuming fl uoridated domestic salt . 2000 , 5 : 9 – 17 .
46 Marthaler T.M. , Steiner M. , Menghini G. , De Crousaz P. Urinary fl uoride excre-tion in children with low fl uoride intake or consuming fl uoridated salt . Caries Res , 1995 , 29 ( 1 ): 26 – 34 .
47 Baez R.J. , Baez M.X. , Marthaler T.M. Urinary fl uoride excretion by children 4–6 years old in a south Texas community . 2000 , 7(4) : 242 – 248 .
48 Phantumvanit P. , Sangkheaw S. , Lekfuengfu P. , Niyomsilp K. Urinary fl uoride excretion in children drinking fl uoridated school milk in Thailand . Oral Health and Dental Management in the Black Sea Countries , 2007 , 6 ( 2 ): 12 – 20 .
49 Steiner M. Fluoridausscheidung im Urin von Schulkindern im Zusammenhang mit der Speisesalzfuoridierung (Urinary fl uoride excretion in children in relation to salt fl uoridation) . 1985 , 95 : 1109 – 1117 .
50 Marthaler T.M. , Menghinin G.D. , Steiner M. , Sener-Zanola B. , De Crousaz P. Excrecion urinaria de fl uoruro en ninos suizos que consumen suplementos de fl uoruro en la sal o el agua (Urinary fl uoride excretions in Swiss children consum-ing supplemental fl uoride in salt or drinking water) . 1992 , 4 : 27 – 35 .
51 Pucci F.W. , Dol I. Estudio de excrecion urinaria de fl uor en niños de 3 a 5 anos (A study of urinary fl uoride excretion in children aged 3 to 5 years) . Uruguay, Ministerio de Salud Publica (Ministry of Public Health) , 1997 .
bref.indd 82 4/10/2014 6:55:16 PM

References
83
52 Szekely M. , Banoczy J. , Fazakas Z. , Hobai S. , Villa A. A comparison of two methods for the evaluation of the daily urinary fl uoride excretion in Romanian pre-school children . Community Dental Health , 2008 , 25 ( 1 ): 23 – 27 .
53 Hetzer G. , Straube H. , Neumeister V. Zur Verwendung fl uoridierten Speisesalzes in der Gemeinschaftsvepfl egung (About the use of fl uoridated salt in canteens) . Dtsch Zahnarztl Z , 1996 , 51 : 679 – 682 .
54 Sodium intake in populations: Assessment of evidence . Institute of Medicine of the National Academies , 1988 ( http://www.iom.edu/ ∼ /media/Files/Report%20Files/2013/Sodium-Intake-Populations/SodiumIntakeinPopulations_RB.pdf , accessed 13 December 2013 ).
55 Smith S.M. , Nillen J.L. Urine preservative: Patent 6261844 . July 17 2001 ( http://www.patentstorm.us/patents/6261844/description.html , accessed 10 December 2013 ).
56 Neefus J.D. , Cholak J. , Saltzman B.E. The determination of fl uoride in urine using a fl uoride-specifi c ion electrode . Am Ind Hyg Assoc J , 1970 , 31 ( 1 ): 96 – 99 .
57 Obry-Musset A.M. , Bettembourg D. , Cahen P.M. , Voegel J.C. , Frank R.M. Urinary fl uoride excretion in children using potassium fl uoride containing salt or sodium fl uoride supplements . Caries Res , 1992 , 26 ( 5 ): 367 – 370 .
58 Zohouri F.V. Fluoride intake and excretion in 4-year-old Iranian children . PhD thesis , United Kingdom, University of Newcastle , 1997 .
59 Rugg-Gunn A.J. , Al-Mohammadi S.M. , Butler T.J. Malnutrition and developmen-tal defects of enamel in 2- to 6-year-old Saudi boys . Caries Res , 1998 , 32 ( 3 ): 181 – 192 .
60 Tietz N.W. Clinical guide to laboratory tests . Philadelphia , W.B. Saunders , 1983 .
61 Orion Research . Analysis methods by pH and ion selective electrodes . Beverly, Massachusetts , 2011 ( http://delloyd.50megs.com/moreinfo/ISE.html , accessed January 2012 ).
62 Analytical Chemistry Resources . Analysis methods by pH and ion selective electrodes . Delloyd ’ s Lab Tech resources reagents and solutions ( http://delloyd.50megs.com/moreinfo/ISE.html , accessed).
bref.indd 83 4/10/2014 6:55:16 PM
Cre
ate
d b
y W
HO
/Gra
phic
s