basic guide to human factors · subject of human factors ... such limitations will be described...
TRANSCRIPT
BASIC GUIDE TO HUMAN FACTORS
Curt Lewis, PE, CSP Sylvia P. Hughes
TABLE OF CONTENTS
Preface ……………………………………………………………………. 2
Brief History ……………………………………………………………………. 3
What is Human Factors? ……………………………………………………. 5
Anthropometrics-Human Physical Characteristics ……………………………. 8
Individual Senses …………………………………………………………… 10
Human Vision …………………………………………………… 11
Perception of Motion …………………………………………………… 13
Human Hearing …………………………………………………… 14
Information Processing …………………………………………………… 16
Situation Awareness …………………………………………………… 18
Crew Resource Management (CRM) …………………………………………… 19
Human Factors and System Safety: Human Error & O&SHA …………… 21
Summary …………………………………………………………………… 28
References ……………………………………………………………………. 29
Figure References ……………………………………………………………. 31

2
PREFACE
This guide is not meant to be inclusive, but is designed to provide the reader with a
fundamental understanding of the subject and, it is hoped, to further a desire for
additional information and training. Those who desire a complete knowledge on the
subject of human factors will not be satisfied. It would not be feasible for a basic guide
to contain all possible information on any subject, especially as wide-ranging and
complex as human factors.
Years of research and a passion for understanding human behavior attributing to design
have produced many human factors pioneers. The “father” of Human
Factors/Ergonomics, Alphonse Chapanis, Professor Emeritus at Johns Hopkins
University, and president of the Human Factors and Ergonomics Society (HFES); at the
end of his career, wrote a memoir which ended with these words:
"...There is one thing I have never regretted - and that is my choice of profession. Humanfactors has always been challenging, frustrating at times, rewarding at others, but neverdull. I can honestly say in retrospect that I have had a full life - an exciting life - and thatI have enjoyed telling people about human factors, educating students and others to takeover where I have had to leave off, and grappling with problems of trying to make ourmaterial world safer, more comfortable, and easier to cope with. In fact, there is only onething I truly regret -
I'm sorry I've come to the end."
Chapanis passed away October 4, 2002 at age 85 after complications from knee surgery.

3
HUMAN FACTORS IN AVIATION
Brief History
The passion for flight can be traced back further beyond the classic achievement of
Wilbur and Orvile Wright (1903). In fact, as far back as the 1480’s. Leonardo da Vinci
made the first real studies of flight. He had over 100 drawings that illustrated his theories
on flight. Leonardo's drawing of an ornithopter could be called the first scientific
illustration. The idea for the ornithopter came from Leonardo's interest in how birds flew.
(Figure 2). DaVinci, (Figure 1), made several contributions to the world other than flight
including: “anatomy, physiology, mechanics, hydraulics, physics, philosophy,
mathematics, writing, engineering, philosophy, orbital mechanics, botany, and optics
were all studied and revealed by his genius” (Bellis, n.d.).
Figure 1. DaVinci self portrait. Figure 2. Leonardo's drawing.

4
By the turn of the century following the Wright brothers, innovations in
technologies prevailed making possible “the commencement of an evolutionary program
which has led to supersonic civil transportation, to space flight, and to awesome military
capabilities” (Edwards, 1988). Technological advances were made in such fields as
materials, structures, propulsion, and electronics (Edwards, 1988). Resources have
remained available, causing a devotion to the development of aircraft in becoming faster,
larger, more economical, and environmentally friendly. However engineering in its
“purest form” is incomplete with out the human element considered. From the
operational-need determination phase, up to system retirement phase of the system life
cycle.
Advancements in engineering and technology became useless the more complex
machinery/equipment became, simply because the requirements to operate the system
exceeded the human capacity/limitation to operate the system correctly, efficiently, and
most import safely. Such limitations will be described later in this guide. “An
understanding of the human role in aircraft operations is therefore an essential ingredient
of the total story, During the present century, considerable advances have been made in
the disciplines concerned with fitting the person to the job, and the job to the
person”(Edwards, 1988). Flight crews and other personnel involved in the operation of
flight must be carefully selected and trained, their equipment needs to match the
capabilities and limitations of human performance, and they must be protected from the
hazards of the environment in which they work. (Edwards, 1988).

5
What is Human Factors?
Human Factors emerged during WWII when several military pilots lost their lives not
in combat, but as we hear the term so frequently human error. The P-47 in Figure 3 was
the victim of a 500 pound bomb which fell from its fuselage shackle and exploded. The
pilot, Lt. Hallberg had been unable to release the bomb and was forced to land with it.
Somehow, the safety wire preventing the fusing vanes from turning had broken. The
result was that the bomb had armed.
It was found that advancements in technology in reference to cockpit layout; and
many of the new and complicated weapons were useless because they exceeded the
capacities of their human operators (Chapanis, 1996). This same kind of mismatching of
people and machines is widespread today in modern industry, in the skies above us, and
on our highways. It is this fact, together with the technological demands of space research
and defense needs, that is the challenge for human factors engineers. Their job is to
redesign present equipment and produce new equipment so that human errors, accidents,
and frustrations can be reduced and efficiently decreased (Chapanis, 1996).
Figure 3. WWII P-47
6
Alphonse Chapanis, a pioneer in Human Factors, his definition: “Human Factors
discovers and applies information about human behavior, abilities, limitations, and other
characteristics to the design of tools, machines, systems, tasks, jobs, and environments
for productive, safe, comfortable, and effective human use” (Chapanis, 1996, p. 11).
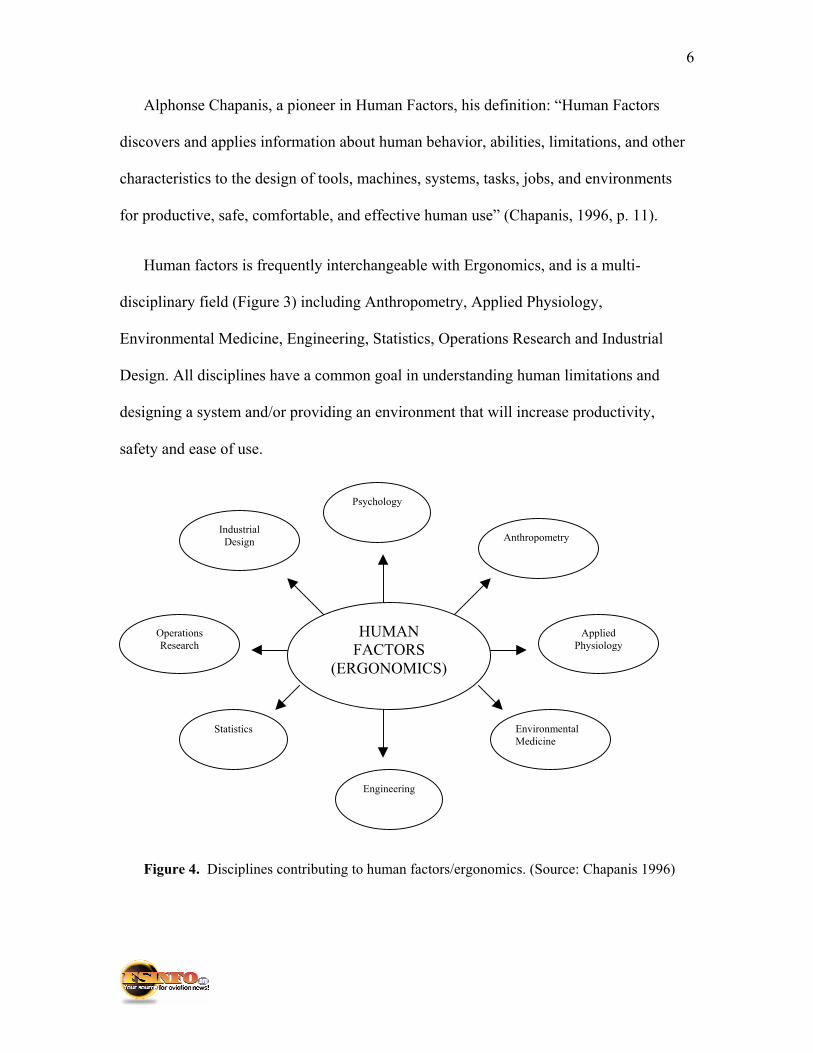
Human factors is frequently interchangeable with Ergonomics, and is a multi-
disciplinary field (Figure 3) including Anthropometry, Applied Physiology,
Environmental Medicine, Engineering, Statistics, Operations Research and Industrial
Design. All disciplines have a common goal in understanding human limitations and
designing a system and/or providing an environment that will increase productivity,
safety and ease of use.
Figure 4. Disciplines contributing to human factors/ergonomics. (Source: Chapanis 1996)
Anthropometry
Statistics
Engineering
AppliedPhysiology
EnvironmentalMedicine
Psychology
OperationsResearch
IndustrialDesign
HUMANFACTORS
(ERGONOMICS)

7
In some cases, Human Factors design can affect bottom-line profitability or can be a life
and death matter, e.g., you would not want to design a cockpit layout with the gear
handle and flap handle next to each other even though they are both used for configuring
the aircraft for approach and landing. Figure 5 illustrates a comical portrayal of a fictional
cockpit function near a passenger function.
Figure 5. Fictional cockpit function placed near a passenger seat function.
Companies came to realize that a products success is dependent upon a good
human factors design. To the layperson, the human factors concept is common sense,
when in fact disasters continue to occur. “People have great common sense in their
hindsight but not in their foresight” (Rhodes, 1999). The bottom line “human factors is a
data-based, rigorous discipline with practitioners from a variety of backgrounds doing all
kinds of work. Making products, system, and Web sites easier to use and easier to learn
is critical” (Rhodes, 1999). Human factors engineers help improve what has been

8
designed and what will be designed. The earlier human factors is implemented in the
design, the quicker the development and financial saving benefits in the long run.
Anthropometrics-Human Physical Characteristics
Anthropometry is an applied branch of anthropology, concerned with the
measurement of the physical features of people. “Anthropometrists measure how tall we
are, how far we can reach, how wide our hips are, how our joints flex, and how our
bodies move (Figure 6 & 7). Measurements have been made on literally hundreds of
body dimensions and body movements and for diverse populations” (Chanpanis, 1996 p.
14). It makes sense for designers to have access to the dimensions of potential users for
the purpose of designing seats, chairs, tables, computer consoles, automobile interior,
airplane cockpits, and many other work stations. (Chapanis, 1996).
Engineers and designers work with drawings and blueprints. It becomes more
complicated when we talk about people. There are no comparable drawings or blueprints
for people. If that were the case we would have 7 billion blue prints since we would have
to develop one for every person on earth! People differ from one another, and human
factors uses models of one or another feature of human beings, their characteristics and
behavior aiding the design process. (Chapanis,1996). Large differences include sensory
capacities, motor abilities, mental abilities, personalities, and attitudes.
So why not design for the “average person”? According to Chapanis (1996),
there are two difficulties with that approach. 1.) In so doing, the physically smaller 50%
of users may be unable to reach controls to do their work effectively and the physically
larger 50 percent may not have sufficient room to move around or do their work
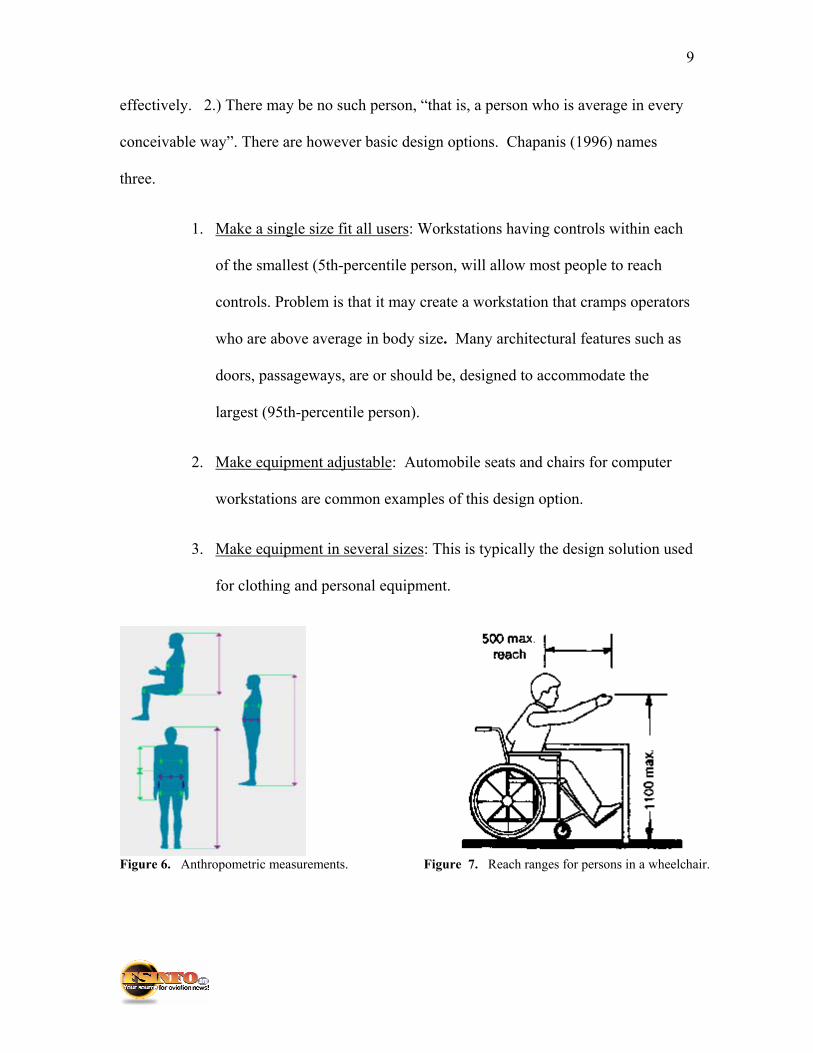
9
effectively. 2.) There may be no such person, “that is, a person who is average in every
conceivable way”. There are however basic design options. Chapanis (1996) names
three.
1. Make a single size fit all users: Workstations having controls within each
of the smallest (5th-percentile person, will allow most people to reach
controls. Problem is that it may create a workstation that cramps operators
who are above average in body size. Many architectural features such as
doors, passageways, are or should be, designed to accommodate the
largest (95th-percentile person).
2. Make equipment adjustable: Automobile seats and chairs for computer
workstations are common examples of this design option.
3. Make equipment in several sizes: This is typically the design solution used
for clothing and personal equipment.
Figure 6. Anthropometric measurements. Figure 7. Reach ranges for persons in a wheelchair.

10
Body measurements are usually taken between two end points. The following
measurement terms refer to a standing subject: (Chapanis, 1996 p. 159).
Height: is a straight-line, point-to-point vertical measurement. One height measure,stature, starts at the floor on which the subject stands and extends to the highest point onthe skull.
Breadth: is a straight-line horizontal side-to-side measurement across a body segment.
Depth: is a straight-line point-to-point horizontal measurement across the body, front toback.
Distance: is straight-line point-to-point measurement between landmarks on the body.
Curvature: is a point-to-point measurement that follows a body contour, for example,around the front of the chest from right to left. This measure is not closed and not usuallycircular.
Circumference: is a closed measurement that follows a body contour, for example,completely around the chest.
Reach: is a point-to-point measurement following the long axis of an arm or leg.
“In general, designs should be made based on the 5th percentile population limits
when personal must position their bodies to operate or maintain equipment and on the
95th percentile to accommodate a full range of unrestricted movement”. These limits
should be considered for the combined male and female population (Chapanis, 1996 p.
172).
Individual Senses
“Human factors engineering is based on knowledge of the fundamentals of our
sensory, perceptual, memory, and motor systems” therefore the human senses are used to
evaluate human performance thus designing human-machine systems to optimize
performance in an efficient manner (Libowitz, 1998).

11
Human Vision
Of particular interest to scientist and human factors engineers are the visual
systems in humans, capabilities and limitations in flight. Human vision can be broken up
into two parts; anatomical and functional:
1. Anatomical (duplicity theory): the cornea and lens, the front part of the eye
focuses on an image on the retina (Figure 8) in a manner similar to the lens of a
camera. The image then stimulates the light-sensitive receptors in the retina
located in the back part of the eye, which in turn sends a signal to the brain where
the process of perception takes place (Leibowitz, 1988). The retina contains two
distinct regions called the fovea and the optic disk which is the exit point from the
retina of the nerve fibers that make up the optic nerve. The disk is free of
photoreceptors, therefore is effectively blind. For this reason, the optic disk is
sometimes called the blind spot (Pulat, 1997). There are two different types of
light-sensitive receptors in the retina, cones (fovea) and rods that have different
functions. Cones provide superior detail, color, and motion perception, but require
high levels of light. Rods on the other hand, take over the non- responding cones
function of sight, needing only low levels of light for activation. Rods provide a
much poorer quality of vision than do cones, and are less sensitive to fine detail
and motion. Under low light levels however, it is still possible to see small, dim
objects by looking to the side rather than straight ahead at the object as you would
when using the cone-rich foveal region (Leibowitz, 1988). Rods take
approximately 30 minutes to fully activate; this refers to night vision.

12
Figure 8. The retina is covered with rods and cones, light-receptors that send electricalimpulses through optic nerve fibers and to the brain.
2. Functional (two modes of processing):
This approach is concerned with the
mode of function in vision such as object
recognition or visual guidance
(Leibowitz, 1982). In a study performed
by Gerald Schneider, (1960) when
removing the outer layer of the brain (or
cortex), of animals, they were no longer
able to distinguish between different
patterns presented, but were able to
position themselves or orient normally.
When removing a different part of the
brain, the animals were unable to orient,
but could recognize the different patterns
(Leibowitz, 1988). This study suggests
that humans are able to multi-function
using these two modes of processing
such as “walking and reading at the
same time”(Figure 9).
Figure 9. Walking and reading at the same
time.

13
Perception of Motion
“One of the most important dimensions of vision is the perception of motion. In
order to interact with the environment, it is essential that we know when we and the
objects in the environment are stationary or moving and, if in motion, how fast and in
which direction we or the observed objects are moving” (Leibowitz, 1988, p. 107). The
aviation environment is particularly affected with instances in which errors or illusions of
motion perceptions are encountered. According to Leibowitz (1988) there are two
different kinds of motion: perception of motion of our own bodies and perception of the
motion of objects such as other aircraft.
1.) Self-motion: In the absence of vision of the outside world, our perception of self-
motion is correct only when we are accelerating or have not been moving for a few
seconds. In the aviation environment, it is possible to determine only roughly how fast
one is moving by reference to the outside world, and it is essential to rely on instruments
to make certain the speed of the aircraft.
2.) Object motion: A difficult task for pilots to do, especially at night is to know what
direction and how fast other aircraft are moving. Take for example what happens when a
pilot views a light from an aircraft at night. “Every time the pilot’s own aircraft changes
speed, the viewed light will appear to move. If the other light is actually stationary, for
example, a star, planet, or light from the ground, or a ship, it may appear to the pilot to be
moving, and it could look the same as the light from another aircraft” (Leibowitz, 1988,
p.108). Since these perceptions are very common in aviation as opposed to on the

14
ground, one can see there are opportunities for false perceptions of aircraft movement and
airspeed with the possibility of mid air collisions and controlled flight into terrain (CFIT).
Human hearing
People hear sound from the sensitive variations in air pressure caused by vibrating
objects. “It is estimated that 15-19% of information is acquired by the auditory channel”
(Pulat, 1997, p.86). Frequency and intensity are the main focus for human factors
specialist particularly in the industrial work setting. Frequency: is the number of
alternations in sound pressure per unit time caused by changes in density of air
molecules. Frequency is measured in cycles per second and expressed in hertz (Hz). The
human ear is sensitive to frequencies between 20 and 20,000 Hz. Frequency is also
associated with pitch. Intensity: is associated with the human sensation of loudness and
is measured in bels (B) or decibels (dB) (Pulat, 1997). The smallest level of change for
sound that is detected is called the difference threshold. The more intense the sound, the
more difficult it is to detect a change.
The ear has three anatomical divisions: the outer ear, the middle ear, and the inner
ear (Figure 10). The outer ear collects variations air pressure; they are then funneled to
the eardrum via the ear canal. In the middle ear are three bones in succession, the
malleus, the incus, and the stapes, collectively called ossicles. Their joint purpose is to
transmit vibrations from the eardrum to the oval window ( membrane-covered opening
which leads from the middle ear to the vestibule of the inner ear) of the inner ear. The
structure of the inner ear has a spiral-shaped organ that resembles a snail. It is filled with
fluid. With pressure on the oval window, the fluid inside vibrates the

15
basilar membrane (decomposes incoming auditory signals into their frequency
components), which in turn transmits vibrations to the organ of Corti (hearing organ of
the inner ear) containing hair cells. Signals picked up by these nerve endings are then
transmitted to the brain by the auditory nerve.
Figure 10. Schematic diagram of the ear.
In aviation due to high visual demands imposed on pilots flying, particularly in
low visibility, aural displays improve safety by presenting caution and warning messages;
however the addition verbal content might decrease response time but increase
intelligibility (Hart, 1988).

16
Information Processing
Our human senses (sensory memory) can distinguish all sorts of information
around us. These include sounds, visual messages, and ambient air pressures (temperature
change, humidity, and breeze). However, not all sources of energy sensed can be
processed (Pulat, 1997). “After sensing, processing of information has to proceed
smoothly for optimum performance. In some types of human activity, such as reading
instructions and operating a simple hand tool, the correlation between input (what is read)
and output (action) is quite obvious” (Pulat, 1997, p. 98). The stages of information
processing concentrate on identifying and further describing stages in cognitive
processing” see Figure 10.
Input Output
Feedback
Figure 10. Stage processing model. (Source: Pulat 1997)
“Data sensed by the sensory channels are carried to the central mechanisms to be
processed after a very brief period of sensory memory (1/4 to 5 seconds). It is at
this level that perception takes place. Perception is attaching meanings to sensed
Attention resources/motivation
Senseorgan
Perception Short-term
memory
Choice ofresponse
Control ofresponse
Effectors
Long-term store
17
stimuli. Once perception takes, data become true information. Perception is
forming a relationship between new and old experiences. One’s perception of a
given situation may not be the same as another’s, due to different experiences,
background, and condition. However, research shows that perceptual process is
flexible and people adapt to perceptual experiences” (Pulat, 1997, p. 99-100).
To explain further, the stage processing model proposes that information is processed
and stored in 3 stages (Huitt, 2003).
1.) Sensory memory (STSS): is affiliated with the transduction of energy. In other
words changes from one energy form to another such as light, sound, smell, heat, cold
etc. In this process of transduction, a memory is created lasting only ½ second for vision;
about 3 seconds for hearing.
2.) Short-term memory (STM): also called working memory relates to what we are
thinking about at any given moment in time or in “Freudian terms” conscious memory.
STM memory last somewhere between 15 to 20 seconds unless repeated a number of
times.
3.) Long-term memory (LTM): also called preconscious and unconscious memory in
“Freudian terms”, where preconscious means that the information is relatively easily
recalled. Unconscious refers to data that is not available during normal consciousness. It
is the preconscious memory that is the focus of cognitive psychology as it relates to long-
term memory.
There are two levels of information processing conscious and automatic. As
skills are acquired, people move from conscious to automatic (Pulat, 1997).
18
For example, consciously following driving directions to a new and unfamiliar place. As
the trip to and from becomes familiar, the person no longer has to refer to the directions,
and can navigate on their own. Sometimes even going to/or towards that place
unintentionally when they meant to go an opposite direction. Automatic performance is
considered skilled performance. It occurs when the skill has been developed for a
particular activity. At this level people perform with little or no conscious effort (Pulat,
1997).
The subject on memory and cognition is very complex, and it would take its own
guide to touch on all the basics and main points that are fundamental to understanding
human factors.
Situation Awareness
A generic definition for Situational Awareness (SA) is knowing your surroundings
and what is taking place around you. SA is frequently defined in operational terms and is
concerned with mostly the people who need SA for specific reasons. Therefore, SA is
defined in terms of the goals and decision tasks for a specific job (Endsley, 2002). Many
definitions of SA have been developed, some directly tied to the aircraft domain and
some more general (Endsley, 2000).
“A general definition of SA that has been found to be applicable across a wide
variety of domains describes SA as the perception of the elements in the environment
within a volume of time and space, the comprehension of their meanings and the
projections of their status in the near future” (Endsley, 2000. p. 3). In a flight situation,
awareness could refer to the knowledge of present position in relation to the ground,
19
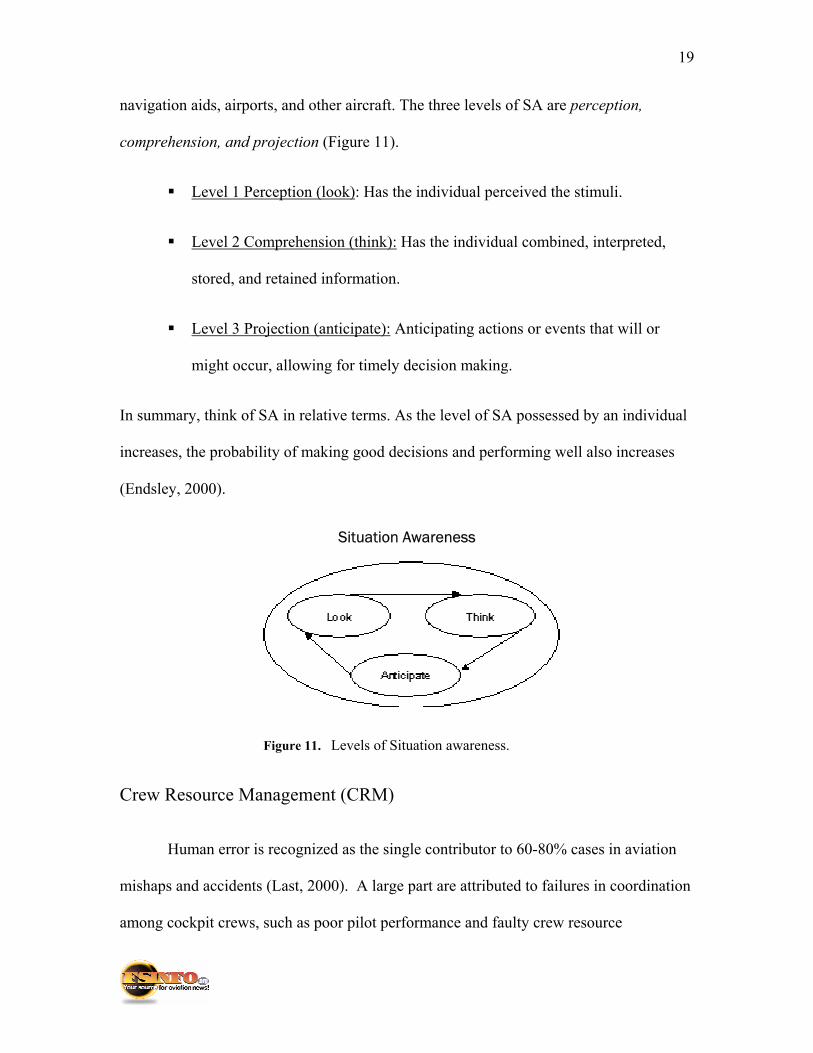
navigation aids, airports, and other aircraft. The three levels of SA are perception,
comprehension, and projection (Figure 11).
Level 1 Perception (look): Has the individual perceived the stimuli.
Level 2 Comprehension (think): Has the individual combined, interpreted,
stored, and retained information.
Level 3 Projection (anticipate): Anticipating actions or events that will or
might occur, allowing for timely decision making.
In summary, think of SA in relative terms. As the level of SA possessed by an individual
increases, the probability of making good decisions and performing well also increases
(Endsley, 2000).
Situation Awareness
Figure 11. Levels of Situation awareness.
Crew Resource Management (CRM)
Human error is recognized as the single contributor to 60-80% cases in aviation
mishaps and accidents (Last, 2000). A large part are attributed to failures in coordination
among cockpit crews, such as poor pilot performance and faulty crew resource

20
management (CRM). The U. S. General Accounting Office (1997) listed deficiencies
where there was a contributing cause in approximately half of accidents that occurred
between 1983 and 1985 that involved one or more fatalities (Bowers, Burke, Salas, &
Wilson, 2001). These include:
Lack of coordination among cockpit crews
Captains failure to assign tasks to other members
Lack of effective crew supervision
In an effort to manage some of the problems with team work associated to
mishaps and accidents, the aviation industry introduced the concept of CRM (Bowers et
al., 2001). Its purpose was for a way to train aircrews to use all available resources-
equipment, people and information-by communicating and coordinating as a team
(Figure 12) (Bowers et al., 2001). CRM “at the very least” is intended to ensure that the
pilot receives information and advice not only from the crew, but also from external
sources (Last, 2000).
CRM has been used with in the aviation industry for more than 20 years
undergoing several evolutions. 1st evolution: emphasized changing individual styles and
correcting deficiencies in individual behavior with a heavy focus on psychological
testing. 2nd evolution: represented a focus on cockpit group dynamics, was more
modular, and dealt more with specific aviation concepts related to flight operations. 3rd
evolution: came a broadening of scope, specifically, training began to take into account
the characteristics of aviation systems in which crew must function and expanded to areas
out side the cockpit (e.g., cabin crews, maintenance personnel), 4th evolution: came

21
integrating and proceduralization. 5th evolution: represents an awareness that human
error is inevitable and can provide a great deal of information (Bowers et al., 2001).
“CRM is now being used as a way to try to manage these errors by focusing on training
teamwork skills that will promote (a) error avoidance, (b) early detection of errors, (c)
minimization of consequences resulting from CRM errors. Programs are beginning to go
beyond error management to include a focus on threat recognition and management”
(Bowers et al., 2001, p. 642).
Figure 12. Crew resource management.
Human Factors and System Safety: Human Error & Operating & Support
Hazard Analysis (O&SHA)
Over the years system safety has been defined in many ways by technical
professionals and scientists. System safety has had a specific purpose of eliminating the
hazards or the risk of, through design and engineering controls. According to Stephenson
22
(1991), system safety can be defined as: A subdiscipline of systems engineering that
applies scientific, engineering and management principles to ensure adequate safety, the
timely identification of hazard risk, and initiation of actions to prevent or control those
hazards throughout the life cycle and within the constraints of operation effectiveness,
time, and cost. Thus a safety-oriented system of accident cause recognition and
communication is fundamental in improving human performance in aviation, which is
what both system safety and human factors personnel try to do (Vincoli, 1997). Human
factors have many roles in system safety, for example identifying the areas in human
activity through out a system’s lifecycle (Vincoli, 1997). These may include:
1. Personal planning, selection assignment, and performance assessment
2. Safety-related interface considerations (e.g., materials compatibility,
electromagnetic interference).
3. Design and test of the aircraft in terms of human engineering of controls and
displays
4. System biomedical considerations
5. Procedures and training
6. Operational personnel and situational awareness and motivation
In designing equipment, human factors and ergonomics are greatly considered,
simply because systems are designed with an intense need for high levels of reliability.
In successful design, the equipment is not the only aspect, but also the way the equipment
is operated by the human element. Therefore the design of the system needs to take into
account the human element in ensuring that operation between the equipment and human
can occur in an effective manner with minimum opportunity for error (Vincoli, 1997).

23
The study of human factors and ergonomics has provided strong evidence that
certain expected behaviors influence unsafe acts. With this evidence engineers can
implement design practice to effectively reduce or eliminate risk concerns “based upon
expected, or norms” in human behavior. “Do keep in mind that that there is no real
evidence to suggest that a normal or average human being exists, since so many variables
are involved in evaluating human performance in a given task”(Vincoli, 1997). Provided
in Table 1 are some examples of expected common human behavior traits that can be
used in design consideration
Table 1 Samples of Human Behavior Patterns That Must Be Considered During System Design
HUMAN BEHAVIOR CONSIDERATIONS IN SYSTEM DESIGN
BEHAVIOR DESCRIPTION DESIGN CONSIDERATION
People do not USUALLY consider the effects of surface frictionon their ability to grasp and hold an article.
Design surface texture to provide friction characteristicscommensurate with functional requirements of task or device.
MOST people cannot estimate distances, clearances, or velocitiesvery well (they tend to over-estimate short and under-estimatelarge distances).
Design so that users do not need to make estimates of criticaldistances, clearances, or speed. Provide indicators of thesemeasurements when necessary.
Most people do not watch where they place their hand and feet,especially in familiar surroundings.
If hand/foot placement is critical to the process, design so thatcareless, inadvertent placement of hands or feet will not result ininjury. Provide guards, restraints, warning labels, etc.
People OFTEN utilize the first thing available as an aid in gettingwhere they want to go or to manipulate or “fix” something.
Either design the product so that the “first thing handy” simplycannot be functionally useful, or so that it will serve a specific,intended function.
People SELDOM anticipate the possibility of contact with sharpcorners or edges.
Expect to meet functional requirements, eliminate sharp edges onsurfaces or units where inadvertent human contact is evenremotely possible.
People RARELY consider the possibility of fire or explosionfrom overheated objects.
Unless it is an unavoidable functional requirement, eliminateconfigurations which will permit, even with product misuse, suchpotential.
MANY people do not take the time to read labels or instructions,or to observe safety precautions.
Make labels brief, bold, simple, and clear. Repeat or place samelabels on various parts of a product. Make use of color coding,fail-safe innovations, and other attention-demanding devices.
MOST people perform in a perfunctory manner, utilizingprevious habit patterns, Under stress or in an emergency, theyalmost always revert to these habit patterns.
Don’t alter or change an established design (if it is satisfactory)just for the sake of change. Base all ‘design innovations” onchanges in functional or operational requirements.
Source: Doe SS DC-2 1976 (Vincoli, 1997)

24
In the industry setting, human factors/ergonomics plays a big part in the assurance
of safety for the company’s employees of occupational hazard and acceptable risks.
Safety and health professionals focus on ensuring compliance with, and the minimum
safety and health standards put into effect under the Occupational Safety and Health Act
(OSHA) of 1970. These rules form the foundation of most occupational safety and health
programs currently in place throughout both the public and private sectors and can be
found in the U.S. Code of Federal Regulations (CFR) at 29 CFR 1910 (Vincoli, 1997).
Several different analyses are used to identify possible hazards and provide risk reduction
and recommendations. In Industry operation, a system may become dangerous to
personnel and equipment in part due to human error. An Operating and Support Hazard
Analysis (O&SHA) is used to:
1. To identify all hazards in the operation of a system that are inherently
dangerous to personnel or in which a human error could be hazardous to
equipment or people.
2. To provide recommended risk-reduction alternatives during all phases of
tasks or operations that are controlled by written procedures (TAI 1989;
Stephenson 1991).
Basically O&SHA is used to review the controlling documents in ensuring hazard
elimination or control, concentrating heavily on human performance and their
relationship with to the hazards within in the task. Ergonomics studies the
interrelationship between people, their occupations, and their work environment;

25
Table 2 Typical human errors
Source: DOESSDC-2 1976 (Vincoli, 1997)
therefore it is a major element of the O&SHA. Humans are interacting with equipment,
and machines on a daily basis therefore performing various analyses are critical for
reducing the probability for an accident to occur. “It is widely known and often to
readily accepted fact that human error is a major causal factor (either primary or
COMMON HUMAN ERRORS
OPERATOR Omit Required Actions
Performance of Non-Required Actions
Failure to Recognize Needed Action
Improper (early, late, wrong) Response
Poor Communications
Maintenance Error
DESIGNER Lack of Hazard Awareness
Designing Requirement for Repetitious Tasks
Requiring Buick Operator Response for Hazard Recognition/Resolution
Required Operator to Perform Rapid, Complex Computations
Design Sensor Requirements Outside Human Range
Requiring Continuous Operator Attention
Requiring Operator to Work in Poor Environment
Requiring Simultaneous Physical Activity and Communication
Designing or Providing Improper Tools
Providing Inadequate or Faulty Written Procedures
MANAGER Providing Improper or Inadequate Training
Creating Unrealistic Production Schedules

26
contributory) in many mishaps” (Vincoli, 1997, p. 91). Table 2 lists common errors that
often results from a breakdown of the human component (DOE SSDC-2 1976).
“Human error has been defined as an action that is inconsistent with or contrary to
established behavioral patterns considered to be normal or that differs from prescribed
procedures that may or may not result in an adverse or unwanted event. The common
causes of human error can be divided into four categories and evaluated in an O&SHA”
(Vincoli, 1997 p. 92):
1. Physical
2. Work space requirements
3. Environmental
4. Limitations to human performance
The O&SHA should be performed on the system as soon as it is in the concept phase;
however this may not always be possible since the design or product must be practically
complete before maintenance and operating procedures are developed. Either way, the
O&SHA should be complete at the end of the production phase prior to first use
(Stephenson, 1991). Table 3 clarifies the four categories evaluated in an O&SHA.

27
Table 3 Characteristics of Common Human Error (Vincoli, 1997)
HUMAN ERROR CAUSE CHARACTERISTICS
CATEGORY CHARACTERISTIC
PHYSICAL Anthropometric Data/Limitations
Controls and Barriers: Types, Direction, BlindOperations, etc.
Equipment and Hardware Design Inadequate
WORK SPACEREQUIREMENTS
Position of Operator Relative to ActivitiesPerformed
Task Requirements-Adequate Space toPerform
Limitations to Ingress Into and Egress Out ofWork Area
Adequate Isolations from Other Tasks
Loads to Heavy
ENVIRONMENTAL Illumination Adequate to Perform Task
Atmospheric Conditions
Noise Levels in Area
Motion-Vibrations of (or in) WorkingEnvironment
Poor or Inadequate Ventilation
Temperature Extremes
LIMITATIONS Prolonged Concentration
Personal Stress (Physical or Mental)
Inadequate Rest
Illness
Boredom
Source: Technical Analysis, Incorporated 1989
For more on system safety please refer to the System Safety Guide.

28
In Summary
• The central approach of human factors is the application of relevant information
about human characteristics and behavior to the design of objects, facilities, and
environments that people use.
Human factors goes well beyond what the definitions provided. Human factors engineers
utilize many different approaches and they use several techniques in their work. They
come from all kinds of backgrounds and take advantage of the research from many
disciplines (e.g., computer science, engineering, anthropology, psychology, and software
engineering) (Rhodes, 1998).
• Human factors engineers realize that they will never have enough data to cover all
the problems to be solved. “The job is never done; a system can always be
improved”. Better designed products, systems, and Web sites yield happier
customers, increased sales, and improved safety (Rhodes, 1998).
29
REFERENCES
Bellis, M., (n.d.) Inventors: Leonardo DaVinci. Retrieved October 7, 2004 from
http://inventors.about.com/library/inventors/blda-vinci.htm
Bowers, C. A., Burke, S. C., Salas, E., & Wilson, K. A. (2001). Team training in the
skies: does crew resource management (CRM) training work? [Electronic
version] Human Factors, 43,641-675.
Chapanis, A. (1996). Human factors in systems engineering. New York: John Wiley &
Sons, Inc.
Edwards, E. (1988). Introductory overview. In D. C. Nagel, & E. L. Wiener (Eds.),
Human factors in aviation (pp. 3-24). San Diego, CA: Academic Press.
Endsley, R. (2000). Theoretical underpinnings of situation awareness: A critical
review. Mahwah, NJ: Lawrence Erlbaum Associates.
Hart, S.G. (1988). Helicopter human factors. In D. C. Nagel, & E. L. Wiener (Eds.),
Human factors in aviation (pp. 630). San Diego, CA: Academic Press.
Huitt, W. (2003) The information processing approach to cognition. Educational
Psychology Interactive. Valdosta GA: Valdosta State University. Retrieved
October 5, 2004 from http://chiron.valdosta.edu/whuitt/col/cogsys/infoproc.html
Last, Capt. S. (2000). Eliminating “Cockpit-caused” accidents: Error tolerant crew
Procedures for the year 2000. Retrieved October 2, 2004 from http://s92270093.
onlinehome.us/crmdevel/ resources/paper/last/last.htm
Leibowitz, H. W. (1988). Human senses in flight. In D. C. Nagel, & E. L. Wiener (Eds.),
Human factors in aviation (pp. 83-109). San Diego, CA: Academic Press.

30
Pulat, B. M. (1997). Fundamentals of Industrial Ergonomics (2nd ed.). Prospect Heights,
Illinois: Waveland Press, Inc.
Rhodes, J. S. (1998). What is human factors? Retrieved October 7, 2004 from
http://www.webword.com/whatishumanfactors.html
Stephenson, J. (1991). System Safety 2000. New York: Van Nostrand Reinhold.
Technical Analysis, Incorporated. (1989). System Safety Engineering, Course Manual.
Houston: Technical Analysis, Inc. (TAI).
Vincoli, J. W. (1997). Basic guide to system safety. New York: John Wiley & Sons , Inc.

31
FIGURE REFERENCES
Figure 1 http://inventors.about.com/library/inventors/blda-vinci.htm
Figure 2 NASA/Photo Researchers, Inc.
Figure 3 http://www.geocities.com/pentagon/quarters/9485/Photo.html
Figure 4 Chapanis, 1996, p. 14
Figure 5 http://www.certec.lth.se/lectures/kirre/mmi_ak_2001/modul2/
Figure 6 http://www.human-solutions.com/produkte_bodybuilder_e.php
Figure 7 http://www.dpa.org.sg/DPA/access/95figaa2.htm.
Figure 8 http://www.visionweb.com/content/consumers/dev_consumerarticles
.jsp?RID=36
Figure 9 http://creaky.typepad. com/photos /oakland/image_10_1. html
Figure 10 www.craneisd.com/. ../human%20ear/
Figure 11 http://www.2pass.co.uk/awareness.htm
Figure 12 http://www.airmanshiponline.com/18sep2001/05- Dal%20CRM
%20al%20TRM.htm