basic economic concepts
DESCRIPTION
Discusses the basic economic concepts useful for business managementTRANSCRIPT

Basic Economic Concepts and Selected
Macroeconomic Indicators
byATTY. RAUL S. ANLOCOTAN
Lecturer, Graduate SchoolUniversity of San Agustin, Iloilo City
OUTLINE OF PRESENTATIONI. Foundation of EconomicsII. GDP, GNP and GRDPIII.2009 GRDP HighlightsIV.Consumers Price IndexV. Inflation RateVI.Purchasing Power of PesoVII.Family Income and
ExpenditureVIII.Employment and
Unemployment

A. The foundation of economics is based on two facts:1. Society’s material wants are unlimited2. Economic resources, i.e., the means for
producing goods and services, are limited or scarce
B. The problem for any society then is how to use its limited resources to achieve the greatest fulfillment of society’s unlimited wants. This means that choices must be made regarding how to allocate resources among competing uses.

A. In practical terms, the problem of resource allocation boils down to three fundamental questions which any society must answer. These are:• What goods/services are to be produced
and in what quantities?• How shall such goods/services be
produced? (Since a given output can be produced by different combinations of inputs, what is the best combination to use?)
• For whom shall the goods/services be produced? (How should the total output of the economy be distributed or shared among various individuals in society?)

A. Free Market System: This system is characterized by the use of a system of markets and prices to coordinate and direct economic activity. The role of government is limited.
B. Planned Economy: Economic decisions are made by the central economic planning authority.
C. Mixed Economy: Under the system, the economy relies on both the market system and certain forms

ProductMarkets
ResourceMarkets
Households Firms
Goods and Services
Goods and Services Consumptio
n Expenditure
Resource Expenditure
Revenues
Land, Labor, CapitalMoney
IncomeLand, Labor,
Capital
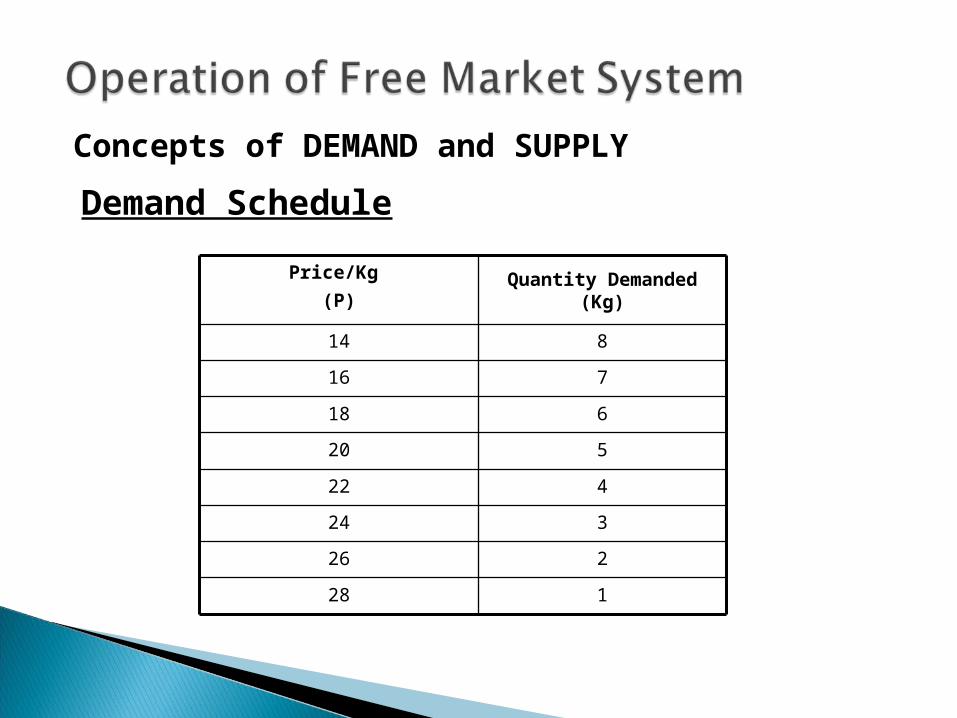
Concepts of DEMAND and SUPPLY
128226324422520618716814
Quantity Demanded (Kg)
Price/Kg (P)
Demand Schedule

14
16
18
20
22
24
26
28
30
1 2 3 4 5 6 7 8
Kilo of Mango
Pric
e/K
g of
Man
go (I
n pe
sos)
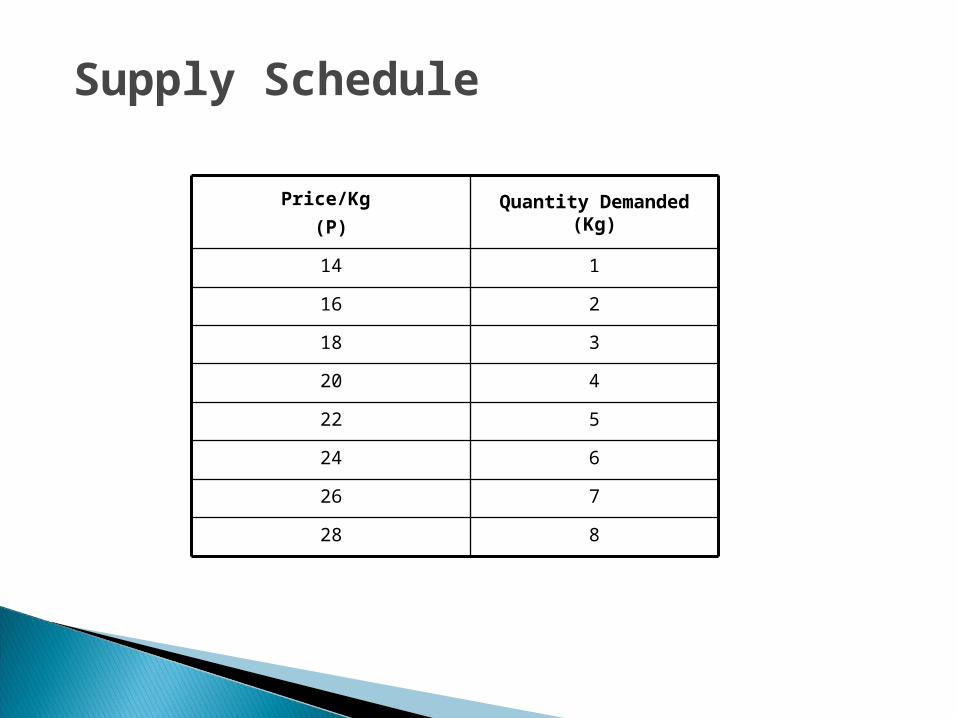
828726624522420318216114
Quantity Demanded (Kg)
Price/Kg (P)
Supply Schedule

14
16
18
20
22
24
26
28
30
1 2 3 4 5 6 7 8
Kilo of Mango
Pric
e/K
g of
Man
go (I
n pe
sos)

50
75
100
125
2 4 6

WAGERATE
UNITS OF LABOR
Wo
Lo
D
S
PRODUCT MARKET LABOR MARKET
PRICE
QUANTITY OF GOODS
Po
Qo
D
S

1. The good’s own price
Movement along the demand curve
2. Average income Shifts in the demand curve3. Population
4. Prices of related goods5. Tastes6. Special influences

PRICE
QUANTITY
D3D1
D2
Q3 Q1 Q2

PRICE
QUANTITY
S3 S1S2
Q3 Q1 Q2
Concept of Shift of SUPPLY Curve

1. The good’s own price
Movement along the supply curve
2. Technology Shifts in the supply curve3. Input Prices
4. Prices of related goods5. Market organizations6. Special influences

1. What goods to produce?• Consumers choose the goods and
producers produce them if the price is right
• Price represents value consumers attach to goods/services
2. How shall the goods be produced?• Producers will use the least costly
combination of inputs to maximize profit

3. For whom shall the goods be produced? Who gets the goods?
• Those who can pay for the goods• Those with more income will get more of
the goods• Income depends on ownership and price
of resources – land, labor, capital

1. Consumers maximize satisfaction or utility (subject to income, prices and taste)
2. Consumers choose combination of goods/services that maximizes their satisfaction

1. Suppliers maximize profit (subject to input prices, given budget and available technology)
2. Suppliers produce level of output such that cost of production equals price of that output

1. How does a consumer decide what to consume and in what quantity?• Consumer considers the costs and
benefits of consuming a good/service.• Consumer will consume up to point
where costs equal benefits• Consumer's decision is reflected in
demand curve – at each point in the demand curve the consumer is maximizing satisfaction

2. How does a producer decide on how and what quantity to produce?• Producer considers costs and benefits of
producing a good/service.• Producer chooses least costly combination
of inputs to produce a given level of output.• Producer will produce that level of output
where costs of producing a good is equal to the price of that good.
• Producer's decision is reflected in supply curve- at each point in the supply curve, producer is maximizing profit
Concepts of Economic Efficiency

3. What does equilibrium price and quantity imply?
• At equilibrium quantity supplied equals quantity consumed
• The benefit to consumer is equal to the cost to producer
• Efficiency of consumption and production is achieved or optional allocation of resources
Concepts of Economic Efficiency

1. Perfect information2. No joint consumption3. No externalities4. No economies of scale5. Self-interest is dominant motive6. Competition7. Freedom of entry or exit in the
market

• When any of the assumptions of perfectly competitive market is not met there is market failure
• When there is a market failure there is inefficiency in resource allocation
• When the market fails, government is justified to step in

• Imperfect information• Public goods• Externalities• Economies of scale

• Market system is impersonal – it takes existing distribution of income as given and distributes goods to those who have incomes
• Distribution of income depends on distribution and price of resources (land, labor, capital)
• Certain amount of inequality in the distribution of resources may be socially undesirable

1. There is market failure2. There is inequity3. Social benefits are greater than the
costs of eliminating/reducing inefficiency/inequity
Public intervention should be undertaken only when:

1. Most politicians do not seek to maximize efficiency but their chances of staying in power
2. Most bureaucrats seek to maximize their budget
3. Most special interest groups or individuals use governments to increase their real incomes
1. Special interest effects2. Short-time horizons of political
decisions – hidden costs – visible benefits concept
3. Non-selectivity4. Bureaucratic inefficiency

cost
COST
BENEFITS COST
BENEFITS

• What is the appropriate private-public sector mix
• How to minimize the sum of effects of both failures
Implications for Planning
1. Efficiency2. Equity3. Macroeconomic growth and
stability
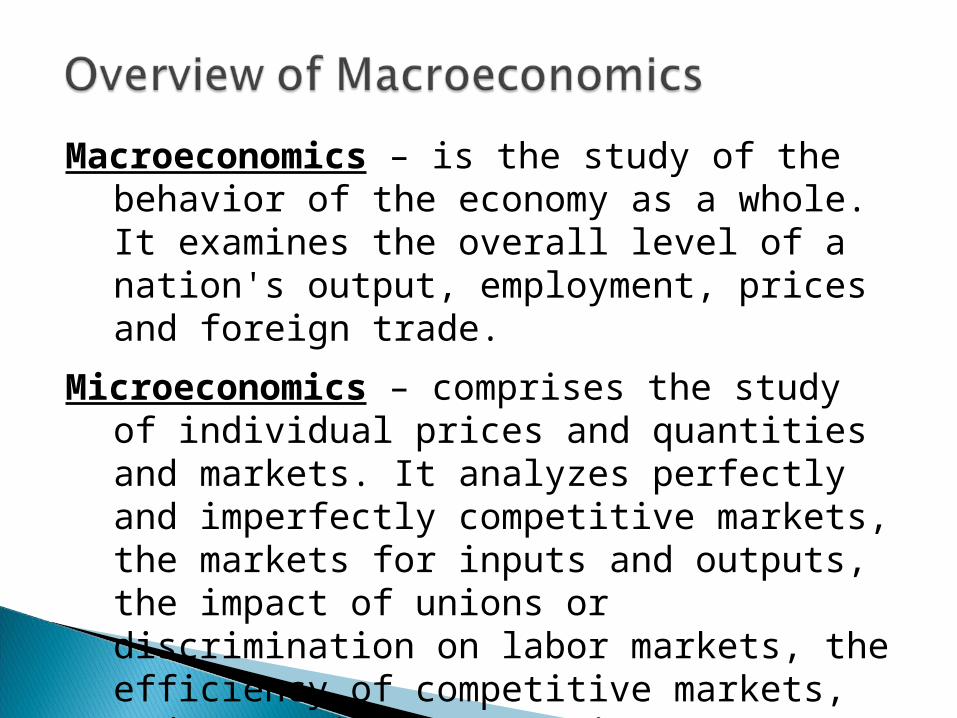
Macroeconomics – is the study of the behavior of the economy as a whole. It examines the overall level of a nation's output, employment, prices and foreign trade.
Microeconomics – comprises the study of individual prices and quantities and markets. It analyzes perfectly and imperfectly competitive markets, the markets for inputs and outputs, the impact of unions or discrimination on labor markets, the efficiency of competitive markets, and many similar questions.

OutputHigh levelRapid growth rate
EmploymentHigh level of employmentLow involuntary unemployment
Price-level stabilityWith free marketsRapid growth rate
International TradeExport and import equilibriumExchange rate stability
OBJECTIVES INSTRUMENTSFiscal policy
Government expenditureTaxation
Monetary policyControl of money supplyaffecting interest rates
Foreign EconomicsTrade policiesExchange rate intervention
Income policiesFrom voluntary wage-priceguidelines to mandatory controls

Is an economic variable under the direct or indirect control of
government; changes in policy instruments affect one or more of the macroeconomic objectives. That is to say, by changing monetary, fiscal and other policies governments can steer the economy toward a better mix of output, price stability, employment,
and foreign targets.

FISCAL POLICYConsists of government expenditures and taxation, government expenditures influence the relative size of collective as opposed to private consumption
Level Revenues Expenditures
National DOF recommends DBM -->DBCC recommendsCongress approves Congress approves
Local Provincial/City/Municipal Provincial/City/Municipal Treasurer Budget OfficerSP/SP/SB SP/SP/SB
How fiscal policies are formulated in the Philippines.

MONETARY POLICY Concerns with money supply. Changes in the
monetary supply move interest rates up or down and affect spending on items like machinery or buildings
Monetary Board – highest monetary policy making body
Bangko Sentral ng Pilipinas – implementing arm of Monetary Board

FOREIGN ECONOMIC POLICIES Trade policies, exchange rate setting, or even monetary and fiscal policies – attempt to keep imports in line with exports and to stabilize foreign exchange rates. Governments increasingly meet to coordinate their macroeconomic objectives and policies.
INCOME POLICIES Government actions that attempt to moderate inflation by direct steps, whether by verbal persuasion or by legislated wage and price controls. These policies have fallen out of favor in the low-inflation and conservative 1980s.

AGGREGATE SUPPLY (AS) Refers to the amount of total national output
that businesses willingly produce and sell in a given period. Aggregate supply depends upon the price level, upon businesses production capacity and upon the level of costs.

AGGREGATE DEMAND (AD)Refers to the total or aggregate quantity of
output that consumers, businesses, foreigners, and governments willingly spend in a given period. AD depends upon the level of prices and incomes, as well as upon policy variables such as monetary and fiscal policy.
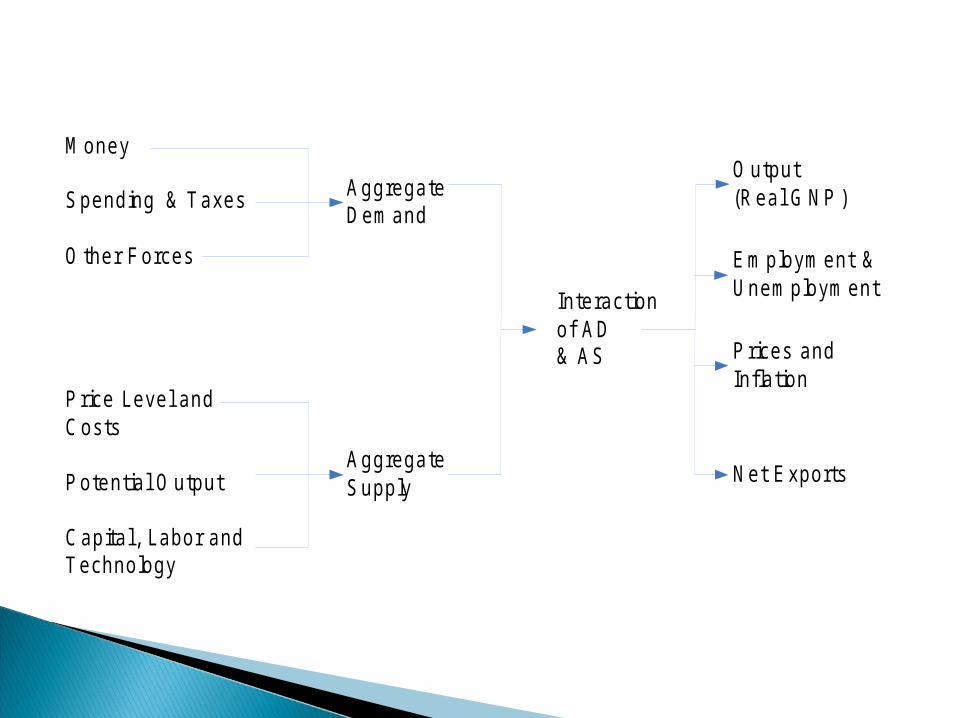
Money
Spending & Taxes
O ther Forces
Price Level and Costs
Potential O utput
Capital , Labor and Technology
Aggregate Demand
Aggregate Supply
Interactionof AD& AS
O utput(Real G NP )
Employment & Unemployment
Prices and Inflation
Net Exports
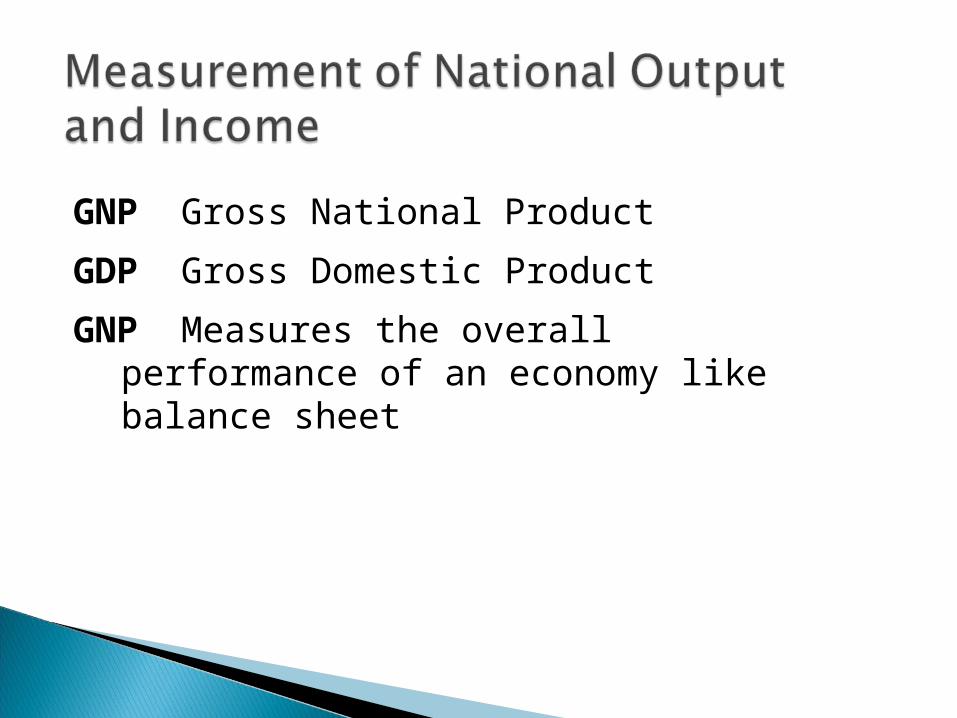
GNP Gross National ProductGDP Gross Domestic ProductGNP Measures the overall performance of
an economy like balance sheet

GROSS DOMESTIC PRODUCTThe value of all goods and services
produced domestically; the sum of gross value added of all resident institutional units engaged in production (plus any
taxes, and minus any subsidies, on products not included in the value of their
outputs).
WHAT IS GDP?

GROSS NATIONAL PRODUCTThe Gross Domestic Product adjusted
with the net factor income from the rest of the world. It refers to the aggregate
earnings of the factors of production (nationals) plus indirect taxes (net) and
capital consumption allowance.
WHAT IS GNP?

• Goods flow• Earnings
flow Consumption purchases (P)
F ina l goods and se rv ices
Productive services
W ages, ren ts , p ro fits , e tc .
BUSINESSHOUSEHOLDS

Difference between a firm's sales and its purchases of materials and
services from other firms.

1 2 3Stage of Production Value Added
(1) (2) (1) – (2) = (3)
Harvesting/Threshing 3.00 0.00 3.00Milling/Drying 5.00 -3.00 8.00Retailing 12.50 -5.00 17.50
Sales Receipts
Cost of Intermediate
Materials or Goods
VA Harvesting/Threshing – VA in Agriculture
VA Milling/Drying – VA in IndustryVA Retailing – VA in Services

PRODUCT APPROACH EARNINGS APPROACH
Components of GNP Earnings or costs as sources of GNP - Consumption (C) - Wages - Gross Investment, Domestic (I) - Interest, rent and other property income - Government (G) - Indirect taxes - Net Exports (X) - Depreciation
- Profits
GNP GNPless: Depreciation less: Depreciation = NNP = NNP
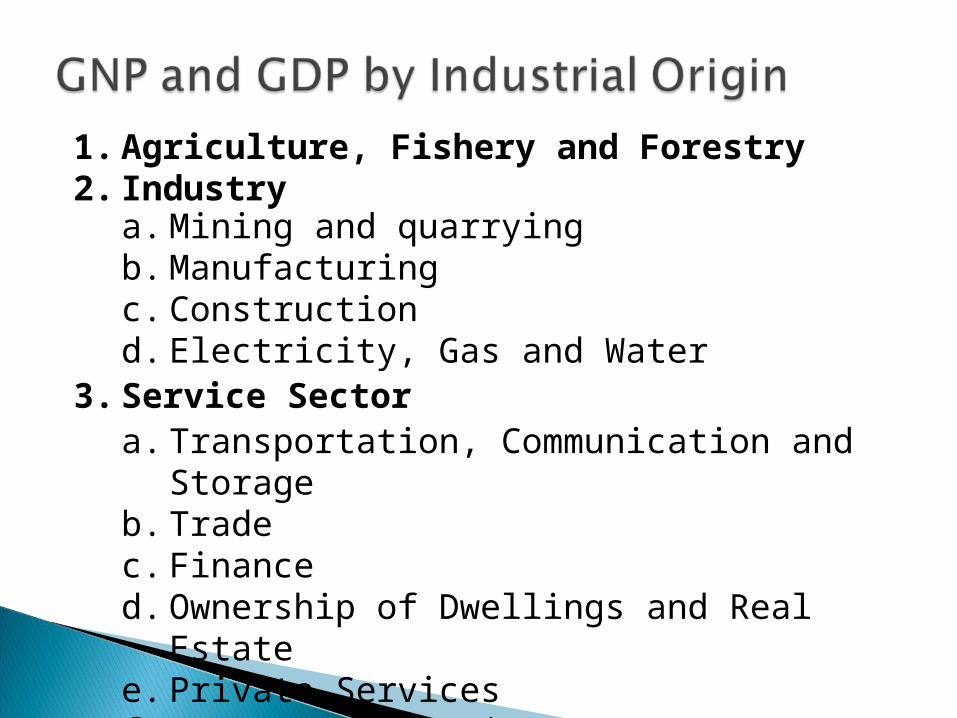
1. Agriculture, Fishery and Forestry2. Industry
a. Mining and quarryingb. Manufacturingc. Constructiond. Electricity, Gas and Water
3. Service Sectora. Transportation, Communication and
Storageb. Tradec. Financed. Ownership of Dwellings and Real Estatee. Private Servicesf. Government Services

1. Personal Consumption Expenditure (C)2. Government Consumption3. Capital Formation (I)
a. Constructionb. Durable equipmentc. Breeding stock and orchard development
Type of Expenditures
A. Fixed Capital
B. Changes in stock4. Exports (X)5. Less: Imports (M)6. Statistical discrepancy

• Consists of the additions to the nation's stock of buildings, equipment and inventories
• Gross investment = investment not adjusted for depreciation
Y = C + I + G + X -M

Gross Regional Domestic Product (GRDP) measures the goods and services produced in each of the geo-political regions of the country.
It is the regional share of the country’s Gross Domestic Product (GDP), the industries and factors that contribute to the regional economy, and indicates the pace at which the regional economy is moving on an annual basis.
The GRDP is compiled on an annual basis by the National Statistical Coordination Board.
WHAT IS GRDP?

It presents the contribution of the three major sectors to the regional economy; • Agriculture, Fishery & Forestry (AFF)• Industry• Service
WHAT IS GRDP?

These three major sectors are broken down into 12 subsectors:AFF
• Agriculture & Fishery• Forestry
WHAT IS GRDP?

INDUSTRY
• Mining & Quarrying
• Manufacturing• Construction• Electricity, Gas, & Water (EGW)
WHAT IS GRDP?

SERVICE• Transportation,
Communication & Storage (TCS)• Trade
• Finance• Ownership of Dwellings & Real Estate (ODRE)• Private Services• Government Services
WHAT IS GRDP?

Gross Regional Domestic Product of Western Visayas
07-08 08-094.3 5.9
Growth Rate (%)
2009 GRDP HIGHLIGHTS(Growth Rates)

Compared to GDP growth
Growth Rate (%)06-07 07-08 08-09
Philippines 7.1 3.7 1.1Western Visayas 7.7 4.3 5.9
2009 GRDP HIGHLIGHTS(Growth Rates)

Compared to GRDP growth of other regions
Rank07-08 08-09 2009
NCR METRO MANILA 4.7 (0.4) 14CAR CORDILLERA 1.7 2.0 8
I ILOCOS 2.0 (1.0) 12II CAGAYAN VALLEY 1.7 1.9 9
III CENTRAL LUZON 3.7 (1.4) 16IVA CALABARZON 1.9 (1.6) 17IVB MIMAROPA 3.0 0.6 13
V BICOL 4.1 8.2 1VI WESTERN VISAYAS 4.3 5.9 3
VII CENTRAL VISAYAS 3.3 0.8 12VIII EASTERN VISAYAS 3.4 1.8 10
IX ZAMBOANGA PENINSULA 2.0 6.8 2X NORTHERN MINDANAO 5.2 2.9 5
XI DAVAO REGION 3.7 5.4 4XII SOCCSKSARGEN 4.5 1.3 11
ARMM MUSLIM MINDANAO 1.6 2.6 7XIII CARAGA 2.7 2.7 6
Region Growth (%)
2009 GRDP HIGHLIGHTS(Growth Rates)

Regional contribution to national GDP growth rate of 1.1
Area/Region 2009 RankPhilippines 1.1
NCR -0.12 15CAR 0.04 8
ILOCOS 0.03 11CAGAYAN VALLEY 0.04 9CENTRAL LUZON -0.12 16
CALABARZON -0.19 17MIMAROPA 0.02 14
BICOL 0.23 3WESTERN VISAYAS 0.43 1
CENTRAL VISAYAS 0.05 6EASTERN VISAYAS 0.04 10
ZAMBOANGA PENINZULA 0.17 4
NORTHERN MINDANAO 0.15 5DAVAO REGION 0.24 2SOCCSKSARGEN 0.05 7
ARMM 0.02 13CARAGA 0.03 12
2009 GRDP HIGHLIGHTS(Contribution to GDP Growth)

Western Visayas
contribution to Gross Domestic
Product
% Contribution to GDP
2008 20097.3 7.6
2009 GRDP HIGHLIGHTS(Contribution to GDP Growth)

Regional contribution
to Gross Domestic Product
Region % Distribution07-08 08-09
NCR 33.0 35.2CAR 2.2 2.2
ILOCOS 2.9 2.8CAGAYAN VALLEY 2.0 2.0CENTRAL LUZON 8.3 8.1
CALABARZON 11.9 11.6MIMAROPA 2.7 2.7
BICOL 2.8 3.0WESTERN VISAYAS 7.3 7.6CENTRAL VISAYAS 7.1 7.1EASTERN VISAYAS 2.1 2.1
ZAMBOANGA PENINZULA 2.5 2.7
NORTHERN MINDANAO 5.0 5.1DAVAO REGION 4.5 4.7SOCCSKSARGEN 3.5 3.5
ARMM 0.9 0.9CARAGA 1.3 1.3
2009 GRDP HIGHLIGHTS(Contribution to GDP Growth)

SectorGrowth Rate
(%)07-08 08-09
Agriculture, Fishery & Forestry 3.9 2.6Industry 8.8 12.0Service 2.0 4.1
2009 GRDP HIGHLIGHTS(Sectoral Performances)

Sector/Subsector Growth Rate (%)07-08 08-09
Agriculture, Fishery & Forestry 3.9 2.6 Agriculture & Fishery 3.9 2.6 Forestry 85.3 7.8
2009 GRDP HIGHLIGHTS(Sectoral Performances)

Sector/Subsector Growth Rate (%)07-08 08-09
Industry 8.8 12.0 Mining & Quarrying 7.5 45.5 Manufacturing 9.0 5.8 Construction 8.9 13.8 Electricity & Water 9.5 3.1
2009 GRDP HIGHLIGHTS(Sectoral Performances)
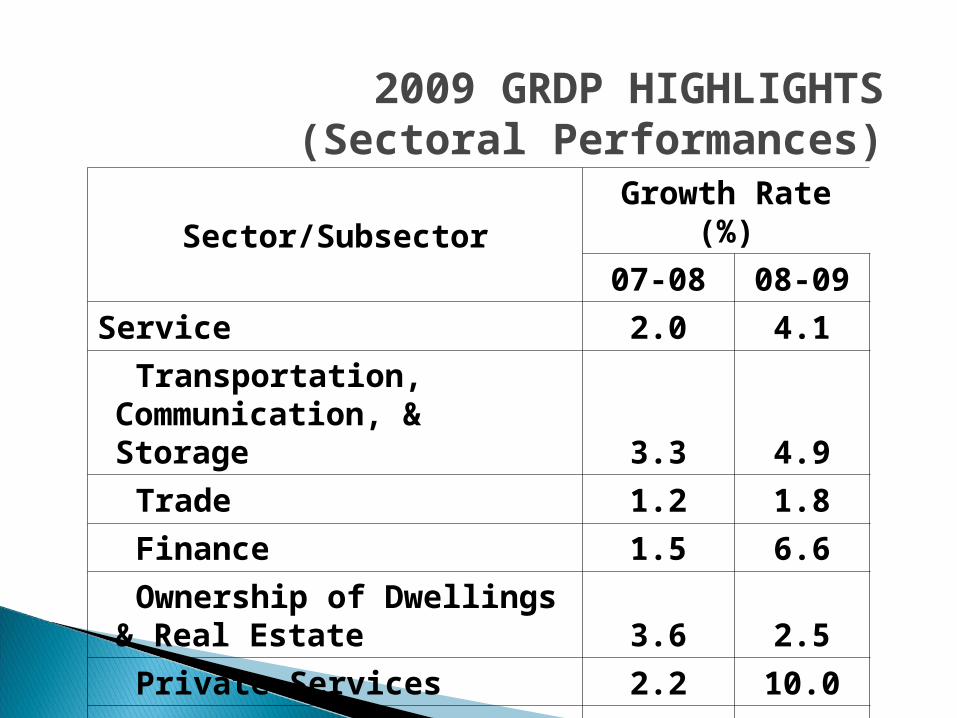
Sector/SubsectorGrowth Rate
(%)07-08 08-09
Service 2.0 4.1 Transportation, Communication, & Storage 3.3 4.9
Trade 1.2 1.8 Finance 1.5 6.6 Ownership of Dwellings & Real Estate 3.6 2.5
Private Services 2.2 10.0 Government Services 4.3 5.9
2009 GRDP HIGHLIGHTS(Sectoral Performances)

INDUSTRY 07-08 08-09
I. AGRI.,FISHERY,FORESTRY 1.0 0.7 a. Agriculture and Fishery 1.0 0.7 b. Forestry 0.0 0.0
II INDUSTRY SECTOR 2.3 3.3 a. Mining and Quarrying 0.3 1.6 b. Manufacturing 1.5 1.0 c. Construction 0.4 0.6 d. Electricity and Water 0.2 0.1
III SERVICE SECTOR 1.0 2.0 a. Transportation,
Communication & Storage 0.2 0.3 b. Trade 0.3 0.4 c. Finance 0.0 0.2 d. Ownership of Dwellings &
Real Estate 0.2 0.1 e. Private Services 0.2 0.7 f. Government Services 0.1 0.2
GROSS DOMESTIC PRODUCT 4.3 5.9
2009 GRDP HIGHLIGHTS(Contributors to GRDP Growth)
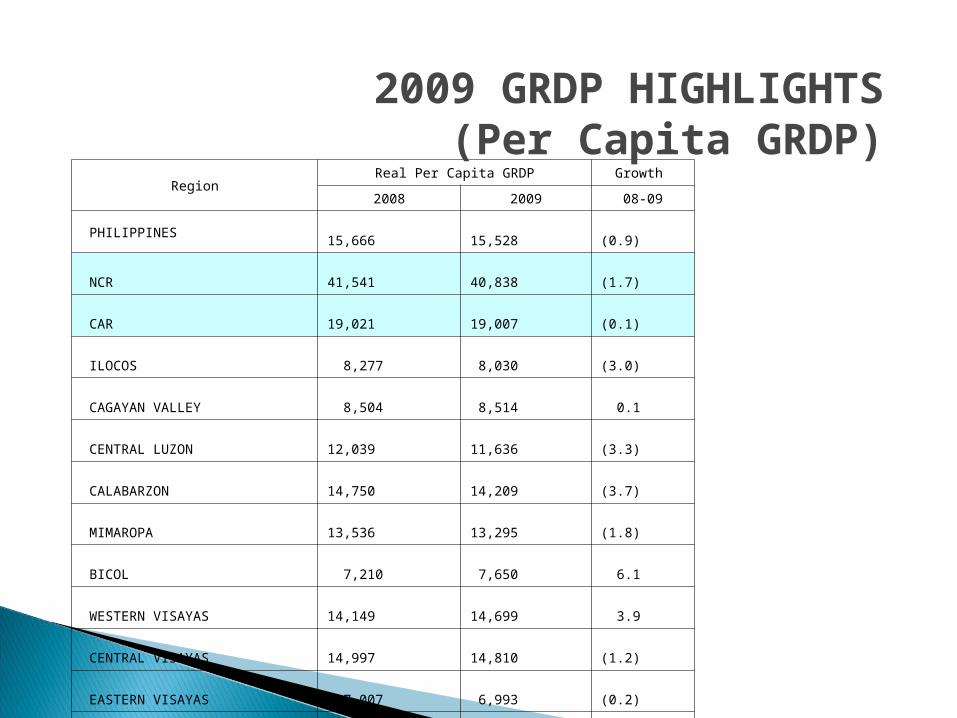
RegionReal Per Capita GRDP Growth
2008 2009 08-09 PHILIPPINES 15,666 15,528 (0.9) NCR 41,541 40,838 (1.7) CAR 19,021 19,007 (0.1) ILOCOS 8,277 8,030 (3.0) CAGAYAN VALLEY 8,504 8,514 0.1 CENTRAL LUZON 12,039 11,636 (3.3) CALABARZON 14,750 14,209 (3.7) MIMAROPA 13,536 13,295 (1.8) BICOL 7,210 7,650 6.1 WESTERN VISAYAS 14,149 14,699 3.9 CENTRAL VISAYAS 14,997 14,810 (1.2) EASTERN VISAYAS 7,007 6,993 (0.2) ZAMBOANGA PENINSULA 10,671 11,173 4.7 NORTHERN MINDANAO 17,042 17,183 0.8 DAVAO REGION 15,139 15,696 3.7 SOCCSKSARGEN 12,782 12,665 (0.9) MUSLIM MINDANAO 3,563 3,572 0.3 CARAGA 7,525 7,579 0.7
2009 GRDP HIGHLIGHTS(Per Capita GRDP)

Subsector’s share to total AFF
2009 GRDP HIGHLIGHTS(Percent Shares)

Subsector’s share to total Industry
2009 GRDP HIGHLIGHTS(Percent Shares)

Subsector’s share to total Service
2009 GRDP HIGHLIGHTS(Percent Shares)

WHAT IS consumer price index?
CPI is a statistical measure of the change in the
average retail prices of goods and services
commonly purchased by a particular group of people in
a particular area

Features of the present series of CPI
The existing series of the CPI has the following features:•The present base year is 2000•In terms of geographic area covered, the present series is computed by province, by region, and for the Philippines. A separate CPI for Metro Manila is also computed•The CPI covers all income households

Features of the present series of CPI
The existing series of the CPI has the following features:•The basis of weights in coming up with CPI is the Family Income and Expenditures Survey or popularly known as FIES conducted by NSO

Features of the present series of CPI
The existing series of the CPI has the following features:•A very important concept in CPI computations is market basket, which contains a sample of items selected to represent the composite price behavior of all goods and services purchased by consumers, taking into account area and brand preferences for commodities typically consumed by the households

WHAT IS inflation rate?
IR = x 100Present CPI – Past CPI
Past CPI
IR = x 100 = 2.9%
165.8 – 161.2161.2
IR is the annual rate of change or the year change in CPI. It shows
how fast or slow the CPI increases or decreases.
IR for September 2010 is computed as follows:

WHAT do we mean by purchasing power of peso?
PPP shows how much the peso in the base period is worth in another period. It gives an indication of the
real value of the peso in a given period relative to the peso value in
the base period.
PPP = x 100 = 0.60
1165.8

WHAT do we mean by purchasing power of peso?
PPP = x 100 = 0.60
1165.8

What is the difference between family and household
FAMILYA group of persons usually living together and composed of the head and other persons related to the head by blood, marriage or adoptionA single person living alone is
considered as a separate family

What is the difference between family and household
HOUSEHOLDAn aggregate of persons, generally but not necessarily bound by ties of kinship, who live together under the same roof and eat together or share in common the household foodA person who lives alone is considered a separate household

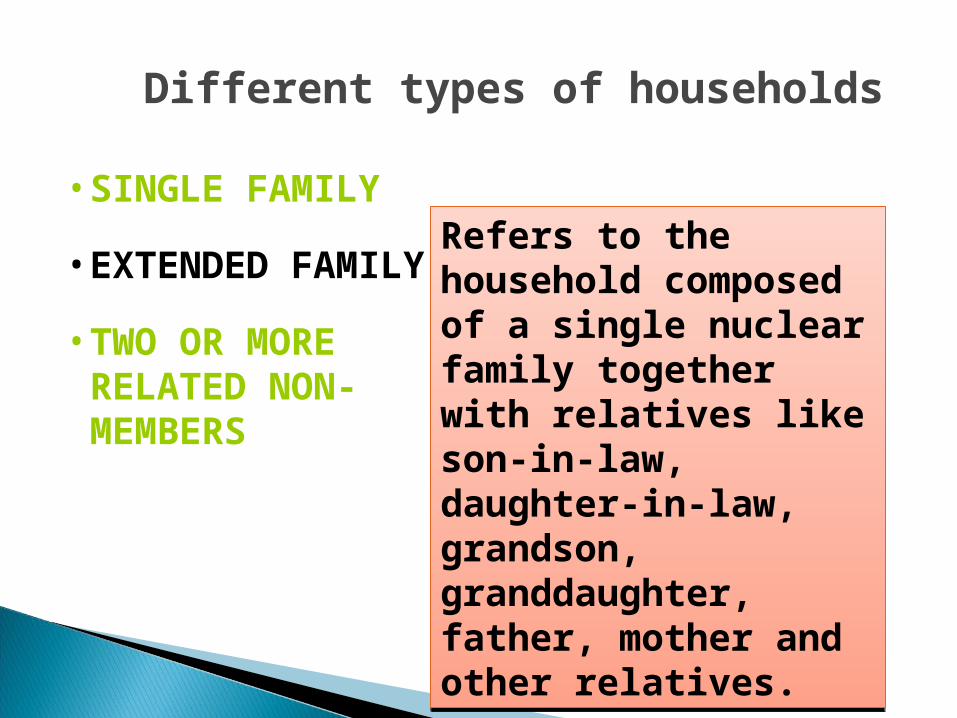
Different types of households
• SINGLE FAMILY
• EXTENDED FAMILY
• TWO OR MORE RELATED NON-MEMBERS

Different types of households
• SINGLE FAMILY
• EXTENDED FAMILY
• TWO OR MORE RELATED NON-MEMBERS
Refers to the household composed of a single nuclear family. For purposes of the survey, a single person household is considered as single family. Also considered are unmarried sisters and brothers who are living together as one household.
Different types of households
• SINGLE FAMILY
• EXTENDED FAMILY
• TWO OR MORE RELATED NON-MEMBERS
Refers to the household composed of a single nuclear family together with relatives like son-in-law, daughter-in-law, grandson, granddaughter, father, mother and other relatives.

Different types of households
• SINGLE FAMILY
• EXTENDED FAMILY
• TWO OR MORE RELATED NON-MEMBERS
Refers to the household with two or more non-related families or two or more persons not related to each other by blood, marriage or adoption.

• Salaries and wages from employment• Commissions, Tips, Bonuses• Family and clothing allowance• Transportation and representation allowance• Honoraria• Other forms of compensation an net receipts
derived from the operation of family-operated enterprises/activities and the practice of a profession or trade
What do we mean by family income?Family Income includes primary
income and receipts from other sources received by all family members during the calendar year, as participants in any economic activity or as recipients of transfers, pensions, grants, etc.
PRIM
ARY
INCO
ME

• Imputed rental values of owner-occupied dwelling units
• Interests• Rentals including landowner’s share of
agricultural products• Pensions• Support and the value of food and non-food items
received as gifts by the family• Receipts from family sustenance activities not
considered as family operated enterprise
What do we mean by family income?Family Income includes primary
income and receipts from other sources received by all family members during the calendar year, as participants in any economic activity or as recipients of transfers, pensions, grants, etc.
OTH
ER
SOU
RCES

What do we mean by family expenditures?
Refer to the expenses or disbursements made by the family purely for personal consumption during the calendar year. They
exclude all expenses in relation to farm or business operations,
investment ventures, purchase of real property and other
disbursements, which do not involve personal consumption

What IS LABOR FORCE?The population 15 years old and over
whether employed or unemployed who contribute to the production of goods and services in the country
Labor Force Participation RateProportion in percent of the total number of
persons in the labor force to the total population 15 years old and over
LFPR = x 100 = 63.6%
3,0534,082

What DOES BEING EMPLOYED MEAN?
AT WORKThose who do any work even for 1 hour
during the reference period for pay or profit, or work without pay in the farm or business
enterprise operated by a member of the same household related by blood, marriage
or adoption
Include all those who, during the reference period are 15 years old and over as of their last birthday and are
reported either:

What DOES BEING EMPLOYED MEAN?
Include all those who, during the reference period are 15 years old and over as of their last birthday and are
reported either: WITH A JOB BUT NOT AT WORK
Those who have a job or business but are not at work because of temporary illness/injury, vacation or other reasons. Likewise, persons
who expect to report for work or to start operation of a farm or business enterprise
within 2 weeks from the date of the enumerator’s visit, are considered employed
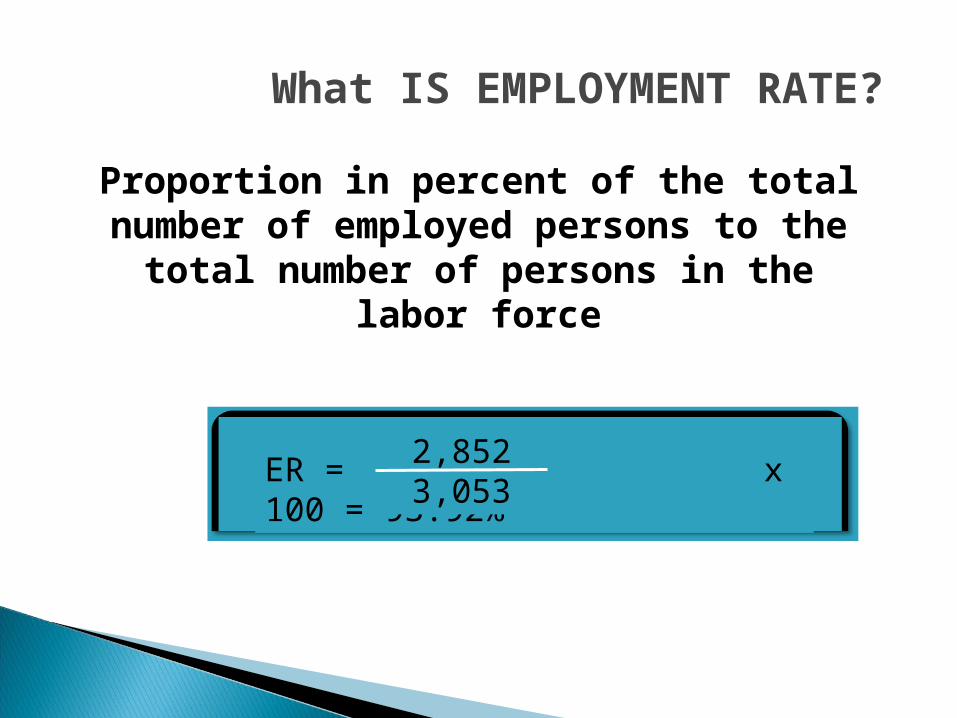
What IS EMPLOYMENT RATE?
Proportion in percent of the total number of employed persons to the total number of persons in the labor
force
ER = x 100 = 93.92%
2,8523,053
What DOES BEING UNEMPLOYED MEAN?
WITHOUT WORKHad no job or business during the basic survey
reference period.
Include all persons who are 15 years old and over as of their last birthday
and are reported as;

What DOES BEING UNEMPLOYED MEAN?
CURRENTLY AVAILABLE FOR WORKAvailable and willing to take up work in paid employment or self-employment
during the basic survey reference period, and/or would be available and willing to
take up work in paid employment or self-employment within 2 weeks after the
interview date.
Include all persons who are 15 years old and over as of their last birthday
and are reported as:

What DOES BEING UNEMPLOYED MEAN?Include all persons who are 15 years
old and over as of their last birthday and are reported as:
SEEKING WORKTook specific steps to look for a job or establish a business during the basic
survey reference period or not seeking work due to the following reasons: (a)
tired/believe no work available; (b) awaiting results of previous job application;
(c) temporary illness/disability; (d) bad weather; and (e) waiting for rehire/job
recall

What IS UNEMPLOYMENT RATE?
Proportion in percent of the total number of unemployed persons to the total number of persons in the
labor force
UR = x 100 = 6.58%
2013,053

What DOES UNDEREMPLOYED MEAN?Invisible Underemployment
Include all employed persons who express the desire to have additional hours of work in their present job or an additional job, or to have a new
job with longer working hours
Visible UnderemploymentThose who worked for less than 40 hours
during the reference period and want additional hours of work

What IS UNDEREMPLOYMENT RATE?
Proportion in percent of the total number of underemployed persons to
the total number of employed persons
UnR = x 100 = 26.6%
7602,852

Good Day to Everyone!!!