basic data quality assurance techniques using sas a guide for the analyst on a deadline kevin druhan...
TRANSCRIPT
Basic Data Quality Assurance Techniques using SAS
A Guide for the Analyst on a Deadline
Kevin DruhanWait Time Improvement OfficeNova Scotia Department of [email protected]

Agenda
• What is Data Quality and why is it important?
• A basic approach to performing data quality analysis for the working statistician
• The %FREQALL macro
SAS Experience• SAS User for 6 years• Attended SAS Global Forum in 2006 and 2008• Past roles
– Data Manager, Population Health Research Unit, Dalhousie• Data quality assurance for over 3 million health records per month• Re-encrypting personal identifiers for 250 million+ health records
– Clinical Data Manager, Department of Surgery, Capital Health• Cleaning and analyzing clinical trial data
– Research Analyst, NS Department of Health• Cleaning and submitting almost 1 million health records to CIHI
Home Care Reporting System (250+ fields)• De-identification of 40Gb of health data for data migration to new
application• Cleaning and analyzing survey data – making sense of messy
data

Data Quality Assurance
• Definition:
Data quality assurance is the process of profiling data to discover inconsistencies, and other anomalies in the data and performing data cleansing activities to improve the data quality. – Wikipedia (Jan 2009)
• “Making sure your dataset contains what you expect.”– Kevin Druhan

Why is Data Quality Important?
• Garbage in = Garbage out– Data integrity
• Spurious data can distort or ruin your analysis– Eg. Outliers when calculating average wait times
• Unprofessional-looking reports with weird results– Personal integrity
• If you don’t understand your data, how can you expect anybody to rely on your analysis?

Data Quality - A Continuum
• Typical data quality ‘camps’“I don’t have time to fix problems in the data”“I fix problems as I find them”“I always thoroughly investigate my data before doing any analysis”
• Time and resource constraints often restrict the analyst’s ability to do comprehensive data quality analysis (ie. Deadlines)
Data Quality Excellent Poor
321
1
2
3
Any DQ is better than none!Any DQ is better than none!

A Basic Approach to Improving Data Quality for Fun and Profit
1. Take a close look at your data
2. Clean data by correcting errors programmatically using SAS code
3. Check data integrity by testing relevant business rules programmatically using SAS code
4. Check data integrity by cross-linking or performing other validation exercises if possible

1. Take a close look at your data• Frequency analysis – what’s in your dataset?
– For discrete or categorical variables, PROC FREQ is your basic tool
• Understand distribution of the data, eg.– Number of male / Number of female– Number of patients living in Halifax compared to Sydney
• Identify incorrect dates, missing values, etc
– For continuous data, use PROC UNIVARIATE to generate a picture of the distribution of data

PROC UNIVARIATE• distribution of continuous data• highs / lows• missing values
PROC UNIVARIATE• distribution of continuous data• highs / lows• missing values

2. Correct obvious errors programmatically using SAS code• Based on your analysis from Step 1,
– Decide on an approach to dealing with bad data• Recode incorrect data elements
– Data entry errors– Incorrect dates
• Parse character fields and pull out any garbage characters
• Set variable values to missing?• Drop entire observations?• Etc..
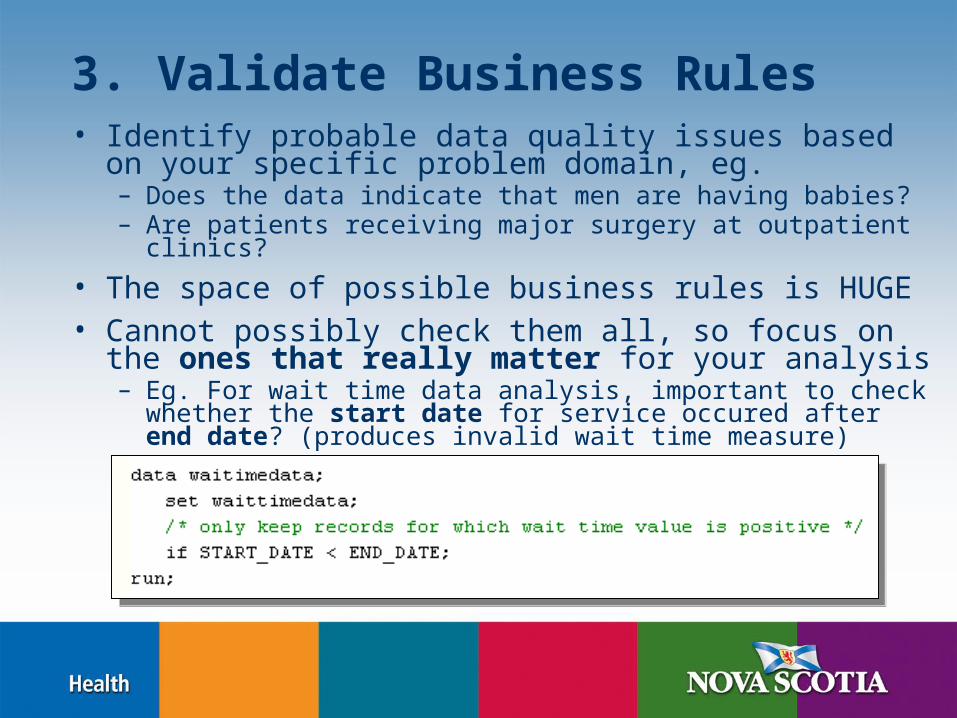
3. Validate Business Rules• Identify probable data quality issues based on your
specific problem domain, eg.– Does the data indicate that men are having babies?– Are patients receiving major surgery at outpatient clinics?
• The space of possible business rules is HUGE• Cannot possibly check them all, so focus on the ones that
really matter for your analysis– Eg. For wait time data analysis, important to check whether the
start date for service occured after end date? (produces invalid wait time measure)
4. Cross-validate your data
• If you have any other data which could be linked to your data, use it to cross-validate– Eg. Linking Healthcare Service Episode
data with Patient Registry data• Ie. Hospital visit data with MSI demographic
data– Does patient even exist in both datasets?
The %FREQALL macro
The only DQ tool you’ll ever need™
Disclaimer: Not the only DQ tool you’ll ever need
%FREQALL macro
• Presentation at SAS Global Forum 2008 in San Antonio, Texas– Start Improving Your Data Quality with
%FreqAll by Toby Dunn, Dunn Consulting– “…designed to deliver a fast and easy first
glance at data values and quality.”

Why use %FREQALL over PROC FREQ?
• Some great options to help control your output– If you have a large number of variables AND
many variables have a large number of possible values, PROC FREQ often produces unmanageable results• You could specify the exact variables you want
to see (tedious for many variables), or create workarounds
– Why bother when you can %FREQALL?
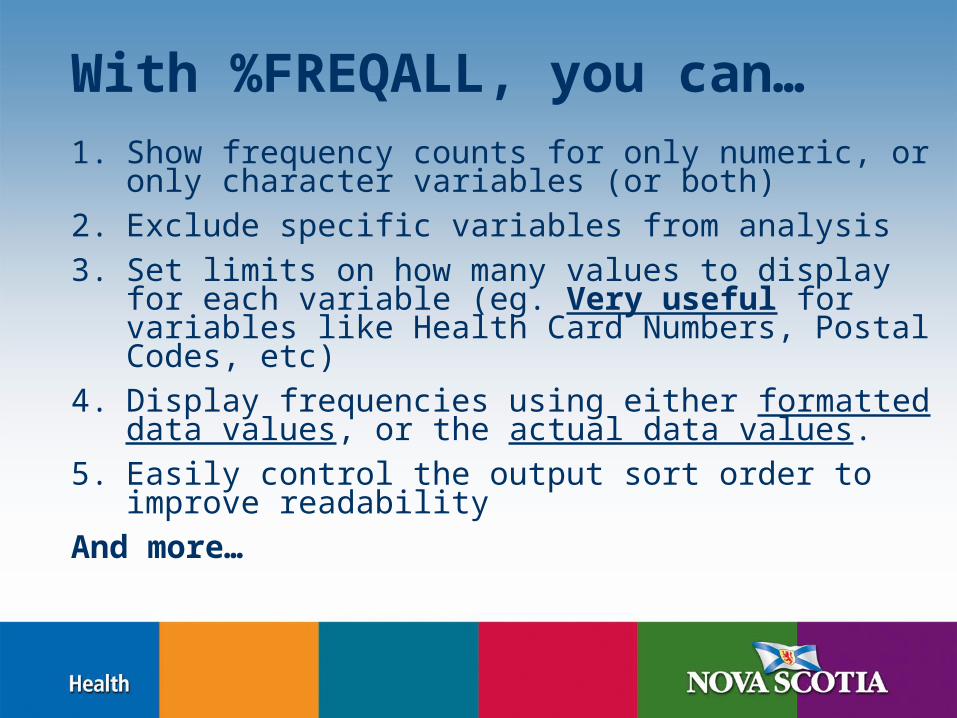
With %FREQALL, you can…1. Show frequency counts for only numeric, or only
character variables (or both)
2. Exclude specific variables from analysis
3. Set limits on how many values to display for each variable (eg. Very useful for variables like Health Card Numbers, Postal Codes, etc)
4. Display frequencies using either formatted data values, or the actual data values.
5. Easily control the output sort order to improve readability
And more…

The 9 %FREQALL Parameters
1. Lib - SAS libname
2. Mem – SAS dataset filename
3. Vars – list of variables you want to see
4. Excludevars – list of variables you don’t want to see
5. LevelLimit – maximum # of values to show for each variable
6. NObs2View – Number of topmost/bottommost values to show
7. Format – use variable formatting when displaying?
8. Order – how to order the results?
9. DataOut – output SAS dataset
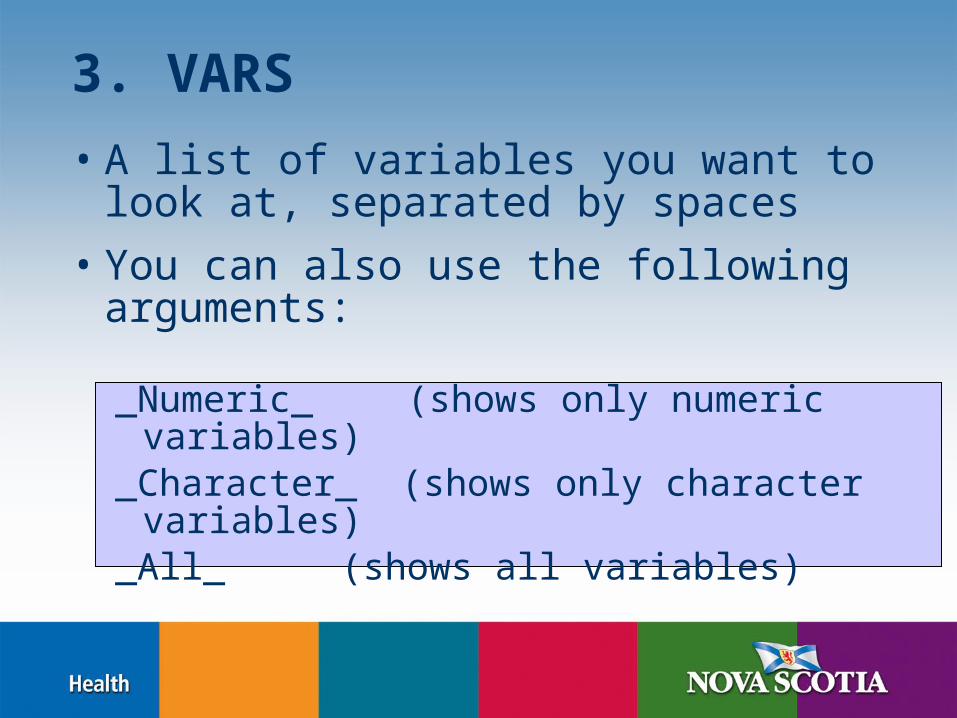
3. VARS
• A list of variables you want to look at, separated by spaces
• You can also use the following arguments:
_Numeric_ (shows only numeric variables)_Character_ (shows only character variables)_All_ (shows all variables)

4. ExcludeVars
• A list of variables you don’t want to look at, separated by spaces
• Example:– “I want to look at the contents of all the
character-type fields, except the Health Card Number field”
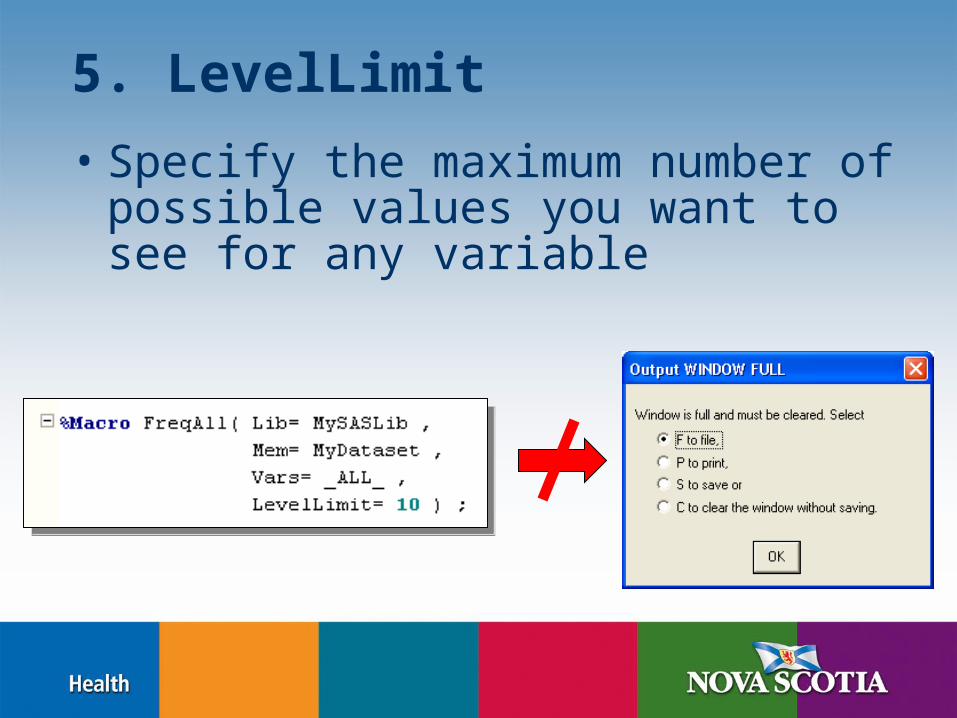
5. LevelLimit
• Specify the maximum number of possible values you want to see for any variable
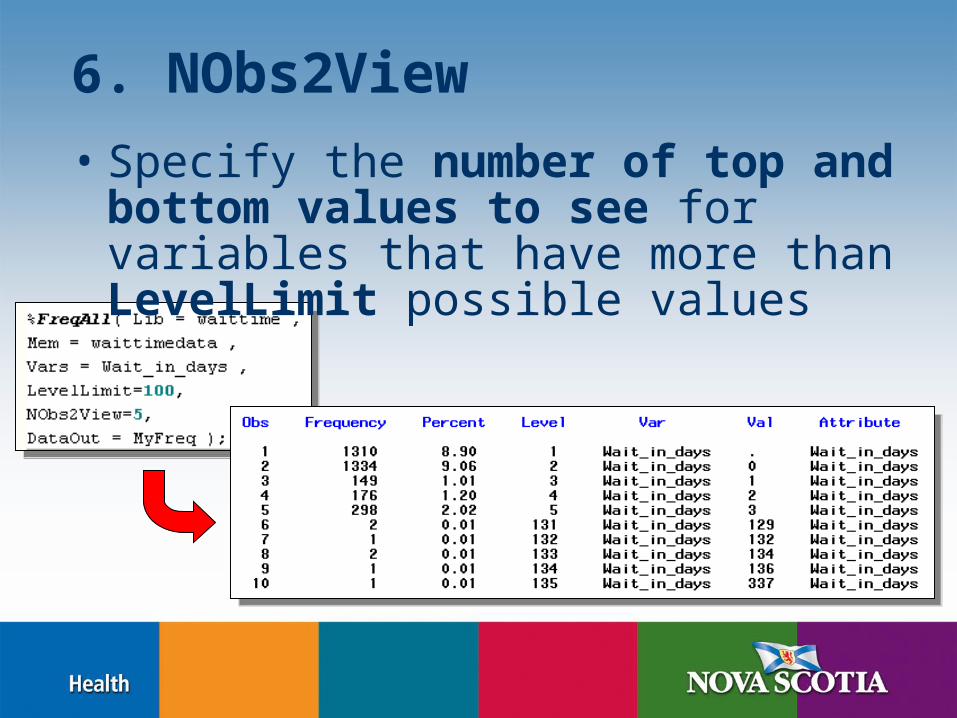
6. NObs2View
• Specify the number of top and bottom values to see for variables that have more than LevelLimit possible values
7. Format
• Specify whether or not to display the frequency counts using the variable’s format
• Options YES or NO (default = YES)

8. Order
• Specify how to order the output of your frequency table
• Options– Internal sort by actual data values– Formatted sort by formatted data values– Data sort by order of occurrence– Freq sort by descending frequency

9. DataOut
• Specify the name of the output SAS dataset for the results of your frequency analysis

A Typical %FREQALL call
5. LevelLimit – if there are more than 500 posible values for a variable, don’t show me them all…
6. NObs2View – …show me the top 50 and bottom 50
7. Format – I want to look at the raw, unformatted data first
8. Order – order by raw unformatted data values
9. DataOut – put the results into a dataset called MyFreqOut which I can then print, PDF, etc.
1. Lib - SAS libname
2. Mem – SAS dataset filename
3. Vars – I want to look at everything in the dataset
4. ExcludeVars – I am not interested in the Referral_date field
Playing with the Big Boys:SAS Data Quality Solution®
• Full-featured DQMS (Data Quality Management Solution)– Data profiling capabilities– Cleansing and standardization– Matching and deduplication– Identification analysis– Data quality rule customization– International support– A component of SAS Data Integration
• Participated in the Hands-On Workshop offered at SAS Global Forum 2008
Conclusion
• Data quality analysis is an important, but often overlooked aspect of statistical analysis and reporting
• Adding a simple frequency analysis step to your programs will improve the reliability of your reports substantially
• Although Base SAS contains everything you need to do basic frequency analysis, the %FREQALL macro is a low-cost (ie. free) and superior alternative to PROC FREQ.

Additional Resources
• For more information, read the SAS Global Forum paper at
• IMPORTANT: Add the following SAS code to the top of your program to avoid ERRORS!
http://www2.sas.com/proceedings/forum2008/007-2008.pdfhttp://www2.sas.com/proceedings/forum2008/007-2008.pdf