basic cash flow analysisttsmedia.ttstrain.com/cashflowclb012116.pdf1/21/2016 1 basic cash flow...
TRANSCRIPT

1/21/2016
1
BASIC CASH FLOW ANALYSIS
January 21, 2016
1
CASH FLOW
NET PROFITS DON’T REPAY LOANS
What will your customer do with the loan proceeds?
How much will your customer need to borrow?
When will your customer be able to generate enough cash to repay the loan?
2

1/21/2016
2
CASH FLOW
Net profit line on income statement will not answer these questions
Net profits are not cash; they are the result of accounting techniques and policies
Cash and only Cash can repay loans
3
OPEN DISCUSSION
HOW DO YOU DEFINE CASH FLOW?
WHEN DO YOU USE CASH FLOW ANALYSIS?
4
1/21/2016
3
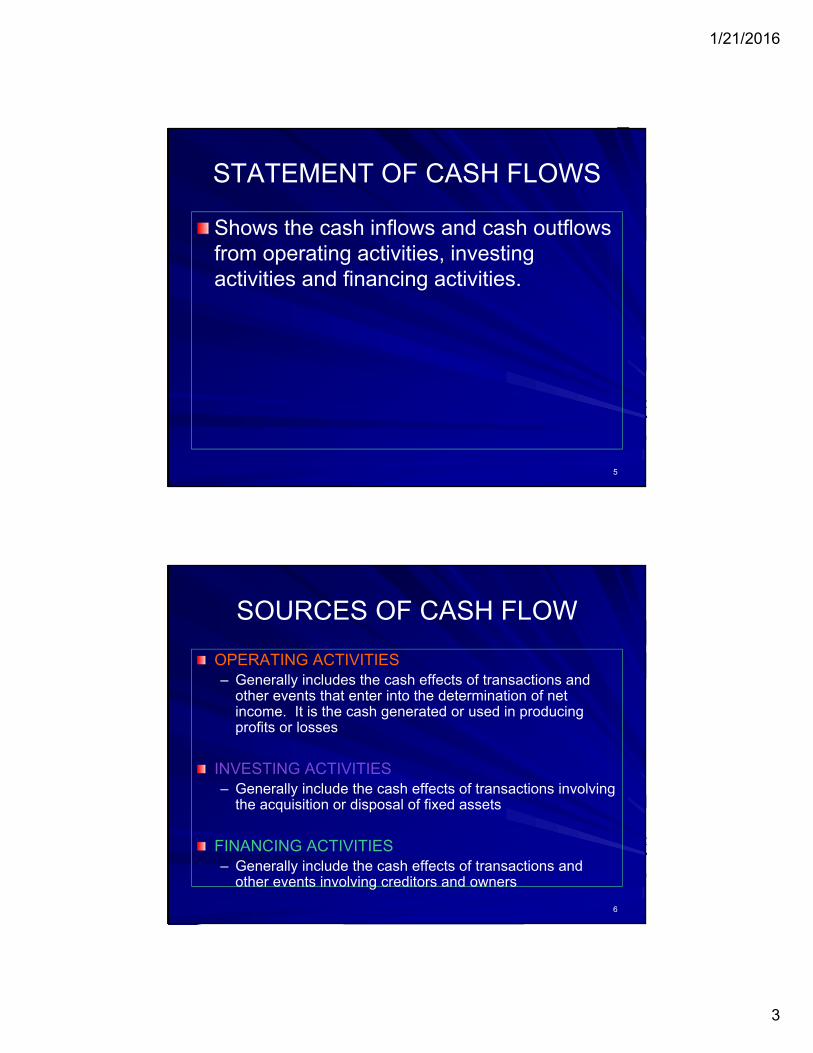
STATEMENT OF CASH FLOWS
Shows the cash inflows and cash outflows from operating activities, investing activities and financing activities.
5
SOURCES OF CASH FLOW
OPERATING ACTIVITIES– Generally includes the cash effects of transactions and
other events that enter into the determination of net income. It is the cash generated or used in producing profits or losses
INVESTING ACTIVITIES– Generally include the cash effects of transactions involving
the acquisition or disposal of fixed assets
FINANCING ACTIVITIES– Generally include the cash effects of transactions and
other events involving creditors and owners
6

1/21/2016
4
CASH FLOW
Cash can come from:– Profits– Sales of assets– Infusion of capital– Loan proceeds– Extensions of additional credit from suppliers
Our challenge is to identify cash inflows/outflows, analyze what has caused them and which ones are most significant, and how future cash flow may differ from the past.
7
SOURCES OF CASH FLOW
INCOME STATEMENT– Sources
Sales/RevenueOther IncomeGain of Sale of Assets
– UsesCost of Goods SoldOperating ExpensesInterest ExpenseIncome taxesLoss on Sale of Assets and Other Expenses
8

1/21/2016
5
SOURCES OF CASH FLOW
Sources and Uses of Cash can be determined from the Balance Sheet also.
It records the place cash was either generated or spent
In order to determine this you must know the Rules of Cash Flow
9
RULES OF CASH FLOWBALANCE SHEET
INCREASE DECREASE SOURCE USE
Asset X
Asset X
Liability X
Liability X
Net Worth X
Net Worth X
10

1/21/2016
6
CASH VS. ACCRUAL
Accrual Bal Sheet Adj. Cash Flow
Sales 1,000,000 (400,000) A/R 600,000
COGS (700,000) 300,000 A/P (400,000)
Gross Prof 300,000 200,000
Oper. Exp. (200,000) 100,000 A/E (100,000)
Pre-Tax Inc 100,000 100,000
Income Tax (34,000) 14,000 ITP (20,000)
Net Income 66,000 80,000
11
A.S. FINDUS COMPANY
12

1/21/2016
7
Traditional Cash Flow
2005 2006
Net Profit 51 115+Depreciation 111 154+Interest 41 54
Available Cash Flow 203 323/CPLTD + Interest 67 77
Debt Coverage Ratio 3.03x 4.19x
13
3 Fallacies with this approach
1. It is Income Statement Focused Only
2. It covers operations for one year only
3. We bankers think “we are all that” because we believe our customers will pay us first from Available Cash Flow before their Payroll and Suppliers
14

1/21/2016
8
UCA CASH FLOW ANALYSIS
Explanation of UCA Form
15
TARGET POINTS 1 & 2Sales 11,025
*Accounts Receivable (311)
Cash Collected-Sales 10,714
Cost of Sales (-Dep.) (8,240)
*Inventory (443)
*Accounts Payable 234
Cash Paid for Product (8,449)
Cash Fr. Trading Act. 2,26516

1/21/2016
9
TARGET POINT 3
SG& A Exp. (- Dep/Int) (2,399)
*Prepaid Expenses (7)
*Accrued Expenses 95
Cash Paid For Operations (2,311)
Cash After Operations (45)
17
TARGET POINT 4Other Income (Exp.) 14
*Other Assets & Liabs. (14)
Income Tax Expense (77)
*Deferred Taxes 0
*Income Taxes Payable (2)
Other Inc/Exp/Taxes (79)
Net Cash After Operations (124)
18

1/21/2016
10
TARGET POINTS 5 & 6Interest Expense (54)
*Interest Payable 1
Dividends Declared (30)
*Dividends Payable 30
Cash Paid for Div/ Int. (53)
Cash After Financing (177)
Less: CPLTD (23)
Cash After Debt Amor (200)19
Reconciliation of Retained Earnings
Beginning Retaining (end of 2005) 915
+Profits for 2006 115
Expected Ending Ret. Earn. 1,030
Actual Ending Ret. Earn. 1,000
Rule:
If the Actual < Expected, you have one question
“Who took the money”
20

1/21/2016
11
TARGET POINT 7*Fixed Assets (232)
*Investment 0
*Intangibles 0
Cash Paid Plant & Invest. (232)
Financing Surplus/
(Requirement) (432)
21
Reconciliation of Net Fixed Assets
Beginning NFA 533- Current Year’s Depreciation (154)
Expected Ending NFA 379
Actual Ending NFA 611
Difference (232)
Rule:
If the Actual > Expected = Bought Assets
If the Actual < Expected = Sold Assets22
1/21/2016
12
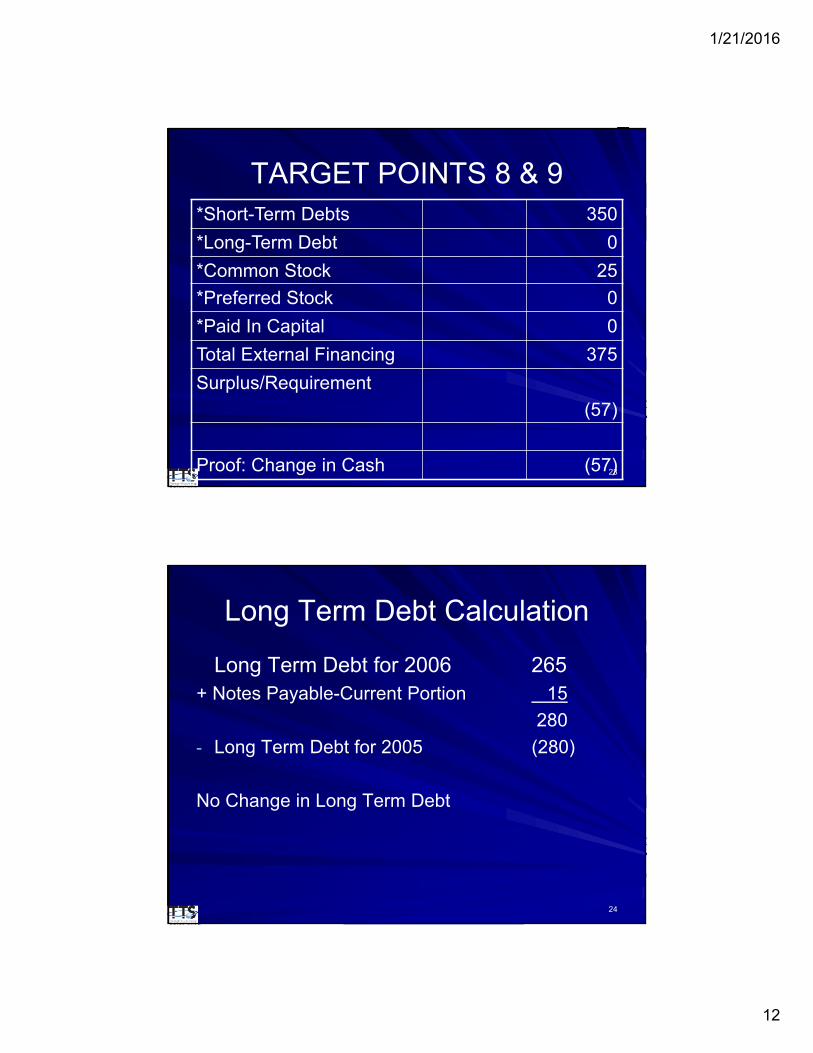
TARGET POINTS 8 & 9*Short-Term Debts 350
*Long-Term Debt 0
*Common Stock 25
*Preferred Stock 0
*Paid In Capital 0
Total External Financing 375
Surplus/Requirement
(57)
Proof: Change in Cash (57)23
Long Term Debt Calculation
Long Term Debt for 2006 265+ Notes Payable-Current Portion 15
280
- Long Term Debt for 2005 (280)
No Change in Long Term Debt
24

1/21/2016
13
What Happened to Cash Flow?
• Increase in A/R of 311,000
• Increase in Inventory of 443,000
• Marginally Profitable Operations
25
How Did the Company Survive?
• They borrowed money from the bank to pay the bank!!!
• They used the Line of Credit for this purpose and to fund the addition to Fixed Assets
• Both are violations of bank financing rules
26

1/21/2016
14
CASH FLOW IMPACT
2004 2005 2006
Sales Growth N/A 42.0% 30.0%
Gross Profit 24.7% 24.5% 25.3%
Operating Exps. 23.3% 23.7% 23.6%
Net Profit Margin 0.6% 0.6% 1.0%
27
CASH FLOW IMPACTTurnover In Days
2004 2005 2006
A/R 29.2 .2 29.4 3.5 32.9
INVENTORY 19.6 2.5 17.1 15.8 32.9
ACCTS. PAY. 11.1 2.1 13.2 7.4 20.6
28

1/21/2016
15
CASH FLOW IMPACT
1 DAYS SALES = $11,025,000365 DAYS
= $30,205
1 DAYS COGS = $8,240,000 365 DAYS
= $22,575
29
CASH FLOW IMPACT
A/R: $30,205 X 3.5 Days = $105,718
INV: $22,575 x 15.8 Days = $356,685
A/P: $22,575 x _7.4 Days = $167,055
Net Cash Flow Impact = $295,348
30

1/21/2016
16
INDIRECT CASH
FLOW METHOD
31
DIFFERENCES
• Other Current Accounts are accounted for in the Investing Activities Section
• CPLTD and LTD are calculated by considering the change from last year rather than the method demonstrated above
• Bottom Line: We still reach the same conclusion
32
1/21/2016
17
Global Cash Flow Analysis
Business Cash Flow
+Net Personal Cash Flow
= Global Cash Flow
33
Thanks for joining us!Bankers Insight Group
3695 F Cascade Road #1201
Atlanta, Georgia 30331
Wesley Kavelaris
TTS
www.BankWebinars.com
800-831-0678
34
Upcoming Webinars
January 26th – Advertising Compliance
January 26th – Improving Employee Performance in Everyday Work Situations & Reviews
January 27th – Home Equity Lines of Credit
January 27th – Best-Ever Compliance Checklists for Consumer Loans
January 28th – 20 Legal Account Ownerships, Titles, Sample Signature Cards and Legal Documentation
January 28th – Deliver Training That Sticks
February 2nd – Writing High-Impact Executive Summaries
February 3rd – Excel Explained: Internal Control
February 3rd – Call Report for Banks - Recent Changes, Highlights, and Pitfalls
February 5th – BSA Series: Customer Due Diligence Preparing for the Change