basic c nu me rical al skillls - university of · pdf fileba un calic sic b iver school ut...
TRANSCRIPT

BA
UN
Calic
ASIC
B
NIVERSCHOOL
ut Universi
C NUSKIIII Se
COMMO
B Com
(2011 A
RSITYL OF DIST
ity P.O. Mal
UMEKILL
emester
ON COU
m/BB
Admissio
Y OF TANCE E
lappuram, K
136
ERILS r
URSE
BA
on)
CALIEDUCATIO
Kerala, Indi
ICAL
ICUTON
ia 673 635
AL
T

School of Distance Education
Basic Numerical Skills 2
UNIVERSITY OF CALICUT
SCHOOL OF DISTANCE EDUCATION
STUDY MATERIAL
Common Course for
B Com/BBA
III Semester
BASIC NUMERICAL SKILLS
Prepared by: Sri. Udayakumar O.K,Associate Professor, Department of Commerce, Govt. College, Madappally.
Scrutinised by:
Dr. K. Venugopalan, Associate Professor, Department of Commerce, Govt. College, Madappally
Layout: Computer Section, SDE
© Reserved

School of Distance Education
Basic Numerical Skills 3
CONTENTS Pages
MODULE I 5
MODULE II 35
MODULE III 47
MODULE IV 76
MODULE V 101

School of Distance Education
Basic Numerical Skills 4

School of Distance Education
Basic Numerical Skills 5
MODULE I
The theory of sets was introduced by the German mathematician Georg Cantor in 1870. A set is well defined collection of distinct objects. The term well defined we mean that there exists a rule with the help of which we will be able to say whether a particular object ‘belong to’ the set or does not belong to the set. The objects in a set are called its members or elements. The sets are usually denoted by the Capital letters of the English alphabet and the elements are denoted by small letters. If x is an element of a set A, we write X A (read as x belong to A). If x is not an element of A then we write X A (read as x does not belong to A). Representation of a Set or Methods of describing a Set
A set is often representation in two ways: (1) Roster method or tabular or enumeration method. (2) Set builder method or Rule or Selector method.
Tabular Method
In this method, a set is described by listing the elements, separated by commas and are enclosed within braces. For example the set of first three odd numbers 1,3,5 is represented as :
A = 1, 3, 5
Set Builder Method
In this method, the set is represented by specifying the characteristic property of its elements. For example the set of natural numbers between 1 and 25 is represented as:
A = : 1 25
TYPES OF SETS
1. Null Set or Empty Set or Void Set
A set containing no element is called a null set. It is denoted by or
Eg:‐ the set of natural numbers between 4 and 5.
2. Singleton or Unit Set
A Set containing a single element is called singleton set
Eg:‐ Set of all positive integers less than 2
3. Finite Set
A Set is said to be a finite set if it consist only a finite number of elements. The null set is regarded as a finite set.
Eg:‐ the set of natural numbers less than 10

School of Distance Education
Basic Numerical Skills 6
4. Infinite Set
A set is said to be an infinite set if it consists of a infinite number of elements.
Eg:‐ Set of natural numbers.
5. Equvilant Set
Two sets A and B are said to be equivalent set if they contain the same number of elements
Eg:‐ Let A = 1, 2, 3 and B = , ,
6. Equal Set
Two sets A and B are said to be equal if they contain the same elements.
Eg:‐ Let A = 1, 2, 3 B = 2, 1, 3
7. Sub Set and Super Set
If every element of A is an element of B then A is called a subset of B and symbolically we write A B
If A is contain in B then B is called super set of A and written as B A
Eg: A = 2, 3 and B = 2, 3, 4 then A is a proper subset of B
8. Power Set :
The collection of all sub sets of a set A is called the power set of A. It is denoted by P(A). In P(A), every element is a set. For example
A = 1, 2, 3
Then P(A) = , 1, 2, 3 1 2, 3 1, 2 1, 3 2, 3
9. Universal Set
If all the sets under consideration are subsets of a fixed set U, is called universal set. For example A is the set of vowels in the English Alphabet. Then the set of all letters of the English Alphabet may be taken as the universal set.
10. Disjoint Set
Two sets A and B are said to be disjoint sets if no element of A is in B and no element of B is in A. For example
A= 3, 4, 5 , B = 6, 7, 8
SET OPERATIONS
(1) Union of sets : The union of two sets A and B is the set of all those elements which belongs to A or to B or to both. We use the notation A B to denote the union of A and B.

School of Distance Education
Basic Numerical Skills 7
For example
If A = 1, 2, 3, 4 B = 3, 4, 5, 6 , Then A B = 1, 2, 3, 4, 5, 6
(2) Intersection of Sets
The intersection of two sets is the set consisting of all elements which belong to both A and B. It is denoted by A B. For example
If A = 1, 2, 3, 4 B = 3, 4, 5, 6 , Then A B = 3, 4
(3) Difference of two sets
The difference of the two sets A and B is the set of all elements in A which are not in B. It is denoted by A‐B or A/B. For example
If A = 1, 2, 3, 4 B = 3, 4, 5, 6 , Then A B = 1, 2
(4) Complement of a set
Complement of a set is the set of all element belonging to the universal set but not belonging to A. It is denoted by or
= ‐A. For example If = 1, 2, 3, 4,5 A = 1,3, 5 , Then = 2, 4
ALGEBRA OF SETS OR LAWS OF SET OPERATION
(1) Commutative Laws :
If A and B are any two sets then :‐
(i)A B =B A
(ii)A B = B A
(2) Associative Laws
If A, B and C are three sets, then
(i)A (B C) = (A B) C and
(ii)A (B C) = (A B) C
Distributive Laws
If A, B, C are any three sets, then
(i) A (B C) = (A B) (A C) and
(ii) A (B C) = (A B) (A C)
De‐Morgan’s Law
If A and B are any two subsets of ‘ ’, then
(i)(A B)’ =A’ B’

School of Distance Education
Basic Numerical Skills 8
That is complement of union of two sets equal to the intersection of their complements.
(ii) (A B)’ =A’ B’
That is complement of intersection of two sets is equal to the union of their complements.
Practical Problems
1) If A = 1, 2, 3, 4 , B = 3, 4,5,6
C = 5, 6, 7, 8 D = 7, 8, 9, 10
Find (i) A B (ii) A C (iii) B C (iv) B D (v) A B C (vi)A B D (vii)B C D
Answer
(i) A B = 1, 2, 3, 4, 5, 6 (ii) A C = 1, 2, 3, 4, 5, 6, 7,8 (iii) B C = 3, 4,5, 6, 7, 8 (iv) B D = 3, 4, 5, 6, 7, 8, 9, 10 (v) A B C = 1, 2, 3, 4, 5, 6, 7, 8 (vi) A B D = 1, 2, 3, 4,5, 6, 7, 8, 9, 10 (vii) B C D = 3, 4,5, 6, 7, 8, 9, 10
2) If A = 1, 3, 5, 7 , B = 5, 9, 13, 17 C = 1, 3, 9, 13 Find (i) A B (ii) B A (iii) A‐B (iv) B A (v) A C (vi)(A B) C (vii) A (A‐B) Answer
(i) A B = 5 (ii) B A = 5 (iii) A‐B = 1,3, 7 (iv) B‐A = 9, 13, 17 (v) A C = 5, 7 (vi) (A B C) = 7
(vii) A‐(A‐B) = 5
3) A = : 1 6 B = : 6 10 Find (i) A B (ii)A B
Answer
A = 2, 3, 4, 5, 6

School of Distance Education
Basic Numerical Skills 9
B = 7,8, 9, 10 (i) A B = 2, 3, 4, 5, 6, 7,8, 9, 10 (ii) A B =
4) Let = 1,2, 3, 4, 5, 6, 7, 8, 9,10 and A = 1, 3, 5, 7, 9 Find . Answer
means belongs to universe but not in A
= 2, 4, 6, 8, 10 5) Let = 1,2, 3, 4, 5, 6, 7, 8, 9,10
A = 1, 4, 7,10 B = 2, 4, 5, 8 Find A’ B
Answer:
A’ = Belongs to universe but not in A A’ = 2, 3, 5, 6, 8, 9 A’ B = 2, 5, 8 ===== 7) Let A = 1,2,3 B = 2, 4, 5 C = 2, 4, 6 , = 1, 2, 3, 4, 5, 6, 7, 8 Verify that (i) (A B) = A’ B’ (ii) (A B) = A’ B’ Answer
(i) (A B)’ = (A B)
A B = 1, 2, 3, 4, 5 (A B)’ = 6, 7, 8 A’ = A = 4, 5, 6, 7, 8 B’ = B = 1, 3, 6, 7, 8 A’ B’ = 6, 7, 8 Hence (A B)’ = A’ B’ ===== (ii) (A B)’ = (A B)
(A B) = 2 (A B)’ = 1, 3, 5, 6, 7, 8 A’ B’ = 1, 3, 5, 6, 7, 8
Hence (A B)’= A’ B’ =========

School of Distance Education
Basic Numerical Skills 10
VENN DIAGRAM
The relationship between sets can be represented by means of diagrams. It is known as Venn diagram. It consists of a rectangle and circles. Rectangle represents the universal set and circle represents any set.
For example A B, A B, A B, and can be represented as follows:
(1)A B
In diagram I A and B are intersecting in the second diagram, A and B are disjoint and in the third figure, B is a subset of A. In all the diagrams, A B is equal to the shaded area.
(ii) A B
A B A
B
A
B
A B A B

School of Distance Education
Basic Numerical Skills 11
In first diagram A B is marked by lines. In the second diagram B is a subset of A and A B is also marked by lines. In the third diagram A and B are disjoint and therefore there is no intersection and so A B =
(iii)A B (iv)
A – B ie belongs to A but not in B is shaded by lines
i.e. belongs to universe but not in A is shaded by lines
Theorems on Number of Elements in a Set
(i) n(A B) = n(A) + n(B) – n(A B)
(ii) n(A B C) = n(A) + n(B) + n(C) – n(A B) – n(A C) – n(B C) + n(A B C)
A B = at least one of them A B = both A & B A B C = At least one of them A B C = All of them
1) Among 60 people, 35 can speak in English, 40 in Malayalam and 20 can speak in both the languages. Find the number of people who can speak at least one of the languages. How many cannot speak in any of these languages? Answer
n(A) = Speak in English n(B) = Speak in Malayalam Given
A B
B A A

School of Distance Education
Basic Numerical Skills 12
n(A) = 35, n(B) = 40 n(A B) = 20 A B = (ie people who speak in at least one of the language) = n(A) + n(B) – n(A B) = 35 + 40 ‐ 20 = 55
Number of people who cannot speak in any one of these language = 60‐ 55 = 5
2) Each student in a class, studies at least one of the subject English, Mathematics and Accountancy. 16 study English, 22 Accountancy and 26 Mathematics. 5 study English and Accountancy, 14 study Mathematics and Accountancy and 2 English, Accountancy and Mathematics. Find the number of student who study
(i) English & Mathematics
(ii)English, Mathematics but not Accountancy
Answer
Let A = students study English
B = students study Mathematics
C = students study Accountancy
Given
n(A ) = 16, n(B) 26, n(C) 22
n(A C) = 5, n (B C) = 14, n(A B)?
n(A B C) = 2, n(A B C) = 40
We know that
n(A B C) = n(A) + n(B) + n(C) – n(A B) –n(A C) –n(B C) + n(A B C)
40 = 16 + 26 + 22 ‐ n(A B) – 5 – 14 + 12
n(A B) = 16 + 26 + 22 – 5 – 14 + 2 – 40
= 7
Number of students study for English & Mathematics = 7
Number of student who study English, Mathematics but not Accountancy = n(A B C’)
n(A B C’) = n(A B) ‐ n(A B C)
= 7 – 2 = 5
Number of student who study English, Mathematics and not Accountancy = 5 ==
3) In a college there are 20 teachers, who teach Accountancy or Statistics. Of these 12, teach Accountancy and 4 teach both Statistics and Accountancy. How many teach Statistics?

School of Distance Education
Basic Numerical Skills 13
Answer
Let n(A) = teachers teach Accountancy
n(B) = teacher teach Statistics
Given n(A) = 12, n(B) ?
n(A B) = 4, n(A B) =20
n(A B) = n(A) + n(B) ‐ n(A B)
20 = 12 + n(B) – 4
n(B) = 20 – 12 + 4 = 12
Number of teachers teach Statistics = 12 ===
4) Out of 2400 students who appeared for BCom degree Examination, 1500 failed in Numerical skills, 1200 failed in Accountancy and 1200 failed in Informatics, 900 failed in both Numerical skills and Accountancy 800 failed in both Numerical skills and Informatics, 300 failed in Accountancy and Informatics, 40 failed in all subjects. How many students passed all three subjects?
Answer
Let A = number of students failed in Numerical Skills
B = number of students failed in Accountancy
C = number of students failed in Informatics
Given
n(A) = 1500, n(B) = 1200, n(C) = 1200
n(A B) 900, n(A C)800, n(B C) = 300
n(A B C) = 40
Number of students failed in at least one subject = n(A B C)
n(A B C) = n(A) + n(B) + n(C) ‐ n(A B) ‐ n(A C)‐ n(B C) + n(A B C)
= 1500 + 1200 + 1200 – 900 – 800 – 300 + 40 = 1940
Number of student passed in all subjects = 2400 – 1940 = 460
===

School of Distance Education
Basic Numerical Skills 14
MATRICES
A matrix is an ordered rectangular array of numbers or functions. It is a rectangular presentation of numbers arranged systematically in rows and columns one number or functions are called the elements of the matrix. The horizontal lines of elements of the matrix are called rows and vertical lines of elements of matrix are called columns.
Order Of Matrix
A matrix having ‘m’ rows ‘n’ columns are called a matrix of order ‘m x n’ or simply ‘m x n’ matrix (read as an ‘m’ by ‘n’ matrix)
Types of Matrices
(i) Rectangular matrix : Any matrix with ‘m’ rows and ‘n’ column is called a rectangular matrix. It is a matrix of Order m x n. For example,
A = 123
212
321
422 is a 3 x 4 matrix
(ii) Square matrix : A matrix by which the number of rows are equal to the number of columns, is said to be a square matrix. Thus an m x n matrix is said to be square matrix if m= n and is known as a square matrix of order ‘n’. For example,
A = 121
210
312 is a square matrix of order 3
(iii) Row matrix : A matrix having only one row is called a row matrix. For example,
A = 1 2 3 2 is a row matrix.
(iv) Column matrix : A matrix having only column is called column matrix. For example,
A = 1231 is a column matrix.
(v) Diagonal matrix : A square matrix is said to be diagonal it all elements except leading diagonal are zero. Elements a11, a22, a33 etc. termed as leading diagonal of a matrix. Example of Diagonal matrix is
A = 200
030
096 is a diagonal matrix. Leading diagonal elements are 2, 3, 6.
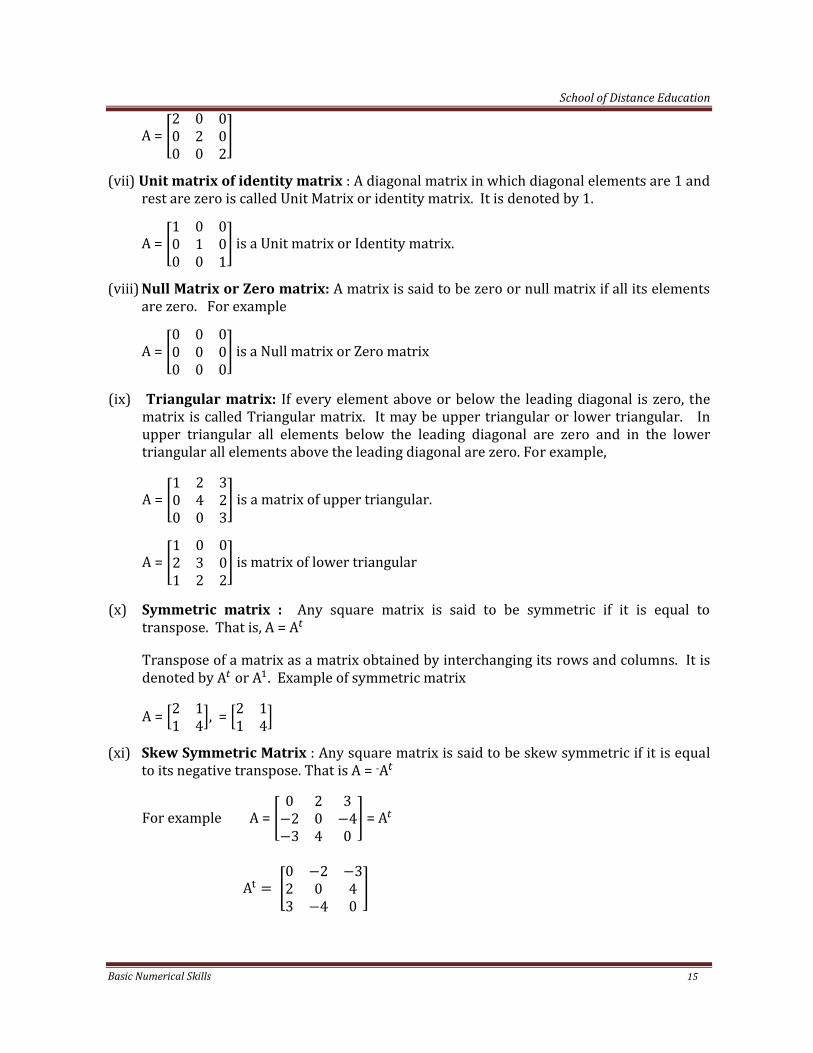
(vi) Scalar Matrix : A diagonal matrix is said to be scalar matrix, if its diagonal elements are equal. For example.
School of Distance Education
Basic Numerical Skills 15
A = 200
020
002
(vii) Unit matrix of identity matrix : A diagonal matrix in which diagonal elements are 1 and rest are zero is called Unit Matrix or identity matrix. It is denoted by 1.
A = 100
010
001 is a Unit matrix or Identity matrix.
(viii) Null Matrix or Zero matrix: A matrix is said to be zero or null matrix if all its elements are zero. For example
A = 000
000
000 is a Null matrix or Zero matrix
(ix) Triangular matrix: If every element above or below the leading diagonal is zero, the matrix is called Triangular matrix. It may be upper triangular or lower triangular. In upper triangular all elements below the leading diagonal are zero and in the lower triangular all elements above the leading diagonal are zero. For example,
A = 100
240
323 is a matrix of upper triangular.
A = 121
032
002 is matrix of lower triangular
(x) Symmetric matrix : Any square matrix is said to be symmetric if it is equal to transpose. That is, A = A
Transpose of a matrix as a matrix obtained by interchanging its rows and columns. It is denoted by A or A . Example of symmetric matrix
A = 2114 , =
21
14
(xi) Skew Symmetric Matrix : Any square matrix is said to be skew symmetric if it is equal to its negative transpose. That is A = ‐A
For example A = 023
204
340
= A
A 023
204
340

School of Distance Education
Basic Numerical Skills 16
‐A 023
204
340
Operation of matrices
Operation of matrices relate to the addition of matrices, difference, multiplication of matrix by a scalar and multiplication of matrices.
Addition of matrices : If A and B are any two matrices of the same order, their sum is obtained by the elements of A with the corresponding elements of B. For example :
A = 874
633
222 B =
533
222
312
Then A + B = 3101
411
534
Difference of Matrices : if A and B are, two matrices of the same order, then the difference is obtained by deducting the element of B from A. If A = 12
23
31 B = 3
110
32
Then A B = 2
333
01
Multiplication of a Matrix by a Scalar The elements of Matrix A is multiplied by any value (ie. K) and matrix obtained is denoted by
K
For example : A = 122
232
311
Then 5A = 51010
101510
1555
Practical Problems
1) If A = 0221
34 ‐ B =
71
64
35 Find 3A – B ?
Ans: 3A = 06
63
912
3A B = 06
63
912 7
164
35

School of Distance Education
Basic Numerical Skills 17
75
01
67
========== (2) Solve the equation: 2 3 1
012 5 3
456
======
Ans : 2 22
22
3 10
12
30
36
5 34
56
1520
2530
22
22 + 30
36 = 1520
2530
2 3 15, 2 15 3 12, 6
2 3 25, 2 25 3 28, 14
2 0 20, 2 20, 10
2 6 30, 2 30 6 24, 12
(3) Find the value of a, b if
2 x 753 31
42
715
614
Ans : 2 x 753 214
102 6
21410
2 6 3142
715
614
2a + 3 = 7, 2a = 7‐3 = 4, a= = 2
2b – 6 + 2 = 14, 2b = 14 + 6 – 2 = 18, b = = 9
Multiplication of two matrices
For multiplication, take each row of the left hand side matrix with all colums of the right hand
side matrix. For example A B Then AB =

School of Distance Education
Basic Numerical Skills 18
Practical Problems
(1) Let A = 12
21
34 B=
251
345
123 Compute AB
Ans: AB = 1x2 2x5 3x12x2 1x5 4x1
1x3 2x4 3x52x3 1x4 4x5
1x1 2x2 3x32x1 1x2 4x3
AB = 2 10 34 5 4
3 8 156 4 20
1 4 92 2 12
AB = 1552618
1412
(2) Let A = 1324 and B =
21
21 Find AB and BA and hence show that AB≠ BA
Ans : AB = 1x 2 2x13x 2 4x1
1x2 2x 13x2 4x 1
2 26 4
2 26 4 =
02
02
BA = 2x1 2x31x1 1x3
2x2 2x41x2 1x4
= 2 61 3
4 82 4 =
42
42
Therefore, AB≠ BA
(3) Let A= 067
608
780, B=
011
102
120, B=
223
Calculate AC, BC and (A+B)C and verify that (A+B)C = AC + BC.
Ans: AC = 01214
12 0 16
21 24 0
= 91230
BC = 022
2 0 4
3 6
0 =
182
A+ B = 058
706
8100

School of Distance Education
Basic Numerical Skills 19
(A +B) C = 01016
14 0 12
24 30 0
= 102028
AC + BC = 102028
(A +B) C = AC + BC
(4) Let A = 134
222
311 Show that 23 40 I 0
Ans : x x
x
x
19114
4126
8815
636992
466
46
692363
23A = 236992
464646
692323
100
010
001
40 4000
0400
0040
23 40 I 000
000
000
23 40 I 0
(5) Let A = 23
51 B =
43
5 What is the value of ‘k’ if any make AB = BA
Ans: AB = 23910 515

School of Distance Education
Basic Numerical Skills 20
BA = 236 3
1515
AB = BA
‐10 + 5k = 15
5k = 15 + 10 = 25
= 5
(6) Two shops have the stock of large, medium and small size of a tooth paste. The number of each size stocked is given by the matrix A, where
A = 15090
240300
120210
. 1 . 2
are cost matrix 1 of the different size of the tooth paste is given by cost ( )
14106
Find the investment in the toothpaste by each shop.
Ans : Investment = AB
AB = 150 240 12090 300 210 X
14106
= 2100 2400 7201260 3000 1260 =
52205520
Investment in toothpaste by
Shop 1 = 5220
Shop 2 = 5520
(7) In a large legislative Assembly electron, a political group hired a public relations firm to promote its candidate in three ways; telephonic, housecalls, and letters. The cost per contract (in paise) is given in matrix A as.

School of Distance Education
Basic Numerical Skills 21
A =
4010050
The number of contract of each type made in two cities X and Y is given by
B = 10003000
5001000
500010000
Find the total amount spent by the group in the two cities x and y ?
Amount spent = BA
BA = 1000 500 50003000 1000 10000 X
4010050
40000 50000 2,50,0001,20,000 1,00,000 5,00,000
3,40,0007,20,000
Amount spent by
City X = 3,40,000 paise i.e. 3400/‐
City Y = 7,20,000 paise i.e. 7200/‐
(8) Three shop keepers A,B and C go to a store to buy stationery. A purchases 12 dozen note book, 5 dozen pens and 6 dozen pencils. B purchases 10 dozen note books, 6 dozen pens and 7 dozen pencils. C purchases 11 dozen note book, 13 dozen pens, and 8 dozen pencils. A note book costs 40 paise, a pen costs 1.25 and pencil costs 35 paise. Use matrix multiplication to calculate each individual bill ?
Ans : Bill of purchase = Purchase Quantity x Price
Let A = Purchase Quantity
B = Price
Then A =
12 x 1210 x 12
5x126x12
6x127x12
11x12 13x12 8x12
Then A = 144120132
6072156
728496

School of Distance Education
Basic Numerical Skills 22
B = 4012535
1.25 125
AB = 144x40 120x 40 132 x 40
60 x 120 72 x 125 156 x 125
72 x 3584 x 3596 x 35
AB = 157801674028140
Bill of the Shop keeper A = 15780/‐
B = 16740/‐
C = 28140/‐
Determinants
A determinant is a compact form showing a set of numbers arranged in rows and columns, the number of rows and the number of columns being equal. The number in a determinant are known as the elements of the determinant.
Matrics which are not square do not have determinants.
Determinant of Square matrix of order 1
The determinants of 1 x 1 matrix A [a] is denoted by |A| or det. A (i.e. determinant of A) and its value is a.
Determinant of Square matrix of order 2
Let A = be a matrix of order 2 x 2
Then the determinant A is defined as
|A| = = ad – bc
Determinant with 3 rows and columns
Let A = be a matrix of order 3 x 3.
Then the determinant A is defined as

School of Distance Education
Basic Numerical Skills 23
|A| = a i.e.
a(eiuf) b(digf) c (dhge)
Practical Problems
1. Evaluate the determinant
2 34 9
Ans : 2 34 9 = 2 x 9 – 4 x ‐3
= 18 + 12 = 30
2. Find the value of the determinant
123
212
324
Ans : 123
212
324
= 1 1 22 4 2 2 2
3 4 ‐ 3 2 13 2
1 4 4 – 2 8 6 3 4 3
1 (‐8) 2 (2) – 3 (7)
= ‐8 – 4 – 21 = ‐33
Singular and Non singular matrices – A square matrix ‘A’ is said to be singular if its determinant value is zero. If |A| ≠ 0, then A is called non‐singular.
Minor elements of a matrix:
Minor element is the determinant obtained by deleting its rows and the column in which element lies.
Example – (1) Find the Minor of element 6 in the determinant A = 147
258
369
Ans : Minor of 6 = 1 27 8 = 1 x 8 – 2 x 7
= 8 – 14 = ‐ 6
2) If A = 324
112
202 Find the minor of 3

School of Distance Education
Basic Numerical Skills 24
Answer : Minor of 3 = 1 02 2 = 1 x 2 – 0 x 2 = 2 – 0 = 2
Cofactor of an element
Co‐factor of an element is obtained by multiplying the minor of that element with (‐1) ( i + j) . where i = the row in which the element belongs, s = the column in which the element belongs.
Co‐factpr of an element = Minor of an element X (‐1)i+j
Example 1. Find the Co‐factors of all the element of the determinant 1 24 3
Ans : Minor element
1 = 3, ‐2 = 4
4 = ‐2, 3= 1
Co‐factors 1 = 3 x ‐11+1 = 3 x ‐12 = 3
‐2 = 4 x ‐1 1 + 2 = 4 x ‐13 = ‐4
4 = ‐2 x ‐12+1 = ‐2 x ‐13 = 2
3 = 1 x ‐1 2+2 = 1x ‐14 = 1
2) Find the co‐factors of the elements of the determinant 261
305
547 and verify that
a11 A31 + a12 A32 + a13 A33 = 0
Ans : Minor of an element :
2 = 0 45 7 = (0 ‐7) – (4 5 0 – 20 ‐20
‐3 6 41 7 = (6 ‐7) – (4 1 ‐42 – 4 ‐46
5 6 01 5 = (6 5) – (0 15 30 – 0 30
6 3 55 7 = (‐3 ‐7) – (5 5 21 – 25 ‐4
0 2 51 7 = (2 ‐7) – (5 1 ‐14 – 5 ‐19
4 2 31 5 = (2 5) – (‐3 1 10 – ‐3 13
1 3 50 4 = (‐3 4) – (5 0 ‐12 – 0 ‐12

School of Distance Education
Basic Numerical Skills 25
5 2 56 4 = (2 4) – (5 6 8 – 30 ‐22
‐7 2 36 0 = (2 0) – (‐3 6 0 – ‐18 18
Co‐factors:
2 ‐20 ‐11 1 ‐20 ‐12 ‐20
‐3 ‐46 ‐1 1 2 ‐46 ‐13 46
5 30 ‐11 3 30 ‐14 30
6 ‐4 ‐12 1 ‐4 ‐13 4
0 ‐19 ‐1 2 2 ‐19 ‐14 ‐19
4 13 ‐12 3 13 ‐15 ‐13
1 ‐12 ‐13 1 ‐12 ‐14 ‐12
5 ‐22 ‐13 2 ‐22 ‐15 22
‐7 18 ‐13 3 18 ‐16 18
a11 2, a12 ‐3, a13 5
A31 ‐12, A32 22, A33 18
a11 A31 a12 A32 a13 A33 0
i.e., 2 ‐12 ‐3 22 5 18
‐24 ‐66 90
‐90 90 0
Adjoint Matrix
Adjoint of a given matrix is the transpose of the matrix formed by co‐factors of the elements. It is denoted by Adj A.
Let A =
Then Adj A = Transpose A A AA A AA A A
= A A AA A AA A A

School of Distance Education
Basic Numerical Skills 26
Practical Problems
1) Find adj A for A = 2 31 4
Ans: Minor element:
2 = 4, 3 = 1, 1 = 3, 4 = 2
Co‐factors:
2 = 4 ‐11 1 4, 3 1 ‐11 2 ‐1
1 3 ‐12 1 = ‐3, 4 = 2 ‐12 2 2
adj A Transpose 4 13 2
4 31 2
2) Find adj A for A = 2 1 33 1 21 2 3
Ans: Minor element: 2 = ‐1, 1 = 7, 3 = 5 3 = ‐3, 1 = 3, 2 = 3 1 = ‐1, 2 = ‐5, 3 = ‐1
Co‐factor elements
2 = ‐1 ‐11 1 ‐1, 1 7 ‐11 2 ‐7
3 5 ‐11 3 5
3 ‐3 ‐12 1 3, 1 3 ‐12 2 3
2 3 ‐12 3 ‐3
1 ‐1 ‐13 1 = ‐1, 2 = ‐5 ‐13 2 5
3 = ‐1 ‐13 3 ‐1
adj A Transpose 1 7 53 3 31 5 1
= 1 3 17 3 55 3 1

School of Distance Education
Basic Numerical Skills 27
Invertible Matrix and Inverse of a Matrix
Let A be a square matrix of order n, if there exist a square matrix B of order n, such that AB BA I
Then A is said to be convertible and B is called on inverse of A and A is called inverse of B
Where I Identity Matrix
Inverse of A is denoted by A‐1
A‐1 = | | adj A or
A‐1 = | |
1) Find the inverse matrix A = 2 1 1 3
Ans: |A| = (2 3 – 1 ‐1 6 – ‐1 7
Minor element:
2 3, ‐1 1, 1 ‐1, 3 2
Co‐factors element
2 3 ‐11 1 3, ‐1 1 ‐1 1 2 ‐1
I = ‐1 ‐12+1 = 1, 3= 2 x ‐12+2 = 2
adj A = Transpose 3 11 2
adj A = 3 11 2
A‐1 = | | adj A
= 3 11 2
=

School of Distance Education
Basic Numerical Skills 28
2. Compute the inverse of 1 2 52 3 11 1 1
Ans. |A| = 1(3‐1) ‐2(2‐ ‐1) + 5 (2‐‐3)
= 1(2) – 2(3) + 5(5)
= 2 – 6 + 25 = 21
Minor element:
1 = 2, 2 = 3, 5 = 5
2 = ‐3, 3 = 6, 1 = 3
‐1 ‐13, 1 = ‐9, 1 = ‐1
Co‐factors element
1 = 2 ‐1 1+1 = 2, 2 = 3 ‐11+2 = ‐3, 5 = 5 ‐1 1+3 = 5
2 = ‐3 ‐11+2 = 3, 3 = 6 ‐12+2 = 6, 1 = 3 ‐12+3 = ‐3
‐1= ‐13 ‐13+1 = ‐13, 1 = ‐9 ‐13+2 = 9, 1 = ‐1 ‐13 3 ‐1
Adj A = Transpose 2 3 53 6 313 9 1
A = | | (adj A)
= 2 3 133 6 95 3 1
=
2
21
3
21
13
213
21
6
21
9
215
21
3
21
1
21

School of Distance Education
Basic Numerical Skills 29
3) If A = 1 3 31 4 31 3 4
then verify that A adjA = |A|1. Also find A
Ans: |A| = 1(16 – 9) ‐3(4 – 3) + 3 (3 – 4)
= 1(7) – 3(1) + 3(‐1)
= 7 – 3 + ‐3 = 1
adj A = Transpose 7 1 13 1 03 0 1
= 7 3 31 1 01 0 1
A(adj A) = 1 3 31 4 31 3 4
7 3 31 1 01 0 1
= 1 0 00 1 00 0 1
A(adj A) = |A|1
1 0 00 1 00 0 1
= 1 1 0 00 1 00 0 1
1 0 00 1 00 0 1
= 1 0 00 1 00 0 1
A (adj A = |A|1
A = | | (adj A)
= 7 3 31 1 01 0 1
= 7 3 31 1 01 0 1
4) If A = 2 31 4 and B =
1 21 3 , then verify that (AB)‐1 = B‐1A‐1

School of Distance Education
Basic Numerical Skills 30
Ans: AB = 2 31 4
1 21 3 = 1 5
5 14
|AB| = (14 – 25) = ‐11
(AB)‐1 = | | (adj (AB))
adj (AB) = adj A adj B
adj A:
Minor element:
2 = ‐4, 3 = 1, 1 = 3, ‐4 = 2
Co‐factors element
2 = ‐4, 3 = ‐1, 1 = ‐3, ‐4 = 2
adj A = Transpose 4 13 2 = 4 3
1 2
adj B = 3 21 1
(AB = 14 55 1 = 14 5
5 1
|A| = ‐11, |B| 1
A‐1 = 4 31 2
B = 3 21 1 =
3 21 1
B1A1 = 3 21 1
4 31 2
= = 14 55 1 = 14 5
5 1
Hence (AB)‐1 = B1A1
Solving simultaneous equations with the help of Matrices
Firstly, express the equation in the form of AX = B
Then possibilities
When |A| ≠0

School of Distance Education
Basic Numerical Skills 31
Then X = A‐1B i.e., the system has a unique solution.
the system is consistant
A = | | (adj A)
When |A| = 0
Then we calculate (adj A)B
If (adj A)B = 0, then the system will have infinite solution were the system is consistent. [[ If (adj A)B ≠ 0, then the system will have no solution.
Problem
1) Solve the linear equation by using matrix
5x + 2y = 4
7x + 3y = 5
Ans: AX = B
Let A = 5 27 3 , X =
B = 45
|A| = (15 – 14) = 1
i.e., 1 ≠ 0
Then X = A B
A = | | (adj A)
Adj A:
Minor element 5 = 3, 2 = 7, 7 = 2, 3 = 5
Co‐factors element 5 = 3, 2 = ‐7, 7 = ‐2, 3 = 5
adj A = Transpose 3 72 5 = 3 2
7 5
A = | | (adj A) = 3 27 5
School of Distance Education
Basic Numerical Skills 32
= 3 27 5
X = A B = 3 27 5 45
X = 12 1028 25 = 2
3
X = 23 =
x = 2 y = ‐3
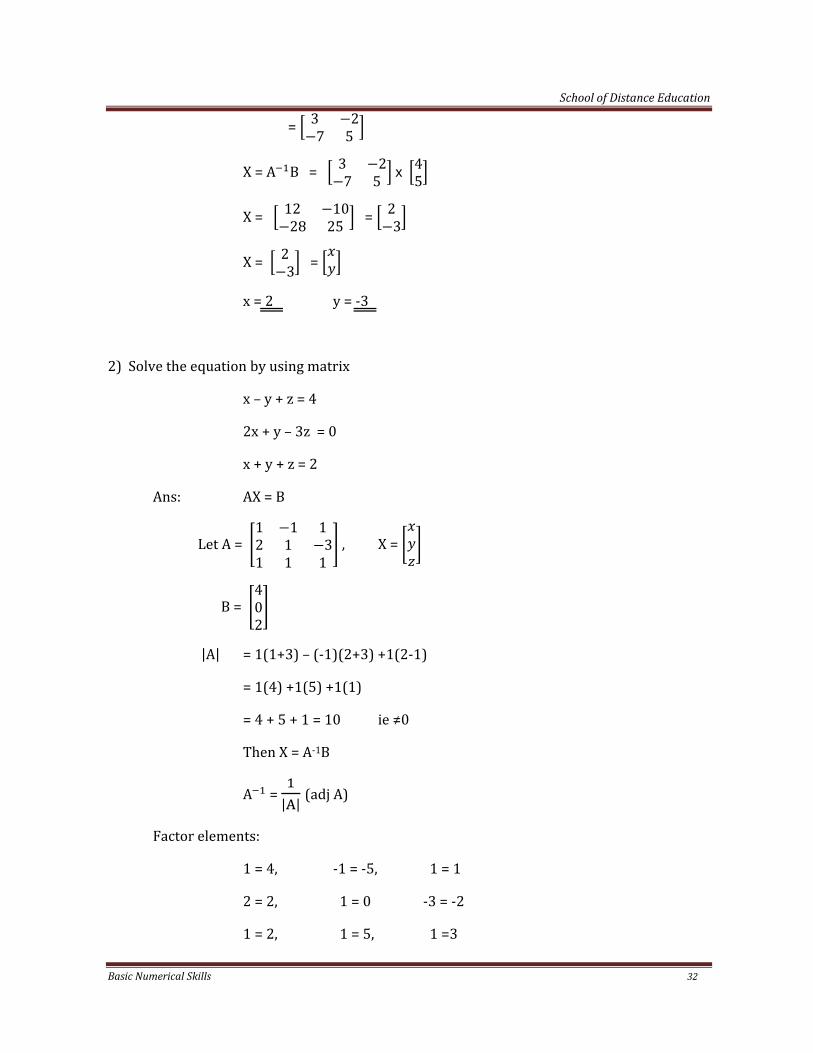
2) Solve the equation by using matrix
x – y + z = 4
2x + y – 3z = 0
x + y + z = 2
Ans: AX = B
Let A = 1 1 12 1 31 1 1
, X =
B = 402
|A| = 1(1+3) – (‐1)(2+3) +1(2‐1)
= 1(4) +1(5) +1(1)
= 4 + 5 + 1 = 10 ie ≠0
Then X = A‐1B
A = | | (adj A)
Factor elements:
1 = 4, ‐1 = ‐5, 1 = 1
2 = 2, 1 = 0 ‐3 = ‐2
1 = 2, 1 = 5, 1 =3

School of Distance Education
Basic Numerical Skills 33
Adj A = Transpose 4 5 12 0 22 5 3
= 4 2 25 0 51 2 3
X = A B
A = | | (adj A)
= 4 2 25 0 51 2 3
X = A B 4 2 25 0 51 2 3
402
= 16 0 420 0 104 0 6
= 201010
= 211
X = 211
i.e., x = 2, y = ‐1, z = 1
3) Solve the following equation by using matrix
5x – 6y + 4 z = 15
7x + 4y – 32 = 19
2x + y + 6 z = 46
Ans: AX = B
Let A = 5 6 47 4 32 1 6
, X =
B = 151946

School of Distance Education
Basic Numerical Skills 34
|A| = 5(24 ‐ ‐3) ‐ ‐6 (42 ‐ ‐6) + 4 (7 – 8)
= 5(27) + 6(48) + 4(‐1)
= 135 +288 – 4 = 419
Then X = A B
A = | | (adj A)
Co‐factor elements :
5 = 27, ‐6 = ‐48, 4 = ‐1
7 = 40, 4 = 22, ‐3 = ‐17
2 = 2, 1 = 43, 6 = 62
Adj A = Transpose 27 48 148 22 172 43 62
= 27 40 248 22 431 17 62
X = A B
X = | | (adj A) B
= 27 40 248 22 431 17 62
151946
= 125716762514
= 346
X = 346
x = 3, y = 4, z = 6
School of Distance Education
Basic Numerical Skills 35
MODULE II
THEORY OF EQUATIONS
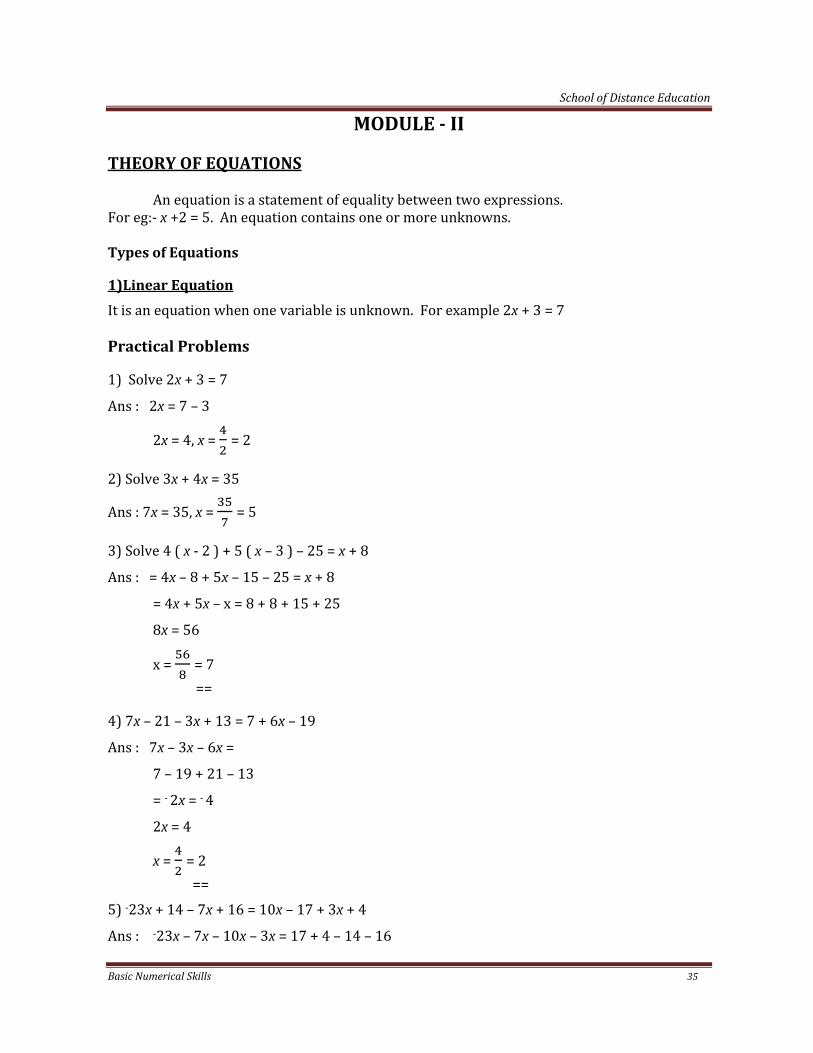
An equation is a statement of equality between two expressions. For eg:‐ x +2 = 5. An equation contains one or more unknowns. Types of Equations
1)Linear Equation
It is an equation when one variable is unknown. For example 2x + 3 = 7 Practical Problems
1) Solve 2x + 3 = 7
Ans : 2x = 7 – 3
2x = 4, x = = 2
2) Solve 3x + 4x = 35
Ans : 7x = 35, x = = 5
3) Solve 4 ( x ‐ 2 ) + 5 ( x – 3 ) – 25 = x + 8
Ans : = 4x – 8 + 5x – 15 – 25 = x + 8
= 4x + 5x – x = 8 + 8 + 15 + 25
8x = 56
x = = 7 ==
4) 7x – 21 – 3x + 13 = 7 + 6x – 19
Ans : 7x – 3x – 6x =
7 – 19 + 21 – 13
= ‐ 2x = ‐ 4
2x = 4
x = = 2 ==
5) ‐23x + 14 – 7x + 16 = 10x – 17 + 3x + 4
Ans : ‐23x – 7x – 10x – 3x = 17 + 4 – 14 – 16

School of Distance Education
Basic Numerical Skills 36
‐23x = ‐23
23x = 23
x = = 1
== 6) Find two numbers whose sum is 30 and difference is 4
Ans : Let one number = x
then other number = 30 – x
Numbers = (30 –x) – x = 4 ‐2x = 4 – 30 ‐2x = ‐26
2x = 26
x = = 13
then numbers are 13, 17 ==== 7) Two third of a number decreased by 2 equals 4. Find the number
Ans : Let the number = x
Then 2 3(x) – 2 = 4
2x – 6 = 12
2x = 12+ 6
2x = 18
x = 9 ==
8) Solve
=
Ans : = 3(7x + 4) = ‐4 (x + 2 )
= (21x + 12) = ‐ 4x + ‐8
21x + 4x = ‐8 – 12
25x = ‐20
x = =
9) The ages of Hari and Hani are in the ratio of 4 : 5. Eight years from now, the ratio of their ages will be 5:6. Find their present age?
Ans : Let present age = 4x and 5 x

School of Distance Education
Basic Numerical Skills 37
After 8 years =
=
= 6(4x + 8 ) = 5 (5x + 8)
= 24x + 48 = 25x + 40
= 24x – 25x = 40 – 48
= ‐1x =‐8
= x = 8
Present ages of Hari and Hani are
Hari = 4x = 4 × 8 = 32 years ==== Hani = 5x = 5 × 8 = 40 years ==== 2) Simultaneous equations in two unknowns
For solving the equations, firstly arrange the equations. For eliminating one unknown variable, multiply the equation 1 or 2 or both of them with certain amount and then deduct or add some equation with another, we get the value of one variable. Then substitute the value in the equation, we get the values of corresponding variable.
PRACTICAL PROBLEMS
1) Solve 3x + 4y = 7
4x – 7 = 3
Ans : 3x + 4y = 7 ‐‐‐‐‐‐ (1) 4x – y = 3 ‐‐‐‐‐‐‐ (2)
Multiply the equation 2 by 4, then
3x + 4y = 7 ‐‐‐‐‐‐‐‐‐ (1)16x – 4y = 12
Add 19 x = 19
x = = 1
== Substitute to value of x
3x + 4y = 7 3 1 + 4y = 7 3 + 4y = 7 = 4y = 7 – 3 = 4
y = = 1
2) 4x + 2y = 6 5x + y = 6

School of Distance Education
Basic Numerical Skills 38
Ans : 4x + 2y = 6 ‐‐‐‐‐‐‐‐‐‐‐ (1)
5x + y = 6 ‐‐‐‐‐‐‐‐‐‐‐ (2)
Multiply the equation 2 by 2, then
4x + 2y = 6
10x + 2y = 12 ‐6x = ‐6 (Deduct 1 – 2)
6x = 6
x = = 1 5x + y = 6
5 × 1 + y = 6
5 + y = 6, y = 6 – 5 = 1 ==
Solve y = 3(x + 1)
4x = 4 + 1
Ans : y = 3x +1
4x = 4 +1
Arrange the equation 3x + y = 3 (1) 4x – y = 1 (2) 1x = 4 Add x = 4
Substituting the value of x 4x – y = 1
16 – y = 1
Y = 16 – 1 = 15
X = 4, y = 15 =========
4) Solve 8x + 7y = 10
11x = 10(1‐y)
Ans : 8x + 7y = 10 ‐‐‐‐‐‐ (1)
11x = 10 – 10 y
11x + 10 y = 10 ‐‐‐‐‐‐‐‐‐ (2)
Multiply equation (1) by 11 and (2) by 8

School of Distance Education
Basic Numerical Skills 39
88x + 77y = 110 88x + 80 y =80
(12) 3y = 30
y = = 10
Substituting the value of y 8x + 7y = 10
8x + 7 10 = 10
8x + 70 = 10
8x = 10 + 70
8x = 80, x = = 10
x = 10, y = 10 ===========
5) Solve = and × ‐10
=
= 3(xy) = 2 (y1)
= 3x – 3y = 2y – 2
3x – 3y – 2y = 2
3x – 5y = 2 (1)
= x – 10
3x – 4 y = 5 (x10)
3x – 4y = 5x – 50
3x 5x – 4y = 50
= 2x + 4y = 50
= x + 2y = 25 (2)
Multiply equation (2) by 3
3x – 5y = 2
3x + 6y = 75
(12) 11y = 77
y = = 7

School of Distance Education
Basic Numerical Skills 40
Substituting the value
x + 2y = 25
x + 2y = 25
x = 11 ====
x = 11, y = 7 =======
6) A man sells 7 horses and 8 cows at Rs. 2940/‐ and 5 horses and 6 cows at Rs. 2150/‐. What is selling price of each ? Ans : Let the selling price of horse = x Cow = y
7x + 8y = 2940 (1)
5x + 6y = 2150 (2)
Multiply equation (1) by 5 and 2 by 7 Then 3x + 40 y = 14700
35x + 42y = 15050
(1‐2) ‐2y = ‐350
y = = 175 Substituting the value of y
7x + 8y = 2940
7x + 8 ×175= 2940
7x = 2940 – 1400
7x = 1540
x = =220
Selling price of horse = 220 ===
Selling price of cow = 175 === 3) Simultaneous Equations in three unknowns
Firstly, eliminate one of the unknown from first two equations. Then eliminate the same unknown from second and third equations. Then we get two equations. Solve such equations, we get the values of x, y and z.
1) Solve 4x + 2y – 32 = 2
School of Distance Education
Basic Numerical Skills 41
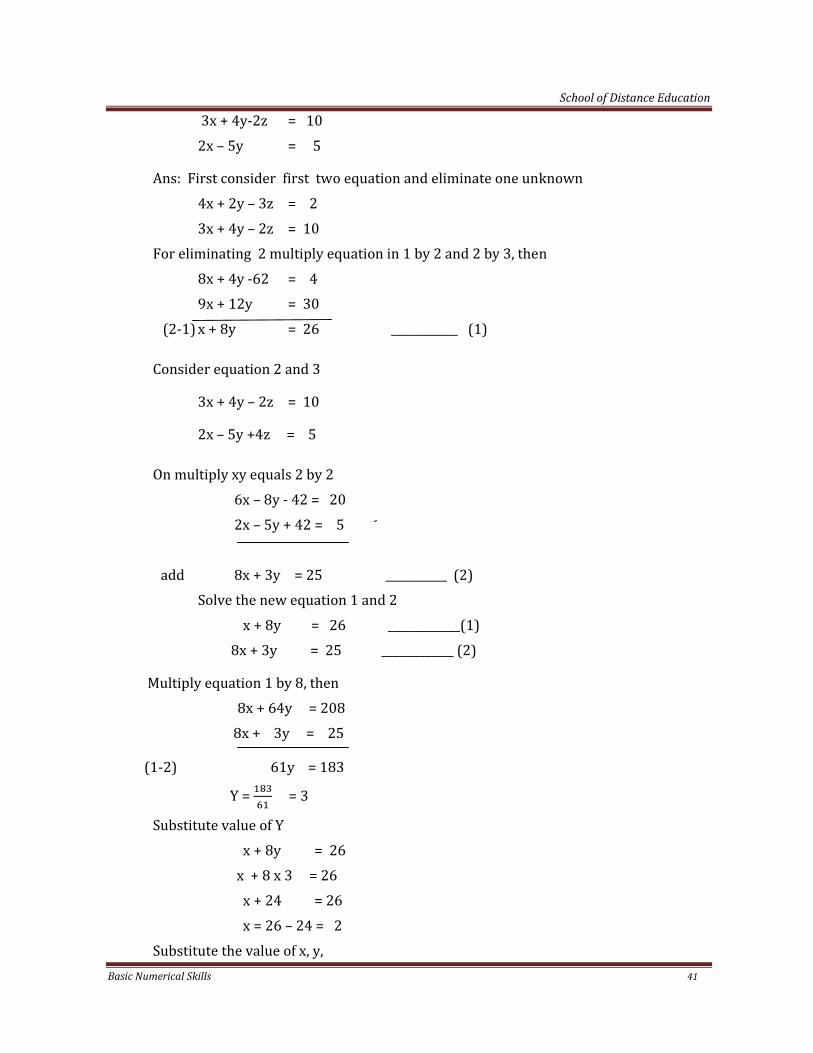
3x + 4y‐2z = 10 2x – 5y = 5
Ans: First consider first two equation and eliminate one unknown 4x + 2y – 3z = 2 3x + 4y – 2z = 10 For eliminating 2 multiply equation in 1 by 2 and 2 by 3, then 8x + 4y ‐62 = 4 9x + 12y = 30
(2‐1) x + 8y = 26 ____________ (1)
Consider equation 2 and 3
3x + 4y – 2z = 10
2x – 5y +4z = 5
On multiply xy equals 2 by 2 6x – 8y ‐ 42 = 20 2x – 5y + 42 = 5 add 8x + 3y = 25 ___________ (2) Solve the new equation 1 and 2 x + 8y = 26 _____________(1) 8x + 3y = 25 _____________ (2)
Multiply equation 1 by 8, then 8x + 64y = 208 8x + 3y = 25
(1‐2) 61y = 183
Y = = 3
Substitute value of Y x + 8y = 26 x + 8 x 3 = 26 x + 24 = 26 x = 26 – 24 = 2 Substitute the value of x, y,

School of Distance Education
Basic Numerical Skills 42
4x + 2y – 3z = 2 4 x 2 + 2 x ‐3z = 2 8 + 6 – 3z = 2 14 – 3z = 2 3z = 14 – z 3z = 12 z = 12/ 3 = 4 x = 2, y=3, z=4
=============
4) Quadratic equations The equation of the form + bx+ c = 0 in which a, b, c are constant is called a quadratic equation in x. Here x is the unknown.
Solution of quadratic equations
There are three methods to solve a quadratic equation.
(1) Method by formula (2) Method of factorization (3) Method of completing the squre Quadratic formula method
One general quadratic equation is + bx + c = 0
Then √
1) Solve the equation x 12 0
Ans: a = 1, b= ‐1, c=‐12
√
1 √
1 = ,
4 or ‐3 =======
2) Solve the equation 2x + = 7

School of Distance Education
Basic Numerical Skills 43
Ans: Multiply the equation by x
Then
2 5 7x
2 7x 5 0
a = 2, b= ‐7, c=5
√
1 √
1 √
1 √ = 1 √
3) Solve the equation ( x + 1) (x +2) 3 = 0
Ans: 2x x + 2 – 3 = 0
3x 2 3 = 0
3x 1 0
a = 1, b = 3, c= 1
√
3 √
3 √ = 3 √
======== 4) Solve ‐ 10 + 9 = 0
Ans: Let = y
Then equation =
y 10y 9 – 3 = 0
y = √
a = 1, b = ‐10, c= 29
10

School of Distance Education
Basic Numerical Skills 44
10
10 = 9, 1
Y = 9, 1
=y , then x =
Y = 1, x= √1 = 1
Y = 9, x =√9 = 3 X = ‐1, 1, 3, ‐3
===========
5) 2x‐7√ + 5 = 0
Answer = Let√ = y, then equation
2y – 74 + 5 = 0
y = ‐b √
‐7 √
7 √
7 =
or
y = 4, or
y = 1, x = 1 = 1
y = = x = =
=
x= 1,
===========
6) Solve x 33x 32 0
Ans: Let y = x , Then equation
= y 33y 32 0
Use quadratic formula
Y = 32, 1

School of Distance Education
Basic Numerical Skills 45
Y = 32 then x = 32
= 2 =32
x = 2
y = 1 then x = 1
= 1 = 1, x = 1
X = 2, 1 ====== 7) Solve x + y = 10 xy = 24 Ans: change to equation in the form of quadratic x + y = 10 x= 10‐y Substitute the value in second equation xy = 24
(10‐y) y = 24
= 10y – = 24
– 10 24 0 Use quadratic formula
y √
10
10
10 = 6, 4
when y = 6, x = 4 y= 4, x = 6
8) Simultaneous equations of two unknowns when one of them is quadratic and the other is linear
1) x + y = 7
x y 25 Answer x + y = 7 y = 7 – x Substistue the value of y y in the second equation, then

School of Distance Education
Basic Numerical Skills 46
x + 7 = 25
We know =a ‐2ab+b
x 7 ‐ 2 x 7 x x + x = 25
x + 49 – 14x + x = 25
x + x ‐ 14x + 49 – 25
2x ‐14x + 24 = 0 Use quadratic formula
y √ =
14
14 √ = 14
= 4, 3
When y= 4, x = 3
Y=3, x=4 ========= 2) Solve x + y = 5 2 ‐ y ‐ 10x – 2xy – 28 = 0 Ans: y = 5‐ x Substitute the value of y is equation (2)
2 ‐ 5 x ‐ 10x ‐ 2x (5‐x) + 28 = 0
= 3 10x+ 3 = 0 Use quadratic formula
X = 3 or
When x = 3, y=2
When x = , y =

School of Distance Education
Basic Numerical Skills 47
MODULE – III
PROGRESSIONS
Arithmetic Progression
A series is said to be in Arithmetic Progression, it its terms continuously increase or decrease by a constant number . It is a series, in which each term is obtained by adding or deducting a constant number to the preceding term. The constant number is called common difference of the progression and is denoted by ‘d’. It is the difference between the two term of the series i.e., the difference between second term and first term or third term and second term and so on.
The first term of an A.P. is usually denoted by ‘a’. One general form of an A.P is a, a+ d, a+2d, a+ 3d, ………
For example
(i) The sequence 1, 3, 5, 7, . . . . . . is an A.P whose first term is 1 and d = 2
(ii) The sequence ‐5, ‐2, 1, 4, 7, . . . . , whose ‘a’ = ‐5, d = 3
General term of an AP or nth term
Ler ‘a’ be the first term and ‘d’ be the common difference of an A.P, then an denotes the nth term of the A.P.
an = a + (n1)d
n = number of term in a series.
Practical Problems
1) Find the 12th term of an A.P 6, 2, ‐2 Ans: an = a + (n1)d a = 6, n = 12, d = ‐4 = 6 + (12‐1) – 4 = 6 + (11) – 4
= 6 + ‐ 44 = ‐38
12th term is ‐38
2) Find the 8th term of the series 6, 5½, 5, 4½, . . . . . Ans: a = 6, d = ‐½, n = 8 an = a + (n1)d

School of Distance Education
Basic Numerical Skills 48
= 6 + (8‐1)‐½ = 6 + (7) ‐½ 6 ‐3.5 2.5
3 Which term of the A.P 21, 18, 15, . . . . . . ‐81 ? Ans: a 21, d ‐3, an ‐81 n ? an = a + (n1)d
‐81 = 21 + (n‐1)‐3 ‐81 = 21 + ‐3n +3 ‐81 = 24 – 3n ‐81 – 24 = ‐3n 3n = 105 n = 105/3 = 35
Therefore the 35th term of the given A.P = ‐81 [[
4) Which term of the A.P 21,18,15, . . . . . 0 ? Ans: a = 21, d = ‐3, an = 0, n = ? an = a + (n1)d
0 = 21 + (n – 1)‐3 0 = 21 + ‐3n + 3 0 = 24 – 3n 3n = 24, n = 8 Therefore, the 8th term = 0
5) If the 9th term of an A.P is 99 and 99th term is 9. Fine 108th term? Ans: an = a + (n1)d n = 9, an = 99 = a + (9‐1)d = 99 = a + 8d = 99 ‐‐‐‐‐‐‐‐‐‐‐‐‐‐‐‐(1) n = 99, an = 9 = a + (99 – 1)d =9 = a + 98d = 9 ‐‐‐‐‐‐‐‐‐‐‐‐‐‐‐(2)
Solve the equations

School of Distance Education
Basic Numerical Skills 49
a + 8d = 99 ‐‐‐‐‐‐‐‐‐‐‐‐‐‐‐‐(1) a + 98d = 9 ‐‐‐‐‐‐‐‐‐‐‐‐‐‐‐‐(2) Then (1) – (2) ‐ 90d = 90 d = 90/‐90 = ‐1
Substitute the value of ‘d’ a + 8d = 99 a + 8 ‐1 = 99 a + ‐8 = 99 a = 99 + 8 = 107 108th term = a + (n‐1)d = 107 + (108 – 1)‐1 = 107 + (107)‐1 = 107 – 107 = 0 108th term = 0
[[[[6) Determine the A.P whose 3rd term is 5 and the 6th term is 8 Ans: a + 2d = 5 ‐‐‐‐‐‐‐‐‐‐‐‐‐‐‐‐‐‐‐‐‐ (1) a + 5d = 8 ‐‐‐‐‐‐‐‐‐‐‐‐‐‐‐‐‐‐‐‐‐(2)
Then (1) – (2) = ‐3d = ‐3
d = = 1
A.P = 3, 4, 5, 6, 7, 8 ……………….
7) Find many two digit numbers are divisible by 3 ? Ans: Numbers = 12, 15, 18, ‐ ‐ ‐ ‐ ‐ ‐ 99 a = 12, d = 3, an = 99 an = a + (n1)d 99 = 12 + (n‐1)3 99 = 12 + 3n – 3 99 = 12 – 3 + 3n 99 = 9 + 3n 3n = 99 – 9, 3n = 90
n = = 30
Two digit numbers are divisible by 3 = 30 number

School of Distance Education
Basic Numerical Skills 50
8) Determine the 25th term of the A.P, whose 9th term is ‐6 and the common difference is 5/4.
Ans: d = 5/4, a9 = ‐6 a9 = a + (n1)d
‐6 = a + 8
‐6 = a + 10 a = ‐10 – 6 = ‐16 a25 = a + (n – 1)d
= ‐16 + (25 – 1)
= ‐16 + 24 = ‐16 + 30 = 14 25th term = 14
Sum of n terms of an A.P
Let Sn denotes the sum of ‘n’ terms of an A.P, whose first term is ‘a’ and common difference is ‘d’.
Sn
2a = a + a or 2 a
Practical Problems
(1) Find the sum of the first 20 terms of 1 + 4 + 7 + 10 . . . . . . .
Ans: Sn 2 2 1
n 20, a = 1, d = 3
Sn = (2 1 + (20 – 1 )3
= 10 (2+ 19 3)
= 10(2 + 57), 10 59 =590
Sum of the first 20 terms = 590

School of Distance Education
Basic Numerical Skills 51
2) Find the sum of the series 5, 3, 1, ‐1, . . . . . . ‐23
Ans: a= 5, d = ‐2, n = ?, an =‐23
Sn 2 2 1
We know, an = a + (n – 1)d
‐23 = 5 + (n – 1)‐2
‐23 = 5 + ‐2n + 2
‐23 = 5 + 2 – 2n
‐23 = 7 – 2n
2n = ‐23 – 7
2n = 30, n = = 15
Sn = (2 5 + (15 – 1)‐2)
= (10 + 14 ‐2)
= (10 + ‐28)
= ‐18 15 ‐9 ‐135
Sum of the series ‐135
3) How many terms of the sequence 54, 51, 48, ………… be taken so that their sum is 513. Explain the double answer. Ans: Sn = 513, a = 54, d = ‐3 Sn 2 2 1
513 (2 54 + (n – 1)‐3)
513 (108 – 3n + 3)
513 (111 – 3n) = 1026 = n(111 – 3n)
= 1026 = 111n – 3n2 = 3n2 – 111n = ‐1026 = 3n2 – 111n + 1026 = 0

School of Distance Education
Basic Numerical Skills 52
= n2 – 37n + 342 = 0
Solve by using quadratic formula
i.e., n = √
a = 1, b = ‐37, c = 342
n = √
= √
= √ =
= or
= 19 or 18 N = 18 or 19
4) Find the sum of all natural numbers between 500 and 1000 which are divisible by 13.
Ans: Number between 500 and 1000 which are divisible by 13 507, 520, 533, . . . . 988 a = 507, d = 13, an = 988 an = a + (n1)d 988 = 507 + (n‐1)13 988 = 507 + 13n – 13 988 = 507 – 13 + 13n 988 = 494 + 13n 13n = 988 – 494 = 494 13n = 494
n = = 38 Sn 2 2 1
19 1014 37 13 19 1014 481 19 1495 28405

School of Distance Education
Basic Numerical Skills 53
5) Find the sum of all natural numbers from 1 to 200 excluding those divisible by 5
Ans: Natural number from 1 to 200 = 1, 2, 3, 4, ……. 200
Divisible by 5 = 5, 10, 15, 20 . . . . . 200
Natural numbers from 1 to 200, excluding divisible by 5 =
(1, 2, 3, 4 . . . . 200) – (5, 10, 15 . . . . . 200)
Sum of (1, 2, 3, 4, . . . . . 200) =
Sn 2 2 1
2 1 200 1 1
= 100 (2+199)
=100 201 = 20,100
Sum of (5, 10, 15,20, . . . . . . 200)
= (2 5 +(40‐1)5)
=20 (10 + 39 5)
=20(10 + 195)
= 20 205 = 4100
Sum by natural numbers from 1 to 200 excluding divisible by 5 = 20100 – 4100
= 16000
6) The sum of the first 3 terms of an A.P is 30 and the sum of first 7 terms is 140. Find the sum of the first 10 terms.
Ans: S3 = 30, s7 = 30,
Sn 2 2 1
2a 3 1 d 30
2a 2d 30
= 2a + 2d = 20
= a + d = 10 ‐‐‐‐‐‐‐‐‐‐‐‐‐‐(1)

School of Distance Education
Basic Numerical Skills 54
= 2a 6d = 140
= 2a+6d = 140 , = 2a + 6d = 40
a + 3d = 20 ‐‐‐‐‐‐‐‐‐‐‐‐‐‐‐(2)
Solving the equation (1) and (2) d = 5
Then a = 5
S10 = 2 5 9 5 275
7) Find three numbers in A. P whose sum is 9 and the product is ‐165.
Ans: Let the numbers be a‐d, a, a+d
(a‐d) + a + (a +d) = 9
3a = 9, a = 3
(a‐d) a (a+d) = ‐165
= (3 – d) 3 (3 +d) = ‐165
= 9 – d2 = = 9 – d2 = ‐55 = ‐d2 = ‐55 – 9 = ‐64 = d2 = 64, d = 8 a = 3, d = 8 Numbers = (a – d), a, (a+d) = ‐5, 3, 11 8) Find four numbers of A.P whose sum is 20 and the sum of whose square is 120
Ans: Let numbers be (a‐3d), (a‐d) (a+d) (a+3d)
Given (a‐3d)+(a‐d)+(a+d)+(a+3d) = 20
4a = 20, a = = 5
(a‐3d)2 (a‐d)2 (a+d)2 (a+3d)2 = 120
= (5‐3d)2 (5‐d)2 (5+d)2 (5+3d)2 = 120
We know (a‐b)2 = a2 – 2ab + b2

School of Distance Education
Basic Numerical Skills 55
= 25 ‐30d + 9d2+ 25 – 10d + d2 + 25 + 10d + d2+25+30d+9d2 = 120 = 100 + 20d2 = 120 20d2 = 120 = 100 20d2 = 20, d2 = 20/20 = 1, d = 1 a = 5, d = 1 Numbers are = (a – 3d), (a‐d), (a + d), (a + 3d) = (5‐3). (5‐1), (5+1), (5+3) ` = 2, 4, 6, 8 [[
9) A manufacturing of radio sets produced 600 units in the third year and 700 units in the seventh year. Assuming that the production uniformly increases by a fixed number every year. Find
(1) One production in the first year
(2) The production in the 10th year.
(3) The total production in 7 year.
Ans: Since the production increases uniformly by a fixed number in every year, it form an A.P. Let a3 = 600, a7 = 700
an = a + (n – 1)d 600 = a + (3‐1)d 600 = a + 2d …………………… (1) 700 = a + 6d …………………… (2)
a + 2d = 600 ……………………….(1) a + 6d = 700 ……………………….(2) ‐4d = ‐100
d = = 25
(1) Production in the first year a + 2d = 600 a + 50 = 600 a = 550
(2) Production in the 10th year i.e., an = a + (n‐1)d = 550 + (10 – 1) 25 = 550 + 9 25 = 550 + 225 = 775

School of Distance Education
Basic Numerical Skills 56
(3) Total production in 7th year
Sn 2 2 1
2 550 7 1 25
1100 6 25
1100 150
1250
7 625 4375 units
10 The rate of monthly salary of a person is increased annually in A.P. It is known that he was drawing as 400 a month during the 11th year of his service and as 760 during the 29th year. Find 1 Starting salary
2 Annual increment 3 Salary after 36 years.
Ans: a11 400 a29 760 a 10d 400 a 28d 760 ‐18d ‐360
d 20
a 10d 400 a 10 20 400 a 200 400 a 400 – 200 200 a36 200 35d 200 35 20 200 700 900
1 Starting salary 200 2 Annual Increment 20 3 Salary after 36 years 900

School of Distance Education
Basic Numerical Skills 57
Arithmetic Mean A.M
Given two numbers a and b, we can insert a number A between them, so that a, A, b is an A.P. Such a number A is called the Arithmetic Mean of the number a and b.
We can insert as many numbers as we like between them. Let A, A2, A3 . . . . . An be ‘n’ numbers between a and b,
Then
A1 a d
A2 a 2d
A3 a 3 d
An a nd
Example
1 Find A.M between 2 and b
Ans: A.M between 2 and 6 4
Then A.P. 2, 4, 6 2 Insert 4 Arithmetic means between 5 and 20 a 5, n 6, an 20, d ? an = a + (n – 1)d 20 = 5 + (6‐1)d 20 = 5 + 5d 20 = 5 + 5d 5d = 20 – 5 = 15 d = 15/5 = 3
A1 a d i.e., 5 3 8
A2 a 2d i.e., 5 6 11
A3 a 3d i.e., 5 9 14
A4 a 4d i.e., 5 12 17
Arithmetic means are 8, 11, 14, 17
A.P. 5, 8, 11, 14, 17, 20

School of Distance Education
Basic Numerical Skills 58
3) Insert six numbers between 3 and 24 such that the resulting sequence is an A.P.
Ans: a = 3, n = 8, an = 24, d = ? an = a + (n – 1)d 24 = 3 + 7d 7d = 21, d = 3 A1 3 3 6 A2 3 6 9 A3 3 9 12
A4 3 12 15 A5 3 15 18 A6 3 18 21 A.M. 6, 9, 12, 15, 18, 21 A.P. 3, 6, 9, 12, 15, 18, 21, 24
Geometric Progression
A series is said to be in G.P if every term of it is obtained by multiplying the previous term by a constant number. This constant number is called common ratio, denoted by ‘r’. r =
or third term by second term etc.
The first term of a G.P is usually denoted by a. The general form of a G.P is usually denoted by a. The general form of a G.P is a, ar, ar2, ar3 ….. If the number of terms of a G.P is finite, it is called a finite G.P, otherwise it is called an infinite G.P. For example.
(i) 1, ½, ¼, 1 8 ……… is a G.P, whose first term is 1 and r = ½ (ii) 3, ‐6, 12, ‐24 ………… is a G.P whose a = 3 , r = ‐2
General term of a G.P or nth term of a G.P
Let ‘a’ be the first term and ‘r’ be the common ratio of a G.P, then
an = arn1
1 Find 10th term of series 9, 6, 4………
Ans: a 9, r , n 10
an = arn1 9 23
9 23 9 2
3
School of Distance Education
Basic Numerical Skills 59
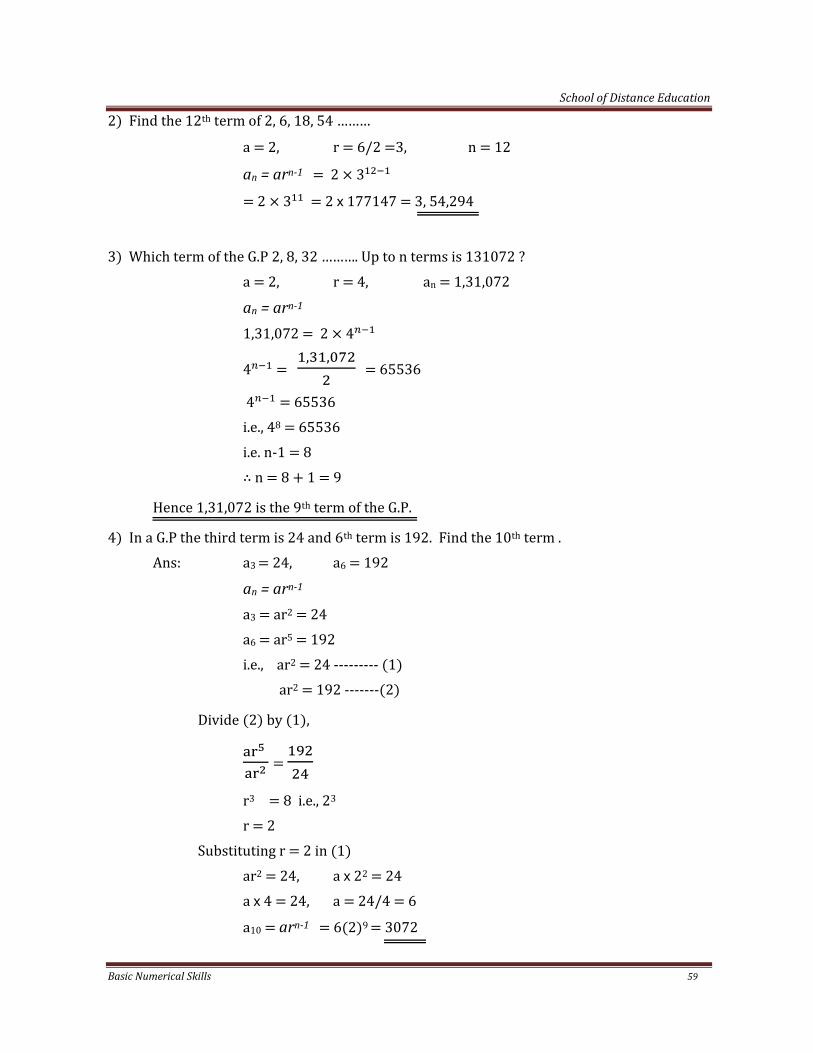
2 Find the 12th term of 2, 6, 18, 54 ………
a 2, r 6/2 3, n 12
an = arn1 2 3
2 3 2 177147 3, 54,294
3 Which term of the G.P 2, 8, 32 ………. Up to n terms is 131072 ? a 2, r 4, an 1,31,072
an = arn1
1,31,072 2 4
4 , , 65536
4 65536 i.e., 48 65536 i.e. n‐1 8 n 8 1 9
Hence 1,31,072 is the 9th term of the G.P.
4 In a G.P the third term is 24 and 6th term is 192. Find the 10th term . Ans: a3 24, a6 192
an = arn1
a3 ar2 24 a6 ar5 192 i.e., ar2 24 ‐‐‐‐‐‐‐‐‐ 1 ar2 192 ‐‐‐‐‐‐‐ 2
Divide 2 by 1 ,
r3 8 i.e., 23 r 2 Substituting r 2 in 1
ar2 24, a 22 24 a 4 24, a 24/4 6
a10 arn1 6 2 9 3072

School of Distance Education
Basic Numerical Skills 60
Sum of ‘n’ terms of a G.P
Let ‘a’ be the first term and ‘r’ be the common ratio and Sn the sum of the ‘n’ terms of G.P.
Then Sn or
When r is less than 1, we can apply first formula.
1 Find the sum of the series.
1024 512 256 ………to 15 terms
Asn: a 1024, n 15, r ½
Sn
½
½
½
1024
2048
2 Find the sum of 1 3 9 27 . . . . . . . to 10 terms. a 1, r 3, n 10
Sn =
=
= = 29524
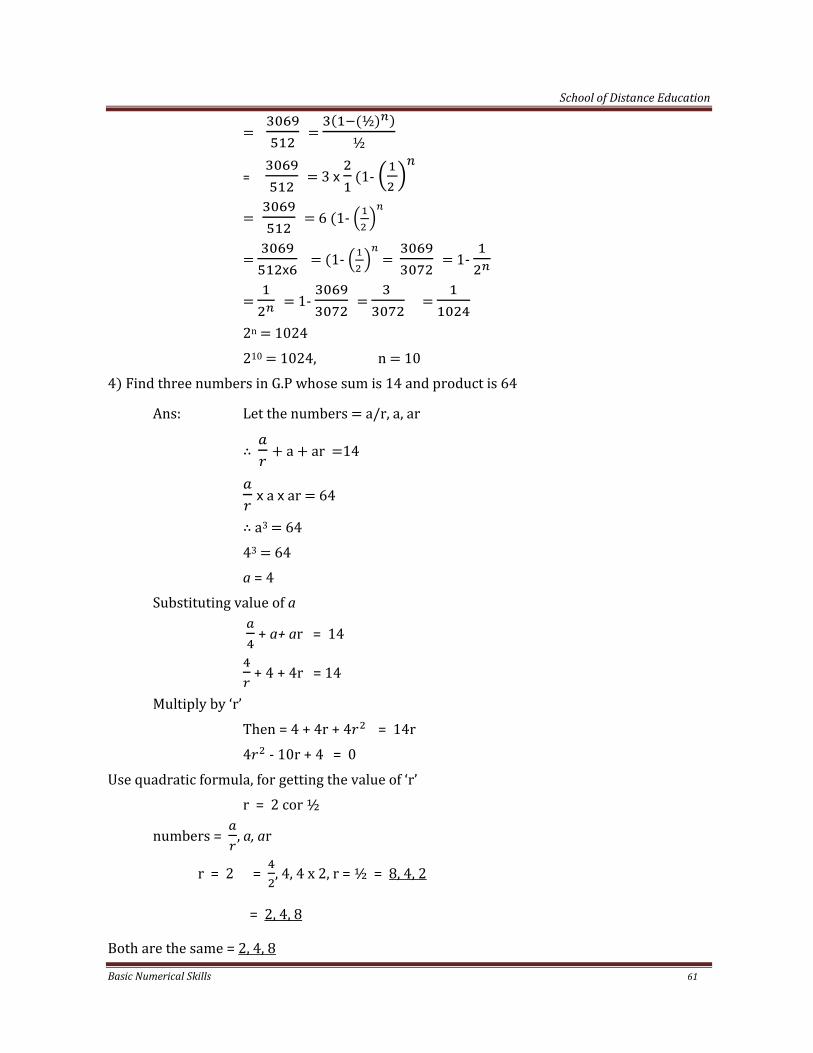
3) How many terms of the G.P 3, 3/2, 3/4 , …………….. are needed to give the sum
Ans: a = 3, r = ½, Sn =
Sn
½½
School of Distance Education
Basic Numerical Skills 61
½
½
= 3 1‐
6 1‐
1‐ 1‐
1‐
2n 1024
210 1024, n 10 4 Find three numbers in G.P whose sum is 14 and product is 64
Ans: Let the numbers a/r, a, ar
a ar 14
a ar 64
a3 64 43 64 a = 4 Substituting value of a
+ a+ ar = 14
+ 4 + 4r = 14
Multiply by ‘r’
Then = 4 + 4r + 4 = 14r
4 ‐ 10r + 4 = 0
Use quadratic formula, for getting the value of ‘r’ r = 2 cor ½
numbers = , a, ar
r = 2 = , 4, 4 x 2, r = ½ = 8, 4, 2
= 2, 4, 8
Both are the same = 2, 4, 8

School of Distance Education
Basic Numerical Skills 62
5) A Person has 2 parents, 4 grand parents, 8 great grant parents and so on. Find the number
of his ancestors during the ten generations preceding his won.
a = 2, r = 2, n = 10
=
=
=
= 2 2 1 = 2046
Number of ancestors preceding the person is 2046.
Geometric Mean
One geometric mean of two positive numbers a and b is the number √ . Therefore, the geometric mean of 2 and 8 is 4. We can insert as many numbers as we like between a and b to make the sequence in a G.P. Let G1, G2, G3, ………….. Gn be ‘n’ number between a and b, then G1 = ar, G2 = ar2, G3 = ar3, Gn = arn
1) Insert three G.M. between 1 and 256
Ans. a = 1, an = 256, n = 5, r = ?
an =
256 = 1
256 =
256 =
256 = r4
256 = 44, r = 4
G.M. are ar, ar2, ar3
1 4, 1 42, 1 43 = 4, 16, 64
G.P = 1, 4, 16, 64, 256

School of Distance Education
Basic Numerical Skills 63
2) Find the G.M between 4 is 16
Ans: G.M = √4 16 = √64 = 8
3) Insert 5 geometric means between 2 and 1458 Ans: a = 2, n = 7, an = 1458
an =
1458 = 2
1458 = 2r6 2r6 = 1458
r6 = , r6 = 729
r6 = 36
r = 3 G.M. = ar, ar2, ar3, ar4, ar5 = 2 3, 2 32, 2 33, 2 34, 2 35 = 6, 18, 54, 162, 486, 486 G.P. = 2, 6, 18, 54, 162, 486, 1458
4) If the A.M. between two positive numbers is 34 and their G.M. is 16. Find the numbers?
Ans: Let the numbers a and b
A.M. = = 34 G.M = √ = 16 a +b = 68 a b = 256 b = 68 – a ab = 256 a(68‐a) = 256 a2 ‐ 68a = 256 a2 ‐ 68a ‐256 = 0
Using quadratic formula a = 4 or 64
When a = 4, b = 64

School of Distance Education
Basic Numerical Skills 64
When a = 64, b = 4
Required numbers are 64 and 4
5) Find the three numbers in G.P whose sum is 26 and product is 216.
Ans: Let the number is G.P be
a/r, a, ar
a/r, a/ ar = 216
i.e. a3 = 216, 63 = 216
a = 6
a/r + a + ar = 6/r + 6 + 6r = 26
= 6/r + 6r = 26 – 6
= 6/r + 6r = 20
Multiply by r
= 6 + 62 = 20r
= 62 – 20r + 6
= 62 – 20 r + 6 = 0
Solving by using quadratic formula
Then r = 1/3 or 3
Required numbers a/r, a, ar
r = 3
6/3, 6, 6 3 = 2, 6, 18

School of Distance Education
Basic Numerical Skills 65
MATHEMATICS OF FINANCE
Simple interest
It is the interest calculated on principal amount at the fixed rate .
Simple Interest =
Where P = Principal amount, n = number of year, r = rate of interest per annum
Amount at the end of nth year = P + or
P(1 + )
or principal amount + interest 1) What is the simple interest for Rs. 10, 000 at the rate of 15% per annum for 2 years? Ans: P = 10,000, n = 2 years, r = 15
Interest = = ,
= Rs. 3, 000
2) Find the total interest and amount of the end of 5th year for as 10,000 at 10% per annum, simple interest.
Ans: P = 10,000, n = 5 years, r = 10%
Interest = = ,
= Rs. 5, 000
Amount at the end
5th year = P(1 + )
= 10,000 1
= 10,000 1
= 10,000
= 10,000 1.5 = 15,000

School of Distance Education
Basic Numerical Skills 66
3) Find the simple interest and amount for Rs. 25,000 at 10% p. a for 26 weeks.
Ans: P = 25,000 n = 26/52, r = 10%
Interest = = , 26
52
= , ½
= , = 1250
Amount at the end = P(1 + )
= 25000 12652 10100
= 25000 1
= 25000
= 25000 1.05 = 26250
4) Find the simple interest and amount for Rs. 50,000 at 7.5% p. a for 4 months.
Ans: P = 50,000, n = 4/12, r = 7.5%
Simple Interest = , 4
12 .
= , 1/3 .
= , . = 1250
Amount = 5000 1412 7.5100
= 5000 1 .
= 5000 .
= 5000 1.025 = 51250

School of Distance Education
Basic Numerical Skills 67
5) Find the number of years in which a sum of money will double itself at 25% p. a, simple interest.
Ans: P = p, Amount = 2P, r = 25, n = ?
Amount = P(1 + )
2P = P(1 + )
i.e., 2 = (1 + 100 )
= 2 – 1 =
= 1 =
nr = 100 r = 25, n = 4 number of years = 4
6) At what rate would a sum of money double in 20 years ?
Ans: P = p, A = 2p, n = 20, r = ?
Amount = P(1 + )
2P = P(1 + )
i.e., 2 = 1 + 100
= 2 – 1 =
= 1 =
= nr = 100 n = 20, then r = 5 Rate of interest = 5% per annum.
7) Find the number of years an amount of Rs. 8000 will take to become Rs. 12000 at 6% p. a. Simple interest.
Ans: P = 8000, A = 12000, r = 6, n = ?
Total interest 12000 – 8000 = 2000

School of Distance Education
Basic Numerical Skills 68
Interest =
4000 =
4000 100 = 8000 6 n
400000 = 48000n 48000n = 4,00,000
n = = 8.33 years
8) Find the rate of interest at which an amount of Rs. 12000 will become Rs. 15000 at the end of 10th year.
Ans: A = 15000, P = 12000, n = 1, r = ?
Total interest 15000 – 12000 = 3000
Interest =
3000 =
3000 100 = 12000 10 r
300000 = 120000r
r = = 2.5
Rate of interest = 2.5%
9) A certain sum amounts to Rs. 678 in 2 years and to Rs. 736.50 in 3‐5 years find the rate of interest and principal amount.
Ans: Amount for 2 years = 678
“ 3‐5 years = 736.50
Amount = P(1 + )
678 = P(1 + ) ‐‐‐‐‐‐‐‐‐(1)
736.50 = P(1 +.
) ‐‐‐‐‐‐‐‐(2)
Divide (1) by (2)

School of Distance Education
Basic Numerical Skills 69
= . =
1
1 .
= . = 100 2r
100 3.5r
= 678(100 + 3.5r) = 736.50(100 + 2r)
= 67800 + 2373r = 73650 + 1473r = 2373r – 1473r = 73650 – 67800
= 900r = 5850
= r = 5850/900 = 6.5
Substituting the value of r
P(1 + ) =678
P(1 + .
) =678
P(1 + ) =678
P( ) = 678
P(1.13) = 678
P = 678/1.13 = 600
Rate of interest = 6.5%
Principal amount at the begining = 600
10) A person lends Rs. 1500, a part of it at 5% p.a. and the other part at 9% p.a. If he receives a total amount of interest of Rs. 162 at the end of 2 years. Find the amount lent at different rate of interest.
Ans: Let x is the Principal of 1st part
Then principal of 2nd part = 1500 – x
Total interest = 162
Interest =
Total interest = interest of 1st part and interest of 2nd part

School of Distance Education
Basic Numerical Skills 70
162 = +
= + = 162
= = 162
10x + (27000 – 18 x) = 162 100
10x – 18x = 16200 – 27000
‐8x = ‐10800
8x = 10800
x = 10800/8 = 1350
Principal amount of 1st part = 1350
Principal amount of 2nd part = 150
Compound Interest
Compound interest means interest calculated on principal amount plus interest. Let ‘p’ be the principal ‘r’ be the rate of interest (compound) p.a., ‘n’ be the number of years then
Amount = P 1
Total interest = A – P
1) Find CI on Rs. 25200 for 2 years at 10% p.a compounded annually?
Ans: P = 25200, r = 10, n = 2
A = P 1
= 25200 1
= 25200
= 25200 (1.10)2
= 25200 1.21 = 30492 C1 = 30492 – 25200
= 5292 ======

School of Distance Education
Basic Numerical Skills 71
2) Find the Compound Interest Rs.10,000/‐ for 2½ years at 10% p.a..
Ans: P = 10,000 n = 2½ r = 10
Amount for 2 years = p 1 n
= 10,000 1 2
= 10,000 2
= 10,000 x (1.1)2
= 10,000 x 1.21
= 12,100/‐
Interest for 2 years = 2100
Interest for 6 months = 12100 x x
= 605
Total interest for 2½ years = 2100 + 605
= 2,705/‐ =======
3) X borrowed Rs.26,400/‐ from a bank to buy a scooter at the rate of 15% p.a. compounded yearly. What amount will be pay at the end of 2 years and 4 months to clear the loan.
Ans: p = 26,400/‐ r = 15
n = 2 years 4 months (2 1 3 )
Amount at the end of 2 years = p 1 n
= 26400 1 2
= 26400 2
= 26400 1.152
= 34,914

School of Distance Education
Basic Numerical Skills 72
Interest for 4 months = 34914 x x
= 1745.7
Total amount at the end of 2 years and 4 months
ie 34914 + 1745.7 = 36659.7 ==========
4) Mr. A borrowed Rs.20,000/‐ from a person, but he could not repay any amount in a period of 4 years. So the lender demanded as 26500 which is the rate of interest charged.
Ans: Here interest charged on compound
P = 20,000 n = 4 A = 26500 r = ?
A = p 1 n
26500 = 20000 1 4
= 1 4
1.325 = 1 4
log 1.325 = 4 log 1
0.1222 = 4 log 1
log 1 = .
log 1 = 0.03055
Antilog 0.03055 = 1.073
1 = 1.073
= 1.073 – 1
= 0.073
r = 100 x 0.073 = 7.3% =======

School of Distance Education
Basic Numerical Skills 73
5) The population of a country increases every year by 2.4% of the population at the beginning of first year. In what time will be population double itself? Answer to the nearest year? Ans: p = p A = 2p r = 2.4 n = ?
A = p 1 n
2p = p 1 . n
2p = p . n
2p = 1.024n
p = 1.024n
log 2 = n log 1.024
0.3010 = n x 0.0103
n = ..
= 29.22 = 30 === 6) The population of a city increases every year by 1.8% of the population at the beginning of that year, in how many years will the total increase of population be 30%?
Ans: p = p A = 1.3p r = 1.8 n = ?
A = p 1 n
1.3 p = p 1 . n
1.3p = p . n
1.3 p = 1.018n
1.3 = 1.018n
log 1.3 = n log 1.018
0.1139 = n x 0.0076
n = ..
= 14.987 = 15
=====
School of Distance Education
Basic Numerical Skills 74
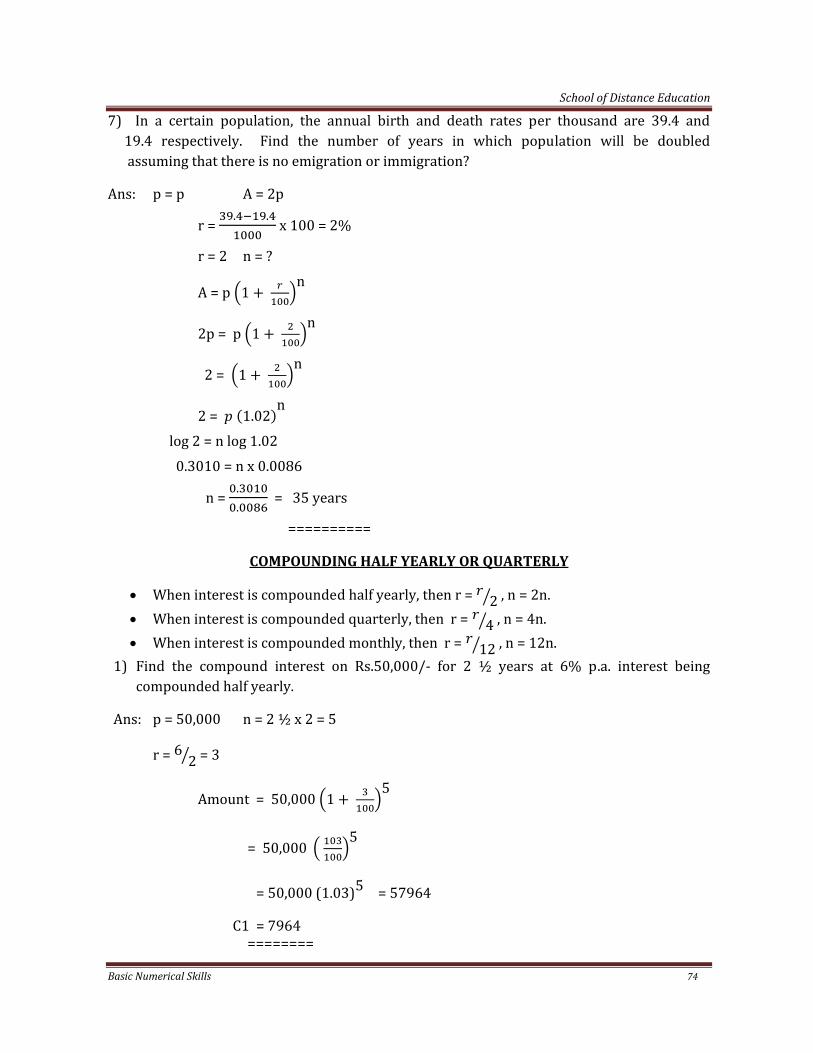
7) In a certain population, the annual birth and death rates per thousand are 39.4 and 19.4 respectively. Find the number of years in which population will be doubled assuming that there is no emigration or immigration?
Ans: p = p A = 2p
r = . .
x 100 = 2%
r = 2 n = ?
A = p 1 n
2p = p 1 n
2 = 1 n
2 = 1.02n
log 2 = n log 1.02 0.3010 = n x 0.0086
n = ..
= 35 years
==========
COMPOUNDING HALF YEARLY OR QUARTERLY
• When interest is compounded half yearly, then r = 2 , n = 2n. • When interest is compounded quarterly, then r = 4 , n = 4n. • When interest is compounded monthly, then r = 12 , n = 12n.
1) Find the compound interest on Rs.50,000/‐ for 2 ½ years at 6% p.a. interest being compounded half yearly.
Ans: p = 50,000 n = 2 ½ x 2 = 5
r = 6 2 = 3
Amount = 50,000 1 5
= 50,000 5
= 50,000 (1.03)5 = 57964
C1 = 7964 ========

School of Distance Education
Basic Numerical Skills 75
2) Find the compound interest on Rs.60,000/‐ for 4 years, if interest is payable half yearly for due first 3 years at the rate of 8% p.a. and for the fourth year, the interest is being payable quarterly at the rate of 6% p.a.
Ans: Amount at in end of 3 years
n = 3 x 2 = 6, r = = 4
p = 6,000
= 6,000 1 6
= 6,000 6
= 6,000 (1.04)6 = 6,000 x 1.2653 = 7592 ======== For last year
n = 1 x 4 = 4, r = = 1.5, p = 7,592
Amount at the end of 4th year
= 7592 1 . 4
= 7592 (1.015)4 = 7592 x 1.0613 = 8057 Interest = 8057 – 6000 = 2057 ======== 3) Find the effective rate of interest if interest is calculated at 10% p.a. half yearly?
Ans: Let p = 100, n = 1 x 2 = 2, r = =5
A = p 1 n
= 100 1 2
= 100 2
= 100 x 1.1025 = 110.25
C 1 = 110.25 – 100 = 10.25 Effective rate = 10.25% p.a. ============

School of Distance Education
Basic Numerical Skills 76
MODULE IV
MEANING AND DEFINITIONS OF STATISTICS
The word statistics is derived from the Latin word ‘Status’ or Italian word ‘Statista’ or German word ‘Statistik’ which means a Political State. It is termed as political state, since in early years, statics indicates a collection of facts about the people in the state for administration or political purpose.
Statistics has been defined either as a singular non or as a plural noun.
Definition of Statistics as Plural noun or as numerical facts:‐ According to Horace Secrist, ‘Statistics are aggregates of facts affected to a marked extent by multiplicity of causes numerically expressed, enumerated or estimated according to a reasonable standard of accuracy, collected in a systematic manner for a predetermined purpose and placed in relation to each other’.
Definition of Statistics as a singular noun or as a method:‐ According to Seliman, “ Statistics is the science which deals with the methods of collecting classifying, comparing and interpreting numerical data collected, to know some light on any sphere of enquiry”.
Characteristics of Statistics
(1) Statistics show be aggregates of facts (2) They should be affected to a marked extent by multiplicity of causes. (3) They must be numerically expressed. (4) They should be enumerated or estimated according to a reasonable standard of
accuracy.
(5) They should be collected in a systematic manner. (6) They should be collected for a predetermined purpose. (7) They should be placed in relation to each other.
Function of Statistics
The following are the important functions of statistics:
1. It simplifies complexity:‐ Statistical methods make facts and figures easily understandable form. For this purpose Graphs and Diagrams, classification, averages etc are used.
2. It presents facts in a proper form:‐ Statistics presents facts in a precise and definite form.
3. It facilitates for comparison:‐ When date are presented in a simplified form, it is easy to compare date.

School of Distance Education
Basic Numerical Skills 77
4. It facilitates for formulating policies:‐ Statistics helps for formulating policies for the companies, individuals, Govt. etc. it is possible only with the help of date presented in a suitable form.
5. It tests hypothesis:‐ Hypothesis is an important concept in research studies. Statistics provides various methods for testing the hypothesis. The important tests are Chi – square, Z‐test, T‐test and F‐test.
6. It helps prediction or forecasting:‐ Statistical methods provide helpful means of forecasting future events.
7. It enlarges individual’s knowledge:‐When data are presented in a form of comparison, the individuals try to find out the reasons for the variations of two or more figures. It thereby helps to enlarge the individual’s knowledge.
8. It measures the trend behavior:‐ Statistics helps for predicting the future with the help of present and past data. Hence plans, programs, and policies are formulated in advance with the help of statistical techniques.
Scope of Statistics or importance or utility of statistics.
The Scope of Statistics in various field are:
(1) Statistics in Business:‐ Statistics is most commonly used in business. It helps to take decision making of the business. The statistical data regarding the demand and supply of product can be collected and analyzed to take decisions. The company can also calculate the cost of production and then the selling price. The existing firms can also make a comparative study about their performance with the performance of others through statistical analysis.
(2) Statistics in Management:‐ Most of the managerial decisions are taken with the help of statistics. The important managerial activities like planning, directing and controlling are properly executed with the help of statistical data and statistical analysis. Statistical techniques can also be used for the payment of wages to the employees of the organization.
(3) Statistics in economics:‐ Statistical data and methods of statistical analysis render valuable assistance in the proper understanding of the economic problems and the formulation of economic policy.
(4) Statistics in banking and finance:‐ Banking and financial activities use statistics most commonly.
(5) Statistics in Administration:‐ The govt. frames polices on the basis of statistical information.
(6) Statistics in research:‐ Research work are undertaken with the help of statistics.
Limitation of statistics
(1) Statistics studies only numerical data (2) Statistics does not study individual cases.

School of Distance Education
Basic Numerical Skills 78
(3) Statistical result are true only an average. (4) Statistics does not reveal the entire story of the problem. (5) Statistics in only one of the methods of study a problem. (6) Statistics can be misused.
Statistical Enquires or Investigation Statistical Investigation is concerned with investigation of some problem with the help of statistical methods. It implies search for knowledge about some problems through statistical device. Different stages in statistical enquiry are:
(1) Planning the enquiry (2) Collection of data. (3) Organization of data. (4) Presentation of data. (5) Analysis of data. (6) Interpretation of data.
(1) Planning the enquiry:‐ The first step in statistical investigation is planning. The investigator should determine the objective and scope of the investigation. He should decide in advance about the type of enquiry to be conducted, source of information and the unit of measurement. Object and scope:‐ The objective of the Statistical enquiry must be clearly defined. Once the objective of enquiry has been determined, the next step is to decide the scope of enquiry. It refers to the coverage of the enquiry. Source of information:‐ After the purpose and scope have been defined, the next step is to decide about the sources of data. The sources of information may be either primary or secondary. Types of enquiry:‐ Selection of type of enquiry depends on a number of factors like object and scope of enquiries, availability of time, money and facilities. Enquiries may be (1) census or sample (2) original or repetitive (3) direct or indirect (4) open or confidential (5) General or special purpose. Statistical unit:‐ The unit of measurements which are applied in the collected data is called statistical unit. For example ton, gram, meter, hour etc. Degree of accuracy:‐ The investigator has to decide about the degree of accuracy that he wants to attain. Degree of accuracy desired primarily depends up on the object of an enquiry. Cost of plan:‐ An estimate of the cost of the enquiry must be prepaid before the commencement of enquiry.
(2) Collection of data:‐ Collection of data implies accounting and systematic recoding of the information gathered in a statistical investigation. Depending on the source, the collected

School of Distance Education
Basic Numerical Skills 79
statistical data are classified under two categories namely primary data and secondary data.
(3) Organization of data:‐ Organization of data implies the arrangement and presentation of data in such a way that it becomes easy and convenient to use them. Classification and tabulation are the two stages of organizing data.
(4) Presentation of data:‐ They are numerous ways in which statistical data may be displayed. Graphs and diagrams are used for presenting the statistical data.
(5) Analysis data:‐ Analysis of data means critical examination of the data for studying characteristics of the object under study and for determining the pattern of relationship among the variables.
(6) Interpretation of data:‐ Interpretation refers to the technique of drawing inference from the collected facts and explaining the significance.
Classification according to variables
Data are classified on the basis of quantitative characteristics such as age, height, weight etc. Geographical Classification:‐ Classified according to geographical differences. Chronological Classification:‐ Classified according to period wise.
Frequency Distribution A frequency distribution is an orderly arrangement of data classified according to the magnitude of observations. When data are grouped into classes of appropriate size indicating the number of observations in each class we get a frequency distribution.
Components of frequency Distribution
(1) Class and class interval (2) Class limits
Methods of classification (1) Classification according to attributes. (2) Classification according to variables.
Classification according to attributes Under this methods the data are classified on the basis of attributes. For example literacy, unemployment etc. are attributes. Following are the classification under this method.
1. Simple classification 2. Manifold classification
In simple classification the data are divided on the basis of only one attributes. In manifold classification the data are classified on the basis more than one attributes. For example population is divided on the basis of sex and literacy.

School of Distance Education
Basic Numerical Skills 80
3. Class mark 4. Class boundaries 5. Magnitude of class interval 6. Class frequency.
Tabulation Tabulation is an orderly arrangement of data in rows and columns. It is a moment of presentation of data. Objectives
1. To simplify complex data 2. To facilitate comparison 3. To facilitate statistical analysis 4. To save time 5. To economies space
Part of a table
1. Table number 2. Title of the table 3. Caption ‐‐‐‐‐‐‐‐ i.e. column headings 4. Sub ‐‐‐‐‐‐‐‐‐‐‐‐‐‐ i.e. row heading
5. Body 6. Head note 7. Foot note 8. Source data.
Collection of data
On the basis of source, data can be collected from primary and secondary source. Primary data Primary data are those collected by the investigator himself. May are original in character. May are truthful and suit for the purpose. But the collection is very expensive and time consuming. Methods of collection of primary data
1. Direct personal interview:‐ In this method investigator collection the data personally. He was to meet the people for collecting the data. This method is suitable: a) When the area of investigation is limited b) When higher degree of accuracy is leaded. c) When the results of investigation to be kept confidential.
School of Distance Education
Basic Numerical Skills 81
2. Indirect oral investigation:‐ Under this method, information are collected from third parties who are is touch with the facts under enquiry.
3. Schedules and Questionnaires methods:‐ Under this method, a list of questions called questionnaire is prepared and information are called from various sources. It is a printed list of questions to be filled by the informations. But schedule is filled by the enumerator.
Essentials of a good questionnaire (1) The person conducting the survey much introduce himself. (2) The number of questions should be kept to the minimum. (3) The question should be as short as possible and simple.
(4) The questions must be arranged in logical order. (5) The questions should be clear. (6) Personal questions should be avoided. (7) Questions should be in the nature of yes or no type. (8) Questions must be of convenient size and easy to handle. (9) Questions should be attractive. (10) Instructions should be given for filing up the form.
Specimen of questionnaire. Secondary data
Secondary data are those data which are collected by someone for this purpose. Secondary data are usually in the shape of finished product. The collection of secondary data is less expensive and less time consuming. Secondary data are collected from published and unpublished sources. Precautions to be taken before using secondary data
(1) Suitability
(2) Adequacy (3) Reliability
Difference between Primary and Secondary data 1. Primary data are original character. But secondary data are not original, they are
collected by somebody else. 2. Primary data are in the shape of raw material. But secondary data are in the shape of
finished product. 3. Collection of primary data is expanse and time consuming. But collection of secondary
data is less expensive and less time consuming. 4. Primary data will be usually adequate and suitable. But secondary data need not be
adequate and suitable for the purpose.

School of Distance Education
Basic Numerical Skills 82
Sampling Sampling is the process obtaining information about an entire population by examining only a part of it. It is the examination of the regenerative items and conclusion of draw for all items coming in that group.
Methods of sampling or techniques of sampling 1. Probability sampling or random sampling 2. Non probability sampling
Probability sampling
Under this method, each items has an equal chance for being selected. Following are the random sampling. (1) Simple random sampling
A simple random sample is a sample selected from a population in such a way that every item of the population has an equal chance of being selected. The selection depends on chance. Eg. Lottery methods.
(2) Systematic sampling
This method is popularly used in those cases where complete list of the population from which sample is to be drawn is available. Under this method the items in the population are included in intervals of magnitude K. From every interval select an item by simple random sample method.
(3) Cluster sampling
Cluster sampling consists in forming suitable clusters of units. All the units is the sample of clusters selected are surveyed.
(4) Quota sampling
In this method each investigator engaged in the collection of data is assigned a quota for investigation.
(5) Multi stage sampling
This is a sampling procedure carried but in several stages. In multistage sampling, firstly units selected by suitable methods of sampling. From among the selected units, sample is drawn by some suitable methods. Further stages are added to arrive at a sample of the desired units.
Non probability sampling
1. Judgment sampling:‐ Under this sampling investigator exercise this discretion in the mater of selecting the items that are to be included in the sample.

School of Distance Education
Basic Numerical Skills 83
2. Convenience Sampling:‐ Convenience sampling is one in which a sample is obtained by selecting such units of the universe which may be conveniently located.
Organization of data
Organizing data mean, the arrangement and presentation of data. Classification and tabulation are the two stages of organizing data.
Classification
The process of arranging data in groups or classes according to similarities called classification.
Objects of classification
1. To simplify the complexity of data.
2. To bring out the points of similarity of the various items.
3. To facilitate comparison.
4. To bring out relationship.
5. To provide basis for tabulation.
Graphs and Diagrams
Graphs and diagrams is one of the statistical methods which simplifies the complexity of quantitative data and make them easily understandable.
Importance of Diagrams & Graphs
1. Attract common people
2. Presenting quantitative facts in simple.
3. They have a great memorizing effect.
4. They facilitate comparison of data.
5. Save time in understanding data.
6. Facts can be a understood without mathematical calculations.
Limitations
1. They can present only approximate values.
2. They can represent only limited amount of information.
3. They can be misused very easily.
4. They are not capable of further mathematical treatment.
5. They are generally useful for comparison purpose only.

School of Distance Education
Basic Numerical Skills 84
General rules for constructing Diagrams
1. Title
2. Proportion between width and height.
3. Selection of scale
4. Foot note
5. Index
6. Neatness and cleanliness
7. Simplicity
8. Attractiveness
Types of Diagrams
1. Dimensional Diagrams
2. Cartograms
3. Pictograms
Dimensional Diagrams
Dimensional Diagrams are those diagrams which show information in terms of length, height, area or volume. They are one dimensional two dimensional or three dimensional.
One Dimensional Diagram
In one dimensional diagram the height will represent the magnitude of observations. Must commonly used one dimensional diagrams are line diagram and Bar diagram.
Line Diagram Line diagrams are one dimensional diagrams. They are drawn to represent values of a variable.
Ex. Draw a line diagram to the following data. Country: A B C D E Population: 10 5 15 13 12 (in million)

School of Distance Education
Basic Numerical Skills 85
Population (in million)
15 10 5 A B C D E Column
Bar Diagrams In a bar diagram only the length is considered. The width of the bar is not given any importance. Following are the important types of bar diagrams.
(1) Simple bar diagram Simple bar diagram represents only one variable. For example height, weight, etc. Year: 2007 2008 2009 2010 2011 2012 Sales 45 55 65 70 50 60 In ‘000’)
45
55
6570
50
60
0
10
20
30
40
50
60
70
80
2007 2008 2009 2010 2011 2012
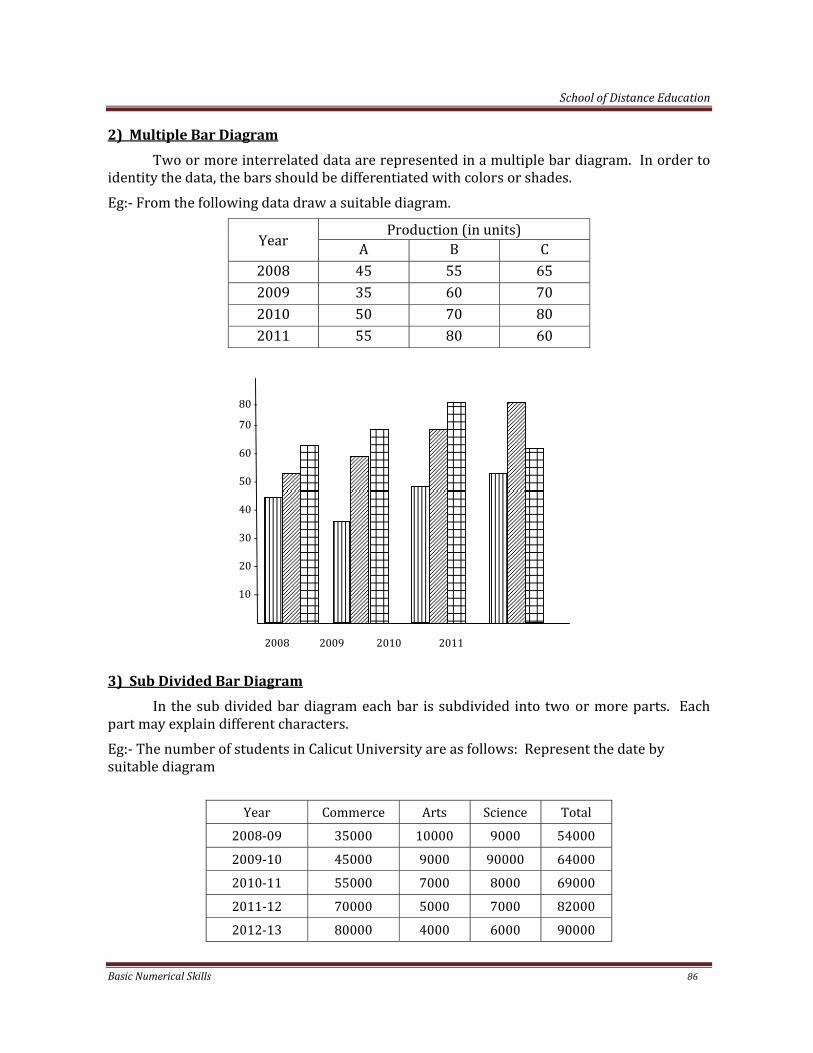
School of Distance Education
Basic Numerical Skills 86
2) Multiple Bar Diagram
Two or more interrelated data are represented in a multiple bar diagram. In order to identity the data, the bars should be differentiated with colors or shades. Eg:‐ From the following data draw a suitable diagram.
Year Production (in units)
A B C2008 45 55 652009 35 60 702010 50 70 802011 55 80 60
80 ‐
70 ‐
60 ‐
50 ‐
40 ‐
30 ‐
20 ‐
10 –
2
2008 2009 2010 2011
3) Sub Divided Bar Diagram
In the sub divided bar diagram each bar is subdivided into two or more parts. Each part may explain different characters. Eg:‐ The number of students in Calicut University are as follows: Represent the date by suitable diagram
Year Commerce Arts Science Total
2008‐09 35000 10000 9000 54000
2009‐10 45000 9000 90000 64000
2010‐11 55000 7000 8000 69000
2011‐12 70000 5000 7000 82000
2012‐13 80000 4000 6000 90000

School of Distance Education
Basic Numerical Skills 87
90 –
80 –
70 –
60 –
50 –
40 –
30 –
20 –
10 –
2008‐09 2009‐10 2010‐11 2011‐12 2012‐13
Commerce
Arts
Science
4) Percentage Bar Diagrams
In percentage bar diagram the length of all the base are equal ie each bar represent
100 percent. The component parts are expressed as percentage to the whole.
Eg:‐ Prepare a subdivided bar diagram on the percentage basis.
Year Direct Cost
Rs Indirect Cost
Rs ProfitRs
Sales Rs
2009 35 15 10 60 2010 40 20 12 72 2011 32 22 8 62 2012 25 35 15 75
Answer
Year Direct Cost in % Indirect Cost in % Profit in % Sales
2009 58 25 17 100 2010 55 28 17 100 2011 52 35 13 100 2012 33 47 20 100

School of Distance Education
Basic Numerical Skills 88
100‐
90 –
80 –
70 –
60 –
50 –
40 –
30 –
20 –
10 –
2009 2010 2011 2012
Direct Cost
Indirect Cost
Profit
Two Dimensional Diagram
In two dimensional diagram the length as well as width have to be considered. The most commonly used two dimensional diagrams is pie diagram, Rectangles, Squares, Circles etc are also two dimensional diagrams. Pie Diagrams
Pie diagrams are used when the aggregate and their divisions are to be shown together. The aggregate is shown by means of a circle and divisions by the sectors of the circle. For example, the selling price of a product can be divided into various segments like factory cost, administrative cost, selling cost and profit. These segments are converted into percentage in order to represent in the pie diagram. In order to prepare the pie diagram, each percentage outlay must be multiplied by 3.6, since the pie diagram contain 360 scale. Eg:‐ Draw a pie diagram from the following data
Prime Cost 30%Factory over Head 18%Administrative overhead 28%Selling & Distribution overhead 14%Profit 10%

School of Distance Education
Basic Numerical Skills 89
Ans:
Prime Cost 30 108 Factory over Head 18 65 Administrative overhead 28 101 Selling & Distribution overhead 14 50Profit 10 36 100 360
Profit 10%
Selling & Distribution Prime Cost 30% Overhead 14% Administrative Overhead 28%
Facory Overhead 18%
Three Dimensional Diagrams
Three dimensional diagrams are prepared in the form of cubes, spheres, cylinders etc. In these diagrams width, length and breadth are important.
Cartograms
Cartograms means the presentation of data in a geographical basis. It is otherwise called as statistical maps. The quantities on the map may be shown through shades, dots or colours etc.
Pictograms
Under the pictograms, data are represented in the form of a appropriate pictures most suited for the data.

School of Distance Education
Basic Numerical Skills 90
GRAPHS
Types of Graphs
(1) Graphs of Frequency Distribution
(2) Graphs of Time Series
Graphs of Frequency Distribution
A frequency distribution can be presented graphically in any of the following ways:
(1) Histogram
(2) Frequency Polygon
(3) Frequency Curves
(4) Ogive or cumulative frequency curves. Histogram
A histogram is a graph of frequency distributions. A histogram consists of bars erected upon the class interval columns.
While constructing histogram, the variable is always taken on the x‐axis and the frequency on the y‐axis. The width of the bars in the histogram will be proportional to the class interval.
Histogram for frequency Distribution having equal Class interval
1) Draw a histogram from the following information
Marks No. of Students0‐10 710‐20 1220‐30 1530‐40 1740‐50 2060‐70 1470‐80 1080‐90 4

School of Distance Education
Basic Numerical Skills 91
20 –
15 –
10 –
5 ‐
0 10 20 30 40 50 60 70 80 90 100
Histogram for unequal Class Interval
Unequal class intervals must be corrected.
Unequal class intervals =
width of the lowest class interval
Draw a histogram from the following data Daily wages No. of workers
15‐20 420‐25 925‐30 1230‐40 2040‐50 1650‐55 755‐60 660‐75 1575‐80 480‐95 995‐100 2

School of Distance Education
Basic Numerical Skills 92
Answer:
Calculation of Frequency Density
Daily wages No. of workers Frequency Density 15‐20 4 420‐25 9 925‐30 12 1230‐40 20 1040‐50 16 850‐55 7 755‐60 6 660‐75 15 575‐80 4 480‐95 9 395‐100 2 2
20 –
15 –
10 –
5 ‐
0 10 20 30 40 50 60 70 80 90 100
Daily Wages

School of Distance Education
Basic Numerical Skills 93
Frequency Polygon
It is a curve instead of bars. There are two methods for constructing frequency polygon. First, histogram should be drawn and mark mid point of upper side of each bar and join such joints by a curve.
In the second method, first of all plot the frequencies corresponding to midpoints of various class intervals. Then join all the plotted points to get the frequency polygon curve. 3) Ogive or Cumulative Frequency Curve
A frequency distribution when cumulated, we get cumulative frequency distribution and curve drawn is known as ogive. An ogive can either less than ogive or more than ogive. Less than ogive curve is drawn on the basis of less than cumulative frequency distribution and more than ogive is drawn on the basis of more than cumulative frequency distribution. Example :
From the following data drawn less than and more than ogives
Marks : 0‐10 10‐20 20‐30 30‐40 40‐50 50‐60 60‐70 70‐80 No. of
Students 10 20 35 30 20 15 10 10
Answer :
Less than CF F More than CF F
Less than 0 0 More than 0 150
Less than 10 10 More than 10 140
Less than 20 30 More than 20 120
Less than 30 65 More than 30 95
Less than 40 95 More than 40 55
Less than 50 125 More than 50 35
Less than 60 130 More than 60 20
Less than 70 140 More than 70 10
Less than 80 150 More than 80 0

School of Distance Education
Basic Numerical Skills 94
150 –
120 –
90 –
60 –
30 –
0 10 20 30 40 50 60 70 80
Measures of central tendency or Averages
An average is a single value that represents a group of values. It represents the whole series and conveys general idea of the whole group. Characteristics of a good average or Requisites or Essentials properties of average
(1) Clearly defined (2) Easy to understand (3) Simple to compute (4) Based on all items (5) Not be unduly affected by extreme observations. (6) Capable of further algebraic treatment (7) Sampling stability.
Types of averages
1) Arithmetic Mean
2) Median
3) Mode
4) Geometric mean
5) Harmonic Mean
Less than curve
More than

School of Distance Education
Basic Numerical Skills 95
Arithmetic Mean (AM)
It is the value obtained by adding together all the items and by dividing the total number of items. Arithmetic mean may either be
(1) Simple arithmetic Mean or (2) Weighted arithmetic Mean
Simple Arithmetic Mean
It is the mean of items which give equal importance to all items. It is denoted by x
x = ∑
Where = Sum of given variables N = Number of items Calculation of Arithmetic Mean
(a) Individual Series :
(i) Direct Method
x= ∑
(ii) Short Cut Method
x = A + ∑
A = Assumed mean
D = X – A
n = total number of items
(b) Discrete Series
(i) Direct Method
x = ∑
(ii) Short Cut method
x = A + ∑
d = X – A
(iii) Step deviation method
x = A + ∑ ′ × C
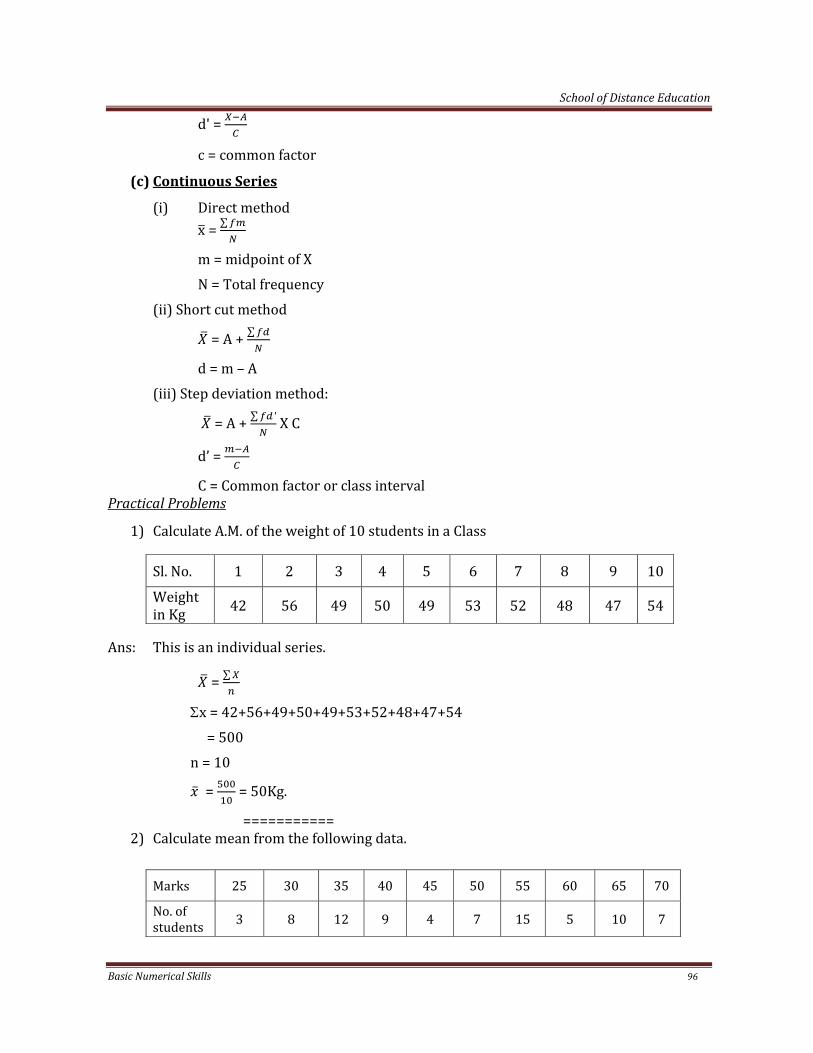
School of Distance Education
Basic Numerical Skills 96
d' =
c = common factor
(c) Continuous Series
(i) Direct method x = ∑
m = midpoint of X N = Total frequency
(ii) Short cut method
= A + ∑
d = m – A (iii) Step deviation method:
= A + ∑ ′ X C
d’ =
C = Common factor or class interval Practical Problems
1) Calculate A.M. of the weight of 10 students in a Class
Sl. No. 1 2 3 4 5 6 7 8 9 10
Weight in Kg 42 56 49 50 49 53 52 48 47 54
Ans: This is an individual series.
= ∑
Σx = 42+56+49+50+49+53+52+48+47+54 = 500 n = 10
= = 50Kg.
=========== 2) Calculate mean from the following data.
Marks 25 30 35 40 45 50 55 60 65 70
No. of students 3 8 12 9 4 7 15 5 10 7
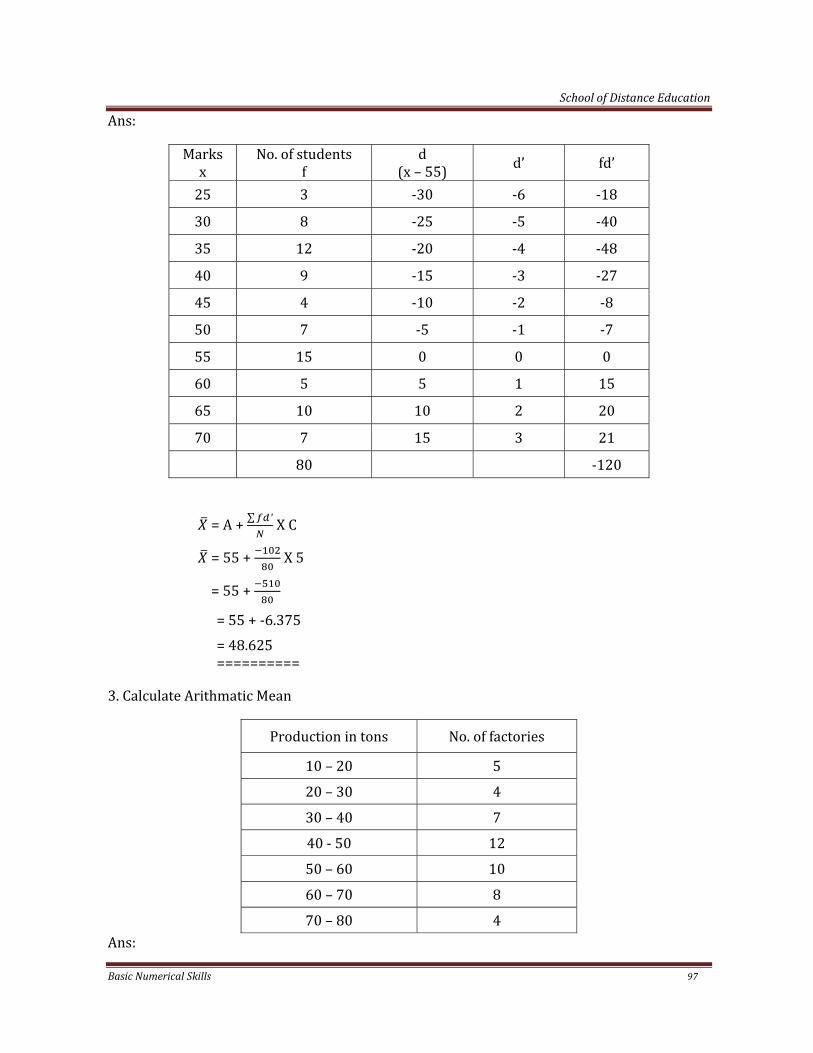
School of Distance Education
Basic Numerical Skills 97
Ans:
Marks x
No. of students f
d (x – 55) d’ fd’
25 3 ‐30 ‐6 ‐18
30 8 ‐25 ‐5 ‐40
35 12 ‐20 ‐4 ‐48
40 9 ‐15 ‐3 ‐27
45 4 ‐10 ‐2 ‐8
50 7 ‐5 ‐1 ‐7
55 15 0 0 0
60 5 5 1 15
65 10 10 2 20
70 7 15 3 21
80 ‐120
= A + ∑ ′ X C
= 55 + X 5
= 55 +
= 55 + ‐6.375 = 48.625 ==========
3. Calculate Arithmatic Mean
Production in tons No. of factories
10 – 20 5
20 – 30 4
30 – 40 7
40 ‐ 50 12
50 – 60 10
60 – 70 8
70 – 80 4 Ans:

School of Distance Education
Basic Numerical Skills 98
X f m fm
10 – 20 5 15 75
20 – 30 4 25 100
30 – 40 7 35 245
40 ‐ 50 12 45 540
50 – 60 10 55 550
60 – 70 8 65 520
70 – 80 4 75 300
80 2330
= ∑ = = 46.6 ==========
4. Following are the data related with the production of a product during January in 100 factories
Production in tons No. of factories
0 – 100 7
100 – 200 15
200 – 300 10
300 – 400 9
400 – 500 10
500 – 600 12
600 ‐ 700 8
700 – 800 13
800 – 900 9
900 ‐ 1000 7

School of Distance Education
Basic Numerical Skills 99
Ans:
x f m d (m – A) d’ fd’
0 – 100 7 50 ‐500 ‐5 ‐35
100 – 200 15 100 ‐400 ‐4 ‐60
200 – 300 10 250 ‐300 ‐3 ‐30
300 – 400 9 350 ‐200 ‐2 ‐18
400 – 500 10 450 ‐100 ‐1 ‐10
500 – 600 12 550 0 0 0
600 ‐ 700 8 650 100 1 8
700 – 800 13 750 200 2 26
800 – 900 9 850 300 3 27
900 ‐ 1000 7 950 400 4 28
100 ‐64
= A + ∑ ′ X C
= 550 + X 100
= 486 ========
Calculation of Arithmatic Mean for open end classes
If the lower limit of the first class and upper limit of the last class are not known, it is called open end classes.
1. Calculate A.M.
Below 10 5
10 – 20 12
20 – 30 14
30 – 40 10
Above 40 8

School of Distance Education
Basic Numerical Skills 100
Ans:
X f m fm
0 – 10 5 5 25
10 – 20 12 15 180
20 – 30 14 25 350
30 – 40 10 35 350
40 ‐ 50 8 45 360
49 1265
= ∑ = = 25.82 ==========

School of Distance Education
Basic Numerical Skills 101
MODULE V
Weighted Mean
Weighted means are obtained by taking in to account of weights. Each value is multiplied by its weight and total is divided by the total weight to get weighted mean.
= ∑
∑
= weighted A.M.
w = weight
x = given variable
Median
Median is the middle value of the series. When the series are arranged in the ascending order or descending order Median is a positional average.
Calculation of Median
Individual series
Firstly arrange the series.
Median = Size of item.
Discrete series
Median = Size of item.
Continuous series
Median Class =
Median = + . × C
= Lowerlimit of median class
c.f = culmulative frequency of preceding median class
f = frequency of median class
C = Class interval
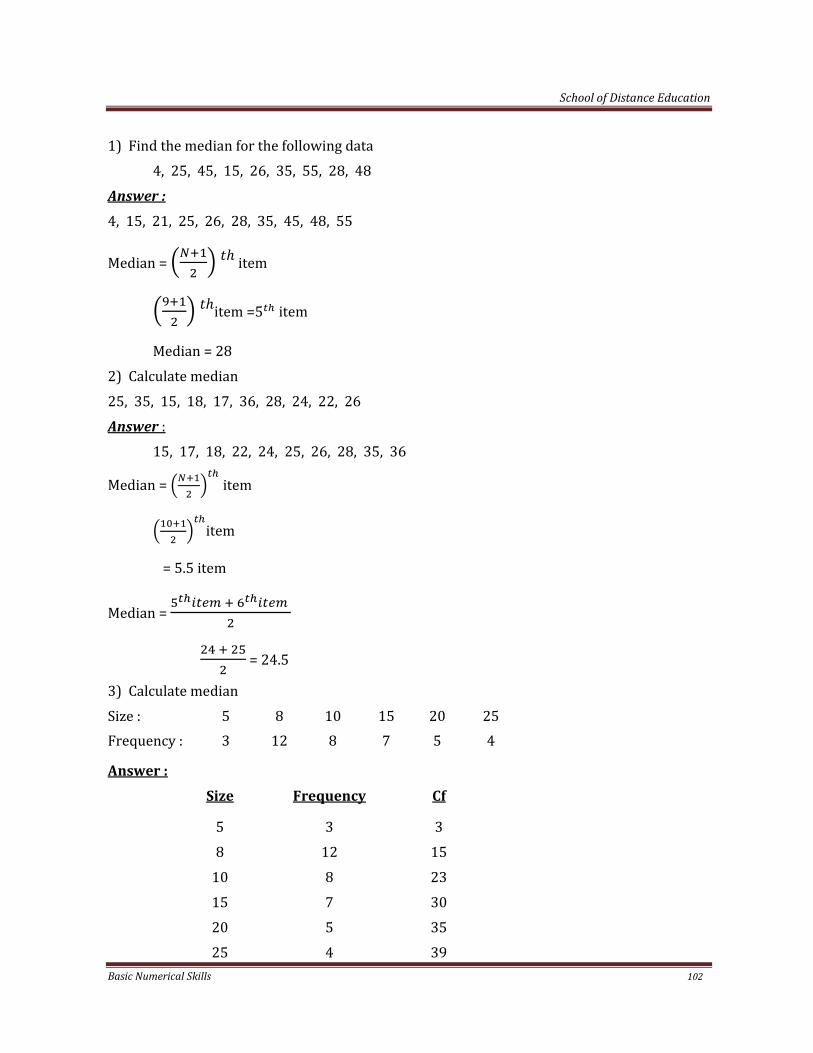
School of Distance Education
Basic Numerical Skills 102
1) Find the median for the following data 4, 25, 45, 15, 26, 35, 55, 28, 48 Answer :
4, 15, 21, 25, 26, 28, 35, 45, 48, 55
Median = item
item =5 item
Median = 28 2) Calculate median 25, 35, 15, 18, 17, 36, 28, 24, 22, 26 Answer :
15, 17, 18, 22, 24, 25, 26, 28, 35, 36
Median = item
item
= 5.5 item
Median =
= 24.5
3) Calculate median Size : 5 8 10 15 20 25Frequency : 3 12 8 7 5 4
Answer :
Size Frequency Cf
5 3 3 8 12 15 10 8 23 15 7 30 20 5 35 25 4 39
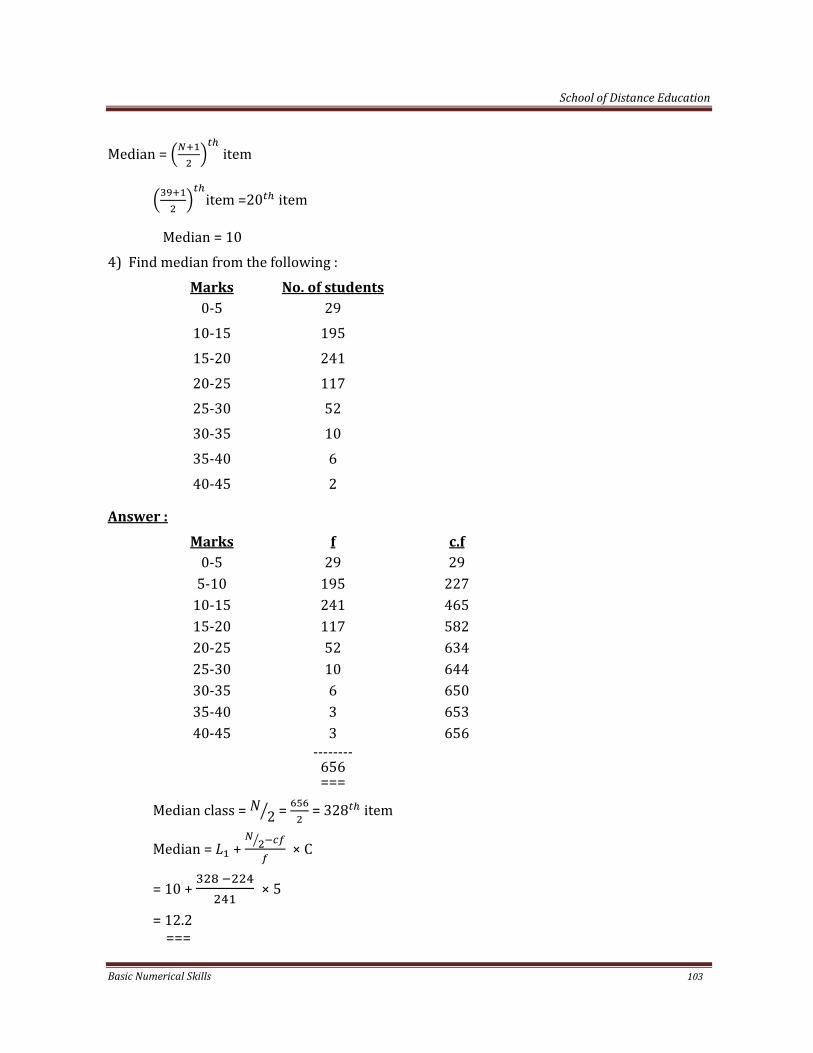
School of Distance Education
Basic Numerical Skills 103
Median = item
item =20 item
Median = 10 4) Find median from the following : Marks No. of students 0‐5 29 10‐15 195 15‐20 241 20‐25 117 25‐30 52 30‐35 10 35‐40 6
40‐45 2
Answer :
Marks f c.f 0‐5 29 29 5‐10 195 227 10‐15 241 465 15‐20 117 582 20‐25 52 634 25‐30 10 644 30‐35 6 650 35‐40 3 653 40‐45 3 656 ‐‐‐‐‐‐‐‐
656 ===
Median class = 2 = = 328 item
Median = + × C
= 10 + × 5
= 12.2 ===

School of Distance Education
Basic Numerical Skills 104
Mode
Mode is the value of item of series which occurs most frequently. Mode in individual series
In the case of individual series, the value which occurs more number of times is mode. When no items appear more number of times than others, then mode is the ill defined. In this case :
Mode = 3 median – 2 mean
Mode in discrete series
In the case of discrete series, the value having highest frequency is taken as mode.
Mode in continuous series
Mode lies in the class having the highest frequency.
Mode =
= lower limit of the model class
= frequency of the model class , = frequency of class preceding and succeeding modal class.
1) Find mode 1, 2, 5, 6, 7, 3, 4, 8, 2, 5, 4, 5
Answer :
Mode = 5 == 2) Find mode
4, 2, 6, 3, 8, 7, 9, 1 Answer
Mode is ill defined
Mode = 3 median – 2 mean
= ∑ = = 5
Median : 1, 2, 3, 4, 6, 7, 9
Median = item = = 4.5
Median = = = 5
Mode = 3 × 5 – 2 × 5 = 5 ==

School of Distance Education
Basic Numerical Skills 105
3) Find mode Size : 5 8 10 12 15 20 25
Frequency: 3 7 2 9 5 6 2
Mode = 2, since 12 has the highest frequency
4) Calculate mode
Size : 0‐5 5‐10 10‐15 15‐20 20‐25 25‐30
Frequency: 20 24 32 28 20 26 Answer
Size Frequency 0‐5 20 5‐10 24 10‐15 32 ‐‐‐‐ ‐Models class 15‐20 28 20‐25 20 25‐30 26
Mode = +
= 10+
= 10 +
= 13.3 ===
5) Calculate mean, median and mode
Marks No. of students
Less than 10 Less than 20 Less than 30 Less than 40 Less than 50 Less than 60 Less than 70 Less than 80 Less than 90 Less than 100
4 9 15 18 26 30 38 50 54 55

School of Distance Education
Basic Numerical Skills 106
Answer :
Marks Frequency M fm c.f.
0‐10 10‐20 20‐30 30‐40 40‐50 50‐60 60‐70 70‐80 80‐90
90‐100
4 5 6 3 8 4 8 12 4
1
5 15 25 35 45 55 65 75 85
95
20 75 150 105 360 220 520 900 340
95
4 9 15 18 26 30 38 50 54
55
Mean
= ∑
=
= 50.63 ====
Median
= item
= item
= 27.5 item
= + . × C
= 50 + .
× 10
= 50 + . ×10
= 73.33 ===

School of Distance Education
Basic Numerical Skills 107
6) Calculate mean, median and mode
Marks No. of studentsMore than 0More than 10 More than 20 More than 30 More than 40 More than 50 More than 60 More than 70 More than 80 More than 90
8077 72 65 55 43 28 16 10 8
Answer X f m fm c.f
0‐10 10‐20 20‐30 30‐40 40‐50 50‐60 60‐70 70‐80 80‐90 90‐100
35 7 10 12 15 12 6 2 8
515 25 35 45 55 65 75 85 95
1575 175 350 540 825 780 450 170 760
3 8 15 25 37 52 64 70 72 80
Mean
= ∑
=
= 51.5 ===
Median = 802 item
= 40 item
= + . × C
= 50 + × 10
= 50 + × 10
= 52 ==

School of Distance Education
Basic Numerical Skills 108
Mode = + ×C
= 50 + ×10
= 50 + ×10
= 50 + ×10
= 55 ==
Geometric Mean
Geometric mean is defined as the root of the product of those in values.
G.m = Antilog ∑
G.M in Individual series
G.M = Antilog ∑
G.M in Discrete series
G.M = Antilog ∑
G.M in continuous series
G.m = Antilog ∑
x = midpoint of x
1) Find Geometric mean of the following
57.5, 87.75, 53.5, 73.5, 81.75
Answer:
X logx
57.5 87.75 53.5 73.5 81.75
1.75971.9432 1.7284 1.8663 1.9125
9.2101 ====

School of Distance Education
Basic Numerical Skills 109
G.M. = Antilog ∑
= Antilog .
= Antilog (1.84202) = 69.51 ====
2) Find the G.M 2, 4, 8, 12, 16, 24 X logX
2 4 8 12 16 24
0.30100.6021 0.9031 1.0792 1.2041 1.3802 5.4697
G.M. = Antilog ∑
= Antilog .
= Antilog (.9116)
= 8.158 ====
3) Find G.M from the following data
Size : 5 8 10 12Frequency: 2 3 4 1
Ans: X f logX f logX
5 8 10 12
2 3 4 1
.6990
.9031 1.0000 1.0792
1.39802.7093 4.0000 1.0792
10 9.1865
G.M. = Antilog ∑
= Antilog .
= Antilog (.91865) = 8.292 ====

School of Distance Education
Basic Numerical Skills 110
4) Calculate G.M.
Daily Income ( ) 0‐20 20‐
40
40‐
60
60‐80 80‐
100
No. of workers 5 7 12 8 4
Answer :
X f x( logx f logx 0‐20 20‐40
40‐60 60‐80 80‐100
5 7
12 8 4
1020
30 40 50
1.00001.4771
1.6990 1.8451 1.9542
5.000010.3397
20.3880 14.7608 7.8168
36 58.3053
G.M. = Antilog ∑
= Antilog .
= Antilog 1.6195916
= 41.65 ====
Harmonic Mean
Harmonic mean is defined as the reciprocal of the mean of the reciprocals of those values. It applied in averaging rates, times etc.
H.M = ∑
H.M in Discrete series
H.M = ∑
H.M in continuous series
H.M = ∑
x = midpoint of x

School of Distance Education
Basic Numerical Skills 111
1) Calculate H.M. from the following
1)Find the H.M.
2, 3, 4, 5
Answer:
x 1x
2 3 4 5
0.5 0.33 0.25 0.20
1.28
H.M. = ∑
= .
= 3.125 ====
2) Find the H.M.
Size 6 10 14 18
F 20 40 30 10
Answer :
Size f 1 f 1
6 10 14 18
20 40 30 10
0.16670.1000 0.0714 0.0556
3.3344.000 2.142 0.556
100 10.032
H.M =
∑ = .
= 9.97 ===

School of Distance Education
Basic Numerical Skills 112
3) From the following data, calculate the value of HM?
Income ( ) No. of persons
10 – 20 4
20 – 30 6
30 – 40 10
40 – 50 7
50 – 60 3 Ans:
Income ( ) f x in m 1 f(
10 – 20 4 15 0.667 0.2666
20 – 30 6 25 0.0400 0.2400
30 – 40 10 35 0.0286 0.2857
40 – 50 7 45 0.0222 0.1556
50 – 60 3 55 0.0182 0.0545
30 1.0023
HM = ∑
= .
= 29.93
=========
MEASURES OF DISPERSION OR VARIABILITY
Dispersion means a measure of the degree of deviation of data from the central value.
Measures of Dispersion are classified into (1) Absolute Measures (2) Relative Measures.
Absolute Measures of dispersion are expressed in the same units in which data are collected. They measure variability of series. Various absolute measures are:
(i) Range (ii) Quartile Deviation (iii) Mean Deviation (iv) Standard Deviation

School of Distance Education
Basic Numerical Skills 113
Relative measure is also called coefficient of dispersion. They are useful for comparing two series for their variability. Various relative measures are:
(i) Coefficient Range
(ii) Coefficient of Quartile Deviation
(iii) Coefficient of Mean Deviation
(iv) Coefficient of Variation
RANGE
The range of any series is the difference between the highest and the lowest values in the series.
Range = H – L
H = Highest variable
L = Lowest variable
Coefficient of Range =
1) Find the Range and Coefficient of Range.
75, 29, 96, 15,7,8,11, 7, 49
Ans:
Range = H – L
= 96 – 74 = 92
======
Coefficient of Range = = = = 0.92
=======
2) Find Range and Coefficient of Range.
Wages 5 10 15 20 25 30
No. of employees 2 5 6 7 4 6 Ans:
Range = H – L
= 30 – 5 = 25 ======
Coefficient of Range = = = = 0.71
==========

School of Distance Education
Basic Numerical Skills 114
3) Find out Range and Coefficient of Range.
Marks 20 – 29 30 – 39 40 – 49 50 – 59 60 – 69
No. of Students 8 12 20 7 3
Ans:
Marks f
19.5 – 29.5 8
29.5 – 39.5 12
39.5 – 49.5 20
49.5 – 59.5 7
59.5 – 69.5 3
Range = H – L
= 69.5 – 19.5 = 50 ====
Coefficient of Range = = . .. .
= = 0.56 =====
QUARTILE DEVIATION
Quartile Deviation is defined as the half distance between the third and first quartiles.
Quartile Deviation =
Coefficient of Quartile Deviation =
Quartile Deviation in Individual Series
Quartile Deviation =
Q1 = size of th Item
Q3 = size of 3 th item

School of Distance Education
Basic Numerical Skills 115
Quartile Deviation in Discrete Series
Quartile Deviation =
Q1 = size of th Item
Q3 = size of 3 th item
Quartile Deviation in Continuous Series
Quartile Deviation =
Q1 = size of th Item
Q3 = size of 3 th item
Then, Q1 = L1 + – .
x c
Q3 = L1 + –
x c
4) Calculate Quartile Deviation from the following:
25, 15, 30, 45, 40, 20, 50
Also find coefficient of quartile deviation.
Ans: Arrange the series, then
15, 20, 25, 30, 40, 45, 50
Q1 = th Item = = 2nd Item
= 20
Q3 = 3 th item = 3 x 2 = 6th Item
= 45
Quartile Deviation = = = 12.5
Coefficient of Quartile Deviation =
= = = 0.385 =======

School of Distance Education
Basic Numerical Skills 116
2) Find Quartile Deviation and Coefficient of Quartile Deviation.
23, 25, 8, 10, 9, 29, 45, 85, 10, 16
Ans: Arrange the series, then
8, 9, 10, 10, 16, 23, 25, 29, 45, 85
Q1 = size of th Item = th Item = 2.75th Item
ie., 2nd Item + .75 (3rd Item – 2nd Item)
= 9 + .75 (10 – 9)
= 9 + .75 X 1 = 9.75
Q3 = size of 3 th item
= 3 x 2.75 = 8.25th Item
i.e. 8th item + .25(9th Item – 8th Item)
= 29 + .25 (45 – 29)
= 29 + .25 x 16
= 29 + 4 = 33
Quartile Deviation = = . = 11.625
==========
Coefficient of Quartile Deviation =
= .. = 0.54
======== 3) Find the value of Quartile Deviation and coefficient of Quartile Deviation?
Marks 25 30 40 50 60 70 80 90
No. of Students 4 7 12 8 9 15 7 3

School of Distance Education
Basic Numerical Skills 117
Ans:
x f c.f.
25 4 4
30 7 11
40 12 23 Q1
50 8 31
60 9 40
70 15 55 Q3
80 7 62
90 3 65
65
Q1 = th Item = th Item = 16.5th Item
Q3 = 3 th item = 3 x 16.5 = 49.5th Item
Q1 = 45
Q3 = 70
Quartile Deviation = = = 15 marks ===========
Coefficient of Quartile Deviation =
= = 0.27 =======
4) Compute Quartile Deviation and coefficient of Quartile Deviation?
x 0 ‐ 10 10 ‐ 20 20 ‐ 30 30 ‐ 40 40 ‐ 50 50 ‐ 60
f 5 12 15 9 10 3
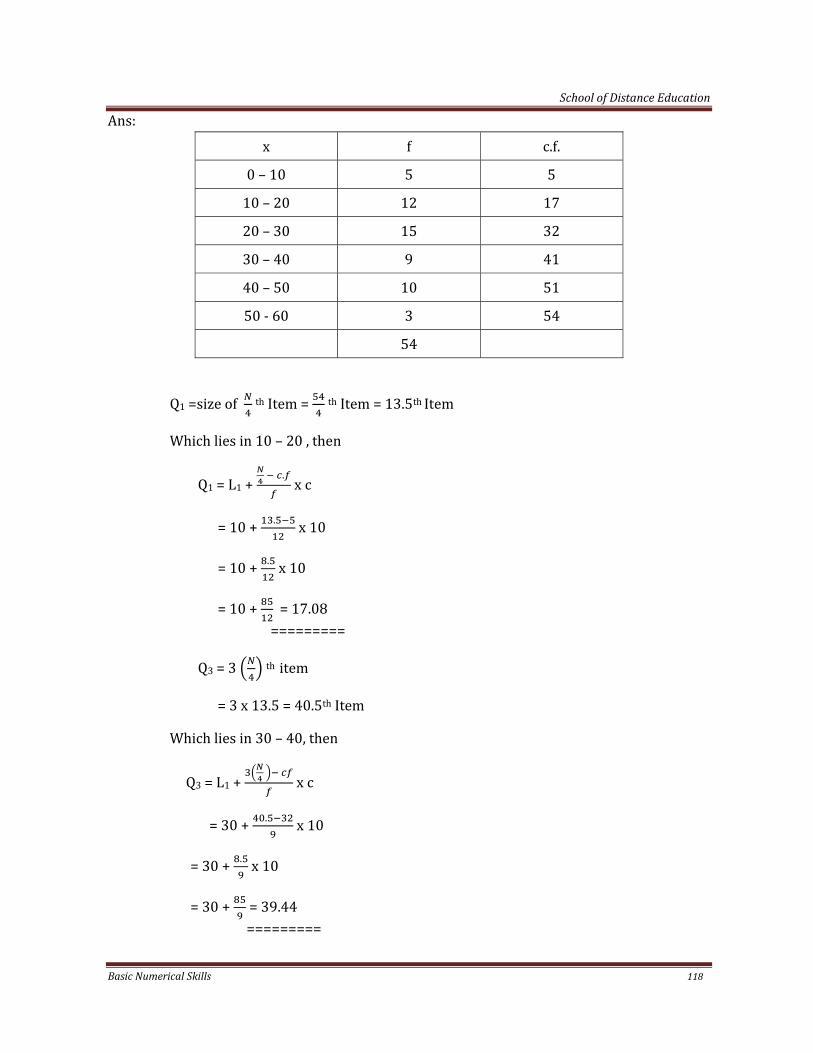
School of Distance Education
Basic Numerical Skills 118
Ans:
x f c.f.
0 – 10 5 5
10 – 20 12 17
20 – 30 15 32
30 – 40 9 41
40 – 50 10 51
50 ‐ 60 3 54
54
Q1 =size of th Item = th Item = 13.5th Item
Which lies in 10 – 20 , then
Q1 = L1 + .
x c
= 10 + . x 10
= 10 + . x 10
= 10 + = 17.08 =========
Q3 = 3 th item
= 3 x 13.5 = 40.5th Item
Which lies in 30 – 40, then
Q3 = L1 +
x c
= 30 + . x 10
= 30 + . x 10
= 30 + = 39.44 =========

School of Distance Education
Basic Numerical Skills 119
Quartile Deviation = = . . = . = 11.18 marks =============
Coefficient of Quartile Deviation =
= . .. .
= .. = 0.396
==========
MEAN DEVIATION
Mean Deviation is defined as the arithmetic mean of deviations of all the values in a series from their average. The average may be mean, median or mode.
Mean Deviation = ∑| |
Where | | = deviation from an average without sign
Mean Deviation in Individual Series
Mean Deviation = ∑| |
Coefficient of Mean Deviation =
Average = Mean, Median or Mode from which the deviation is taken
Mean Deviation in Discrete Series
Mean Deviation = ∑ | |
Coefficient of Mean Deviation =
Mean Deviation in Continuous Series
Mean Deviation = ∑ | |
1) Calculate Mean Deviation from the following.
14, 15, 23, 20, 10, 30, 19, 18, 16, 25, 12
Ans:
Arrange the data
10, 12, 14, 15, 16, 18, 19, 20, 23, 25, 30
Median = size of item
= 6th Item = 18

School of Distance Education
Basic Numerical Skills 120
X | | ie. X – median14 4 15 3 23 5 20 2 10 8 30 12 19 1 18 0 16 2 25 7 12 6 50
Mean Deviation = ∑| | = = 4.54 marks ============
2) Calculate Mean Deviation from the following data:
Size of item 6 7 8 9 10 11 12 Freequency 3 6 9 13 8 5 4
Ans:
Size f c.f | | f | | 6 3 3 3 9 7 6 9 2 12 8 9 18 1 9 9 13 31 0 0 10 8 39 1 8 11 5 44 2 10 12 4 48 3 12 48 60
Median = th item = 24.5
Median = 9
= 18
Mean Deviation = ∑ | | = = 1.25 ============

School of Distance Education
Basic Numerical Skills 121
3) Calculate the Mean Deviation from the following data:
Marks 0 ‐ 10 10 ‐ 20 20 ‐ 30 30 ‐ 40 40 ‐ 50 50 ‐ 60 60 ‐ 70 70 ‐ 80
Freequency 18 16 15 12 10 5 2 2 Ans:
x f m c.f. | | ie. X – median f| |
0 – 10 18 5 18 19 342
10 – 20 16 15 34 9 144
20 – 30 15 25 49 1 15
30 – 40 12 35 61 11 132
40 – 50 10 45 71 21 210
50 ‐ 60 5 55 76 31 155
60 – 70 2 65 78 41 82
70 ‐ 80 2 75 80 51 102
80 1182
Median = th Item
= th Item = 40th Item
Which lies on 20 – 30
Median = 20 + x 10
= 20 + x 10
= 24
Mean Deviation = ∑ | | = = 14.775 ============
STANDARD DEVIATION
Standard Deviation is defined as the square root of the mean of the squares of the deviations of individual items from their arithmetic mean. It is denoted by σ (sigma).
σ = ∑

School of Distance Education
Basic Numerical Skills 122
Standard Deviation in Individual Series
σ = ∑ or ∑ ∑ 2
Coefficient of variation = x 100
Standard Deviation in Discrete Series
σ = ∑ ∑ 2
Shortcut method:
σ = ∑ ∑ 2
d = x ‐ A
Standard Deviation in Continuous Series
(i) Direct Method:
σ = ∑ ∑ 2
x = mid point of X
(ii) Shortcut method:
σ = ∑ ∑ 2
d = m – A or x – A
(iii) Step Deviation method:
σ = ∑ ∑ 2 X C
d' = , c = class interval.
VARIANCE
Variance is defined as the mean of the squares of the deviations of all the values in the series from their mean. It is the sqare root of the Standard Deviation.
Variance = σ

School of Distance Education
Basic Numerical Skills 123
1) Compute S.D 4, 8, 10, 12, 15, 9, 7, 7
Ans: X X2
4 16
8 64
10 100
12 144
15 225
8 81
7 49
7 49
72 728
σ = ∑ ∑
σ =
= √91 9
σ = √91 81 = √10
= 3.16
=== 2) Find the S.D and C.V 10, 12, 80, 70, 60, 100, 0, 4
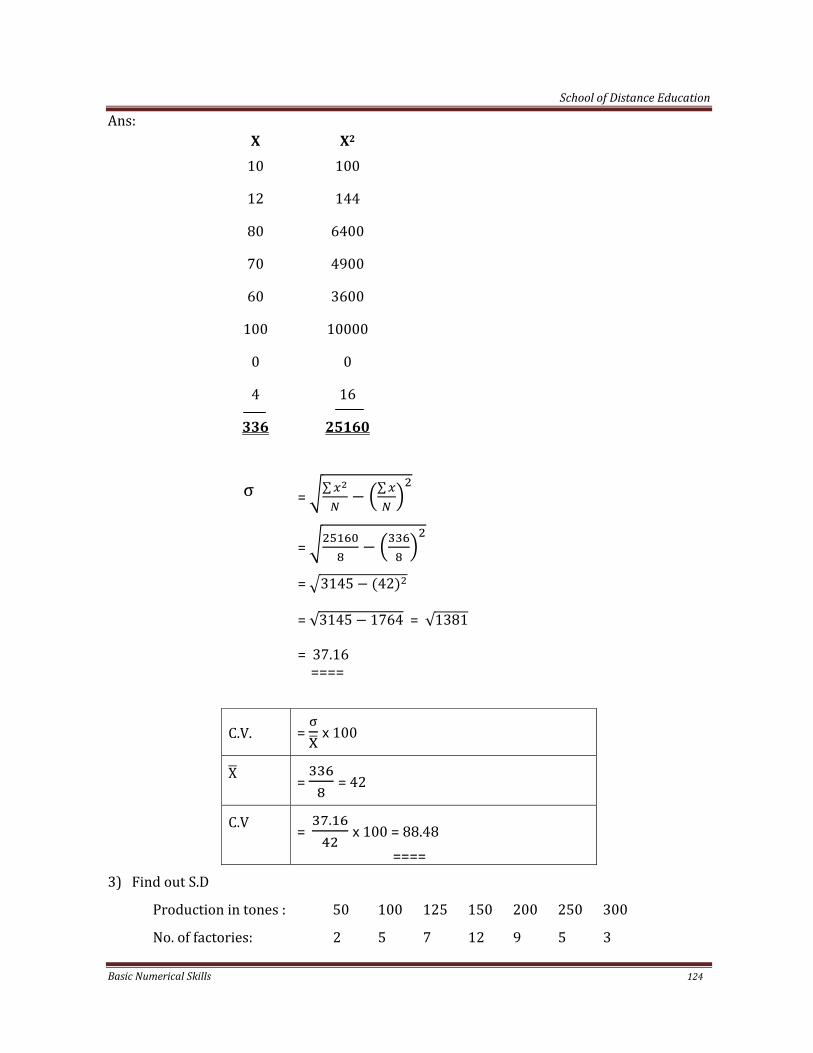
School of Distance Education
Basic Numerical Skills 124
Ans:
σ = ∑ ∑
=
= 3145 42
= √3145 1764 = √1381
= 37.16 ====
C.V. = σ 100
X = = 42
C.V = . 100 = 88.48
====
3) Find out S.D
Production in tones : 50 100 125 150 200 250 300
No. of factories: 2 5 7 12 9 5 3
X X2
10 100
12 144
80 6400
70 4900
60 3600
100 10000
0 0
4 16
336 25160

School of Distance Education
Basic Numerical Skills 125
Ans:
X f d(x‐A)
50 2 ‐100 ‐4 16 ‐8 32
100 5 ‐50 ‐2 4 ‐10 20
125 7 ‐25 ‐1 1 ‐7 7
150 12 0 0 0 0 0
200 9 50 2 4 18 36
250 5 100 4 16 20 80
300 3 150 6 36 18 108
43 31 283
A = 150
=
σ = ∑ ∑
C
= 25
= √6.58 0.52 25
= √6.06 25 = 2.46 25
= 61.5
====
4) Compute the S.D from the following Expenditure (Rs): 100‐200 200‐300 300‐400 400‐500 500‐600
No. of families 30 20 40 5 10

School of Distance Education
Basic Numerical Skills 126
Ans:
X f m d(
100‐200 30 150 ‐200 ‐2 4 ‐60 120
200‐300 20 250 ‐100 ‐1 1 ‐20 20
300‐400 40 350 0 0 0 0 0
400‐500 5 450 100 1 1 5 5
500‐600 10 550 200 2 4 20 40
105 55 185
d = m‐A
d1 = d/100
σ = ∑ ∑
C
= 100
= 122 ====
5) The scores of the batsmen A and B the six innings during a certain match are as follows.
Batsman A: 10 12 80 70 60 100 0 4
Batsman B: 8 9 7 10 5 9 10 8
(i) Find which of the two batsman is more consistant in scoring.
(ii) Find who is more efficient batchman.
Ans:
Batsman A Batsman B X X2 X X2
10 100 8 64 12 144 9 81 80 6400 7 49 70 4900 10 100 60 3600 5 25 100 10000 9 81 0 0 10 100 4 16 8 64 336 25160 66 564

School of Distance Education
Basic Numerical Skills 127
(i) For finding consistant, C.V is calculated
C.V = σ 100
Batsman A Batsman B
X = = 42 X = = 8.25
σ = ∑ ∑
σ = σ =
= 37.16 ==== = 1.562
====
C.V = . 100 σ =
= 88.48 ==== = 18.93
==== B is more consistent since C.V. is less.
(ii) For finding more efficient, average is taken
A = 42 B = 8.25
Batsman A is more consistent since he has greater average.
Merits of S.D
1. S.D. is based on all the values of a series.
2. It is rigidly defined
3. It is capable of further mathematical treatment.
4. It is not much affected by sampling fluctuations.
Demerits
1. It is difficult to calculate.
2. Signs of the deviations are not ignored.

School of Distance Education
Basic Numerical Skills 128
Measures of skewness
Skewness means lack of symmetry when a frequency distribution is not symmetrical, it is said t be asymmetrical or skewed. In the case of a skewed distribution, the mean, median and mode are not equal. Similarly for a skewed distribution Q1 and Q3 will not be equidistant from median. It is an asymmetrical distribution. It has a long tail on one side and a start tail on the other side.
A distribution is said to be skewed when:
(1) Mean, media and mode are not equal.
(2) Q1 and Q3 are not equidistant from median.
(3) Frequencies on either side of mode are not equal.
(4) The frequency curve has longer tail on the left side or on the right side.
Positive and Negative skewness
Skewnwss may be either positive or negative. Skewness is said to be positive when the mean is greater than the median and median is greater than mode. More than half area falls to right side of the highest ordinate.
Swewness is said to be negative when the mean is less than median and the median is less than mode. In this case curve is skewed to the left more than half the area falls to the left of the highest ordinate.
Symmetric Distribution
Positively skewed
Negatively skewed

School of Distance Education
Basic Numerical Skills 129
Measures of skewness
1) Karl Pearson’s measure of skewness
Skewness =
2) Bowley’s measure of skewness
Skewness =
3) Kelley’s measure of skewness
Skewness =
4) Measure of skewness Based on Moments
Skewness =
Kurtosis
Kurtosis is a measure of peakdness. It refers a distribution which is relatively fetker than the normal curve.
When a frequency curve is more peaked than the normal curve, it is called lepto kurtic and when it is more flat topped than the normal curve it is called platy kurtic. When a curve is neither peaked nor plat topped, it is called meso kurtic normal.
Lepto Kurtic
Meso Kurtic Platy Kurtic
Lorenz Curve
Lorenz curve is a graphical method of studying dispersion. It is used in business to study the disparities of the distribution of wages, sales, production etc. In Economics it is useful to measure inequalities in the distribution of income.

School of Distance Education
Basic Numerical Skills 130
It is a graph down to a frequency distribution. While drawing the graph, cumulative percentage values of frequencies on X axis and cumulative percentage values of the variable on Y axis.
Index Numbers
Index numbers is a statistical device for measuring the changes in group of related variables over a period of time.
Uses or Importance of index numbers.
1. Index numbers measure trend values.
2. Index numbers facilitate for policy decisions.
3. Index numbers help in comparing the standard of living.
4. It measures changes in price level.
5. Index numbers are economic barometers. The condition of the economy of a country to be known through construction of index numbers for different periods with regard to employment, literacy, agriculture industry, economics etc. Hence it can be termed as economic barometers.
Limitations
1. Index numbers are only approximate indicator.
2. All index numbers are not good for all purposes.
3. Index numbers are liable to be unissued.
4. Index numbers are specilised average and limitations of average also applicable to index numbers.
Problems or Difficulties in the construction of index numbers
1. Purpose of the index.
2. Selection of the lease period.
3. Selection of items.
4. Selection of an average
5. Selection of weights
6. Selection of appropriate source of data
7. Selection of suitable formula.
Methods of constructing index numbers
1. Unweighted index numbers.
2. Weighted index numbers.

School of Distance Education
Basic Numerical Skills 131
Unweighted or Simple index numbers
Simple index numbers are those index numbers in which all items are treated as equally. Simple aggregate and simple average price relatives are the unweighted index numbers.
(1) Simple Aggregate method
P01 = ∑∑
100
P01 = index number
P1 = Price for the current year
P1 = Price for the base year.
(2) Simple Average Price Relative Method
Price index = ∑
I = 100, each items can be calculated.
Weighted index numbers
In this method quantity consumed is also taken into account.
Such index are
1. Weighted aggregate method
2. Weighted Average of price relatives
Weighted aggregate method
This method is based on the weight of the prices of the selected commodities.
Following are the commonly used methods:
1. Laspeyre’s Method
2. Paasche’s Method
3. Bowley‐Dorbish Method
4. Fishers ideal method
5. Kelly’s Methods
Laspeyre’s Method
P01 = ∑∑
100
p1 = Price of the current year
q0 = Quantity of the base year

School of Distance Education
Basic Numerical Skills 132
p0 = Price of the base year
Paasche’s Method
P01 = ∑∑
100
q1 = Quantity of the current year
Fishers Ideal Method
P01 = √ 100 L = Laspeyres method
P = Paasche’s Method
P01 = ∑∑
∑∑
100
BowleyDoribish Method
P01 =
Kelly’s Method
P01 = ∑∑
100
q =
Weighted Average Price Relative Method
Index number = ∑∑
V = Weight
I = 100 1. Construct index numbers for 2012 on the basis of the price of 2010
Commodities Price in 2010 Price in 2012
A 115 130
B 72 89
C 54 75
D 60 72
E 80 105
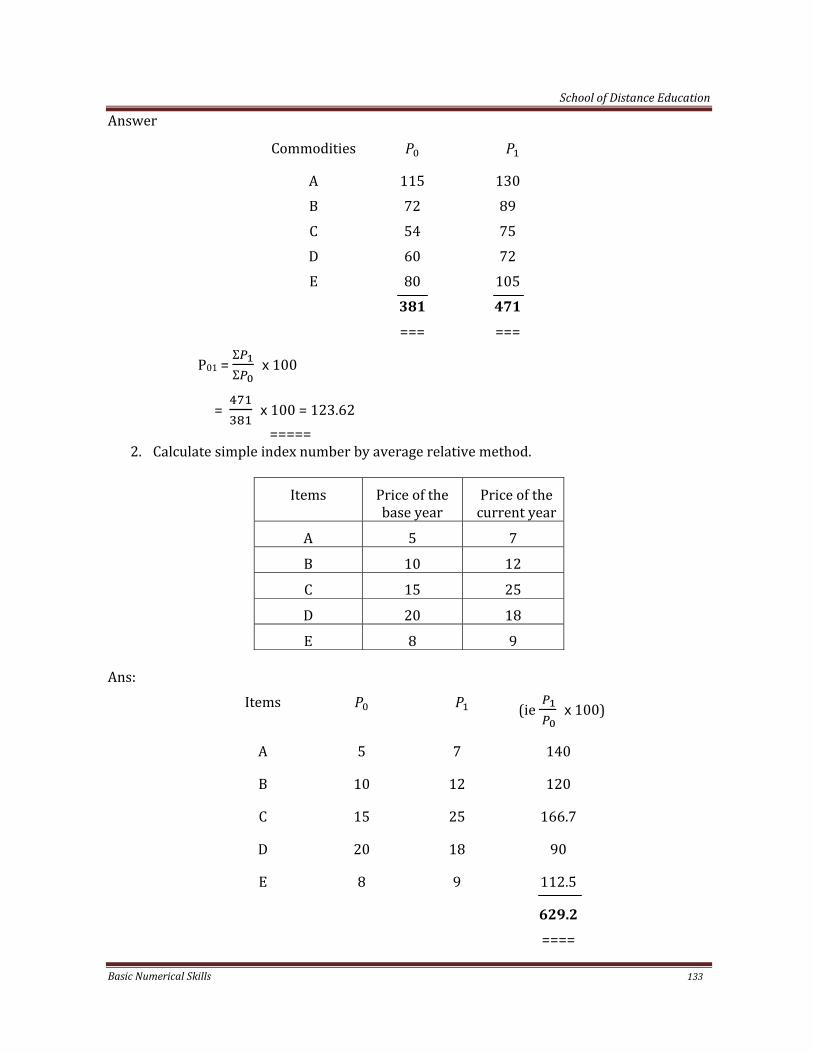
School of Distance Education
Basic Numerical Skills 133
Answer
Commodities
A 115 130 B 72 89 C 54 75 D 60 72 E 80 105 381
=== 471
===
P01 = ΣΣ 100
= 100 = 123.62 =====
2. Calculate simple index number by average relative method.
Items Price of the base year
Price of the current year
A 5 7
B 10 12
C 15 25
D 20 18
E 8 9 Ans:
Items (ie 100)
A 5 7 140
B 10 12 120
C 15 25 166.7
D 20 18 90
E 8 9 112.5
629.2
====

School of Distance Education
Basic Numerical Skills 134
Index number = ∑
= . = 125.84
===== 3. Following are the data related with the prices and quantities consumed for 2010 and
2012.
Commodity 2010 2012
Price Quantity Price Quantity
Rice 5 15 7 12
Wheat 4 5 6 4
Sugar 7 4 9 3
Tea 52 2 55 2 Construct price index numbers by
(1) Laspeyre’s method
(2) Paasche’s method
(3) Bowly’s – Dorbish method
(4) Fisher’s method
Answer
Commodity
Rice 5 15 7 12 105 75 84 60
Wheat 4 5 6 4 30 20 24 16
Sugar 7 4 9 3 36 28 27 21
Tea 12 2 55 2 110 104 110 104
281 227 245 201

School of Distance Education
Basic Numerical Skills 135
(1) Laspeyre’s Method
p = ∑∑
x 100 = x 100
= 123.79
(2) Paascne’s method
p = ∑∑
x 100 = x 100
= 121.89
(3) Bowley – Dorbish Method
p = = . .
= 122.84
(4) Fisher’s Method p = √L x P
= √123.79 x 121.89 = 122.84
4) Calculate index number of price for 2012 on the basis of 2010, from the data given below:
Commodities Weight Price 2010 Price
2012
A 40 16 20
B 25 40 60
C 5 2 2
D 20 5 6
E 10 2 1
Answers
Price Index Number = ∑∑

School of Distance Education
Basic Numerical Skills 136
Commodities V i.e. IV
A 40 16 20 125 5000
B 25 40 60 150 3750
C 5 2 2 100 500
D 20 5 6 120 2400
E 10 2 1 50 500
100 12150
Index Number = = 121.5
5) Construct Price Index
Commodities Index Weight
A 350 5
B 200 2
C 240 3
D 150 1
E 250 2
Answers
Commodities V I IV
A 5 350 1750
B 2 200 400
C 3 240 720
D 1 150 150
E 2 250 500
13 3520
Index Number = ∑∑ = = 270.77

School of Distance Education
Basic Numerical Skills 137
Consumer Price index number of cost of Living index number or Retail Price index number
Consumer Price index number is also known as copy of Living Index number or Retails Price index number. It is the ration of the monetary expenditures of an individual which secure him the standard of living or total utility in two situations differing only in respect of prices. It represents the average change in prices over a period of time, paid by the consumer for goods and services. Steps in the construction of Consumer Price Index
1. Determination of the class people for whom the index number is to constructed.
2. Selection of Basic period
3. Conducting family budget enquiry
4. Obtaining price quotation
5. Selecting proper weights
6. Selection of suitable methods for constructing index.
Methods of Constructing Consumer Price Index Number
(1) Aggregate Expenditure Method
Cost of living Index number = = ∑∑ x 100
(2) Family Budget Method or Average Relative Method
Cost of Living Index = ∑∑
1) Find cost of Living index
Food Rent Clothes Fuel
Miscellaniou
Expenses on 35% 15% 20% 10% 25%
Price 2010 150 30 75 25 40
Price 2012 145 30 65 23 45
What changes the cost of living of 2012 as compare to 2010?

School of Distance Education
Basic Numerical Skills 138
Answer
Expenses V I IV
Food 35 150 145 96.67 3383.45
Rent 15 30 30 100 1500
Cloth 20 75 65 86.67 1733
Fuel 10 25 23 92 920
Misc. 20 40 45 112.50 2250
9786.85
Cost of Living Index = ∑∑ = . = 97.87
Time Series Analysis
Time series is the arrangement of data according to the time of occurrence. It helps to find our the variations to the value of data due to changes in time. Importance
1. It helps for understanding past behavior 2. It facilitates for forecasting and Planning 3. It facilitates comparison
Components of Time Series
1. Secular trend 2. Seasonal Variations 3. Cyclic Variations 4. Irregular Variations
Secular Trend
Trend may be defined as the changes over a long period of time. The significance of trend is greater when the period of time is very longer. Following are the important method of measuring trend.
1. Graphic Method
2. Semi Average Method 3. Moving Average Method 4. Method of Least Squares

School of Distance Education
Basic Numerical Skills 139
2) Seasonal Variations:‐ Seasonal Variations are measured for one calendar year. It is
the variations which occur some degree of regularity. For example climate conditions,
social customs etc.
3) Cyclical Variations:‐ Cyclical variations are those variation which occur on account of
business cycle. They are Prosperity, Dectine, Depression and Recovery.
4) Irregular fluctuations:‐ One changes of variable could not be predicted due to
irregular movements. Irregular movements are like changes in technology, war,
famines, flood etc.
Methods of Measuring Trend
(1) Graphic method: It is otherwise known as free hand method. This is the simplest
method of measuring trend. Under this method original data are plotted on the graph
paper. The plotted points should be joined, we get a curve. A straight line should be
drawn through the middle area of the curve. Such line will describe tendency of the
data.
(2) Semi Average Method:‐ The whole data are divided in to two parts and average of
these are to be calculated. The two averages are to be plotted in the graph. The two
points plotted should be joined so as to get a straight line. This line is called the ward
live.
(3) Method of Moving average:‐ Under this method a series of successive average should
be calculated from a series of values moving average may be calculated for 3,4,5,6 or 7
years periods.
The moving average can be calculated as follows:
For example 3 years moving average will be , , and so on.
Five years moving average = , and so on.
1) Compute 3 yearly moving average from the following data
Years: 2002 2003 2004 2005 2006 2007 2008 2009 2010 2011 2012
Sales (in 000units) 55 47 59 151 79 36 45 72 83 89 102

School of Distance Education
Basic Numerical Skills 140
Calculation of 3 yearly moving average
Year Sales (in 000 units) 3 yearly moving total 3 yearly moving average
2002 55 ‐‐‐‐‐‐‐‐‐‐ ‐‐‐‐‐‐‐‐‐‐‐ 2003 47 ‐‐‐‐‐‐‐‐‐‐ ‐‐‐‐‐‐‐‐‐‐ 2004 59 161 53.67 2005 151 257 85.67 2006 79 289 96.33 2007 36 216 58.67 2008 45 160 63.33 2009 72 153 51 2010 83 200 66.67 2011 89 244 81.33 2012 102 277 91.33
2) Calculate 5 yearly moving average
Years: 2000 2001 2002 2003 2004 2005 2006 2007 2008 2009 2010
income (in ‘000’)
161 127 152 143 144 167 182 179 152 163 159
Answers
Year Income (in
000) Five yearly moving total
Five yearly moving average
2000 161 ‐‐‐‐‐‐‐‐‐‐ ‐‐‐‐‐‐‐‐‐‐‐
2001 127 ‐‐‐‐‐‐‐‐‐‐ ‐‐‐‐‐‐‐‐‐‐
2002 152 727 145.4
2003 143 733 146.6
2004 144 788 157.6
2005 167 815 163
2006 182 824 164.8
2007 179 843 168.6
2008 152 835 167
2009 163 ‐‐‐‐‐‐‐‐‐‐ ‐‐‐‐‐‐‐‐‐‐‐
2010 159 ‐‐‐‐‐‐‐‐‐‐ ‐‐‐‐‐‐‐‐‐‐

School of Distance Education
Basic Numerical Skills 141
Calculation of moving average for every periods
1) Calculate the six year moving average
Years: 2000 2001 2002 2003 2004 2005 2006 2007 2008 2009 2010
Demand (in tones)
105 120 115 110 100 130 135 160 155 140 145
Answers
Year Demand 6 years moving
total
6 years moving average
Centered 6 years moving total
Centered 6 year moving average
2000 105 ‐‐‐‐‐‐‐ ‐‐‐‐‐‐‐ ‐‐‐‐‐‐‐ ‐‐‐‐‐‐‐
2001 120 ‐‐‐‐‐‐‐‐ ‐‐‐‐‐‐‐‐ ‐‐‐‐‐‐‐‐ ‐‐‐‐‐‐‐‐
2002 115 ‐‐‐‐‐‐‐‐‐ ‐‐‐‐‐‐‐‐‐ ‐‐‐‐‐‐‐‐‐ ‐‐‐‐‐‐‐‐‐
2003 110 680 113.3 231.6 115.8
2004 100 710 118.3 243.3 121.65
2005 130 750 125 256.67 128.34
2006 135 790 131.67 268.34 134.17
2007 160 820 136.67 280.84 140.42
2008 155 865 144.17
2009 140
2010 145
4) Method of Least Squares
This is a popular method of obtaining trend line. The trend line obtained through this method is called line of best fit. One trend line is represented as y = a + bx The value of a and b can be ascertained by solving the following two normal equations.
∑ y = Na + b∑ x

School of Distance Education
Basic Numerical Skills 142
∑xy = a∑ x + b∑ x
Where x represents the time, y represents the value, a and b are constant and N represent total number. When the middle year is taken as the origin, then ∑ x 0, then normal equation would be
∑ xy = Na
∑ xy = b∑ x
Hence a = ∑∑
1) Following are the data related with the output of a factory for 7 years
Years: 2006 2007 2008 2009 2010 2011 2012
Output (in tones)
47 64 77 88 97 109 113
Calculate the trend values through the method of least squares and also forecast the
production 2013 and 2015.
Answers
Year
t
Production
y
x
(t – 2009) xy
2006 47 ‐3 ‐141 9
2007 64 ‐2 ‐128 4
2008 77 ‐1 ‐77 1
2009 88 0 0 0
2010 97 1 97 1
2011 109 2 218 4
2012 113 3 339 9
595 0 308 28

School of Distance Education
Basic Numerical Skills 143
Here ∑ x = 0
Then a = ∑ = = 85
b = ∑∑ = = 11
y = a + bx
2006 ‐ 85 + 11 x ‐3 = 52
2007 ‐ 85 + 11 x ‐2 = 63
2008 ‐ 85 + 11 x ‐1 = 74
2009 ‐ 85 + 11 x 0 = 85
2010 ‐ 85 + 11 x 1 = 96
2011 ‐ 85 + 11 x 2 = 107
2012 ‐ 85 + 11 x 3 = 118
Production in 2013
= 85 x 11 x 4 = 129 tonns
Production in 2015
= 85 x 11 x 6 = 151 tonns