(basel iii) 1. scope of application - dcb bank · · 2017-04-15(basel iii) 1. scope of...
TRANSCRIPT

Page 1 of 30
PILLAR III DISCLOSURES UNDER THE NEW CAPITAL ADEQUACY FRAMEWORK (BASEL III)
1. SCOPE OF APPLICATION DCB Bank Ltd. is a scheduled commercial bank which was incorporated on May 31, 1995. The Bank has no subsidiaries. As on March 31, 2017, the Bank does not have investment in any insurance entity. 2. CAPITAL STRUCTURE Capital funds are classified into Tier I and Tier II capital under the capital adequacy framework. Tier I Capital The Bank’s Tier I capital will consist of Common Equity Tier I and Additional Tier I capital. Common Equity Tier I (CET1) capital must be at least 5.5% of risk-weighted assets (RWAs) i.e. for credit risk + market risk + operational risk on an ongoing basis and Additional Tier I capital can be a maximum of 1.5%, thus making total Tier I capital to be at least 7%. In addition to the minimum Common Equity Tier I capital of 5.5% of RWAs, banks are also required to maintain a capital conservation buffer (CCB) of 2.5% of RWAs in the form of Common Equity Tier I capital. In terms of the RBI guidelines dated March 27, 2014 the implementation of CCB will begin as on March 31, 2016. Consequently, BASEL III Capital Regulations will be fully implemented as on March 31, 2019. Tier I capital includes paid-up equity capital, share premium, statutory reserves, capital reserves, special reserve, revaluation reserve other disclosed free reserves and balance in Profit and Loss account. Profits in current financial year may be included in Tier I based on fulfilment of certain conditions regarding incremental provisions for non-performing assets. Equity Capital The Bank has authorised share capital of ` 5.00 billion comprising 500,000,000 equity shares of ` 10/- each. As on March 31, 2017 the Bank has issued subscribed and paid-up capital of ` 2.85 billion, constituting 285,364,353 shares of ` 10/- each. The provisions of the Companies Act, 2013 and other applicable laws and regulations govern the rights and obligations of the equity share capital of the Bank. Tier II Capital Provisions or loan-loss reserves held against future, presently unidentified losses, which are freely available to meet losses which subsequently materialise, will qualify for inclusion within Tier II capital. Tier II capital will also include debt capital instruments issued by banks and their premium, if any.
Page 2 of 30
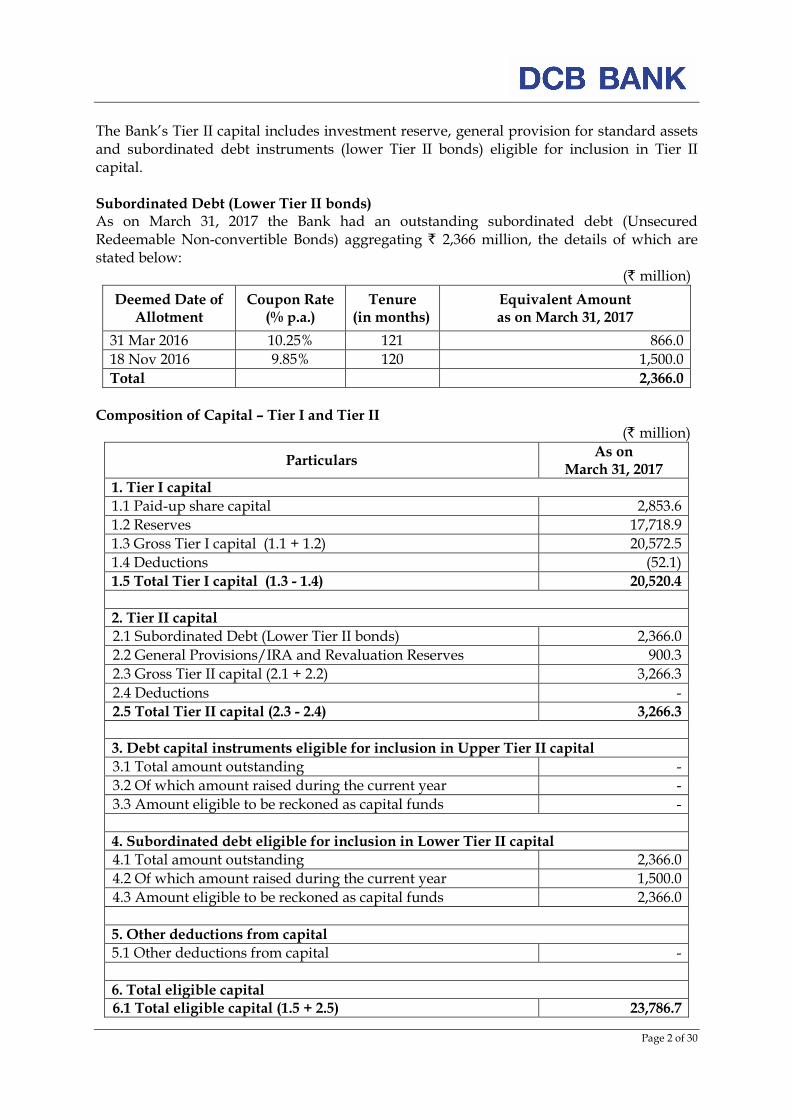
The Bank’s Tier II capital includes investment reserve, general provision for standard assets and subordinated debt instruments (lower Tier II bonds) eligible for inclusion in Tier II capital. Subordinated Debt (Lower Tier II bonds) As on March 31, 2017 the Bank had an outstanding subordinated debt (Unsecured Redeemable Non-convertible Bonds) aggregating ` 2,366 million, the details of which are stated below:
(` million)
Deemed Date of Allotment
Coupon Rate (% p.a.)
Tenure (in months)
Equivalent Amount as on March 31, 2017
31 Mar 2016 10.25% 121 866.0
18 Nov 2016 9.85% 120 1,500.0
Total 2,366.0
Composition of Capital – Tier I and Tier II (` million)
Particulars As on
March 31, 2017 1. Tier I capital
1.1 Paid-up share capital 2,853.6
1.2 Reserves 17,718.9
1.3 Gross Tier I capital (1.1 + 1.2) 20,572.5
1.4 Deductions (52.1)
1.5 Total Tier I capital (1.3 - 1.4) 20,520.4
2. Tier II capital
2.1 Subordinated Debt (Lower Tier II bonds) 2,366.0
2.2 General Provisions/IRA and Revaluation Reserves 900.3
2.3 Gross Tier II capital (2.1 + 2.2) 3,266.3
2.4 Deductions -
2.5 Total Tier II capital (2.3 - 2.4) 3,266.3
3. Debt capital instruments eligible for inclusion in Upper Tier II capital
3.1 Total amount outstanding -
3.2 Of which amount raised during the current year -
3.3 Amount eligible to be reckoned as capital funds -
4. Subordinated debt eligible for inclusion in Lower Tier II capital
4.1 Total amount outstanding 2,366.0
4.2 Of which amount raised during the current year 1,500.0
4.3 Amount eligible to be reckoned as capital funds 2,366.0
5. Other deductions from capital
5.1 Other deductions from capital -
6. Total eligible capital 6.1 Total eligible capital (1.5 + 2.5) 23,786.7

Page 3 of 30
3. CAPITAL ADEQUACY The Bank has a process for assessing its overall capital adequacy in relation to the Bank's risk profile and a strategy for maintaining its capital levels. The process ensures that the Bank has adequate capital to support all the material risks and an appropriate capital cushion. The Bank identifies, assesses and manages comprehensively all risks that it is exposed to through robust risk management framework, control mechanism and an elaborate process for capital calculation and planning. The Bank has formalised and implemented a comprehensive Internal Capital Adequacy Assessment Process (ICAAP). The Bank’s ICAAP covers the capital management policy of the Bank and also sets the process for assessment of the adequacy of capital to support current and future projections / risks. The Bank has a structured process for the identification and evaluation of all risks that the Bank faces, which may have an adverse material impact on its financial position. The Bank considers the following risks as material risks it is exposed to in the normal course of its business and therefore, factors these while assessing/planning capital:
• Credit Risk • Liquidity Risk
• Concentration Risk • Strategy Risk
• Market Risk • Reputational Risk
• Operational Risk • Residual Risk
• Interest Rate Risk in the Banking Book
• Economy risk
The Bank has also implemented a Board approved Stress Testing policy. Stress Testing involves the use of various techniques to assess the Bank's potential vulnerability to extreme but plausible ("stressed") business conditions. Typically, this relates, among other things, to the impact on the Bank's profitability and capital adequacy. Stress Tests are conducted on a quarterly basis on the Bank’s on and off balance sheet exposures to test the impact of Credit, Liquidity risk and Interest Rate Risk in the Banking book (IRRBB). The stress test results are put up to the Risk Management Committee (RMC) of the Board on a quarterly basis, for their review and guidance. The Bank periodically assesses and refines its stress tests in an effort to ensure that the stress scenarios capture material risks as well as reflect possible extreme market moves that could arise as a result of market conditions. The stress tests are used in conjunction with the Bank's business plans for the purpose of capital planning in the ICAAP. The Bank has also implemented a Board approved separate Stress Testing Policy / Model for its Securitized portfolio. In line with the RBI guidelines for implementing the New Capital Adequacy Framework under Basel III, the Bank has successfully migrated to the framework from April 1, 2013. The Bank has continued parallel run of Basel II framework continuously tracking the exposures and studied the impact on Bank’s Capital to Risk weighted Assets Ratio (CRAR) on a monthly basis. In accordance with the RBI’s requirement, the Bank has continued to adopt Standardised Approach (SA) for Credit Risk and Basic Indicator Approach (BIA) for Operational Risk to compute capital as on March 31, 2017. Besides this, the Bank continues to apply the Standardised Duration Approach (SDA) for computing capital requirement for Market Risk. RBI has prescribed banks to maintain a minimum CRAR of 9% with regard to credit risk, market risk and operational risk on an ongoing basis. The total Capital to Risk weighted Assets Ratio (CRAR) as per Basel III guidelines works to 13.76% as on March 31,

Page 4 of 30
2017 (as against minimum regulatory requirement of 10.25%). The Tier I CRAR stands at 11.87% as against RBI’s prescription of 7.00%. The Bank has followed the RBI guidelines in force, to arrive at the eligible capital, risk weighted assets and CRAR. Capital requirements for Credit Risk, Market Risk and Operational Risk: (` million)
Particulars As on
March 31, 2017 1. Capital requirement for Credit Risk 13,608.0
• Portfolio subject to Standardised Approach 12,925.8
• Securitization Exposures 682.2
2. Capital requirement for Market Risk 720.3
• Standardised Duration Approach
o Interest Rate Risk 553.7
o Foreign Exchange Risk (Including gold) 54.0
o Equity Risk 112.6
3. Capital requirement for Operational Risk 1,010.3
• Basic Indicator Approach 1,010.3
Total capital requirements at 9% (1 + 2 + 3) 15,338.6 Total capital 23,786.7
CRAR % 13.76%
Tier-I CRAR % 11.87% 4. RISK MANAGEMENT FRAMEWORK The Bank is exposed to various types of risk such as Credit, Market, Operation, Liquidity, Interest Rate, Reputational, Legal and Strategic risk. The Bank has separate and independent Risk Management Department in place which oversees all types of risks in an integrated fashion. The objective of risk management is to have optimum balance between risk and return. It entails the identification, measurement and management of risks across the various businesses of the Bank. Risk is managed through framework defined in policies approved by the Board of Directors and supported by an independent risk management function which monitors and takes corrective action so that the Bank operates within its risk appetite. The risk management function attempts to anticipate vulnerabilities through quantitative or qualitative examination of the embedded risks in various activities. The Bank continues to focus on refining and improving its risk measurement systems. In addition to ensuring compliance with regulatory requirements, the Bank has developed robust internal systems for assessing capital requirements keeping in view the business objectives. The Board of Directors (BOD) approves the strategies and policies for Risk Management, based on recommendations of the Risk Management Committee (RMC) of the Board set up to focus upon risk management issues. The RMC reviews various aspects of risk arising from the businesses undertaken by the Bank. Operating level risk committees comprising of senior management viz. Asset Liability Management Committee (ALCO), the Operational Risk Management Committee (ORCO) and the Credit Risk Management Committee (CRMC)
Page 5 of 30
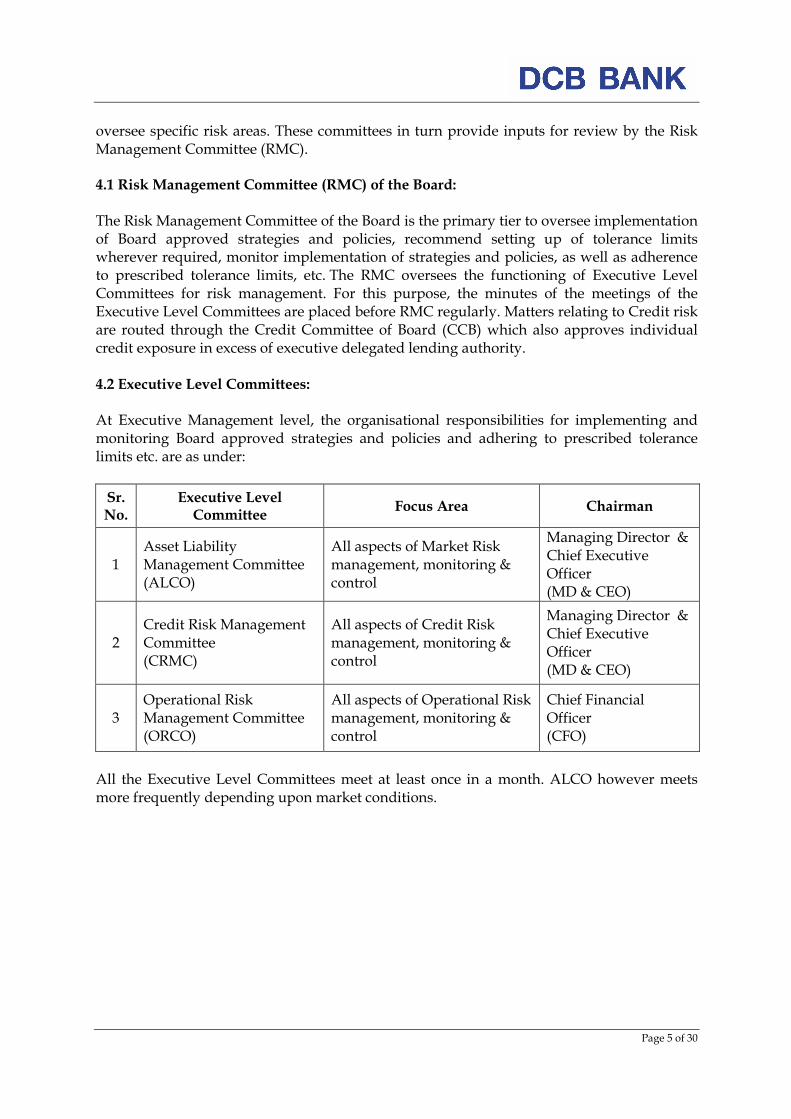
oversee specific risk areas. These committees in turn provide inputs for review by the Risk Management Committee (RMC). 4.1 Risk Management Committee (RMC) of the Board: The Risk Management Committee of the Board is the primary tier to oversee implementation of Board approved strategies and policies, recommend setting up of tolerance limits wherever required, monitor implementation of strategies and policies, as well as adherence to prescribed tolerance limits, etc. The RMC oversees the functioning of Executive Level Committees for risk management. For this purpose, the minutes of the meetings of the Executive Level Committees are placed before RMC regularly. Matters relating to Credit risk are routed through the Credit Committee of Board (CCB) which also approves individual credit exposure in excess of executive delegated lending authority. 4.2 Executive Level Committees: At Executive Management level, the organisational responsibilities for implementing and monitoring Board approved strategies and policies and adhering to prescribed tolerance limits etc. are as under:
Sr. No.
Executive Level Committee
Focus Area Chairman
1 Asset Liability Management Committee (ALCO)
All aspects of Market Risk management, monitoring & control
Managing Director & Chief Executive Officer (MD & CEO)
2 Credit Risk Management Committee (CRMC)
All aspects of Credit Risk management, monitoring & control
Managing Director & Chief Executive Officer (MD & CEO)
3 Operational Risk Management Committee (ORCO)
All aspects of Operational Risk management, monitoring & control
Chief Financial Officer (CFO)
All the Executive Level Committees meet at least once in a month. ALCO however meets more frequently depending upon market conditions.

Page 6 of 30
Note: Information Security team reports to Operational Risk Management Committee (ORCO) 5. CREDIT RISK 5 (a) Credit risk is defined as the possibility of losses associated with diminution in the credit quality of borrowers or counterparties. In a bank’s portfolio, losses stem from outright default due to inability or unwillingness of a customer or counterparty to meet commitments in relation to lending, trading, settlement and other financial transactions. The Bank adopts the definition of ‘past due’ and ‘impaired credits’ (for accounting purposes) as defined by Reserve Bank of India under Income Recognition, Asset Classification and Provisioning (IRAC) norms (vide RBI Master Circular dated December 28, 2016). 5.a.i Credit Risk Management: Credit Risk Management Committee (CRMC) headed by MD & CEO is the top level functional committee for managing credit risk. The committee is responsible for implementation of Credit Risk Management policy approved by the Bank’s Board. The committee considers and takes decision necessary to manage and control credit risk within the overall quantitative prudential limits approved by the Bank’s Board. The committee is entrusted with the responsibilities to formulate standards for presentation of credit proposals, financial covenant, rating standards and benchmarks. The committee also oversees compliance with Pillar 2 requirements under Basel III such as ICAAP and Stress Test. The Bank has successfully implemented RAM rating model of CRISIL which is being used to assess the credit rating of all business loans exceeding ` 10 million. The rating serves as a
Board of Directors
Risk Management Committee (RMC) of the
Board
Asset Liability Management Committee (ALCO)
Credit Risk Management Committee (CRMC)
Operational Risk Management Committee (ORCO)
CFO (Chairman)
MD &CEO (Chairman)
Page 7 of 30
single point indicator of the diverse counterparty risk for taking credit decision. The rating migration is monitored on regular interval. The Bank has a well-developed credit monitoring system to monitor the health of the loan accounts and to detect the delinquencies at the initial stage. A separate department independent of the business units is monitoring the transactions in all the Corporate, Agri and Inclusive Banking (AIB), SME and MSME exposures with credit limits exceeding ` 10 million with a view to detect any early warning signals. The Bank adopts an integrated approach to credit risk management, which encompasses:
• Establishment and articulation of corporate priorities
• Institution and inculcation of an appropriate credit culture
• Determination of specific credit risk strategy and profile
• Implementation of appropriate credit risk controls
• Monitoring the effectiveness of credit risk controls. Though the Bank has implemented the Standardized approach for regulatory capital measurement for credit risk, the necessary steps for implementing Internal Rating Based Approach have been initiated. 5.a.ii Credit Strategy and Risk Profile: The Bank adopts a credit risk strategy and risk appetite, which is in line with its risk taking ability to ensure conservation and growth of shareholder funds, with a proper balance between risk and reward. Financial resources are allocated to best optimise the risk reward ratio. There is a clearly articulated definition of acceptable credit risk, based upon:
• Identification of target markets/segments
• Establishing of characteristics of desirable customers within the target market
• Assessing whether adequate resources are available to support the business
• Ensuring that all economic and regulatory requirements are complied with
• Ensuring that the portfolio is consistent with the Bank’s strategy and objectives especially in relation to risk concentration, maturity profile and liquidity management.
5.a.iii Credit Risk Controls: Credit risk controls focus on identification, measuring, monitoring and managing the assumed risks and include:
• A documented credit policy and credit risk management policy
• Approval process with delegated authorities
• Asset quality and risk rating system and its verification
• Effective loan disbursement mechanism to minimise the legal risk
• Effective loan administration to ensure past-due management and bad loan detection
• A loan review mechanism
• Portfolio management tools to manage portfolio risks
Page 8 of 30
Management of credit risk is at three levels:
• Strategic or Portfolio level, so as to ensure that no single event can have a significant adverse impact
• Established credit policy to have a minimum standard for assuming risk
• Reliance on the competence of trained staff to make sound credit decisions. There is a clear separation in functional responsibilities between:
• Origination and sales
• Credit assessment and approvals
• Post- sanction loan administration and
• Credit Risk Management. The Bank relies upon formal and conventional risk assessment, viz.:
• The ability and willingness of borrowers to repay
• Dependence primarily on cash flows for repayment with security taken to provide a secondary source of repayment
• Quality of data and analysis thereof forms the basis of assessment and not external reputation or unsubstantiated beliefs
• Rational assessment of probability of default and assessment of ‘Worst Case Scenario’
• Transparency and communication of all relevant facts (negative as well as positive) necessary for making an informed credit decision
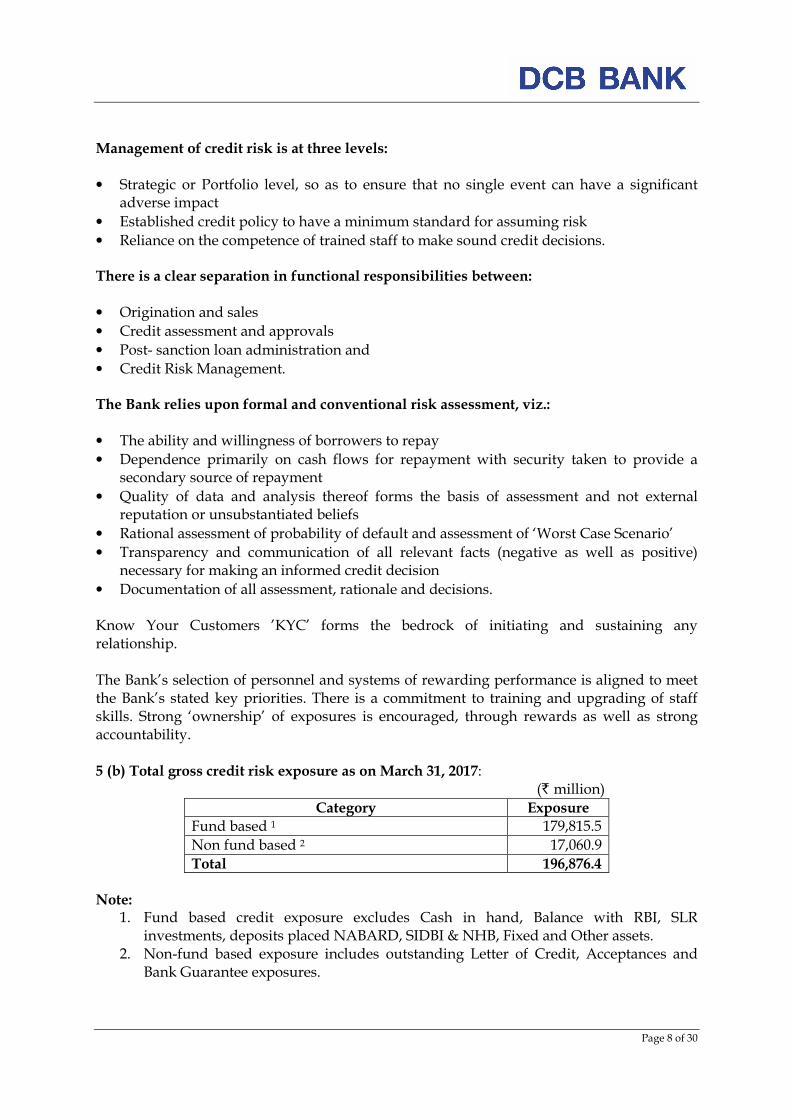
• Documentation of all assessment, rationale and decisions. Know Your Customers ’KYC’ forms the bedrock of initiating and sustaining any relationship. The Bank’s selection of personnel and systems of rewarding performance is aligned to meet the Bank’s stated key priorities. There is a commitment to training and upgrading of staff skills. Strong ‘ownership’ of exposures is encouraged, through rewards as well as strong accountability. 5 (b) Total gross credit risk exposure as on March 31, 2017:
(` million)
Category Exposure
Fund based 1 179,815.5
Non fund based 2 17,060.9
Total 196,876.4 Note:
1. Fund based credit exposure excludes Cash in hand, Balance with RBI, SLR investments, deposits placed NABARD, SIDBI & NHB, Fixed and Other assets.
2. Non-fund based exposure includes outstanding Letter of Credit, Acceptances and Bank Guarantee exposures.
Page 9 of 30
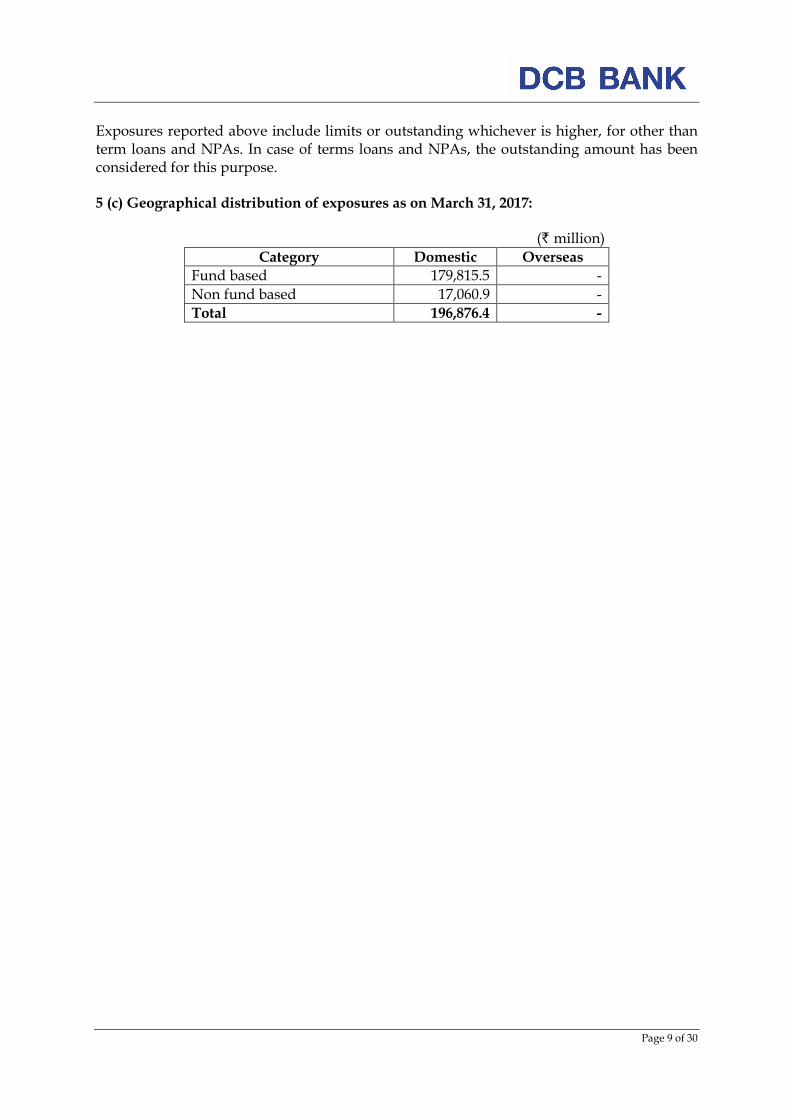
Exposures reported above include limits or outstanding whichever is higher, for other than term loans and NPAs. In case of terms loans and NPAs, the outstanding amount has been considered for this purpose. 5 (c) Geographical distribution of exposures as on March 31, 2017:
(` million)
Category Domestic Overseas
Fund based 179,815.5 -
Non fund based 17,060.9 -
Total 196,876.4 -
Page 10 of 30
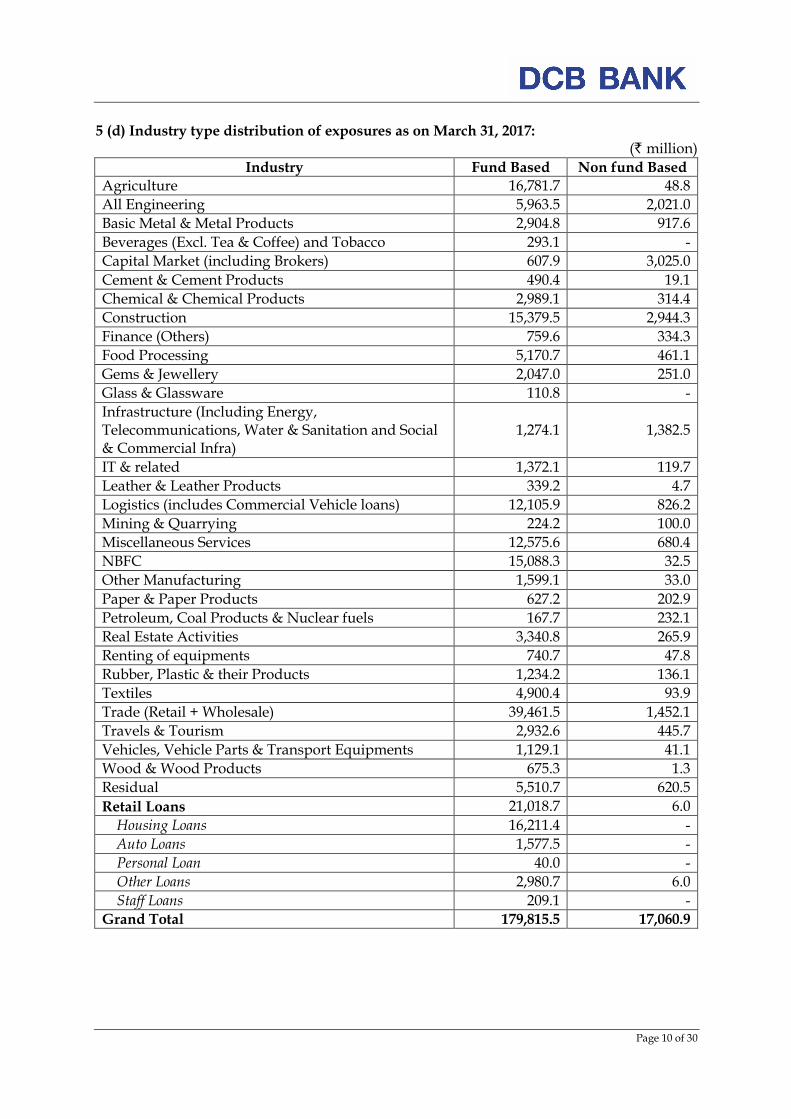
5 (d) Industry type distribution of exposures as on March 31, 2017: (` million)
Industry Fund Based Non fund Based
Agriculture 16,781.7 48.8
All Engineering 5,963.5 2,021.0
Basic Metal & Metal Products 2,904.8 917.6
Beverages (Excl. Tea & Coffee) and Tobacco 293.1 -
Capital Market (including Brokers) 607.9 3,025.0
Cement & Cement Products 490.4 19.1
Chemical & Chemical Products 2,989.1 314.4
Construction 15,379.5 2,944.3
Finance (Others) 759.6 334.3
Food Processing 5,170.7 461.1
Gems & Jewellery 2,047.0 251.0
Glass & Glassware 110.8 -
Infrastructure (Including Energy, Telecommunications, Water & Sanitation and Social & Commercial Infra)
1,274.1 1,382.5
IT & related 1,372.1 119.7
Leather & Leather Products 339.2 4.7
Logistics (includes Commercial Vehicle loans) 12,105.9 826.2
Mining & Quarrying 224.2 100.0
Miscellaneous Services 12,575.6 680.4
NBFC 15,088.3 32.5
Other Manufacturing 1,599.1 33.0
Paper & Paper Products 627.2 202.9
Petroleum, Coal Products & Nuclear fuels 167.7 232.1
Real Estate Activities 3,340.8 265.9
Renting of equipments 740.7 47.8
Rubber, Plastic & their Products 1,234.2 136.1
Textiles 4,900.4 93.9
Trade (Retail + Wholesale) 39,461.5 1,452.1
Travels & Tourism 2,932.6 445.7
Vehicles, Vehicle Parts & Transport Equipments 1,129.1 41.1
Wood & Wood Products 675.3 1.3
Residual 5,510.7 620.5
Retail Loans 21,018.7 6.0
Housing Loans 16,211.4 -
Auto Loans 1,577.5 -
Personal Loan 40.0 -
Other Loans 2,980.7 6.0
Staff Loans 209.1 -
Grand Total 179,815.5 17,060.9
Page 11 of 30
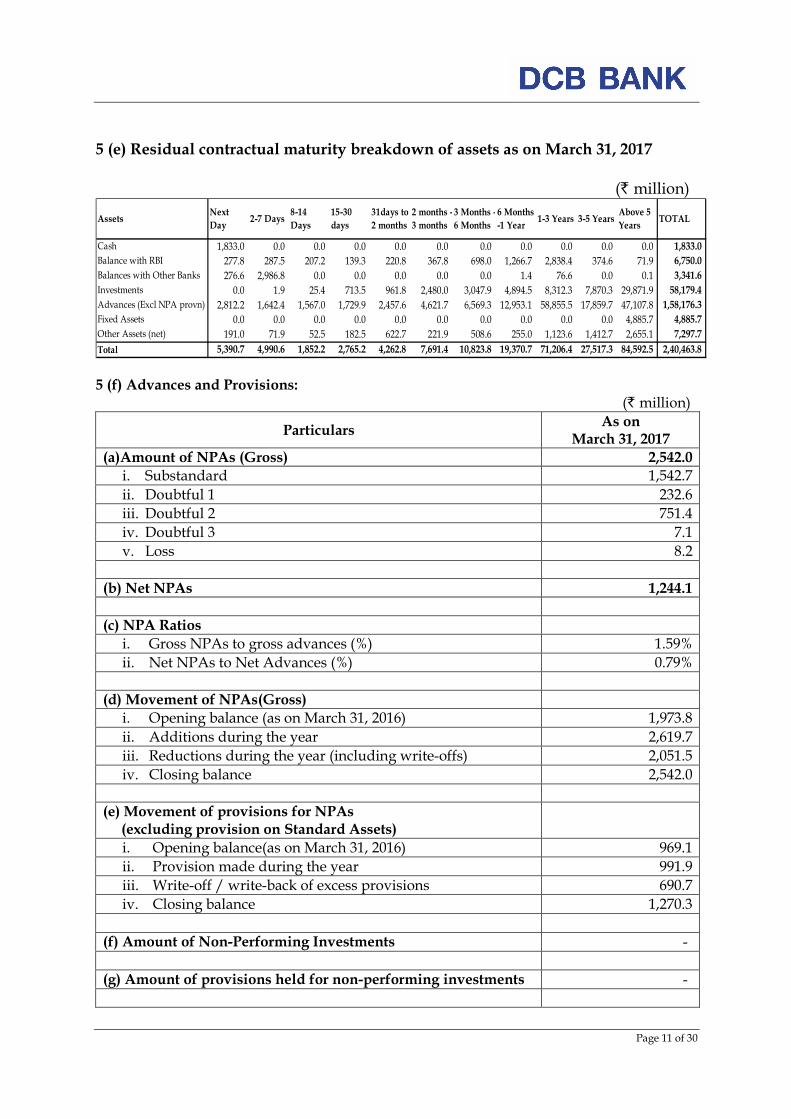
5 (e) Residual contractual maturity breakdown of assets as on March 31, 2017
(` million)
AssetsNext
Day2-7 Days
8-14
Days
15-30
days
31days to
2 months
2 months -
3 months
3 Months -
6 Months
6 Months
-1 Year1-3 Years 3-5 Years
Above 5
YearsTOTAL
Cash 1,833.0 0.0 0.0 0.0 0.0 0.0 0.0 0.0 0.0 0.0 0.0 1,833.0
Balance with RBI 277.8 287.5 207.2 139.3 220.8 367.8 698.0 1,266.7 2,838.4 374.6 71.9 6,750.0
Balances with Other Banks 276.6 2,986.8 0.0 0.0 0.0 0.0 0.0 1.4 76.6 0.0 0.1 3,341.6
Investments 0.0 1.9 25.4 713.5 961.8 2,480.0 3,047.9 4,894.5 8,312.3 7,870.3 29,871.9 58,179.4
Advances (Excl NPA provn) 2,812.2 1,642.4 1,567.0 1,729.9 2,457.6 4,621.7 6,569.3 12,953.1 58,855.5 17,859.7 47,107.8 1,58,176.3
Fixed Assets 0.0 0.0 0.0 0.0 0.0 0.0 0.0 0.0 0.0 0.0 4,885.7 4,885.7
Other Assets (net) 191.0 71.9 52.5 182.5 622.7 221.9 508.6 255.0 1,123.6 1,412.7 2,655.1 7,297.7
Total 5,390.7 4,990.6 1,852.2 2,765.2 4,262.8 7,691.4 10,823.8 19,370.7 71,206.4 27,517.3 84,592.5 2,40,463.8 5 (f) Advances and Provisions: (` million)
Particulars As on
March 31, 2017
(a)Amount of NPAs (Gross) 2,542.0
i. Substandard 1,542.7
ii. Doubtful 1 232.6
iii. Doubtful 2 751.4
iv. Doubtful 3 7.1
v. Loss 8.2
(b) Net NPAs 1,244.1
(c) NPA Ratios
i. Gross NPAs to gross advances (%) 1.59%
ii. Net NPAs to Net Advances (%) 0.79%
(d) Movement of NPAs(Gross)
i. Opening balance (as on March 31, 2016) 1,973.8
ii. Additions during the year 2,619.7
iii. Reductions during the year (including write-offs) 2,051.5
iv. Closing balance 2,542.0
(e) Movement of provisions for NPAs (excluding provision on Standard Assets)
i. Opening balance(as on March 31, 2016) 969.1
ii. Provision made during the year 991.9
iii. Write-off / write-back of excess provisions 690.7
iv. Closing balance 1,270.3
(f) Amount of Non-Performing Investments -
(g) Amount of provisions held for non-performing investments -

Page 12 of 30
(h) Movement of depreciation on investments
i. Opening balance(as on March 31, 2016) 42.6
ii. Add: Provision made during the year 164.3
iii. Less: Write-off/ write-back of excess provision during the year (including depreciation utilised on the sale of securities)
165.7
iv. Closing balance 41.2
6. CREDIT RISK: Disclosures for portfolio subject to the Standardised Approach 6 (a)The Bank has used the ratings of the following domestic external credit rating agencies(arranged in alphabetical order) for the purposes of risk weighting their claims for capital adequacy purposes:
a. Brickwork Ratings India Pvt. Limited (Brickwork) b. Credit Analysis and Research Limited c. CRISIL Limited d. ICRA Limited e. India Ratings and Research Private Limited (India Ratings) and f. SME Rating Agency of India Ltd (SMERA)
International credit rating agencies (arranged in alphabetical order) for the purposes of risk weighting their claims for capital adequacy purposes where specified:
a. Fitch;
b. Moody's; and
c. Standard & Poor’s
6 (b) A description of the process used to transfer public issuer ratings onto comparable
assets in the banking book:
• Bank has used short term ratings for assets with maturity upto one year and long-term ratings for assets maturing after one year as accorded by the approved external credit rating agencies.
• Bank has not cherry picked ratings. Bank has not used one rating of a CRA (Credit Rating Agency) for one exposure and another CRA’s rating for another exposure on the same counterparty unless only one rating is available for a given exposure.
• Notwithstanding the repayable on demand condition, cash credit exposures have been subjected to Long-term rating.
• If an issuer has a long term external credit rating that warrants RW (Risk Weight) of 150%, all unrated exposures on the same issuer whether long or short is assigned the same 150% RW unless mitigated by recognised Credit Risk Mitigation (CRM) techniques.
• Bank has used only solicited rating from the recognised CRAs. In case the issuer has multiple ratings from CRAs, the Bank has a policy of choosing (if there are two or more ratings) lower rating.
• Where RW associated with the rating by a CRA for a specific investment instrument is lower than one corresponding to unrated exposure, but the Bank’s exposure is not in that instrument but some other debt, the RW for the rated exposure has been applied to
Page 13 of 30
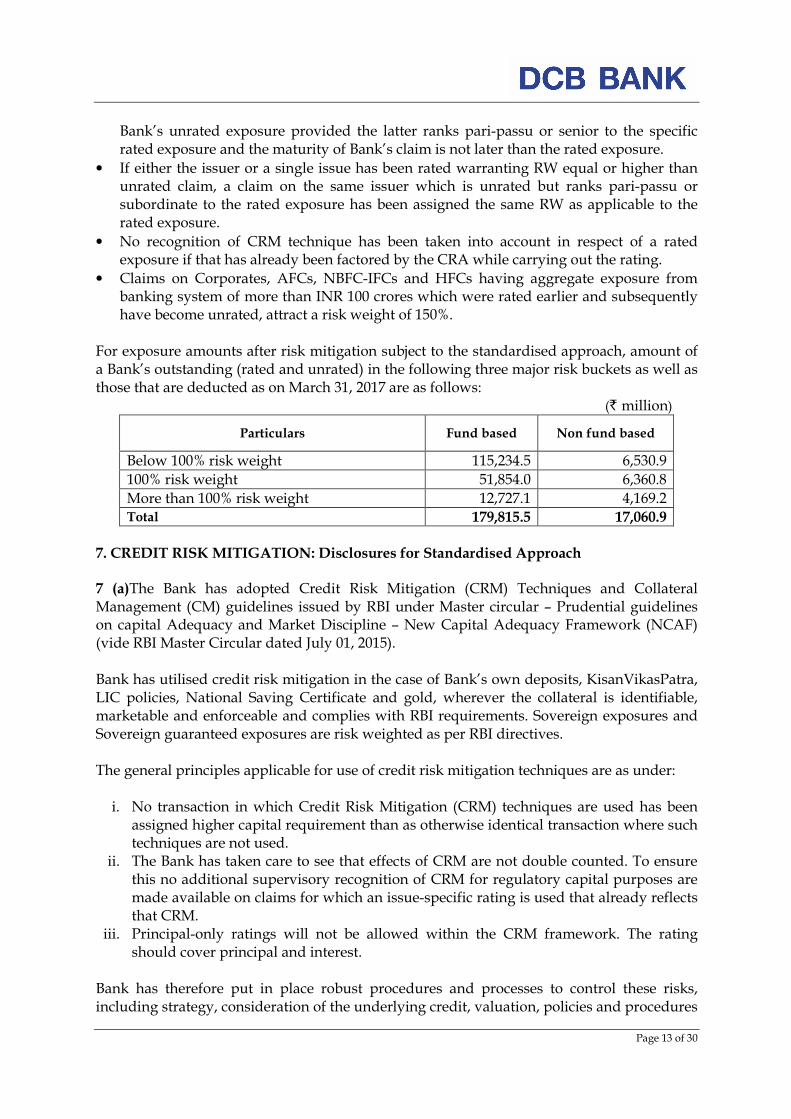
Bank’s unrated exposure provided the latter ranks pari-passu or senior to the specific rated exposure and the maturity of Bank’s claim is not later than the rated exposure.
• If either the issuer or a single issue has been rated warranting RW equal or higher than unrated claim, a claim on the same issuer which is unrated but ranks pari-passu or subordinate to the rated exposure has been assigned the same RW as applicable to the rated exposure.
• No recognition of CRM technique has been taken into account in respect of a rated exposure if that has already been factored by the CRA while carrying out the rating.
• Claims on Corporates, AFCs, NBFC-IFCs and HFCs having aggregate exposure from banking system of more than INR 100 crores which were rated earlier and subsequently have become unrated, attract a risk weight of 150%.
For exposure amounts after risk mitigation subject to the standardised approach, amount of a Bank’s outstanding (rated and unrated) in the following three major risk buckets as well as those that are deducted as on March 31, 2017 are as follows:
(` million)
Particulars Fund based Non fund based
Below 100% risk weight 115,234.5 6,530.9
100% risk weight 51,854.0 6,360.8
More than 100% risk weight 12,727.1 4,169.2 Total 179,815.5 17,060.9
7. CREDIT RISK MITIGATION: Disclosures for Standardised Approach 7 (a)The Bank has adopted Credit Risk Mitigation (CRM) Techniques and Collateral Management (CM) guidelines issued by RBI under Master circular – Prudential guidelines on capital Adequacy and Market Discipline – New Capital Adequacy Framework (NCAF) (vide RBI Master Circular dated July 01, 2015).
Bank has utilised credit risk mitigation in the case of Bank’s own deposits, KisanVikasPatra, LIC policies, National Saving Certificate and gold, wherever the collateral is identifiable, marketable and enforceable and complies with RBI requirements. Sovereign exposures and Sovereign guaranteed exposures are risk weighted as per RBI directives.
The general principles applicable for use of credit risk mitigation techniques are as under: i. No transaction in which Credit Risk Mitigation (CRM) techniques are used has been
assigned higher capital requirement than as otherwise identical transaction where such techniques are not used.
ii. The Bank has taken care to see that effects of CRM are not double counted. To ensure this no additional supervisory recognition of CRM for regulatory capital purposes are made available on claims for which an issue-specific rating is used that already reflects that CRM.
iii. Principal-only ratings will not be allowed within the CRM framework. The rating should cover principal and interest.
Bank has therefore put in place robust procedures and processes to control these risks, including strategy, consideration of the underlying credit, valuation, policies and procedures
Page 14 of 30
systems, control of roll-off risks, and management of concentration risk arising from the use of CRM techniques and its interaction with the Bank’s overall credit risk profile.
7 (b) Eligible Financial Collateral:
The following collateral instruments are eligible for recognition in the comprehensive approach: -
i. Cash (as well as certificates of deposit or comparable instruments, including fixed deposit receipts, issued by the lending bank) on deposit with the bank which is incurring the counterparty exposure.
ii. Gold: Gold would include both bullion and jewellery. However, the value of the collateralized jewellery should be arrived at after notionally converting these to 99.99 purity.
iii. Securities issued by Central and State Governments iv. KisanVikasPatra and National Savings Certificates provided no lock-in period is
operational and if they can be encashed within the holding period. v. Life insurance policies with a declared surrender value of an insurance company
which is regulated by an insurance sector regulator. vi. Debt securities rated by a chosen Credit Rating Agency in respect of which banks
should be sufficiently confident about the market liquidity where these are either: a) Attracting 100 per cent or lesser risk weight i.e., rated at least BBB(-) when issued by public sector entities and other entities (including banks and Primary Dealers); or b) Attracting 100 per cent or lesser risk weight i.e., rated at least CARE A3/ CRISIL A3/ India Ratings and Research Private Limited (India Ratings) A3/ICRA A3/Brickwork A3/ SMERA A3 for short-term debt instruments.
vii. Debt Securities not rated by a chosen Credit Rating Agency in respect of which banks should be sufficiently confident about the market liquidity where these are: a) issued by a bank; and b) listed on a recognised exchange; and c) classified as senior debt; and d) all rated issues of the same seniority by the issuing bank are rated at least BBB(-) or CARE A3/ CRISIL A3/ India Ratings and Research Private Limited (India Ratings) A3/ICRA A3/Brickwork A3/SMERA A3 by a chosen Credit Rating Agency; and e) the bank holding the securities as collateral has no information to suggest that the issue justifies a rating below BBB(-) or CARE A3/ CRISIL A3/ India Ratings and Research Private Limited (India Ratings) A3/ICRA A3/Brickwork A3/SMERA A3 (as applicable) and; f) Banks should be sufficiently confident about the market liquidity of the security.
viii. Units of Mutual Funds regulated by the securities regulator of the jurisdiction of the bank’s operation mutual funds where: a) a price for the units is publicly quoted daily i.e., where the daily NAV is
available in public domain; and b) Mutual fund is limited to investing in the instruments listed in this
paragraph. ix. Re-securitisations, irrespective of any credit ratings, are not eligible financial collateral.
Page 15 of 30
(` million)
Particular As on
March 31, 2017
Total exposure covered by eligible financial collateral after application of applicable haircuts
12,419.0
Total exposure covered by guarantees/credit derivatives -
8. SECURITIZATION EXPOSURES As per RBI guidelines on Securitization exposure, Investments by banks in securitized assets, representing loans to various categories of priority sector, except ‘others’ category, are eligible for classification under respective categories of priority sector lending (PSL) depending on the underlying assets. In the financial year 2016-17, the Bank has made investments in securitized assets by way of Pass Through Certificates (PTCs), aggregating to ` 13,872.7 million, the outstanding of this as on March 31, 2017 was ` 9,248.4 million. The following table sets forth the details of investments in Pass Through Certificates carried out by the Bank and their position as on March 31, 2017. (` million)
Year of Origination Original Investment Outstanding at March 31, 2017
2014-15 3,085.2 98.5
2015-16 949.6 30.6
2016-17 13,872.7 9,248.4
Total 17,907.5 9,377.5
9. MARKET RISK IN TRADING BOOK Market risk refers to the uncertainty of future earnings resulting from changes in interest rates, foreign exchange rates, market prices and volatilities. The Bank assumes market risk in its lending and deposit taking businesses and in its investment activities, including position taking and trading. The market risk is managed in accordance with the investment policies, which are approved by the Board. These policies ensure that operations in securities, foreign exchange and derivatives are conducted in accordance with sound and acceptable business practices and are as per the extant regulatory guidelines, laws governing transactions in financial securities and the financial environment. Market Risk in Trading Book is assessed as per the Standardised Duration approach. The capital charge for Held for Trading (HFT) and Available for Sale (AFS) portfolios is computed as per Reserve Bank of India prudential guidelines.
Page 16 of 30
Market risk management objectives: The objectives of market risk management are as follows:
• Management of liquidity
• Management of interest rate risk and exchange rate risk.
• Proper classification and valuation of investment portfolio
• Adequate and proper reporting of investments and derivative products
• Compliance with regulatory requirements Structure and organisation of the market risk management function: The Board, through Risk Management Committee, approves the policies with regard to identification, measurement and control of market risks (Interest Rate Risk and Foreign Exchange Risk) and Liquidity Risk. Market Risk department is an independent function. The Market Risk Department exercises independent control over the process of market risk management and recommends changes in processes and methodologies for measuring Market Risk. Strategies and processes: To comply with the regulatory guidelines and to have independent control groups there is clear functional separation of:
• Trading (Front office)
• Monitoring and control (Middle office) and
• Settlements (Back office) The strategy/guidelines for controlling market risk include:
• Direct involvement of experienced line management
• Stringent controls and limits
• Strict segregation of front, middle and back office duties
• Comprehensive periodical reporting of positions
• Regular independent reviews of all controls and limits
• Rigorous testing and auditing of all pricing, trading and risk management The scope and nature of risk reporting and measurement systems: Reporting: -The Bank periodically reports on the various investments and their related risk measures to the senior management and the committees of the Board. The Bank also periodically reports to its regulator in compliance with regulatory requirements. Measurement:-The Bank has devised various risk metrics for measuring market risk. These are reported to Asset Liability Management Committee by Market Risk Management Department. Some of the risk metrics adopted by the Bank for monitoring its risks are Value-at-Risk, Earnings at Risk, Modified Duration, Stop Loss limits amongst others.
Page 17 of 30
Capital requirements for market risk (` million)
Particulars As on
March 31, 2017
• Interest Rate Risk 553.7
• Foreign Exchange Risk (Including gold) 54.0
• Equity Risk 112.6
Capital requirement for Market Risk 720.3
10. OPERATIONAL RISK Operational risk is defined as the risk of loss resulting from inadequate or failed internal processes, people and systems or from external events. Operational risk includes legal risk but excludes strategic and reputation risks.
The Bank has put in place a Board approved Operational Risk Management Policy which outlines overall framework for management of Operational Risk. The Bank has identified Key Operational Risk Indicators (KORIs) across various units, which are measured, monitored regularly and reported to Operational Risk Management Committee (ORCO) on monthly basis. The Bank has a robust system of reporting Operational Risk events across various units through identified Operational Risk Officers, who are given adequate training to identify and report such events as and when they occur. The Bank has a very effective system of recording and reporting operational losses booked. The Bank also collects qualitative data on self-assessment of operational risk faced by various units through Risk Control Self-Assessment (RCSA) exercise. The Bank has implemented Periodic Risk Identification and Controls Evaluation (PRICE) system with a view to develop policy framework for identification and documented plan to mitigate various risks in the Bank. The PRICE system is expected to provide a robust overview of various risks being identified proactively that remain un-mitigated. The PRICE system is pivotal in continuous assessment of our risk and control environment and prioritise our remedial efforts based on risk/impact. The Bank manages Operational Risk by way of adopting best practices in processes as well as products. All the new and existing process are subjected to rigorous review by Management Committee for Approval of Process (MCAP), which comprises of senior management personnel with diversified experience in banking. Utmost importance is given on communication and understanding of processes at transactional level and compliance to same are monitored through effective internal audits.
The Bank understands the criticality of business continuity in the event of any undesirable / unforeseen incident and has put in place an exhaustive Business Continuity Plan (BCP) in place which is subject to periodic drills. The Bank has robust Information Technology set up with Disaster Recovery (DR) site for critical functions and backups. Further there is a strict adherence to Information Security Policy across the Bank. As per the mandate from RBI, the Bank is following the Basic Indicator Approach (BIA) for assessment of Operational Risk Capital. The Bank has taken quantitative and qualitative steps in view of moving towards advanced approaches as prescribed by RBI.
Page 18 of 30
Capital requirement for operational risk as per Basic Indicator Approach (BIA) as on March 31, 2017 is ` 1,010.3 million. 11. INTEREST RATE RISK IN BANKING BOOK Interest Rate Risk in the Banking Book (IRRBB): Interest rate risk is the potential change in Net Interest Income (NII) or Economic Value of Equity (Balance Sheet impact), caused by unexpected changes in market interest rates. Since NII or Net Interest Margin (NIM) of Bank is dependent on the movements of interest rates, any mismatches or gaps in the cash-flows on re-pricing dates exposes Bank’s NII or NIM to interest rate risk. Interest Rate Risk in Banking Book results from an unavoidable position or gap arising from Bank’s normal day to day business by holding assets and liabilities in different maturities and different re-pricing dates. Risk management framework and monitoring: The Board of the Bank, through Risk Management Committee (RMC), has overall responsibility for management of risks and it sets limits and policies for management of liquidity risk, market risk including foreign exchange, interest rate and equity risk. The Asset Liability Management Committee (ALCO), a strategic decision making body constituted by Board, headed by Managing Director and comprising of senior executives of the Bank is responsible for deciding the mix and maturity profile of the assets and liabilities, recommendation of risk policies, setting up of prudential limits to manage the risks and ensuring compliance with the limits set by the Board. The ALM policy of the Bank includes the prudential limits on interest rate risk, liquidity risk, foreign exchange risk and equity risk. Market Risk Management Department is responsible for monitoring the limits laid down in the ALM Policy through various reports. These reports are prepared at regular intervals and exceptions/deviations are reported to the ALCO/RMC, as may be required by the ALM policy. Risk measurement and reporting framework: As a part of its regular activities, ALCO manages the impact of the interest rate risk in banking book, through various limits, reports and tools such as interest rate sensitive gaps, Earnings at risk analysis, duration gap analysis, stress testing, etc. detailed as follows: Interest rate sensitivity gap: The interest rate gap risk, at any given date, is the risk arising from the mismatches in the assets and liabilities over the different time intervals. These mismatches or gaps are arrived at after matching rate sensitive assets and rate sensitive liabilities in the particular time bucket taking into account all assets and liabilities (including off Balance Sheet exposure). The rate sensitive assets and liabilities are grouped in the buckets as per the residual maturity or re-pricing date, whichever is earlier and is reported on monthly basis. The gap indicates whether net interest income is positively or negatively impacted by a change in interest rates and the magnitude of the gap approximates the change in net interest income for any given interest rate shift. Limits are fixed on individual gaps.
Page 19 of 30
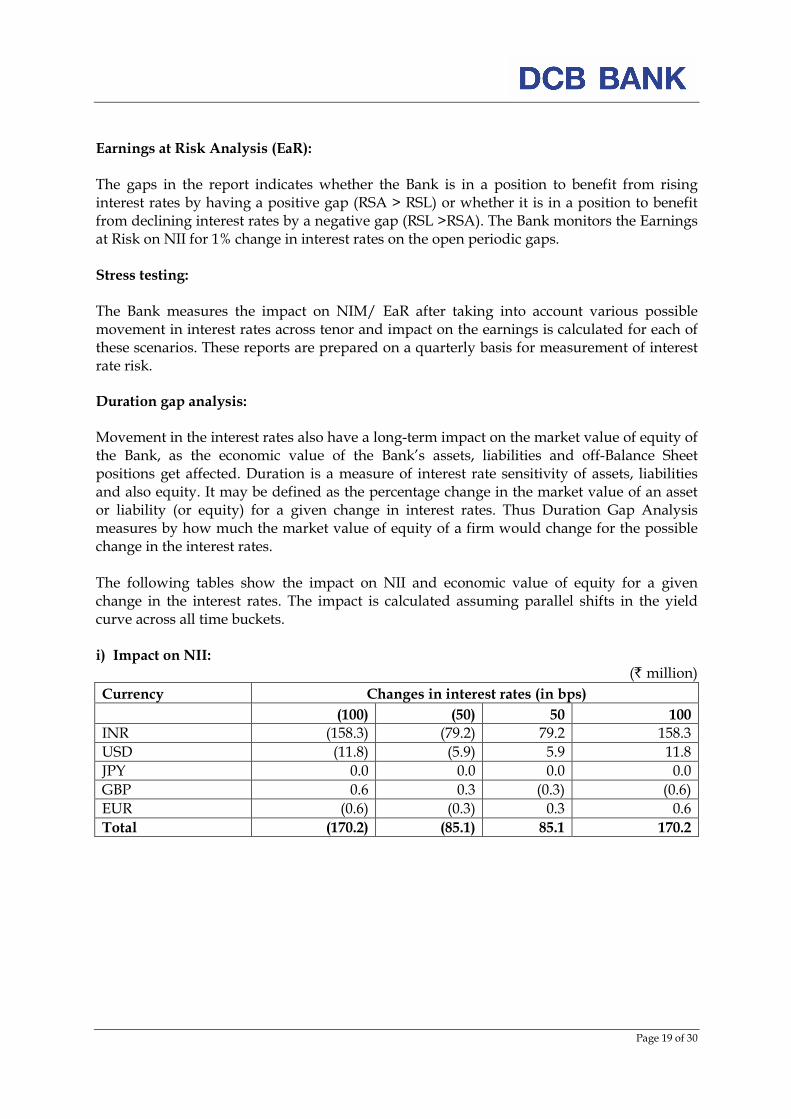
Earnings at Risk Analysis (EaR): The gaps in the report indicates whether the Bank is in a position to benefit from rising interest rates by having a positive gap (RSA > RSL) or whether it is in a position to benefit from declining interest rates by a negative gap (RSL >RSA). The Bank monitors the Earnings at Risk on NII for 1% change in interest rates on the open periodic gaps. Stress testing: The Bank measures the impact on NIM/ EaR after taking into account various possible movement in interest rates across tenor and impact on the earnings is calculated for each of these scenarios. These reports are prepared on a quarterly basis for measurement of interest rate risk. Duration gap analysis: Movement in the interest rates also have a long-term impact on the market value of equity of the Bank, as the economic value of the Bank’s assets, liabilities and off-Balance Sheet positions get affected. Duration is a measure of interest rate sensitivity of assets, liabilities and also equity. It may be defined as the percentage change in the market value of an asset or liability (or equity) for a given change in interest rates. Thus Duration Gap Analysis measures by how much the market value of equity of a firm would change for the possible change in the interest rates. The following tables show the impact on NII and economic value of equity for a given change in the interest rates. The impact is calculated assuming parallel shifts in the yield curve across all time buckets. i) Impact on NII:
(` million)
Currency Changes in interest rates (in bps)
(100) (50) 50 100
INR (158.3) (79.2) 79.2 158.3
USD (11.8) (5.9) 5.9 11.8
JPY 0.0 0.0 0.0 0.0
GBP 0.6 0.3 (0.3) (0.6)
EUR (0.6) (0.3) 0.3 0.6
Total (170.2) (85.1) 85.1 170.2

Page 20 of 30
ii) Impact on economic value of equity: (` million)
Changes in interest rates (in bps)
Currency (100) (50) 50 100
INR 2,148.1 1,074.0 (1,074.0) (2,148.1)
* No major exposure in foreign currencies
12. General disclosures for exposures related to counterparty credit risk Counterparty exposure
Counterparty credit risk in case of derivative contracts arises from the forward contracts.
The subsequent credit risk exposures depend on the value of underlying market factors (e.g.,
interest rates and foreign exchange rates), which can be volatile and uncertain in nature. The
Bank does not enter into derivative transactions other than forward transactions.
Credit limits
The credit limit for counterparty bank is fixed based on their financial performance as per
the latest audited financials. Various financial parameters such as NPA ratios, liquidity
ratios, etc are taken into consideration while assigning the limit. Credit exposure is
monitored daily to ensure it does not exceed the approved credit limit. These credit limits
are set on the notional exposure basis.
Credit exposures on forward contracts
The Bank enters into the forward contracts in the normal course of business for positioning
and arbitrage purposes, as well as for our own risk management needs, including mitigation
of interest rate and foreign currency risk. Derivative exposures are calculated according to
the current exposures method.
Credit exposure as on March 31, 2017 (` million)
Notional Amount
Gross positive fair value of contracts
Potential future exposure
Total credit
exposure
Forward contracts 11,258.5 57.1 225.2 282.3

Page 21 of 30
DF-11: Composition of Capital (` million)
Ref No
1 Directly issued qualifying common share capital plus related stock surplus (share
premium) 12,826.13 a=a1+a2
2 Retained earnings 2,740.70 b
3 Accumulated other comprehensive income (and other reserves) 5,005.64 c=c1+c2+c3+c4-c5
4 Directly issued capital subject to phase out from CET1 (only applicable to non-joint stock
companies ) 0.00
5 Common share capital issued by subsidiaries and held by third parties (amount
allowed in group CET1) 0.00
6 Common Equity Tier 1 capital before regulatory adjustments 20,572.47
7 Prudential valuation adjustments 0.00
8 Goodwill (net of related tax liability) 0.00
9 Intangibles (net of related tax liability) 52.07 d
10 Deferred tax assets 0.00
11 Cash-flow hedge reserve 0.00
12 Shortfall of provisions to expected losses 0.00
13 Securitisation gain on sale 0.00
14 Gains and losses due to changes in own credit risk on fair valued liabilities 0.00
15 Defined-benefit pension fund net assets 0.00
16 Investments in own shares (if not already netted off paid-up capital on reported balance
sheet) 0.00
17 Reciprocal cross-holdings in common equity 0.00
18Investments in the capital of banking, financial and insurance entities that are outside
the scope of regulatory consolidation, net of eligible short positions, where the bank
does not own more than 10% of the issued share capital (amount above 10% threshold)0.00
19 Significant investments in the common stock of banking, financial and insurance
entities that are outside the scope of regulatory consolidation, net of eligible short
positions (amount above 10% threshold) 0.00
20 Mortgage servicing rights (amount above 10% threshold) 0.00
21 Deferred tax assets arising from temporary differences (amount above 10% threshold,
net of related tax liability) 0.00
22 Amount exceeding the 15% threshold 0.00
23 of which: significant investments in the common stock of financial entities 0.00
24 of which: mortgage servicing rights 0.00
25 of which: deferred tax assets arising from temporary differences 0.00
26 National specific regulatory adjustments (26a+26b+26c+26d) 0.00
26a of which: Investments in the equity capital of unconsolidated insurance subsidiaries 0.00
26b of which: Investments in the equity capital of unconsolidated non-financial
subsidiaries 0.00
26c of which: Shortfall in the equity capital of majority owned financial entities which have
not been consolidated with the bank 0.00
26d of which: Unamortised pension funds expenditures 0.00
27 Regulatory adjustments applied to Common Equity Tier 1 due to insufficient Additional
Tier 1 and Tier 2 to cover deductions 0.00
28 Total regulatory adjustments to Common equity Tier 1 52.07
29 Common Equity Tier 1 capital (CET1) 20,520.40
Basel III common disclosure template to be used from March 31, 2017
Common Equity Tier 1 capital: instruments and reserves
Common Equity Tier 1 capital: regulatory adjustments
Page 22 of 30
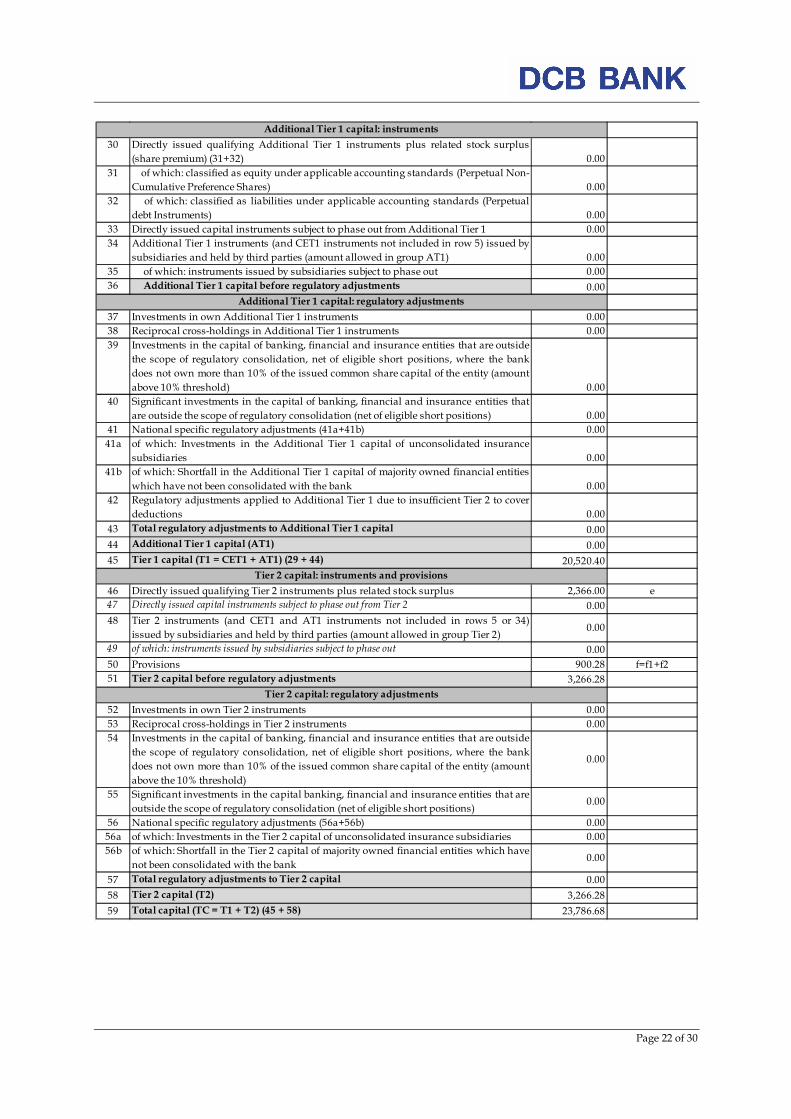
30 Directly issued qualifying Additional Tier 1 instruments plus related stock surplus
(share premium) (31+32) 0.00
31 of which: classified as equity under applicable accounting standards (Perpetual Non-
Cumulative Preference Shares) 0.00
32 of which: classified as liabilities under applicable accounting standards (Perpetual
debt Instruments) 0.00
33 Directly issued capital instruments subject to phase out from Additional Tier 1 0.00
34 Additional Tier 1 instruments (and CET1 instruments not included in row 5) issued by
subsidiaries and held by third parties (amount allowed in group AT1) 0.00
35 of which: instruments issued by subsidiaries subject to phase out 0.00
36 Additional Tier 1 capital before regulatory adjustments 0.00
37 Investments in own Additional Tier 1 instruments 0.00
38 Reciprocal cross-holdings in Additional Tier 1 instruments 0.00
39 Investments in the capital of banking, financial and insurance entities that are outside
the scope of regulatory consolidation, net of eligible short positions, where the bank
does not own more than 10% of the issued common share capital of the entity (amount
above 10% threshold) 0.00
40 Significant investments in the capital of banking, financial and insurance entities that
are outside the scope of regulatory consolidation (net of eligible short positions) 0.00
41 National specific regulatory adjustments (41a+41b) 0.00
41a of which: Investments in the Additional Tier 1 capital of unconsolidated insurance
subsidiaries 0.00
41b of which: Shortfall in the Additional Tier 1 capital of majority owned financial entities
which have not been consolidated with the bank 0.00
42 Regulatory adjustments applied to Additional Tier 1 due to insufficient Tier 2 to cover
deductions 0.00
43 Total regulatory adjustments to Additional Tier 1 capital 0.00
44 Additional Tier 1 capital (AT1) 0.00
45 Tier 1 capital (T1 = CET1 + AT1) (29 + 44) 20,520.40
46 Directly issued qualifying Tier 2 instruments plus related stock surplus 2,366.00 e
47 Directly issued capital instruments subject to phase out from Tier 2 0.00
48 Tier 2 instruments (and CET1 and AT1 instruments not included in rows 5 or 34)
issued by subsidiaries and held by third parties (amount allowed in group Tier 2)0.00
49 of which: instruments issued by subsidiaries subject to phase out 0.00
50 Provisions 900.28 f=f1+f2
51 Tier 2 capital before regulatory adjustments 3,266.28
52 Investments in own Tier 2 instruments 0.00
53 Reciprocal cross-holdings in Tier 2 instruments 0.00
54 Investments in the capital of banking, financial and insurance entities that are outside
the scope of regulatory consolidation, net of eligible short positions, where the bank
does not own more than 10% of the issued common share capital of the entity (amount
above the 10% threshold)
0.00
55 Significant investments in the capital banking, financial and insurance entities that are
outside the scope of regulatory consolidation (net of eligible short positions)0.00
56 National specific regulatory adjustments (56a+56b) 0.00
56a of which: Investments in the Tier 2 capital of unconsolidated insurance subsidiaries 0.00
56b of which: Shortfall in the Tier 2 capital of majority owned financial entities which have
not been consolidated with the bank0.00
57 Total regulatory adjustments to Tier 2 capital 0.00
58 Tier 2 capital (T2) 3,266.28
59 Total capital (TC = T1 + T2) (45 + 58) 23,786.68
Additional Tier 1 capital: instruments
Additional Tier 1 capital: regulatory adjustments
Tier 2 capital: instruments and provisions
Tier 2 capital: regulatory adjustments
Page 23 of 30
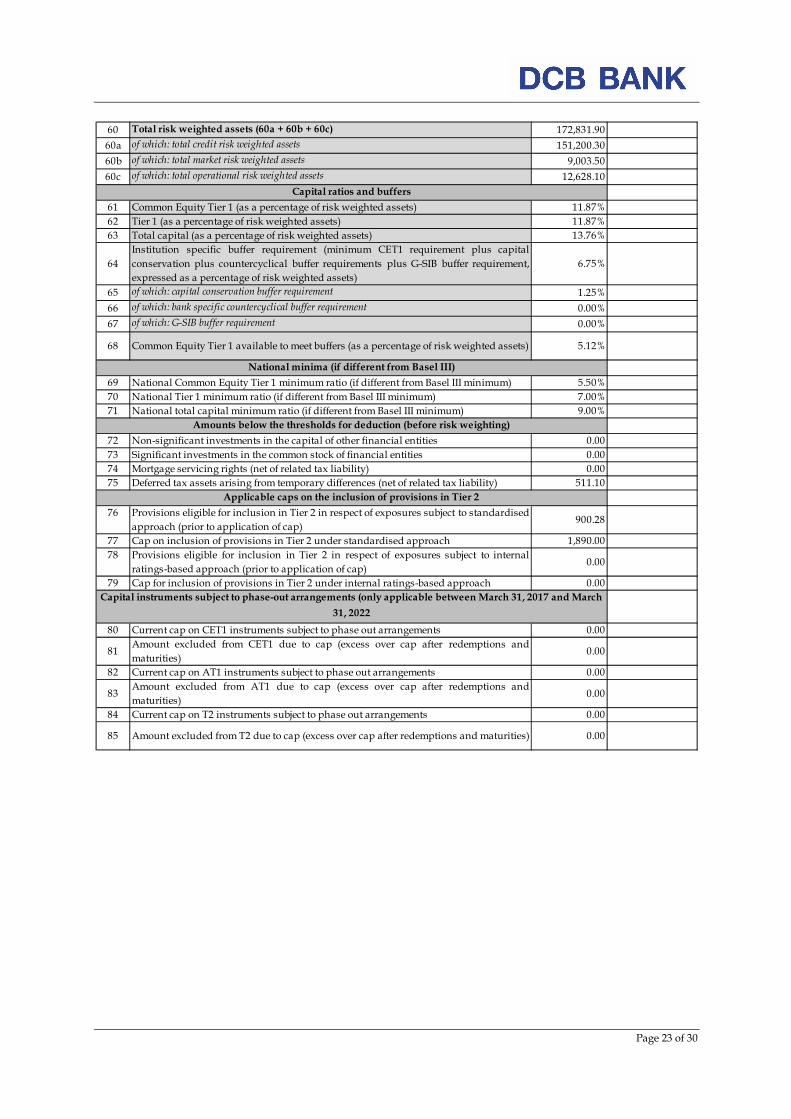
60 Total risk weighted assets (60a + 60b + 60c) 172,831.90
60a of which: total credit risk weighted assets 151,200.30
60b of which: total market risk weighted assets 9,003.50
60c of which: total operational risk weighted assets 12,628.10
61 Common Equity Tier 1 (as a percentage of risk weighted assets) 11.87%
62 Tier 1 (as a percentage of risk weighted assets) 11.87%
63 Total capital (as a percentage of risk weighted assets) 13.76%
64
Institution specific buffer requirement (minimum CET1 requirement plus capital
conservation plus countercyclical buffer requirements plus G-SIB buffer requirement,
expressed as a percentage of risk weighted assets)
6.75%
65 of which: capital conservation buffer requirement 1.25%
66 of which: bank specific countercyclical buffer requirement 0.00%
67 of which: G-SIB buffer requirement 0.00%
68 Common Equity Tier 1 available to meet buffers (as a percentage of risk weighted assets) 5.12%
69 National Common Equity Tier 1 minimum ratio (if different from Basel III minimum) 5.50%
70 National Tier 1 minimum ratio (if different from Basel III minimum) 7.00%
71 National total capital minimum ratio (if different from Basel III minimum) 9.00%
72 Non-significant investments in the capital of other financial entities 0.00
73 Significant investments in the common stock of financial entities 0.00
74 Mortgage servicing rights (net of related tax liability) 0.00
75 Deferred tax assets arising from temporary differences (net of related tax liability) 511.10
76 Provisions eligible for inclusion in Tier 2 in respect of exposures subject to standardised
approach (prior to application of cap)900.28
77 Cap on inclusion of provisions in Tier 2 under standardised approach 1,890.00
78 Provisions eligible for inclusion in Tier 2 in respect of exposures subject to internal
ratings-based approach (prior to application of cap)0.00
79 Cap for inclusion of provisions in Tier 2 under internal ratings-based approach 0.00
80 Current cap on CET1 instruments subject to phase out arrangements 0.00
81Amount excluded from CET1 due to cap (excess over cap after redemptions and
maturities)0.00
82 Current cap on AT1 instruments subject to phase out arrangements 0.00
83Amount excluded from AT1 due to cap (excess over cap after redemptions and
maturities)0.00
84 Current cap on T2 instruments subject to phase out arrangements 0.00
85 Amount excluded from T2 due to cap (excess over cap after redemptions and maturities) 0.00
Amounts below the thresholds for deduction (before risk weighting)
Applicable caps on the inclusion of provisions in Tier 2
Capital instruments subject to phase-out arrangements (only applicable between March 31, 2017 and March
31, 2022
Capital ratios and buffers
National minima (if different from Basel III)
Page 24 of 30
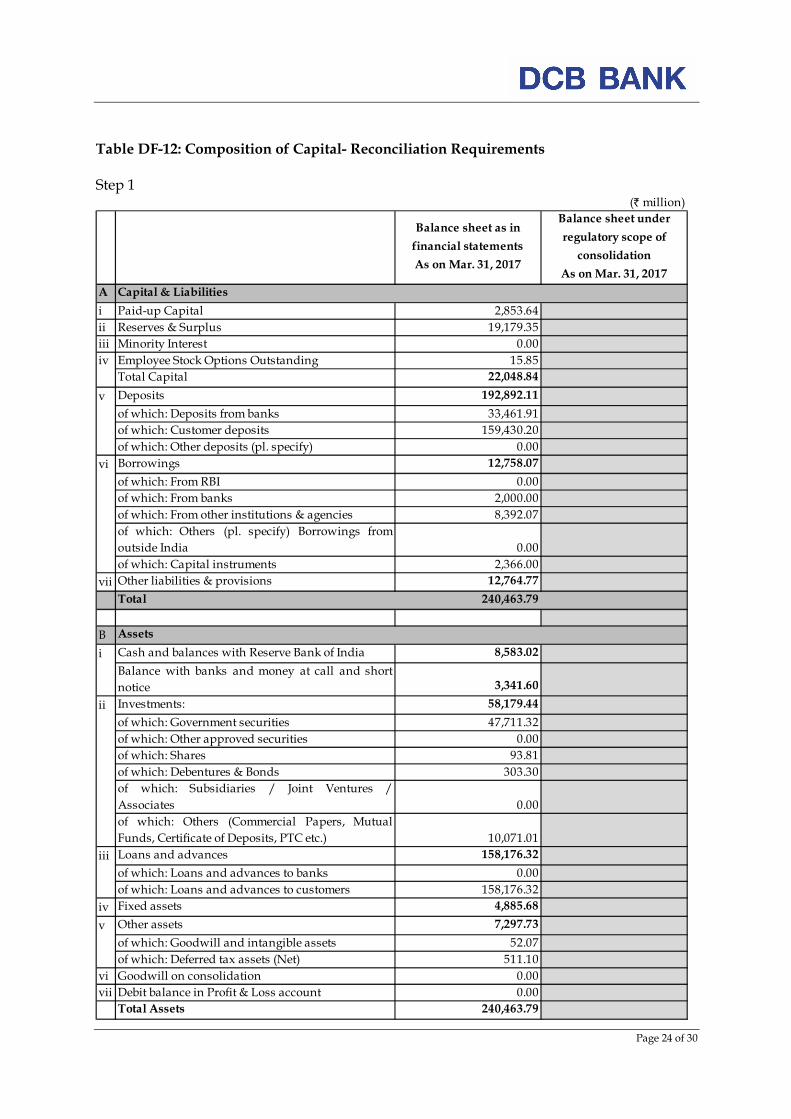
Table DF-12: Composition of Capital- Reconciliation Requirements Step 1
(` million)
Balance sheet as in
financial statements
As on Mar. 31, 2017
Balance sheet under
regulatory scope of
consolidation
As on Mar. 31, 2017
A Capital & Liabilities
i Paid-up Capital 2,853.64
ii Reserves & Surplus 19,179.35
iii Minority Interest 0.00
iv Employee Stock Options Outstanding 15.85
Total Capital 22,048.84
v Deposits 192,892.11
of which: Deposits from banks 33,461.91
of which: Customer deposits 159,430.20
of which: Other deposits (pl. specify) 0.00
vi Borrowings 12,758.07
of which: From RBI 0.00
of which: From banks 2,000.00
of which: From other institutions & agencies 8,392.07
of which: Others (pl. specify) Borrowings from
outside India 0.00
of which: Capital instruments 2,366.00
vii Other liabilities & provisions 12,764.77
Total 240,463.79
B Assets
i Cash and balances with Reserve Bank of India 8,583.02
Balance with banks and money at call and short
notice 3,341.60
ii Investments: 58,179.44
of which: Government securities 47,711.32
of which: Other approved securities 0.00
of which: Shares 93.81
of which: Debentures & Bonds 303.30
of which: Subsidiaries / Joint Ventures /
Associates 0.00
of which: Others (Commercial Papers, Mutual
Funds, Certificate of Deposits, PTC etc.) 10,071.01
iii Loans and advances 158,176.32
of which: Loans and advances to banks 0.00
of which: Loans and advances to customers 158,176.32
iv Fixed assets 4,885.68
v Other assets 7,297.73
of which: Goodwill and intangible assets 52.07
of which: Deferred tax assets (Net) 511.10
vi Goodwill on consolidation 0.00
vii Debit balance in Profit & Loss account 0.00
Total Assets 240,463.79
Page 25 of 30
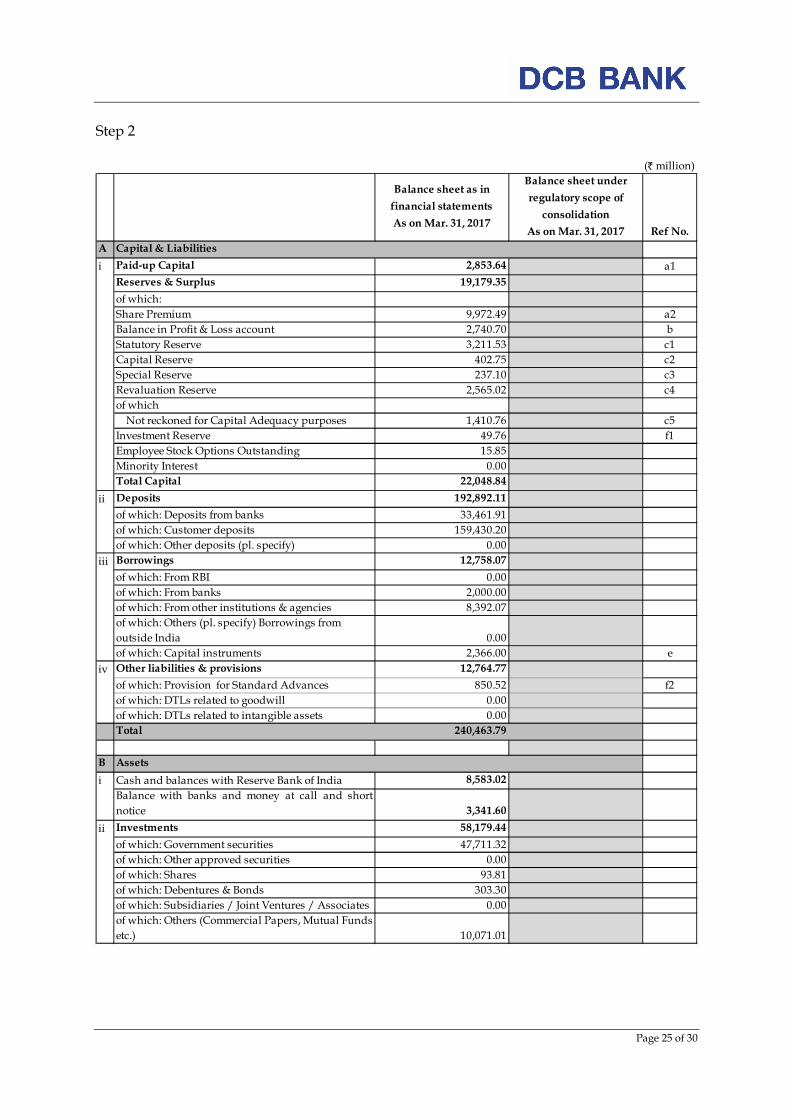
Step 2
(` million)
Balance sheet as in
financial statements
As on Mar. 31, 2017
Balance sheet under
regulatory scope of
consolidation
As on Mar. 31, 2017 Ref No.
A Capital & Liabilities
i Paid-up Capital 2,853.64 a1
Reserves & Surplus 19,179.35
of which:
Share Premium 9,972.49 a2
Balance in Profit & Loss account 2,740.70 b
Statutory Reserve 3,211.53 c1
Capital Reserve 402.75 c2
Special Reserve 237.10 c3
Revaluation Reserve 2,565.02 c4
of which
Not reckoned for Capital Adequacy purposes 1,410.76 c5
Investment Reserve 49.76 f1
Employee Stock Options Outstanding 15.85
Minority Interest 0.00
Total Capital 22,048.84
ii Deposits 192,892.11
of which: Deposits from banks 33,461.91
of which: Customer deposits 159,430.20
of which: Other deposits (pl. specify) 0.00
iii Borrowings 12,758.07
of which: From RBI 0.00
of which: From banks 2,000.00
of which: From other institutions & agencies 8,392.07
of which: Others (pl. specify) Borrowings from
outside India 0.00
of which: Capital instruments 2,366.00 e
iv Other liabilities & provisions 12,764.77
of which: Provision for Standard Advances 850.52 f2
of which: DTLs related to goodwill 0.00
of which: DTLs related to intangible assets 0.00
Total 240,463.79
B Assets
i Cash and balances with Reserve Bank of India 8,583.02
Balance with banks and money at call and short
notice 3,341.60
ii Investments 58,179.44
of which: Government securities 47,711.32
of which: Other approved securities 0.00
of which: Shares 93.81
of which: Debentures & Bonds 303.30
of which: Subsidiaries / Joint Ventures / Associates 0.00
of which: Others (Commercial Papers, Mutual Funds
etc.) 10,071.01

Page 26 of 30
iii Loans and advances 158,176.32
of which: Loans and advances to banks 0.00
of which: Loans and advances to customers 158,176.32
iv Fixed assets 4,885.68
v Other assets 7,297.73
of which: Goodwill and intangible assets Out of
which:
Goodwill 0.00
Other intangibles (excluding MSRs) 52.07 d
Deferred tax assets (Net) 511.10
vi Goodwill on consolidation 0.00
Total Assets 240,463.79 Step 3
(` million)
Component of
regulatory capital
reported by bank
Source based on reference
numbers/letters of the balance
sheet under the regulatory
scope of consolidation from
step 2
1
Directly issued qualifying common share (and
equivalent for non-joint stock companies) capital plus
related stock surplus 12,826.13 a1+a2
2 Retained earnings 2,740.70 b
3Accumulated other comprehensive income (and other
reserves) 5,005.64 c1+c2+c3+c4-c5
4Directly issued capital subject to phase out from CET1
(only applicable to non-joint stock companies) 0.00
5Common share capital issued by subsidiaries and held
by third parties (amount allowed in group CET1) 0.00
6Common Equity Tier 1 capital before regulatory
adjustments 20,572.47
7 Prudential valuation adjustments 0.00
8 Goodwill (net of related tax liability) 0.00
Common Equity Tier 1 capital: instruments and reserves
Page 27 of 30
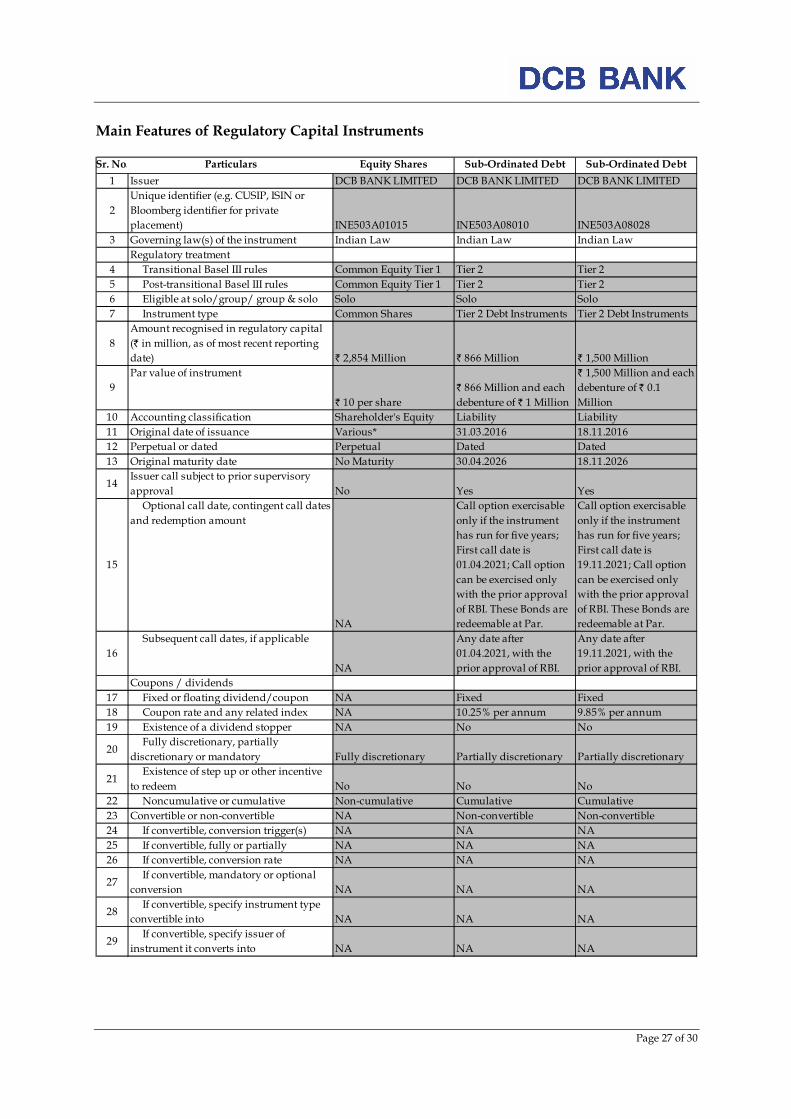
Main Features of Regulatory Capital Instruments Sr. No. Particulars Equity Shares Sub-Ordinated Debt Sub-Ordinated Debt
1 Issuer DCB BANK LIMITED DCB BANK LIMITED DCB BANK LIMITED
2
Unique identifier (e.g. CUSIP, ISIN or
Bloomberg identifier for private
placement) INE503A01015 INE503A08010 INE503A08028
3 Governing law(s) of the instrument Indian Law Indian Law Indian Law
Regulatory treatment
4 Transitional Basel III rules Common Equity Tier 1 Tier 2 Tier 2
5 Post-transitional Basel III rules Common Equity Tier 1 Tier 2 Tier 2
6 Eligible at solo/group/ group & solo Solo Solo Solo
7 Instrument type Common Shares Tier 2 Debt Instruments Tier 2 Debt Instruments
8
Amount recognised in regulatory capital
(` in million, as of most recent reporting
date) ` 2,854 Million ` 866 Million ` 1,500 Million
9
Par value of instrument
` 10 per share
` 866 Million and each
debenture of ` 1 Million
` 1,500 Million and each
debenture of ` 0.1
Million
10 Accounting classification Shareholder's Equity Liability Liability
11 Original date of issuance Various* 31.03.2016 18.11.2016
12 Perpetual or dated Perpetual Dated Dated
13 Original maturity date No Maturity 30.04.2026 18.11.2026
14Issuer call subject to prior supervisory
approval No Yes Yes
15
Optional call date, contingent call dates
and redemption amount
NA
Call option exercisable
only if the instrument
has run for five years;
First call date is
01.04.2021; Call option
can be exercised only
with the prior approval
of RBI. These Bonds are
redeemable at Par.
Call option exercisable
only if the instrument
has run for five years;
First call date is
19.11.2021; Call option
can be exercised only
with the prior approval
of RBI. These Bonds are
redeemable at Par.
16
Subsequent call dates, if applicable
NA
Any date after
01.04.2021, with the
prior approval of RBI.
Any date after
19.11.2021, with the
prior approval of RBI.
Coupons / dividends
17 Fixed or floating dividend/coupon NA Fixed Fixed
18 Coupon rate and any related index NA 10.25% per annum 9.85% per annum
19 Existence of a dividend stopper NA No No
20 Fully discretionary, partially
discretionary or mandatory Fully discretionary Partially discretionary Partially discretionary
21 Existence of step up or other incentive
to redeem No No No
22 Noncumulative or cumulative Non-cumulative Cumulative Cumulative
23 Convertible or non-convertible NA Non-convertible Non-convertible
24 If convertible, conversion trigger(s) NA NA NA
25 If convertible, fully or partially NA NA NA
26 If convertible, conversion rate NA NA NA
27 If convertible, mandatory or optional
conversion NA NA NA
28 If convertible, specify instrument type
convertible into NA NA NA
29 If convertible, specify issuer of
instrument it converts into NA NA NA
Page 28 of 30
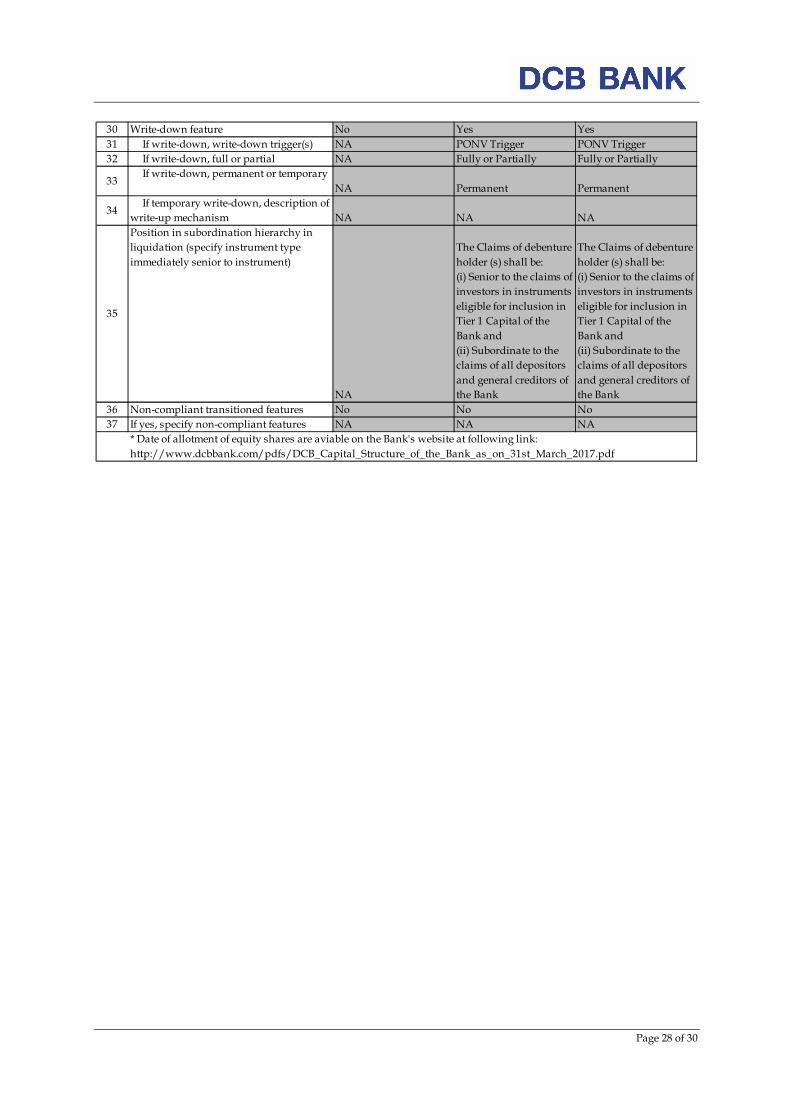
30 Write-down feature No Yes Yes
31 If write-down, write-down trigger(s) NA PONV Trigger PONV Trigger
32 If write-down, full or partial NA Fully or Partially Fully or Partially
33 If write-down, permanent or temporary
NA Permanent Permanent
34 If temporary write-down, description of
write-up mechanism NA NA NA
35
Position in subordination hierarchy in
liquidation (specify instrument type
immediately senior to instrument)
NA
The Claims of debenture
holder (s) shall be:
(i) Senior to the claims of
investors in instruments
eligible for inclusion in
Tier 1 Capital of the
Bank and
(ii) Subordinate to the
claims of all depositors
and general creditors of
the Bank
The Claims of debenture
holder (s) shall be:
(i) Senior to the claims of
investors in instruments
eligible for inclusion in
Tier 1 Capital of the
Bank and
(ii) Subordinate to the
claims of all depositors
and general creditors of
the Bank
36 Non-compliant transitioned features No No No
37 If yes, specify non-compliant features NA NA NA
* Date of allotment of equity shares are aviable on the Bank's website at following link:
http://www.dcbbank.com/pdfs/DCB_Capital_Structure_of_the_Bank_as_on_31st_March_2017.pdf
Page 29 of 30
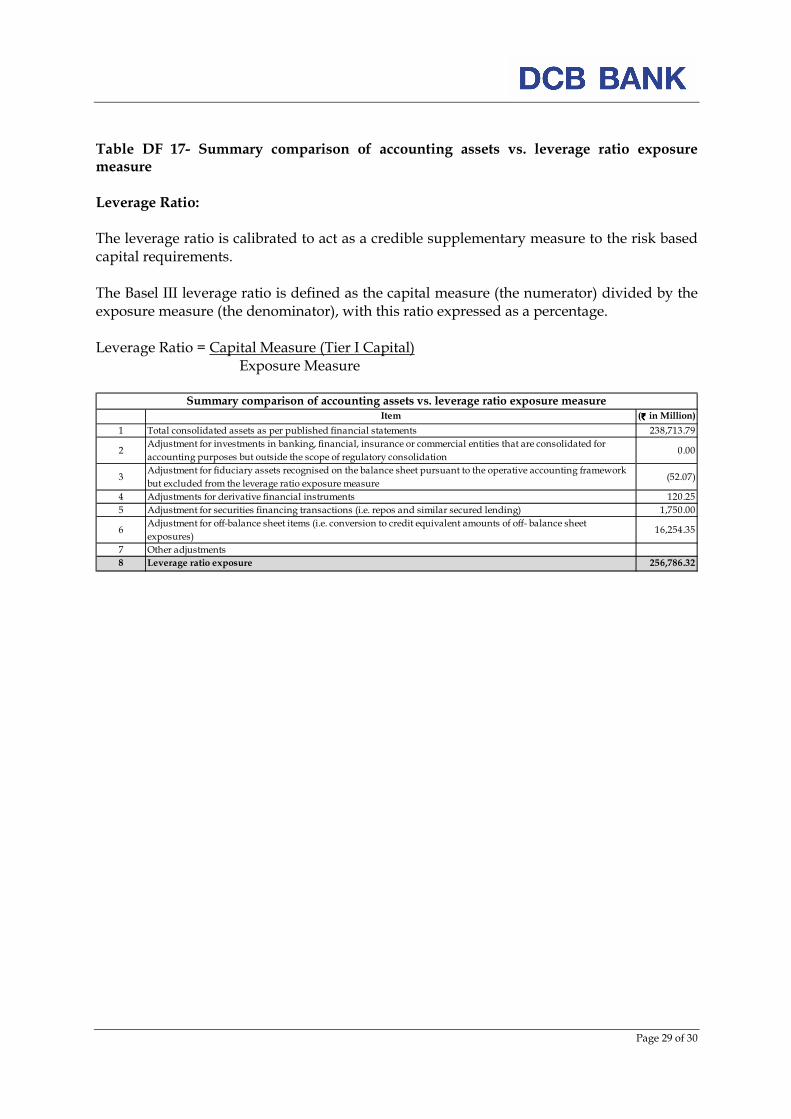
Table DF 17- Summary comparison of accounting assets vs. leverage ratio exposure measure Leverage Ratio: The leverage ratio is calibrated to act as a credible supplementary measure to the risk based capital requirements. The Basel III leverage ratio is defined as the capital measure (the numerator) divided by the exposure measure (the denominator), with this ratio expressed as a percentage. Leverage Ratio = Capital Measure (Tier I Capital)
Exposure Measure
Item (`̀̀̀ in Million)
1 Total consolidated assets as per published financial statements 238,713.79
2Adjustment for investments in banking, financial, insurance or commercial entities that are consolidated for
accounting purposes but outside the scope of regulatory consolidation0.00
3Adjustment for fiduciary assets recognised on the balance sheet pursuant to the operative accounting framework
but excluded from the leverage ratio exposure measure(52.07)
4 Adjustments for derivative financial instruments 120.25
5 Adjustment for securities financing transactions (i.e. repos and similar secured lending) 1,750.00
6Adjustment for off-balance sheet items (i.e. conversion to credit equivalent amounts of off- balance sheet
exposures)16,254.35
7 Other adjustments
8 Leverage ratio exposure 256,786.32
Summary comparison of accounting assets vs. leverage ratio exposure measure
Page 30 of 30
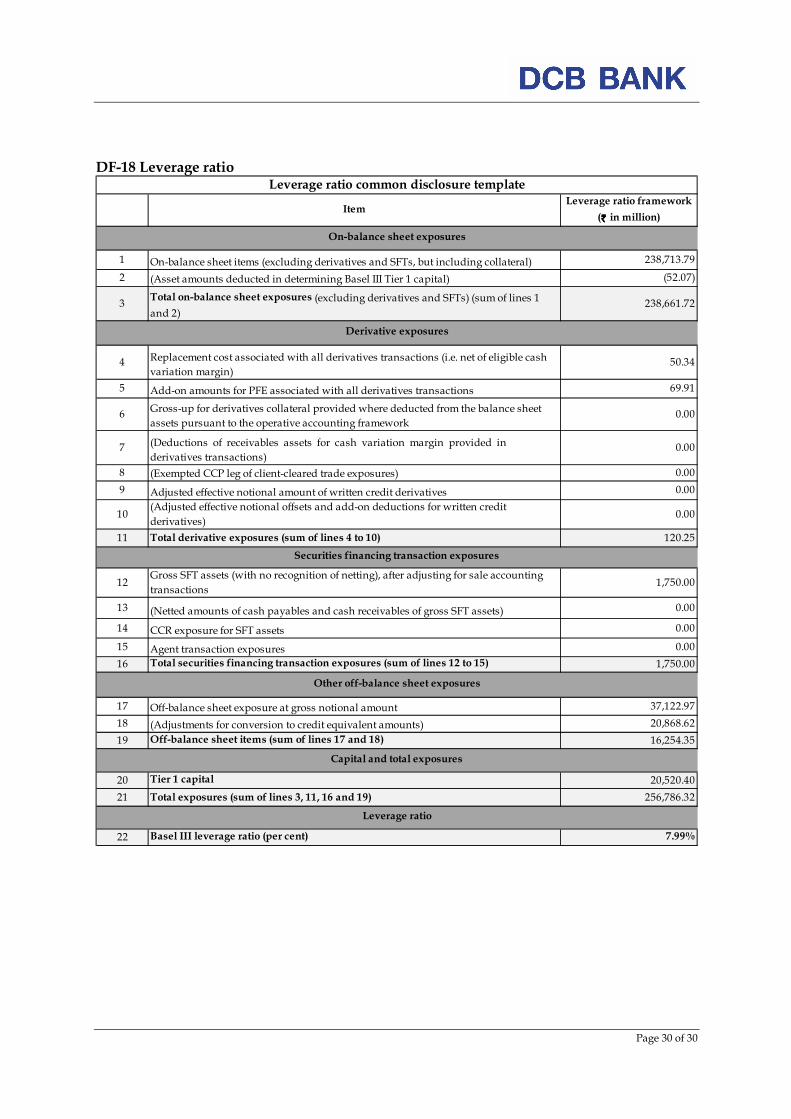
DF-18 Leverage ratio
ItemLeverage ratio framework
(`̀̀̀ in million)
1 On-balance sheet items (excluding derivatives and SFTs, but including collateral) 238,713.79
2 (Asset amounts deducted in determining Basel III Tier 1 capital) (52.07)
3Total on-balance sheet exposures (excluding derivatives and SFTs) (sum of lines 1
and 2)238,661.72
4 Replacement cost associated with all derivatives transactions (i.e. net of eligible cash
variation margin)50.34
5 Add-on amounts for PFE associated with all derivatives transactions 69.91
6Gross-up for derivatives collateral provided where deducted from the balance sheet
assets pursuant to the operative accounting framework0.00
7 (Deductions of receivables assets for cash variation margin provided in
derivatives transactions)0.00
8 (Exempted CCP leg of client-cleared trade exposures) 0.00
9 Adjusted effective notional amount of written credit derivatives 0.00
10(Adjusted effective notional offsets and add-on deductions for written credit
derivatives)0.00
11 Total derivative exposures (sum of lines 4 to 10) 120.25
12Gross SFT assets (with no recognition of netting), after adjusting for sale accounting
transactions1,750.00
13 (Netted amounts of cash payables and cash receivables of gross SFT assets) 0.00
14 CCR exposure for SFT assets 0.00
15 Agent transaction exposures 0.00
16 Total securities financing transaction exposures (sum of lines 12 to 15) 1,750.00
17 Off-balance sheet exposure at gross notional amount 37,122.97
18 (Adjustments for conversion to credit equivalent amounts) 20,868.62
19 Off-balance sheet items (sum of lines 17 and 18) 16,254.35
20 Tier 1 capital 20,520.40
21 Total exposures (sum of lines 3, 11, 16 and 19) 256,786.32
22 Basel III leverage ratio (per cent) 7.99%
Leverage ratio common disclosure template
Capital and total exposures
Leverage ratio
On-balance sheet exposures
Derivative exposures
Securities financing transaction exposures
Other off-balance sheet exposures